
In this educational article, we’ll review the fourth rule defined by Glenn Neely for the preliminary wave analysis. This rule, by its nature and context, it is likely that correspond to a corrective structure.
The Fourth Rule
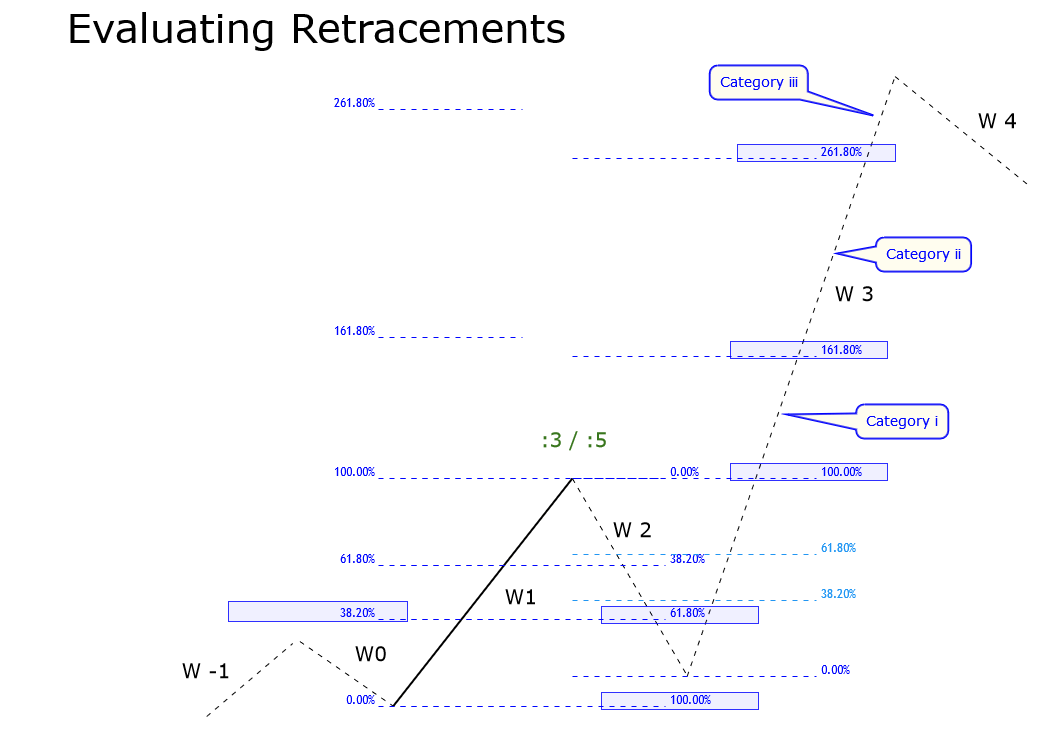
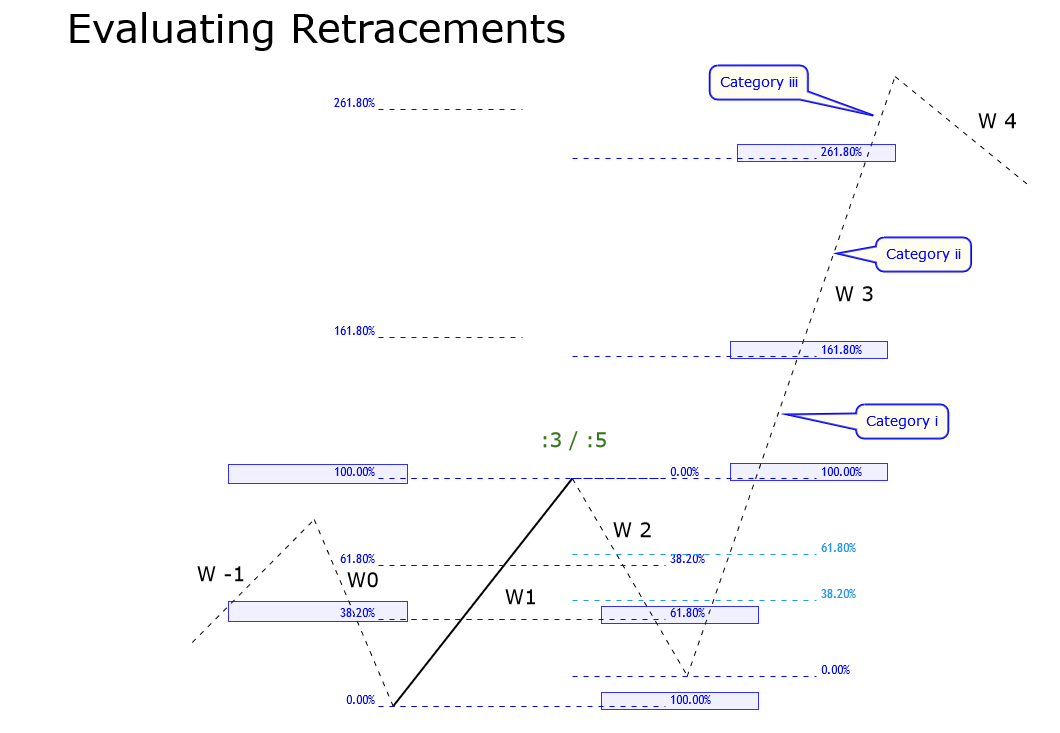
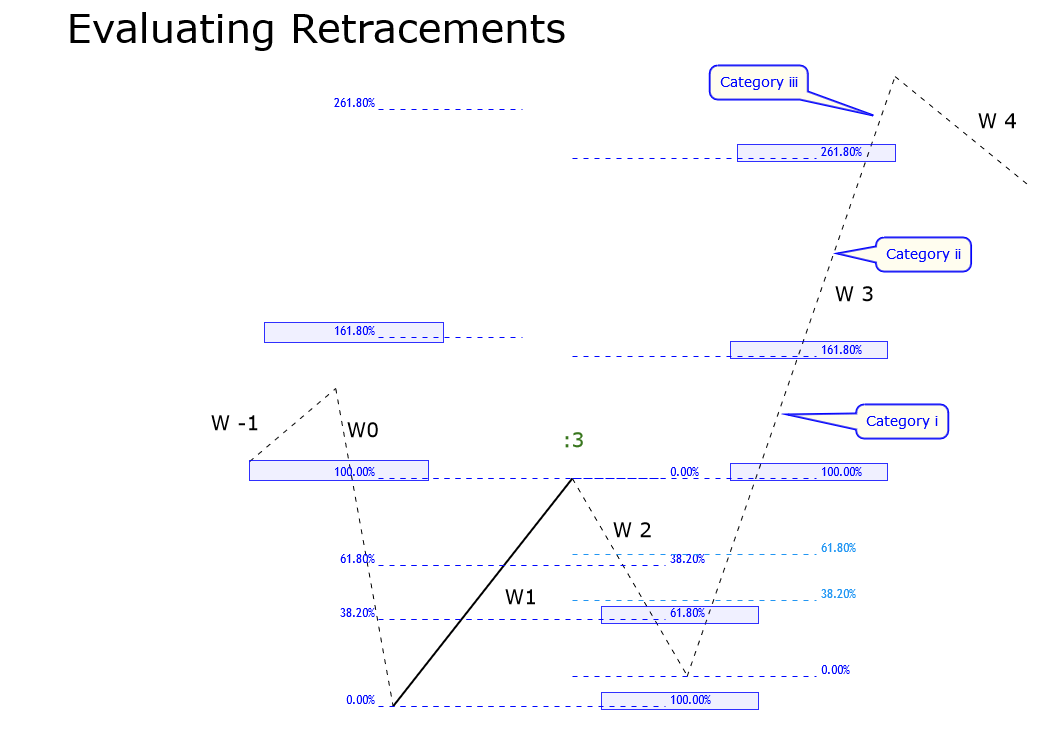
The fourth case described by Neely considers the context when the price action developed by W2 retraces between 61.8% and 100% of W1. In the same way that the wave analyst measures the retracement developed by W1 on W0, and W2 on W1, it is necessary to evaluate the retracement of W3 on W2.
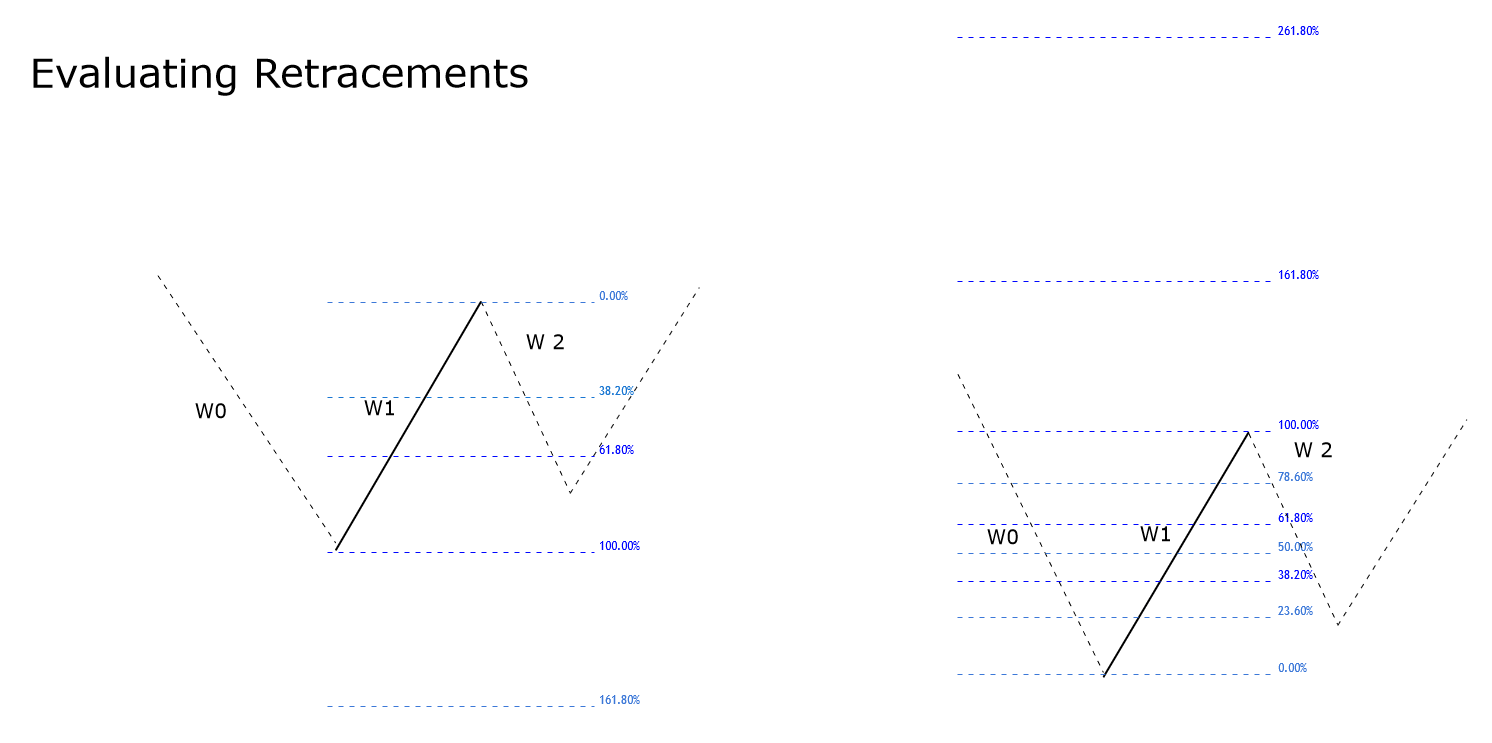
The author of “Mastering Elliott Wave” identified three possible categories of movements for wave three (W3), which are as follows.
- Category “i”: will be considered if W3 is higher or equal to 100% and less than 161.8% of W3.
- Category “ii”: this category occurs if W3 moves between 161.8% and 261.8% of W2.
- Category “iii”: this category will occur if W3 is higher than 261.8% of W2.
The categories mentioned and their implications are detailed below.
Condition “a”: we consider this condition if W0 is lower than 38.2% of W1. For the three categories mentioned, in the most common cases, W1 could be the first segment or the center of a three-wave formation. In this context, W1 should identify as “:3”. In terms of the Elliott wave patterns, the structure could correspond to a Flat formation, the center of a triangle, or a segment of a complex corrective sequence.
In some particular cases, W1 may correspond to the end of a zigzag pattern inside of a complex correction or the end of a third wave. In this situation, W1 should identify as “:5”.
Condition “b”: will occurs if W0 is greater or equal than 38.2% and lower than 100% of W1. Depending on the extension of W3, W1 be likely the beginning or the mid-part of a corrective formation; then, W1 should identify as “:3”. In this context, W1 could be part of a flat pattern or the center of a Triangle formation.
In a particular case, W1 could be the end of a five-wave sequence; therefore, W1 must label as “:5”. If this scenario occurs, W1 could correspond to the end of a zigzag pattern.
Condition c: this condition occurs if W0 is greater or equal than 100%, and lower than 161.8% of W1. In this case, W1 belongs to a three-wave formation and should identify as “:3”. In terms of the structures defined by R.N. Elliott, the sequence in progress could correspond to a Flat pattern, a Triangle formation, or the center of a complex corrective formation, for example, a double or triple three pattern.
Condition d: this condition occurs if W0 is between 161.8% and 261.8% of W1. Similarly to condition “c,” in this case W1 should identify as “:3”. And in terms of the Elliott wave analysis, the structure in progress could be a flat, a triangle formation, or any part of a complex corrective sequence.
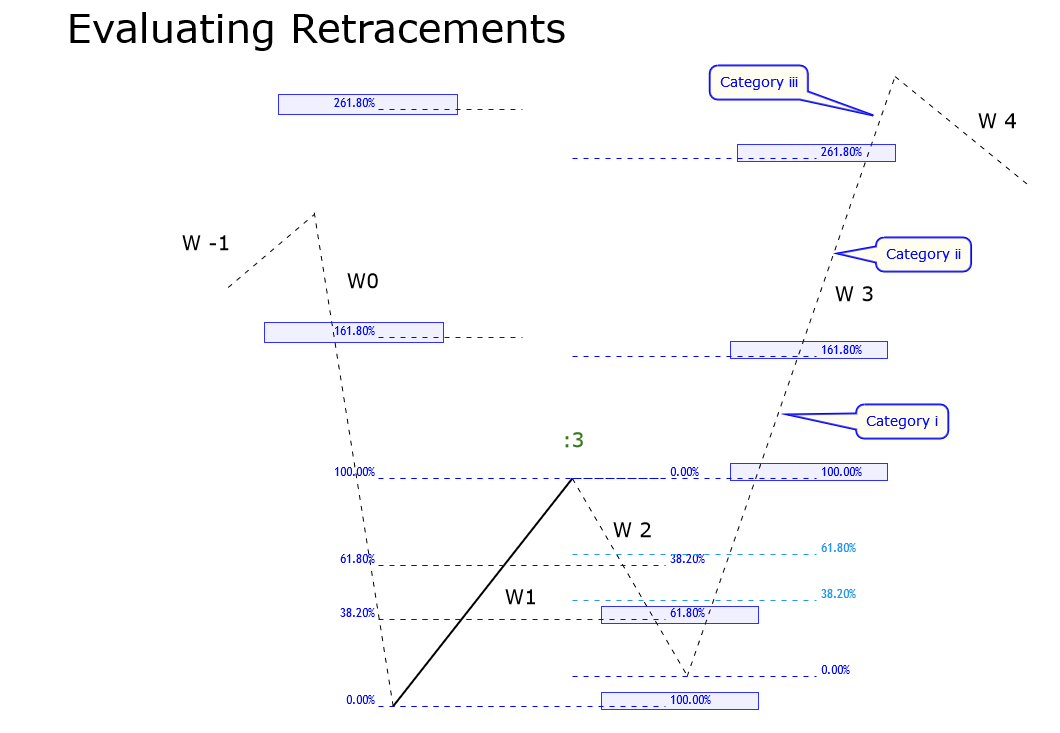
Condition e: will consider if W0 is higher than 261.8% of W1. In this condition occurs the same situation that conditions “c” and “d.” It means that W1 is part of a three-wave structure and should be tagged as “:3”.
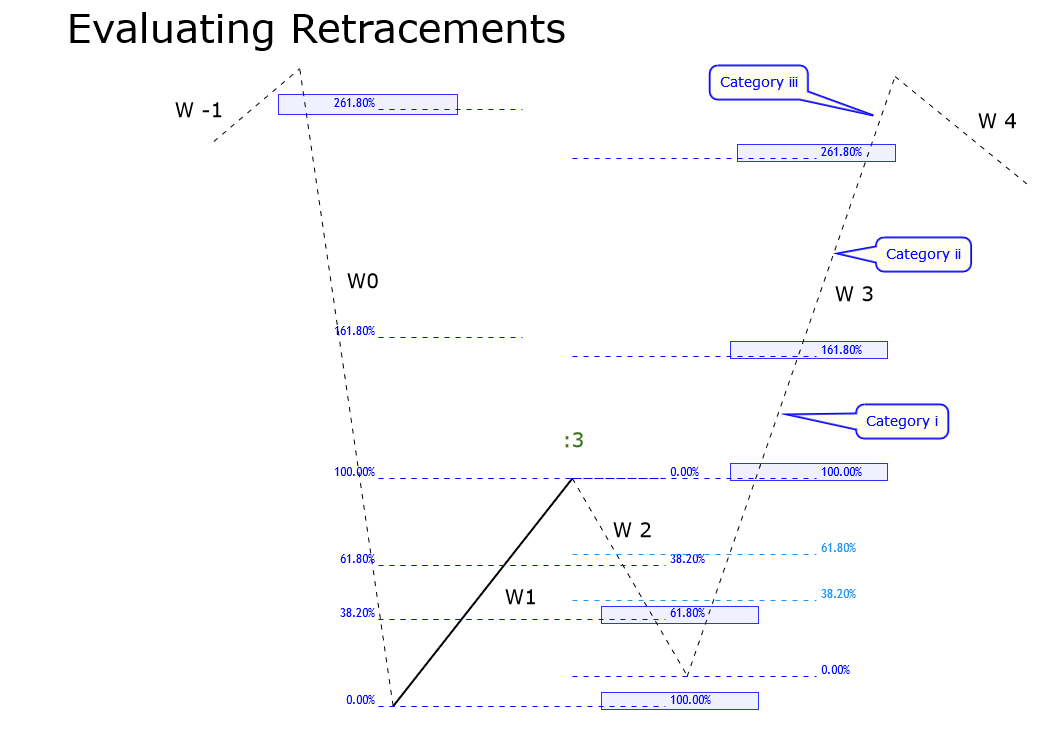
According to the structures defined by the Elliott wave theory, W1 could be the first segment of a flat pattern, the center of a triangle formation, or the center of a complex corrective sequence.
Conclusions
In this article, we have seen the possible formations that could develop according to the retracements experienced by waves W0 and W2 concerning W1, and W3 compared to W2.
In terms of the patterns defined by the Elliott wave theory, the most likely formations to which W1 might belong is to a flat pattern, a central segment of a triangle structure, or the center of a complex corrective sequence.
Suggested Readings
- Neely, G.; Mastering Elliott Wave: Presenting the Neely Method; Windsor Books; 2nd Edition (1990).
- Prechter, R.; The Major Works of R. N. Elliott; New Classics Library; 2nd edition (1990).