Categories
Forex Course

50 – Basic Anatomy Of A Candlestick Chart

Introduction

In the previous article, we have discussed the history, introduction, advantages, and disadvantages of using candlestick charts. Now, in this lesson, we will discuss how to read a typical candlestick chart.

Every candlestick has a central portion which is referred to as the body of the candlestick. It shows the distance between the opening price and the closing price of the security that is being traded. The faint line between the top of the body and the high of the trading period is the upper shadow. Likewise, the thin line between the low of the body and the low of the trading period is known as the lower shadow.

The chart below is made up of lines going from top to bottom. These lines are known as candles. This vertical axis of this chart shows the price, whereas the horizontal axis shows the time.

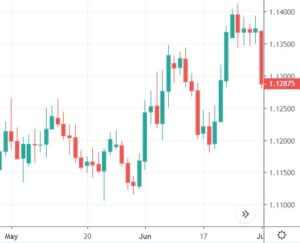
(Chart Taken From Trading View)

Each of the candles in the above chart gives us four pieces of information.

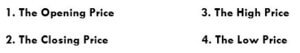
Candlesticks always refer to the information for a specific unit of time. For example, in a daily chart, each candle represents one single trading day. Every single candle is comprised of the open, close, high, and low for that given trading period. The horizontal axis of the above chart can be used to know which day corresponds to which candlestick. Almost every candle has a wick (also known as shadow) that goes outside the body of the candle. They represent the highest and lowest price of a security during that period.


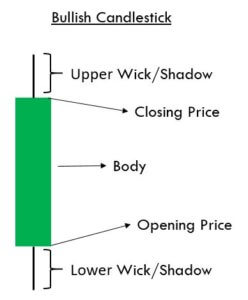
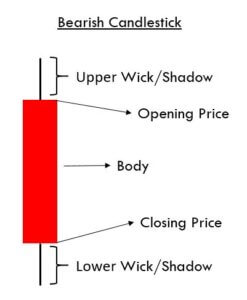
The color of the candle is the essential aspect of any candle. It determines if the opening price of a security was higher or lower than the closing price of a security. If the candle is Red, it is known as a bearish candle. Always remember that the opening price is higher than the closing price in a bearish candle. Contrarily, if the candle is Green in color, it is known as a bullish candle, and that means that the opening price is lower than the closing price.

Market Emotions & Candlesticks

The names given to candlestick patterns are a colorful way to describe the emotional sentiment of the market. When we hear words like ‘dark-cloud cover’ or ‘hanging-man,’ they easily indicate the unhealthy state of the market. We are not saying they provide proper trading signals, but they clearly indicate the negative market state.

Without even knowing the technicalities of these patterns, we get an idea of where the market is heading to just by hearing their names. For instance, consider the names like ‘morning star’ & ‘evening star’ candlestick patterns. The morning star essentially implies the bullish state of the market as the appearance of the morning star is just before the sunrise. Likewise, the evening star indicates a bearish signal because it comes out just before the sunset.

The other emotional price point that should be noted is the closing of any candle. If you recall the concept of Margin calls from brokers, they are based on the close of the candle alone. Thus we can expect emotional involvement when the market closes.

That’s about the anatomy of candlesticks. In the upcoming articles, we will be discussing many of such amazing candlestick patterns which are sure going to be very interesting.

[wp_quiz id=”59661″]
Categories
Forex Course

49. Quick History & Introduction To Japanese Candlesticks

What are Candlestick Charts?

A candlestick chart is simply a way of depicting the price moment’s information. Since these chats are very famous, they are available on almost every trading platform. Candlestick charts were first developed by a Japanese rice trader Sokyu Honma in the late 17th century. He is known as the father of candlesticks. Yes, it has been more than 250 years since this chart has been devised and yet they are so relevant even today.

Sokyu Honma – Father of Candlesticks

(Photo Credits – Alchetron)

Japanese are huge technical traders. They use a combination of candlestick techniques & western charts to analyze the market. The primary advantage of a candlestick chart is that it identifies the underlying psychology of traders in the market. This feature differentiates candlesticks from the other chart types we know today.

Have you come across terminologies like ‘hanging-man,’ ‘dark-cloud,’ and ‘evening-star’ but not sure what they are? Good. In the first part of this course lessons, we will be discussing everything about candlesticks and its patterns. We will also discuss how to use these charts & patterns to make profitable trades, as it will open a new way of analysis for you and show how Japanese candlesticks can enhance your trading performance.

Why do most of the traders use candlestick charts? 

There is a great interest in candlesticks by top traders. There are many reasons for that, and few of them are listed below:

🕯️ Candlestick charts are flexible. This is because they can be used as standalone or in combination with other technical indicators. These charts provide an extra dimension to the analysis.

🕯️ This technical approach is an age-old tradition of analysis, which has evolved from centuries of trial and error.

🕯️ Japanese are quite visual on the terms used to describe the patterns. A term like ‘hanging-man’ will spark interest among traders. There are hundreds of such names. Once a trader gets an understanding of what that pattern is, they will not be able to trade without using them.

🕯️ Another important reason for using the candlestick chart is that it can be paired along with the bar charts for people who see bar charts alone.

🕯️ All the usual technical analysis tools can be easily used with candlestick chartings, such as moving averages, trend lines, Elliot waves, retracements, and more. These charts provide a unique way of analysis, which is not provided by any other charting tool.

Limitations of using the Candlestick charts

🕯️ As with all other charting methods, candlestick pattern depends on the interpretation of the trader. This could be one of their limitations. As a trader gain experience, they discover which candlestick pattern suits them the best.

🕯️ Every candlestick has a close. Therefore, traders will have to wait for the close to get a valid trading signal. However, a trader might try and anticipate what the close would be a few minutes before the actual close.

🕯️ The opening price is vital in candlestick. Traders with no access to live market data might not be able to get the opening price of a security.

That’s about the introduction to Candlestick charts, its pros & cons. In the next article, we will learn the anatomy of a single candlestick chart so that you can read the chart better. Make sure to take the quiz below before moving on. Cheers!

[wp_quiz id=”59568″]
Categories
Forex Course

26. Margin Terminologies – Unrealized P/L and Realized P/L

Introduction

In the previous lesson, the concept of balance was discussed. And in this lesson, two more terms shall be opened up, namely, unrealized P/L and realized P/L. First up, P/L is an abbreviation for Profit/Loss. Many assume that there is only one type of P/L, but this is not true. Not just in forex, in other markets as well, there exists both unrealized and realized P/L. Now, let’s begin with understanding each term with the help of examples.

Unrealized P/L

Unrealized P/L, as the name clearly suggests, is the profit or loss running in a trade that is not closed. The profit/loss in unrealized P/L constantly changes as the prices keep changing. Hence, this type of P/L is also referred to as Floating P/L.

The Unrealized P/L is calculated as follows:

Unrealized P/L = Position size x (CMP – Entry price)  [Long]

Unrealized P/L = Position size x (Entry price – CMP)  [Short]

(CMP – Currency Market Price)

This above formula gives the value in terms of pips. The value in terms of currency can be calculated by multiplying it with the pip value of the currency pair.

Example Unrealized P/L or Floating P/L

Let’s assume a trader bought 10,000 units of EURUSD at 1.4100. After a while, the price rises to 1.5000. If the trade is still running, the floating P/L can be determined, as shown.

Since this is a long trade, the following formula is applied.

Unrealized P/L = Position size x (CMP – Entry price)

= 10,000 x (1.6100 – 1.5000)

= 10,000 x (0.11)

Unrealized P/L = 1,100 pips

Hence, the trade is currently running at a profit of 1,100 pips.

Now, if the pip value for a mini lot for EURUSD is $1, the profit sums up to $1,100 (1,100 x $1).

Now, bringing the concept of balance into the picture, the balance for unrealized P/L will not get affected though the trade is in profit or loss. However, once the trade is closed, the balance does get updated.

Realized P/L

Realized P/L is the profit or loss in a trade when it closed. Realized P/L is more significant than the unrealized P/L because this is the one that brings a change to the account balance.

The realized P/L can be calculated using the below formula:

Realized P/L = Position size x (Closing price – Entry price)  [Long]

Realized P/L = Position size x (Entry price – Closing price)  [Short]

Example – Realized P/L

Let’s say a trader went long on EURUSD with 10,000 units at 1.1000. The price drops down to 1.0000. Since the current market price is lower than the entry price, it can be ascertained that the trade is running in a loss, i.e., the unrealized P/L would be negative. Later, the price jumps up to 1.2000. At this point, the trader closes the trade. Since the trade is now closed, the realized P/L can be calculated as follows.

Realized P/L = Position size x (Closing price – Entry price)

= 10,000 x (1.2000 – 1.1000)

Realized P/L = 1,000 pips

In terms of currency value, the realized P/L will be $1,000 (1,000 pips x $1). And this time, the balance will be updated as well.

Hence, this begins us to the end of this lesson. In the next lesson, another important margin terminology shall be discussed. Before you go, make sure to take the below quiz to know if you have got the concepts right.

[wp_quiz id=”49571″]