What are Candlestick Charts?
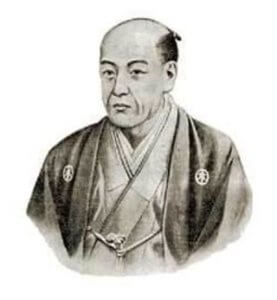
A candlestick chart is simply a way of depicting the price moment’s information. Since these chats are very famous, they are available on almost every trading platform. Candlestick charts were first developed by a Japanese rice trader Sokyu Honma in the late 17th century. He is known as the father of candlesticks. Yes, it has been more than 250 years since this chart has been devised and yet they are so relevant even today.
Sokyu Honma – Father of Candlesticks

(Photo Credits – Alchetron)
Japanese are huge technical traders. They use a combination of candlestick techniques & western charts to analyze the market. The primary advantage of a candlestick chart is that it identifies the underlying psychology of traders in the market. This feature differentiates candlesticks from the other chart types we know today.
Have you come across terminologies like ‘hanging-man,’ ‘dark-cloud,’ and ‘evening-star’ but not sure what they are? Good. In the first part of this course lessons, we will be discussing everything about candlesticks and its patterns. We will also discuss how to use these charts & patterns to make profitable trades, as it will open a new way of analysis for you and show how Japanese candlesticks can enhance your trading performance.
Why do most of the traders use candlestick charts?
There is a great interest in candlesticks by top traders. There are many reasons for that, and few of them are listed below:
🕯️ Candlestick charts are flexible. This is because they can be used as standalone or in combination with other technical indicators. These charts provide an extra dimension to the analysis.
🕯️ This technical approach is an age-old tradition of analysis, which has evolved from centuries of trial and error.
🕯️ Japanese are quite visual on the terms used to describe the patterns. A term like ‘hanging-man’ will spark interest among traders. There are hundreds of such names. Once a trader gets an understanding of what that pattern is, they will not be able to trade without using them.
🕯️ Another important reason for using the candlestick chart is that it can be paired along with the bar charts for people who see bar charts alone.
🕯️ All the usual technical analysis tools can be easily used with candlestick chartings, such as moving averages, trend lines, Elliot waves, retracements, and more. These charts provide a unique way of analysis, which is not provided by any other charting tool.
Limitations of using the Candlestick charts
🕯️ As with all other charting methods, candlestick pattern depends on the interpretation of the trader. This could be one of their limitations. As a trader gain experience, they discover which candlestick pattern suits them the best.
🕯️ Every candlestick has a close. Therefore, traders will have to wait for the close to get a valid trading signal. However, a trader might try and anticipate what the close would be a few minutes before the actual close.
🕯️ The opening price is vital in candlestick. Traders with no access to live market data might not be able to get the opening price of a security.
That’s about the introduction to Candlestick charts, its pros & cons. In the next article, we will learn the anatomy of a single candlestick chart so that you can read the chart better. Make sure to take the quiz below before moving on. Cheers!
[wp_quiz id=”59568″]
