Introduction
The Current Account balance represents one half of the nation’s Balance Of Payments. This number typically ranges in billions and trillions. When trying to comprehend such big numbers, a strong understanding of what do these numbers represent in actuality is paramount.
What is the Current Account Balance?
The equations given below represent what Current Account balance is composed of and how it contributes to the nation’s Balance Of Payments
![]()
![]()
The current account balance is the sum of the Balance Of Trade, Net Income, and Net Current Transfers. Fundamentally, the Balance Of Trade represents the difference between total exports and imports of goods and services for that nation.
Balance Of Trade: The Balance Of Trade is the difference between the revenue generated by export and the expenditure incurred by the imports. A nation that exports more than what it imports is said to be running a trade surplus. Conversely, a country whose imports exceed its exports is said to be running a trade deficit. A country that is having a trade deficit is said to have a negative Balance Of Trade, and a trade surplus country is said to have a positive Balance Of Trade.
Net Income: It represents the income received by a country for its investments in areas like real estate or holding in foreign shares, etc.
Net Current Transfers: The net current transfer represents one-directional transfer between one Nation to another without any equivalent financial item in return. This may take the form of worker remittances, charitable fund transfer, or even relief funds, etc.
All these three components are combined to form what is called the current account balance of a nation. A country with a negative current account balance is a net borrower from the rest of the world, and that which has a positive current account balance is a net lender to the rest of the world.
For example, the United States, which is running a negative current account balance, indicates that the nation is importing or consuming more than it is exporting or producing, thereby sending trillions of dollars out of the nation in exchange for equivalent goods and services.
Current Account & Capital Account
The Capital Account reflects the opposite of what current account balance shows. If a country is importing commodities by sending out money, it must receive an equivalent amount of money in one form or another from a certain set of sources. The Capital Account reflects those sources.
A country receives capital when its domestic assets are purchased by foreign bodies. The same country also spends money when it purchases foreign assets using domestic currency. The total of these both may result in a positive or negative capital account. A country running a negative current account balance must have, by definition, a positive equivalent capital account as the total of the entire Balance Of Payments should equal to zero.
How is the Current Account Balance to GDP calculated?
The current account balance, which often ranges in billions and trillions, is expressed as a percentage of GDP. The Bureau of Economic Analysis releases the current account balance quarterly, semi-annually, and annually. The World Bank publishes current account balance as a percentage of GDP for all the nations.
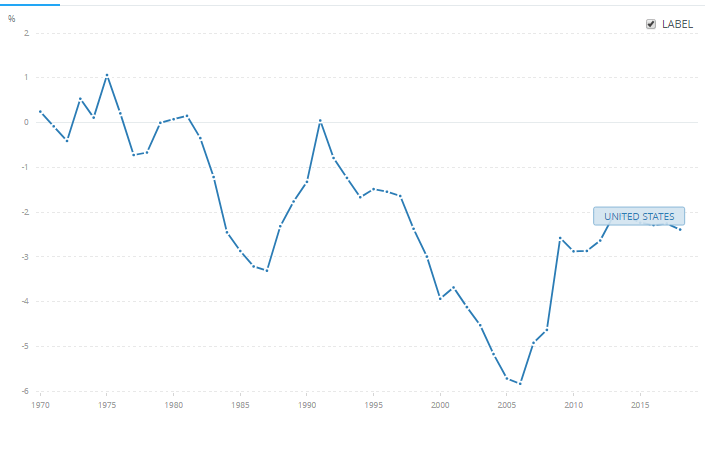
Below is the snapshot of the current account balance as a percentage of GDP for the United States published by the World Bank on their official website.
How can the Current Account Balance to GDP be Used for Analysis?
The current account balance is an entire country’s economic figure, and when calculated as a percentage of the Gross Domestic Product GDP, we can draw a lot of conclusions about the current economic situation within the nation.
We have to also keep in mind that simply a negative current account balance or its percentage does not mean that the economy is stagnating nor a positive current account balance indicates a growing economy. The United States has been running in a negative current account balance since 1980.
The current account balance is one part of the Balance Of Payments, and when we look in the absolute sense, we will not be able to assess the nation’s economic situation properly. Instead, if we look at the percentage concerning the previous number, we might be able to know whether the economic conditions have improved or declined concerning earlier periods.
For example, in the US, a $1.1 billion reduction of the current account deficit in the third quarter of 2019 concerning the previous quarter was mainly due to increased income and reduced goods deficits, as mentioned by the Bureau of Economic Analysis.
Impact On The Currency
The Current Account balance reflects the overall economic activity and the revenue circulation in and out of the country. As a percentage of GDP, it can give us a relative comparison on a global scale with other competing nations. In general, it is a proportional indicator. Meaning, an increase in the results in currency appreciation on a relative basis with previous periods and vice-versa.
On a relative basis, the measured changes in the percentages can help us understand which country’s economic activity has grown or contracted. Such macro-economic indicators are very useful for many people. For instance, Governments can take policy decisions or put appropriate pressure or give support to certain businesses, either increase or decrease economic activity.
Traders can also use these indicators to predict currency movement and may decide to invest. Large and unpredictable movements in the current account balance can shake the confidence of investors in either direction, i.e., positively or negatively.
Sources of Current Account Balance to GDP
The United States Bureau of Economic Analysis releases quarterly reports of the Current Account Balance numbers. It can be found here.
Also, the World Bank releases Current Account Balance as a percentage of GDP on its official website for many countries. Those numbers can be found here.
Impact Of ‘CA To GDP’ Announcement On The Price Charts
In this section of the article, we shall see how the Current Account % of GDP will impact the currency and cause a change in the volatility. We will be analyzing the Current Account % of GDP data of New Zealand by observing the changes in the data from previous reading to the current reading.
The Current Account % of GDP data is released every quarter, and thus we will have four readings in a year. The latest data available to us is of the 3rd quarter released in the month of December and the 4th quarter data will be released in March. As we can see below, this indicator has the least impact on the currency (Yellow Implies Least Impact), and we should not expect much volatility after the news announcement.
![]()
Below is the Current Account % of GDP of December quarter, which is released by the ‘Statistics New Zealand’ agency, which collects information from people and organizations through censuses and surveys. It is also known as ‘Stats NZ’ and is a government department. The data shows that the Current Account % of GDP was increased by 0.1%, which we will now see what impact it created on the charts.

NZD/CAD | Before The Announcement - (Dec 17th, 2019)
Before the news announcement market is in a clear downtrend and is attempting for a pullback. When we are talking about the impact of the news, we know that since it is a less impactful event, a better than expected result would mean a partial reversal of the trend. If the numbers are not that good for the ‘New Zealand Dollar’ we should expect a continuation of the current trend.
Thus, from a trading point of view, it is better to join the current downtrend if the Current Account % of GDP is maintained somewhere around the previous reading. We should not be going ‘long’ in the market even if the data is good for ‘New Zealand Dollar’ since the impact of the indicator is not high, and then the rally will not last.
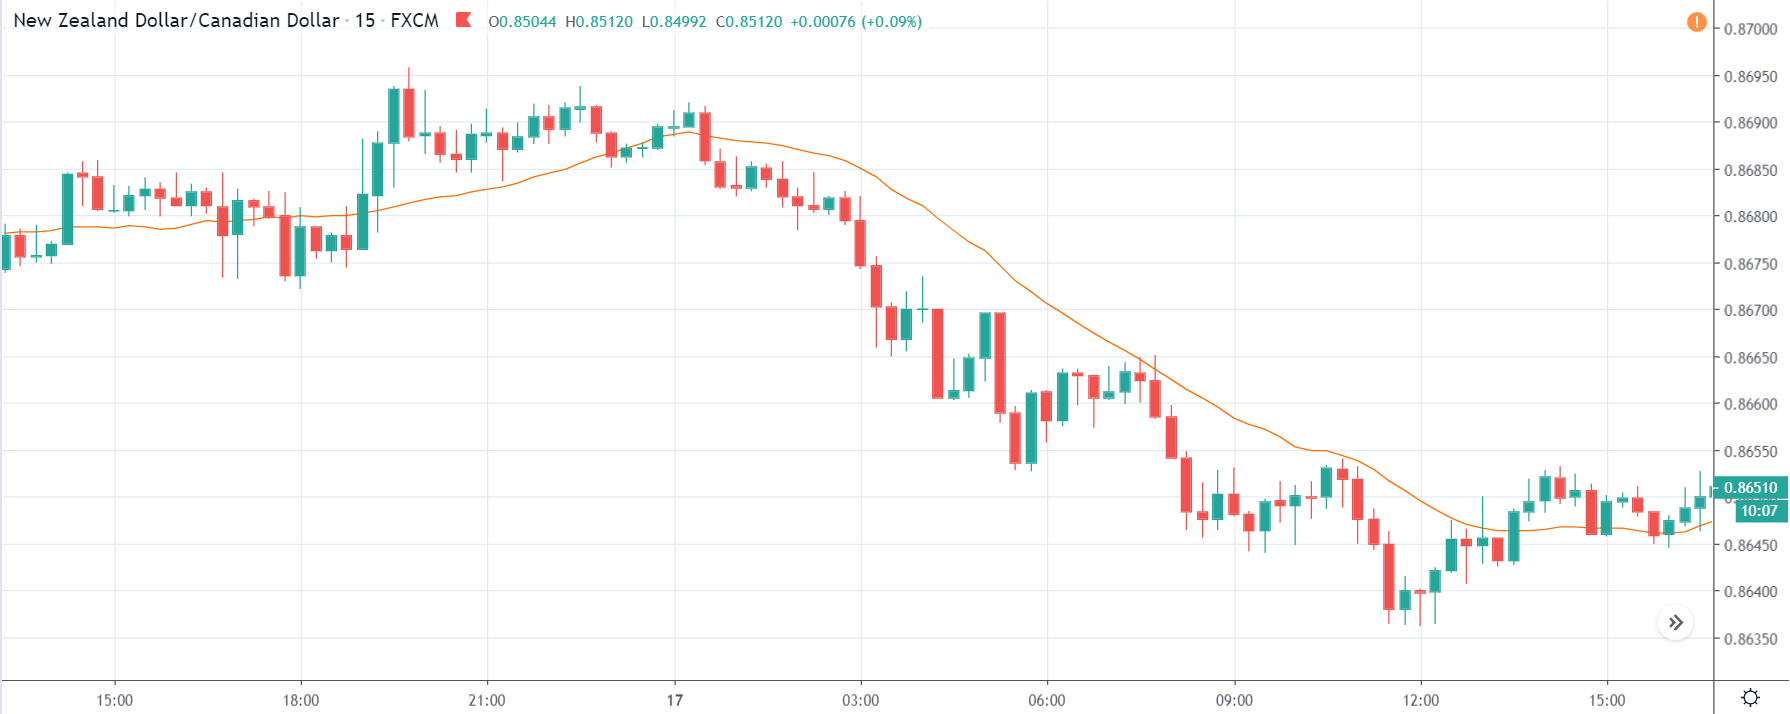
NZD/CAD | After The Announcement - (Dec 17th, 2019)
The Current Account % to GDP was increased by 0.1%, which is mildly positive for the New Zealand Dollar. We see the initial reaction of the market where the candle barely closes in green. The volatility witnessed is also very less due to the above-mentioned reason.
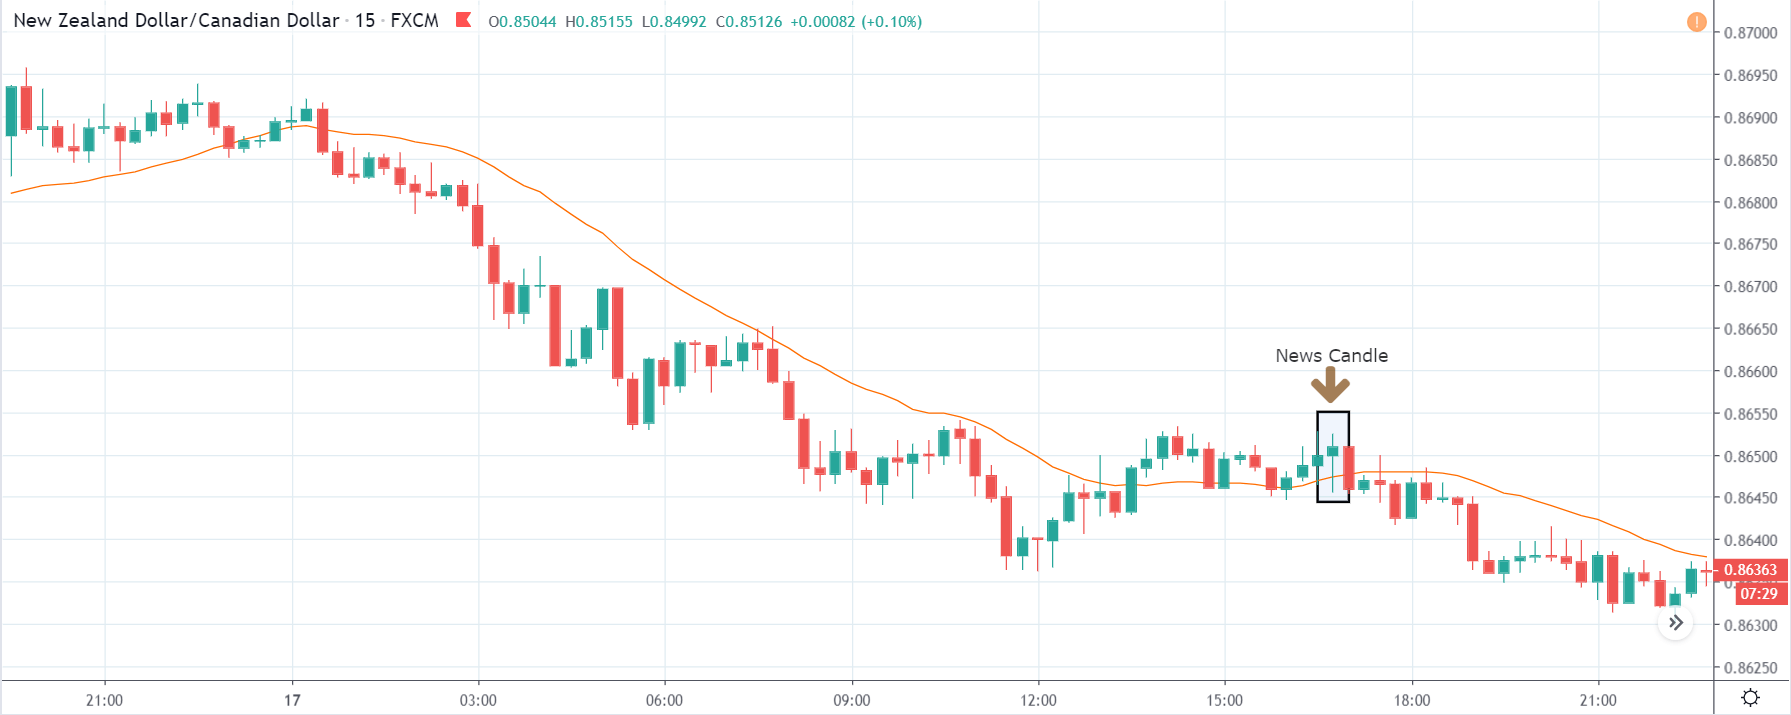
Therefore, we can trade this currency pair on the ‘short’ side, after the price goes below the moving average line, which will our confirmation sign for the trend continuation. Since the news outcome was not good for the New Zealand Dollar, the downtrend could continue further, and we should be able to easily make a profit on the downside.
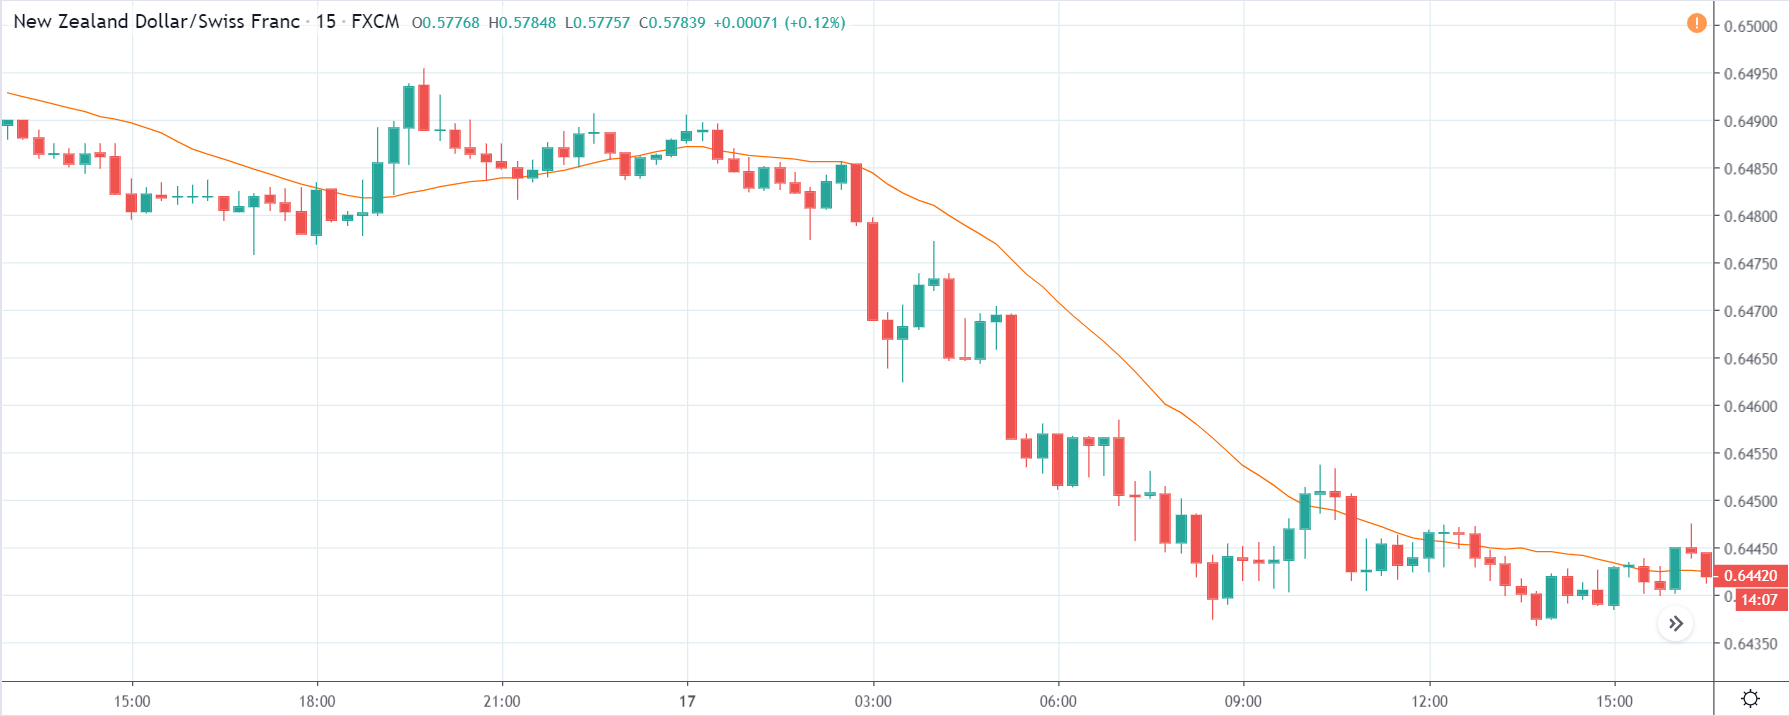
NZD/CHF | Before The Announcement - (Dec 17th, 2019)
NZD/CHF | After The Announcement - (Dec 17th, 2019)
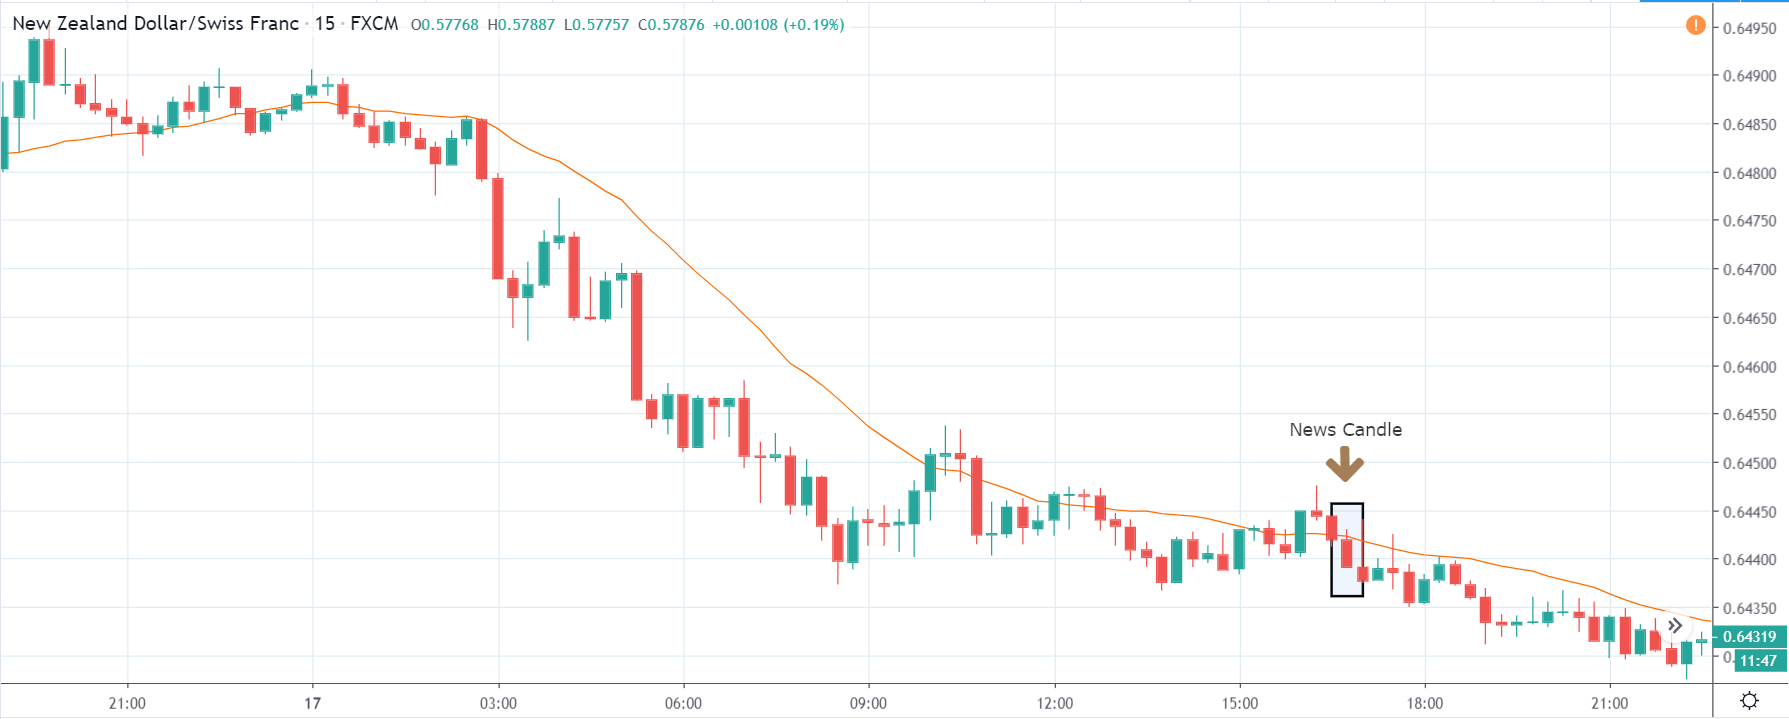
The above chart represents the currency pair of NZD/CHF, which shows similar characteristics as that of the NZD/CAD currency pair. In this pair, we can notice that the news release did not even take the price above the moving average line, which means the data is very weak when compared to Swiss Franc. The market became volatile after the news release and took the price down. Thus, this is a much better pair for taking a ‘short’ trade with an amazing risk to reward ratio. We can also continue to hold on to our profits as long as the price is below the moving average.
EUR/NZD | Before The Announcement - (Dec 17th, 2019)
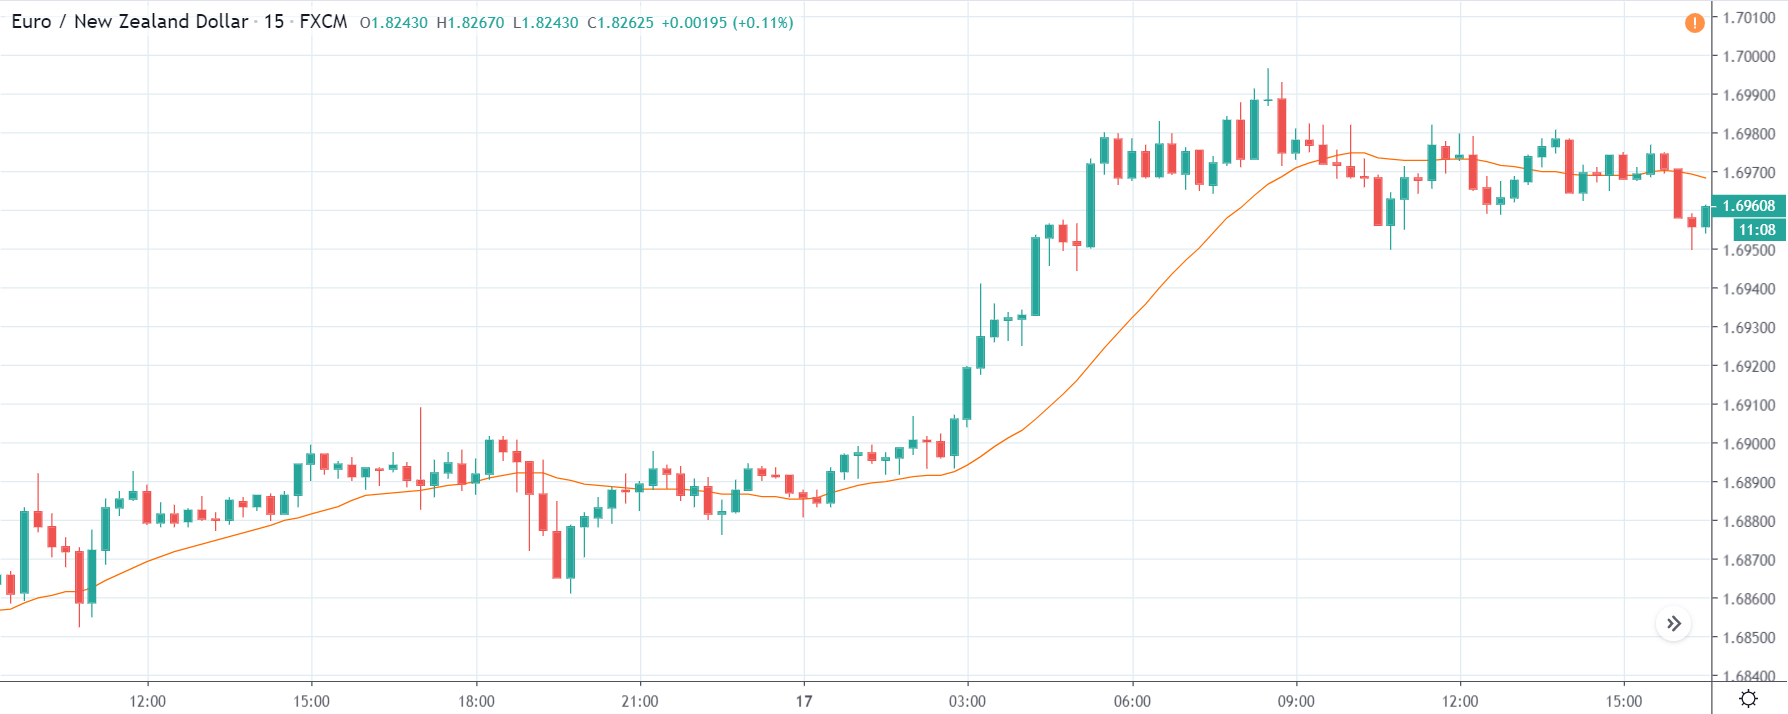
EUR/NZD | After The Announcement - (Dec 17th, 2019)
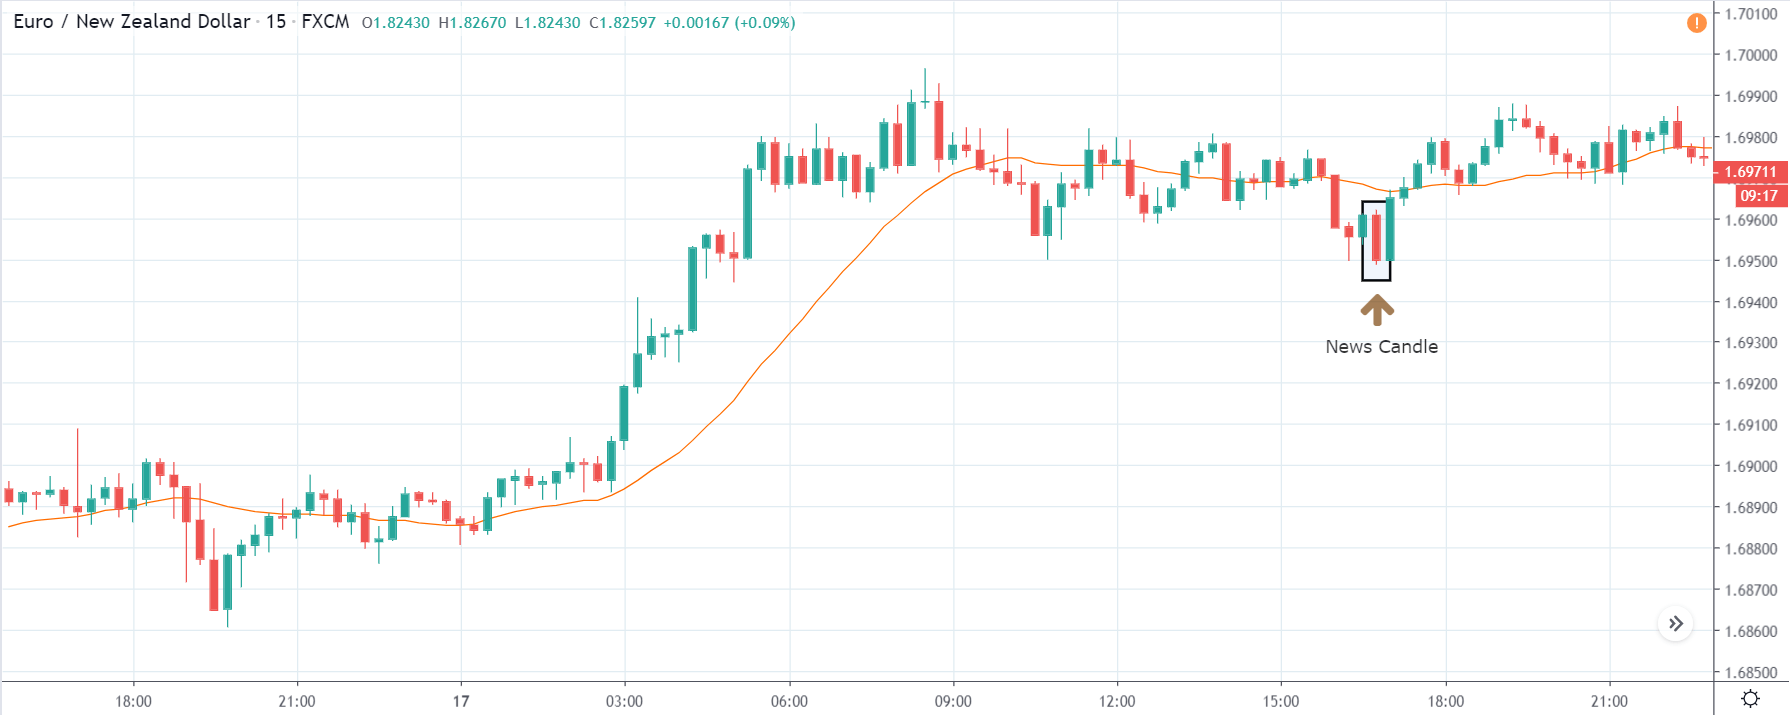
In this currency pair, the New Zealand Dollar is on the right side, so we see an uptrend illustrating the weakness of the currency. Since the Current Account % of GDP data was slightly positive for the New Zealand Dollar, we see a red candle after the news announcement, but later it was fully overshadowed by the green candle. This means the Current Account numbers were not good enough to take the currency lower.
What we see after the news release is a ‘Bullish Engulfing’ candlestick pattern, which is essentially a trend continuation pattern. Thus, once the price goes above the moving average line, we can enter for’ longs’ in this pair with a stop loss below the red candle and aiming for a new ‘higher high.
That’s about the Current Account To GDP ratio Economic Indicator and its impact on the Forex market. If you have any questions, please let us know in the comments below. All the best.