Introduction
The Balance Of Trade AKA. BOT is essentially the difference or variance in a nation’s export and import. When understood correctly, this indicator can help us in evaluating the relative robustness of any given economy compared to the other ones.
Understanding Balance Of Trade
In the simplest of analogies, consider a scenario where a rice seller sells $1000 worth of rice to other grain sellers in the market over a month. Within that month, if he had purchased $800 worth of goods like vegetables, fruits, etc. from the other vendors, his Balance Of Trade would be $200.
Here, in this example, the market is the entire world, and the rice seller is equivalent to a nation. $1000 is the net worth of the exported goods and services that went out of the country, whereas the $800 is the net worth of the imported goods and services that came into the country. In this case, $200 is the trade surplus that the country is having.
Therefore, Balance Of Trade can be considered as a difference between what goes out (exports) and what comes in (imports) over a given time frame. And depending on whether exports or imports are greater, a nation is said to be running a Trade Surplus or Trade Deficit, respectively. Fundamentally, an Export is when a foreign resident or nation purchases an in-country produced good or service, and an Import is when an in-country citizen purchases goods or services from foreign.
How is the Balance Of Trade calculated?
In the previous article, we understood the formula of a country’s current account. That is, Current Account = (Exports – Imports) + Net Income + Net Current Transfers.
In the above formula, (Exports – Imports) is the Balance of Trade.
How Can This Economic Indicator Be Used For Analysis?
Investors can use Balance Of Trade numbers to ascertain whether the overall economic activity of a nation has grown or slowed down concerning the previous month’s/quarter’s/year’s numbers. For example, a country which has seen a trade surplus for let’s say over ten years, and due to some calamities, its exports got hit. The nation might enter into a trade deficit or a reduced trade surplus. Such a relative comparison can help investors to ascertain whether a country’s economy is booming or slowing down.
In an absolute sense, a Trade surplus or Trade deficit, as discussed, cannot tell in entirety. But it will definitely give us a macroeconomic picture of an economy’s health and what the nation has undergone in the present business cycle. Let’s assume a country is a major exporter of oil for which it receives a majority of its income. If the production of oil is doubled, automatically there will be an increase in the demand for that currency worldwide. This will result in an appreciation of that country’s currency.
Not just this, but the Balance Of Trade can also point towards many things like an increase in employment or an oncoming expansion or recession when viewed with correct perspective and analysis.
Impact of Balance Of Trade on Currency
By simply looking at the BOT numbers, we cannot conclude whether a nation is experiencing growth or slow down straight away. Because the Balance Of Trade only projects a partial picture and not the whole picture.
A developing country might want to import more goods and services from abroad, which increases the competition in their respective markets. Thereby they keep the prices and inflation low. During these periods, that country will have a Trade Deficit. To an outsider, it will only look like the country is consuming more than it is producing. So this scenario can be wrongly assumed as the country’s economy is slowing down. But in reality, what if the country is experiencing a trade deficit for the first six months and a trade surplus for the next six months?
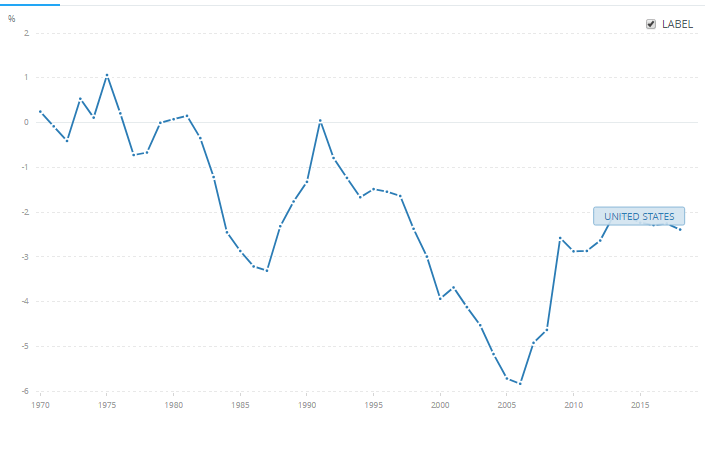
Developed nations like the United States and the U.K. have experienced long periods of trade deficits against developing and emerging economies like China and Japan, who have maintained trade surpluses for long times. Hence, the time frame, business cycles, the relative situation with other countries all factor in to give a correct interpretation to the BOT.
But in general, most of the time, an increase in the Balance of Trade number is good for Currency. It is a proportional indicator, meaning. Lower or negative Balance of Trade numbers relative to previous periods signals currency depreciation and vice versa.
Balance of Trade & Balance of Payments
BOT is a major component of a Nation’s BOPs, i.e., Balance Of Payments. Balance Of Payments, ideally, should always equate to zero, giving us a complete account of all things traded in and out of an economy. A nation can have a surplus while having a trade deficit. This happens when other components of Balance Of Payments like Financial Account or Capital Account run into large surpluses.
But in general, countries prefer to have a trade surplus, and it is obvious. A country in net terms receiving a gain or profit for their goods and services would mean that the people of that country will experience higher wealth, and it would automatically result in a higher standard of living. And also, by continually exporting, they would develop a competitive edge in the global market. This would also increase employment within the nation, which, in general, is favorable for the nation. But as said, it is always not necessary for this condition to be true. It depends on what goals the country has in mind for future short term deficits also matters.
Hence Balance Of Trade is one of the important indicators for analysts to ascertain a country’s economic activity and current health of an economy.
Economic Reports
Since the Balance of Trade is about imports and exports, data for the same is publicly available on a monthly basis for all the countries. The reports are released in the United States by the U.S. Bureau of Economic Analysis and the U.S. Census Bureau. The units would be typically in millions of dollars for most reports and for most nations. The popularly used reports are typically seasonally adjusted to give a more accurate report.
Sources of Balance Of Trade
To get the latest information about this economic indicator for the United States, you can refer to this link. To know all the diverse components involved in Balance Of Payments and International Trade, you can refer to this page from The Bureau Of Economic Analysis.
Impact Of ‘BOT’ News Release On The Price Charts
Now that we know the meaning of trade balance and how it affects the economy, we shall extend our discussion and understand how it impacts any of the currencies after the news announcement is made.
As we can see in the below image, the Trade Balance indicator has the least effect on currency (yellow indicator implies the least impact on currency). Hence, this might not cause extreme volatility in the currency pair after the news release. It is still important to understand the effect and look at how we can position ourselves in the market in such scenarios.
![]()
For illustration, we have chosen the New Zealand Dollar in our example, and we will analyze the latest’ Trade Balance’ data of the same. The data shows that Trade Balance was increased by 44M as compared to the previous reading, which is said to be positive for the currency. But let us see how the market reacted to this data after the announcement was made.
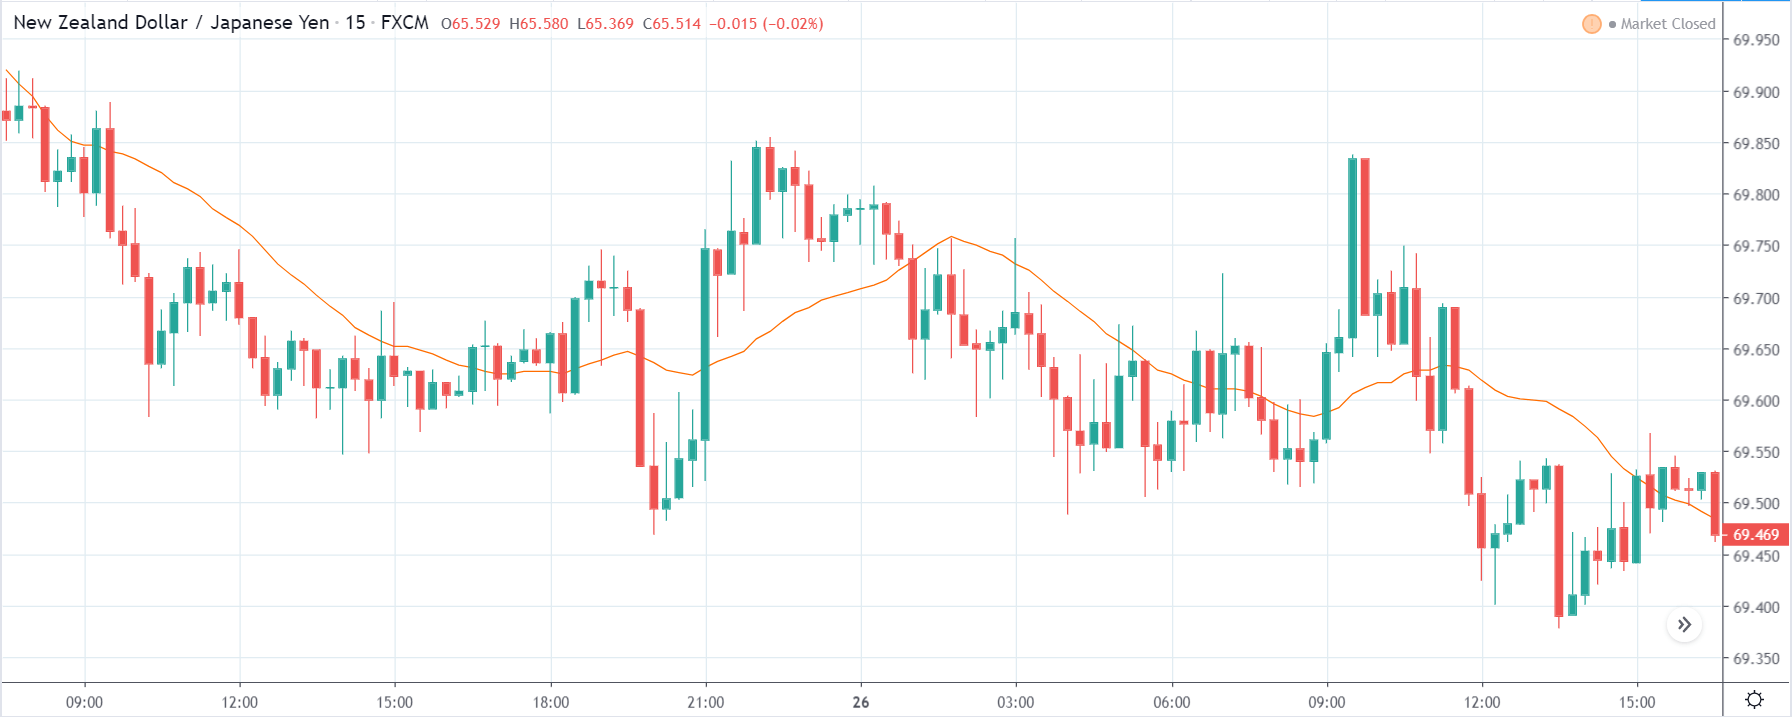
NZD/JPY | Before The Announcement - (Feb 26th, 2019)
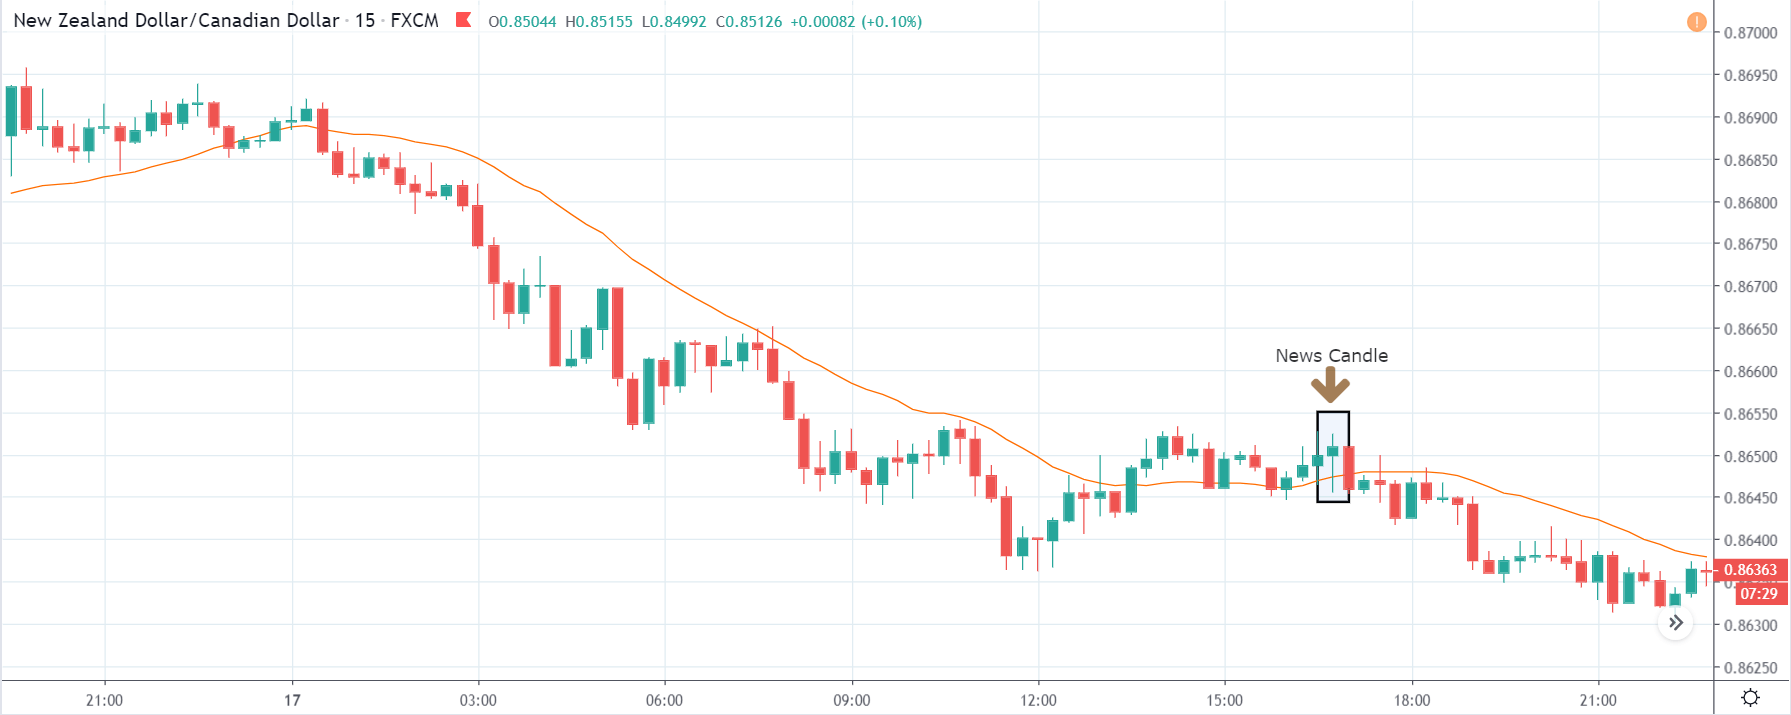
The below chart shows that the overall trend is down, which means the New Zealand dollar is very weak. As said in the above paragraph that changes in Trade Balance of a country do not have much impact on the currency, so better than expected data can only cause a reversal of the trend. However, if the data is retained at previous reading, we can expect a continuation of the downtrend, and volatility will be more on the downside. We will be looking to trade the above currency on the ‘short’ side if the Trade Balance data is bad for the country since even positive data cannot push the currency higher.
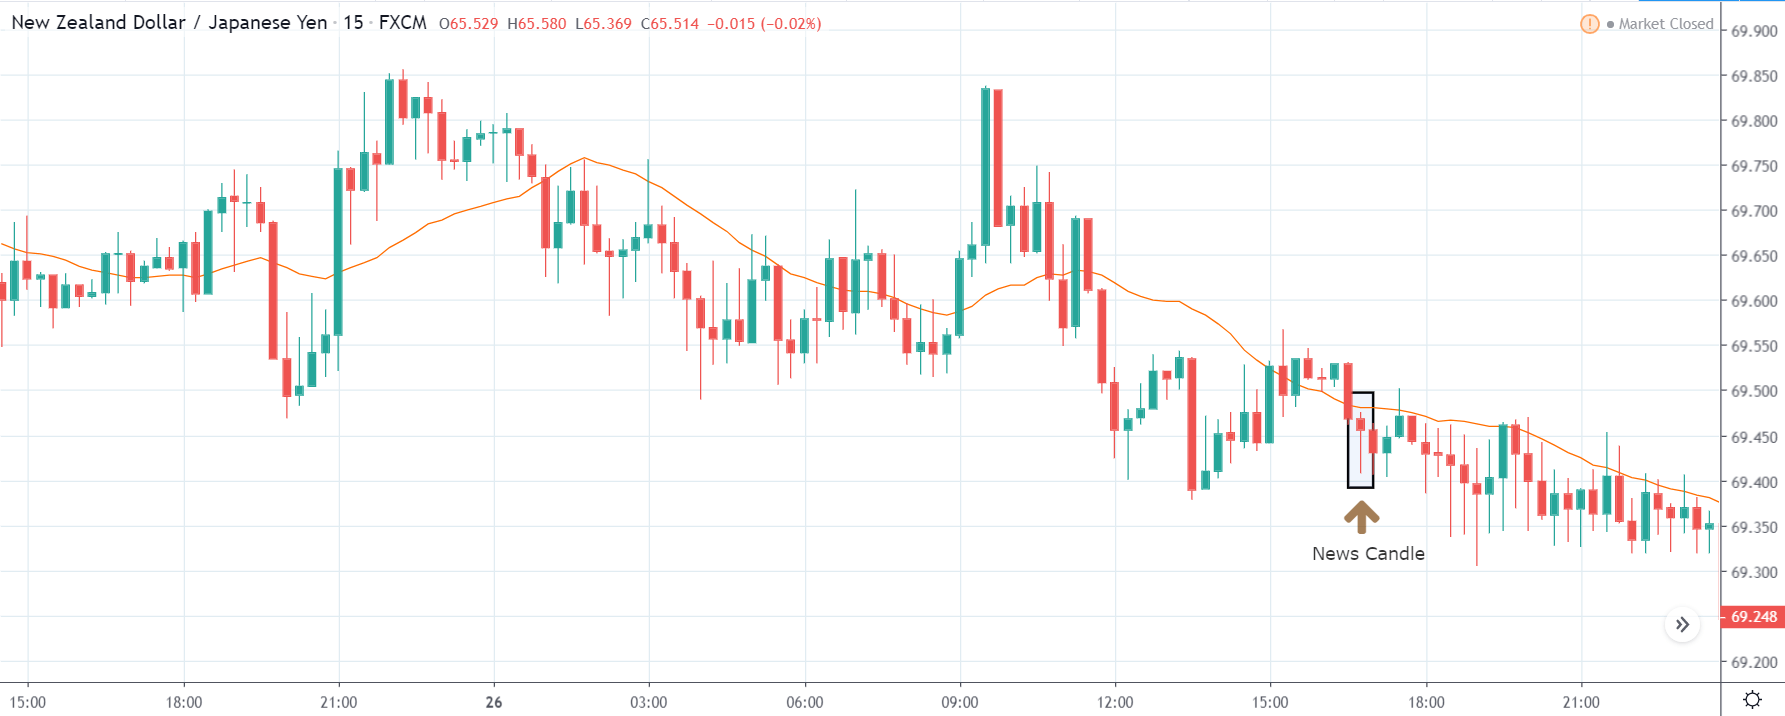
NZD/JPY | After The Announcement - (Feb 26th, 2019)
After the news announcement, we see that the price crashed below the moving average, reacting to the not-so-good numbers of Trade Balance for New Zealand. The market participants were expecting much better Trade Balance data, but after seeing that it was increased by mere 44M, they were disappointed and hence sold New Zealand dollars. We can take advantage of this change in volatility by taking risk-free ‘short’ positions in the pair soon after the market falls below the moving average. We can hold on to our trade as long as the price is below the moving average and exit once we see signs of reversal.
GBP/NZD | Before The Announcement - (Feb 26th, 2019)
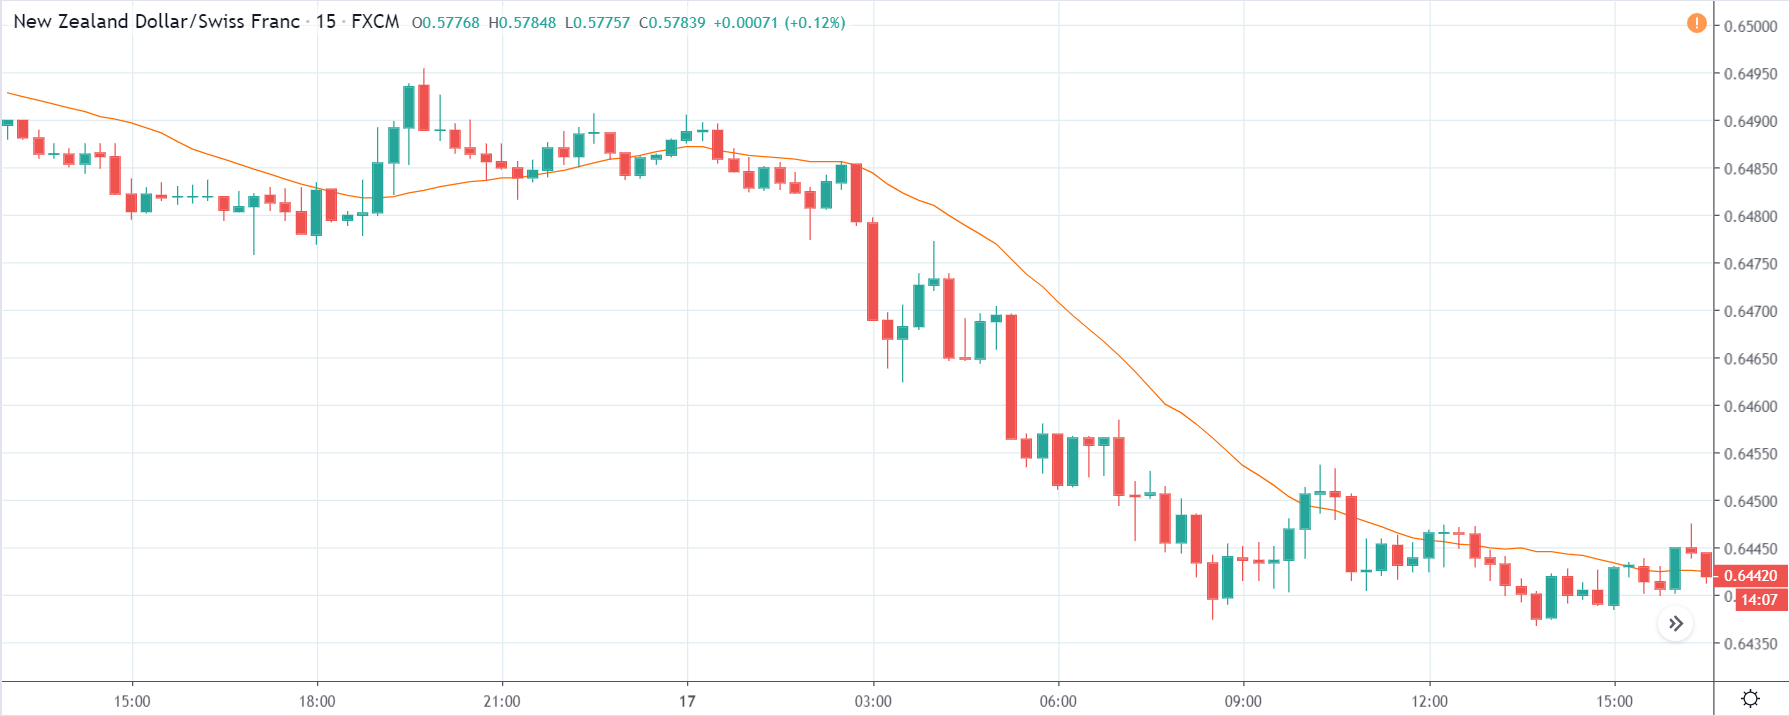
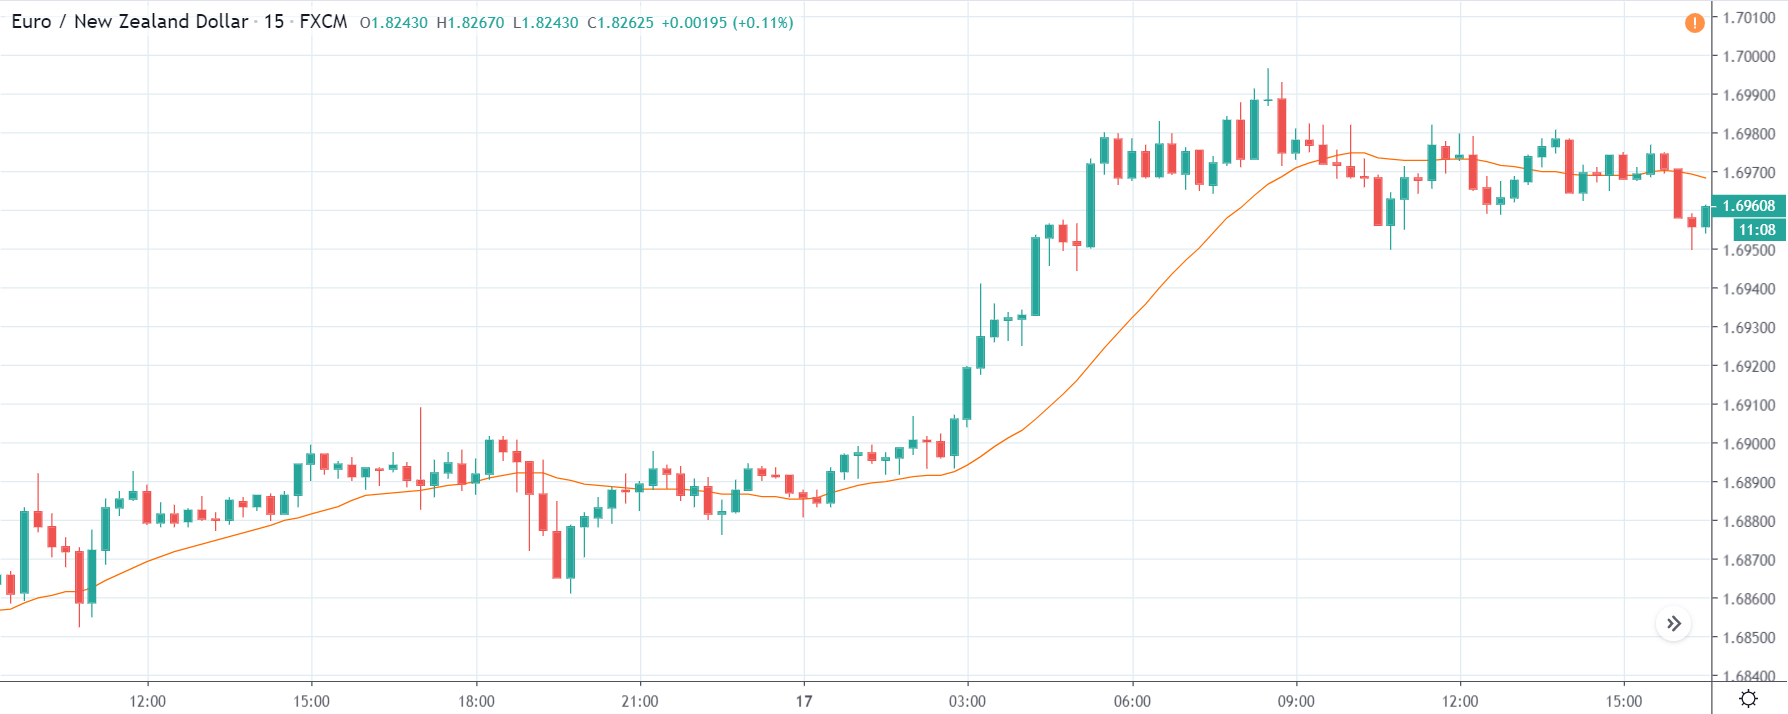
Here we can see that the New Zealand dollar is on the right-hand side, and since the market is in a downtrend, the currency is strong. In this situation, a risk-free way to trade this pair is by going ‘long’ if the Trade balance numbers are not good for the pair and after trend reversal signals. Since the downtrend is not very strong, we can take ‘short’ positions only if it breaks the recent ‘lows’ and shows signs of trend continuation.
GBP/NZD | After The Announcement - (Feb 26th, 2019)
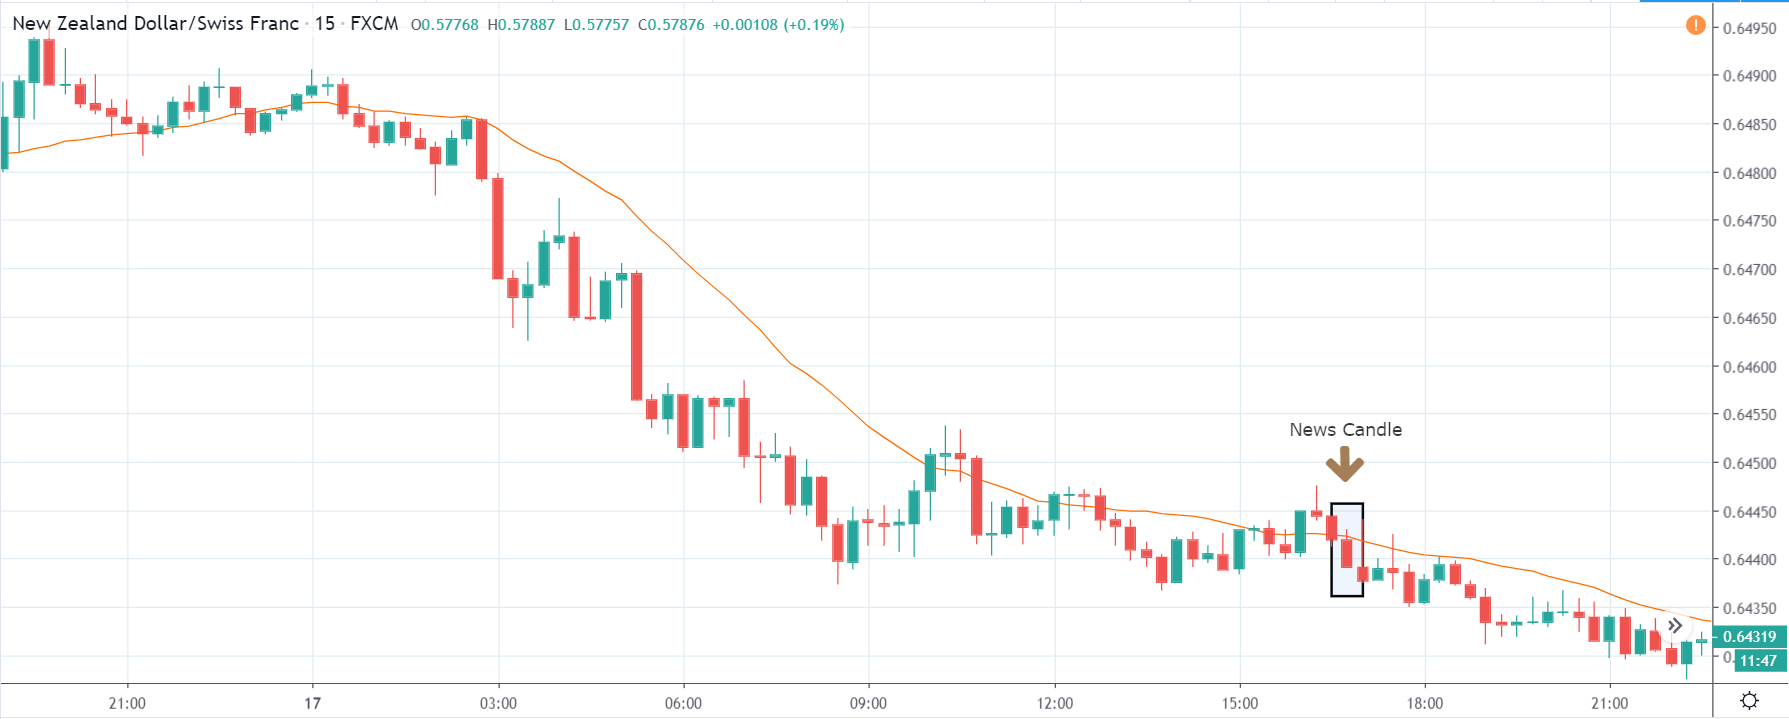
After the numbers are out, we see the positive reaction for the New Zealand dollar as the numbers were better than last time, but it could not take it lower. Since the data was weak, we can ‘long’ positions in the pair once the price makes a ‘higher low’ after crossing above the moving average.
EUR/NZD | Before The Announcement - (Feb 26th, 2019)
The above chart represents the currency pair of EUR/NZD, which shows similar characteristics as that of the NZD/JPY pair but in reverse as the New Zealand dollar is on the right-hand side. In this pair, the New Zealand dollar is extremely weak, and we also the price is above the moving average showing the strength of the uptrend. Therefore taking’ short’ positions in this pair is not advisable even if the Trade Balance data is good for the New Zealand economy, as it is a less impactful event, and the reversal might not last. A better option would be to go ‘long’ in this pair.
EUR/NZD | After The Announcement - (Feb 26th, 2019)
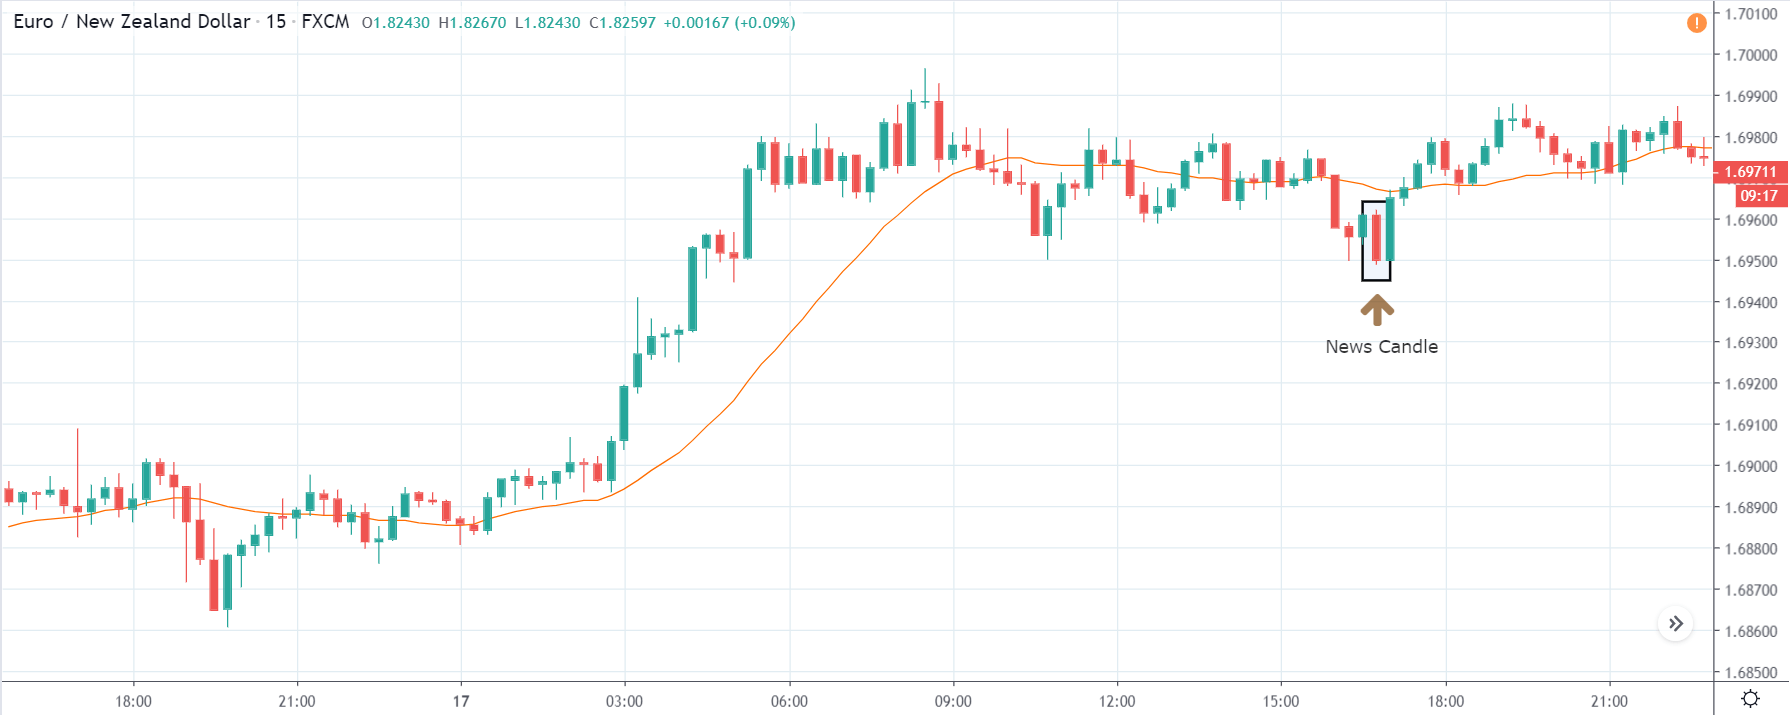
After the news announcement, we see a red candle, and the price bounces off the moving average, continuing its uptrend. Since the data was not very positive, the market continues its uptrend, and thereby the New Zealand dollar weakens further. This could be the perfect setup for a ‘buy’ since all parameters are in our favor. The volatility here expands on the upside, after the news release.
That’s about the Balance of Trade and its impact on the Forex currency pairs. We just wanted to show how the markets get impacted after the news release. It is always advisable to combine these fundamental factors with technical analysis as well to ace the Forex markets. Cheers.

