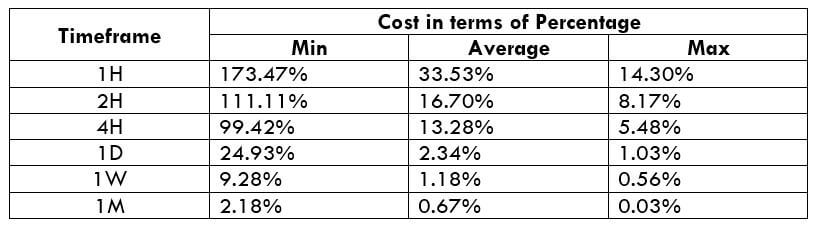
Categories
Forex Course

66. Pairing The Fibonacci Levels With Trendlines

Introduction

In the previous articles, we learned how Fibonacci retracements give extra confirmations while trading the support & resistance levels. We also know that Fibonacci levels can be used as a confirmation tool to trade many candlestick patterns as well. Now we shall extend this discussion and understand how Fibonacci retracements can be traded using the trendlines.

Trendlines are a crucial part of technical analysis. They are primarily used to identify trends, be it up or down. Trendlines being such an important part of trading, when combined with the Fibonacci indicator, can produce trades that have the highest probability of winning. So let us see how this can be done.

Combining Fibonacci Levels & Trendlines

In the below chart, we have, firstly, identified an uptrend and drew a supporting trendline to it. The next step is to plot Fibonacci on the chart by identifying a swing low and a swing high. The marked area shows where all our trading is going to take place and the region in which we will find our swing low and swing high.

The traditional way of selecting a swing low is when the point intersects with the trendline, just as we have done in this case (below image). The swing high will be the point where the market halts and reverses for a while.

In the below chart, we have used the chosen a swing low and swing high to plot our Fibonacci indicator. In order to combine the Fibonacci with trendline, we must wait to see if the retracement from the swing high touches the 50% or 61.8% Fib level. After touching any of these levels, if the market gives a confirmation candle, it could be a perfect setup to go long. The retracement, in this case, touches the 50% level, which coincides exactly with the upward trendline. The next and final step is to look for a confirmation candle, if any.

We have gotten a confirmation sign from the market after the second green candle closes above the 23.6% Fib level (below image). Hence traders can now take risk-free positions on the ‘long’ side of the market with a stop-loss below the 61.8% Fib level and with an aggressive target above the recent high. This trade results in a risk to reward ratio of 1.5.

We should not forget that if the retracement does not take support at the 50% or 61.8% Fib level and goes further down, breaking all the levels, it could be a potential reversal sign. Thus the retracement that is coinciding with the trendline and reacting from 50% or 61.8% Fib level is the thumb of the rule of this strategy.

The above is a more widened image of the chart shows that the market continues to trend upwards, crossing our ‘take-profit‘ area. To take advantage of the market’s trending nature, we can place a trailing stop-loss order to maximize our profits.

Conclusion

When trends start to develop in the market, one should start looking for ways to go ‘long’ or ‘short’ by using necessary technical indicators that give a better chance of a profitable trade. The Fibonacci indicator is one such powerful tool to help traders find potential entry points. We hope you understood this concept clearly. Let us know if you have any questions in the comments below. Do not forget to take the quiz before you go. Cheers!

[wp_quiz id=”64779″]
Categories
Forex Basic Strategies

Learning To Trade The Bullish & Bearish ‘Butterfly’ Harmonic Pattern

Introduction

Harmonic patterns have always been popular among a set of traders around the world. So it is essential to learn them to have an edge over the market. There are two different types of Harmonic Patterns. The first type is external, and the second is internal. External Harmonic patterns include Butterfly and crab patterns. Whereas the internal Harmonic patterns include Gartley and Bat patterns. In today’s article, let’s discuss how to trade the Butterfly pattern profitably.

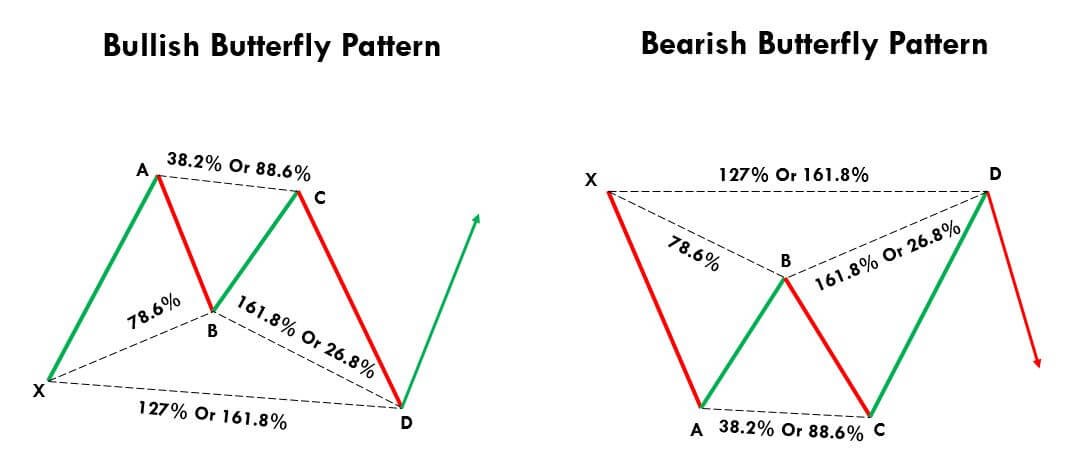
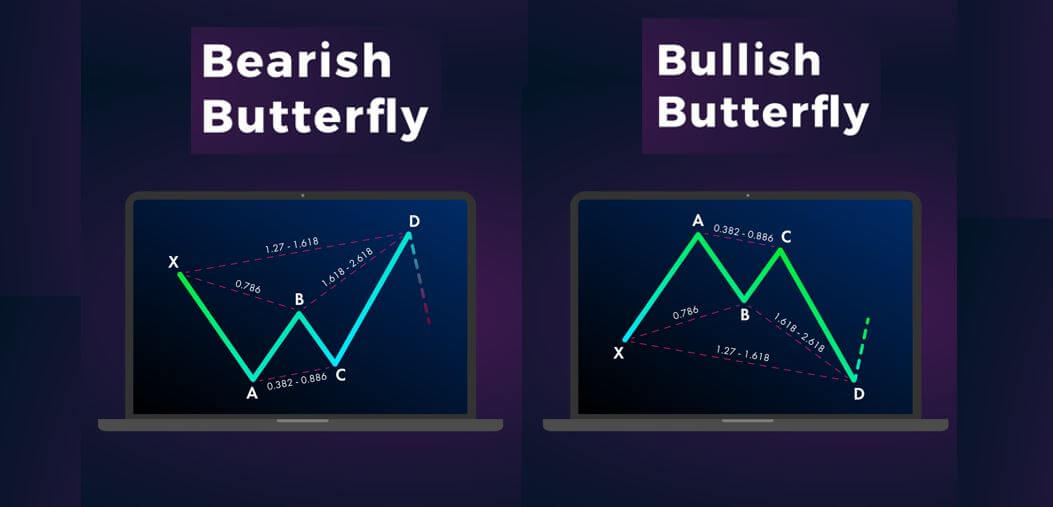
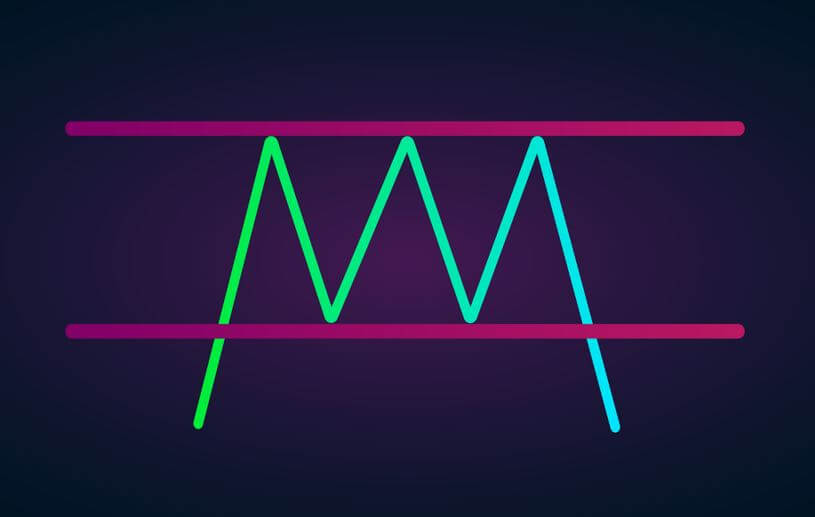
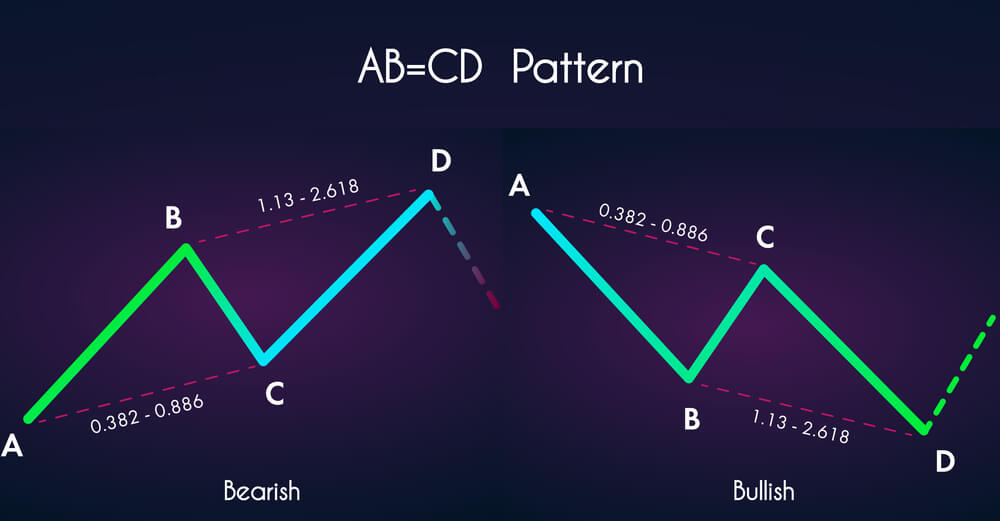
The Butterfly is both a bullish and bearish reversal pattern that falls into the category of the Harmonic group. It is developed by H.M Gartley. Scott Carney and Larry Pesavento then fine-tuned the pattern by adding the Fibs ratios. This harmonic pattern is composed of four legs, and they are marked as ‘X-A,’ ‘A-B,’ ‘B-C,’ and ‘C-D.’ The Butterfly pattern mostly appears at the end of the trend indicating a trend reversal.

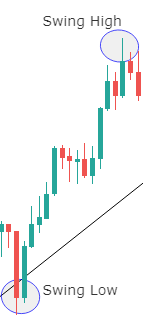
By identifying this pattern on the price charts, traders can enter a trade anticipating a potential market reversal. The Butterfly structure on the chart resembles the letter’M’ in a downward trend. Conversely, in an uptrend, the pattern looks like a ‘W.’

Butterfly Pattern Rules

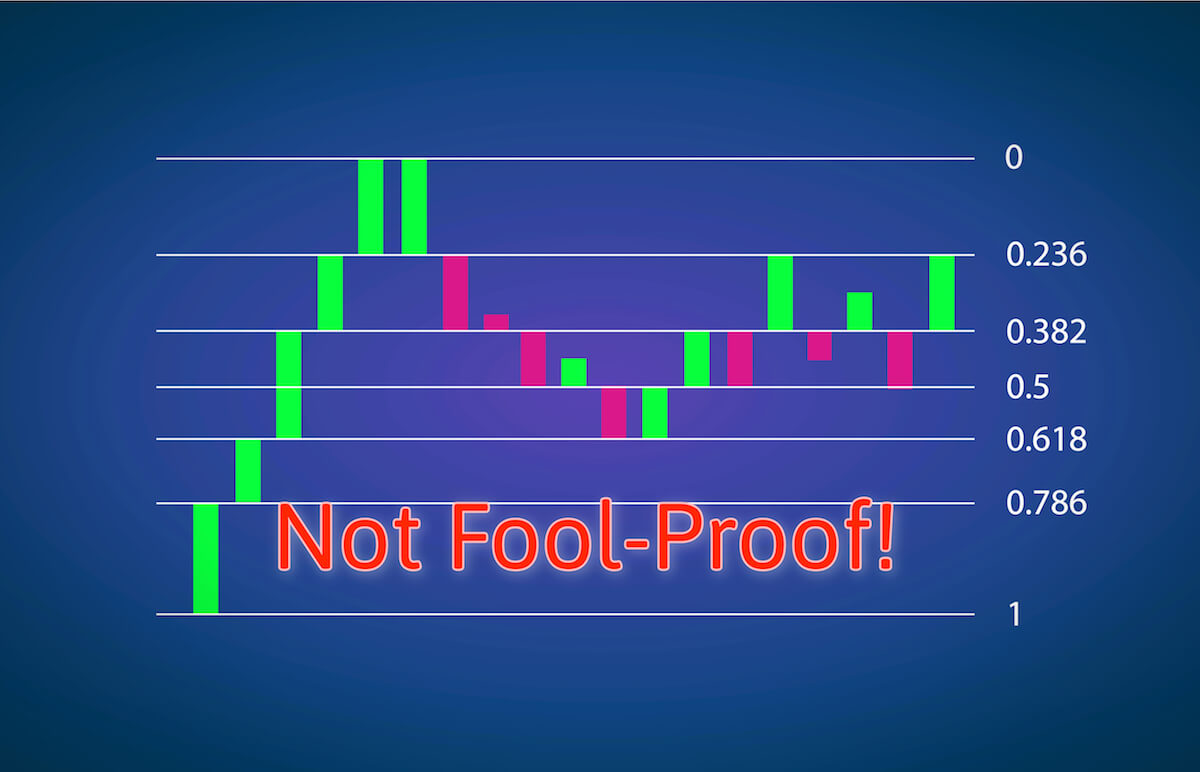
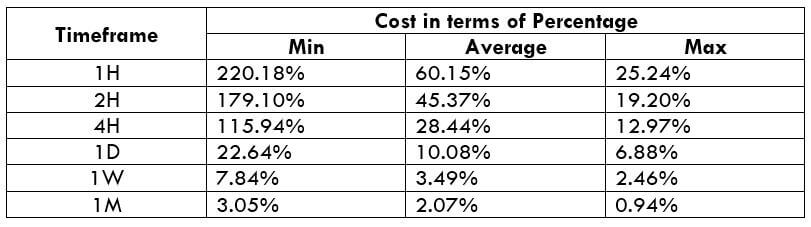
To confirm the appearance of the Butterfly pattern, the rules below must be met. Remember to accept the pattern even if the levels are closer to these Fib ratios. If we stick these levels only, we might be missing on well-performing trades as the setups with the exact Fib levels hardly occur.

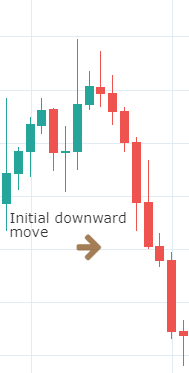
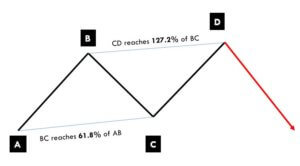
‘X-A’ – This is the initial move of the Butterfly pattern, and in a downtrend, this leg is formed when the price drops sharply from point X to A. Likewise, in an uptrend, this leg is formed when price moves up swiftly from X to A.

‘A-B’ – The B point should retrace 78.6% of X-A leg.

‘B-C’ – The B-C move should retrace 38.2% or 88.6% of the A-B move.

‘C-D’ – The C-D move is the final and most crucial move of the pattern. If the B-C is 88.6% of the A-B, then the C-D must be reached the 261.8% extension of BC. On the other hand, if the B-C is 38.2% of A-B, then the C-D must reach the 161.8% extension of B-C.

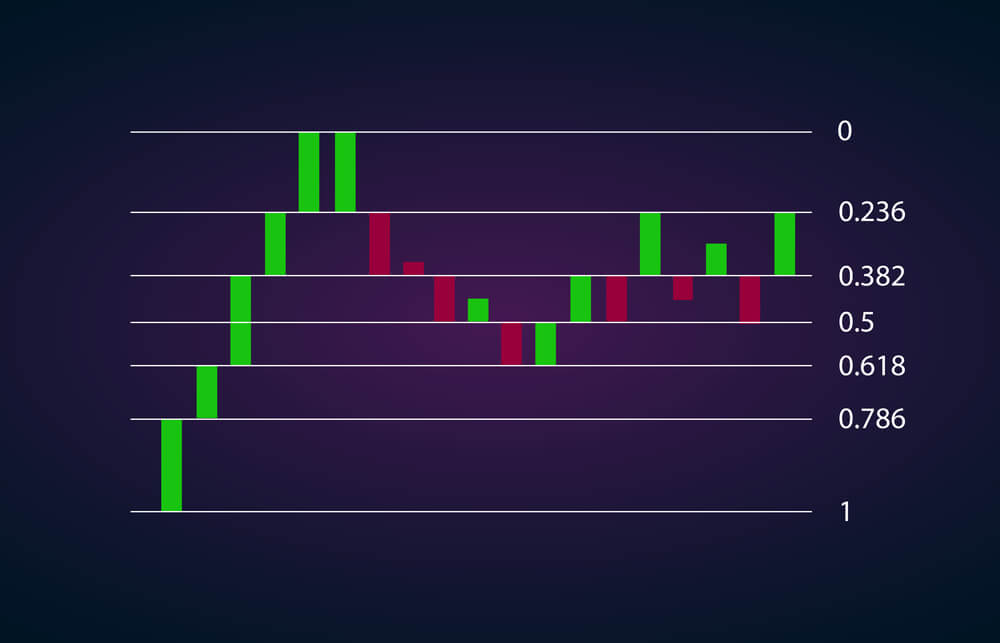
A pictographic representation of the same is shown below.

How To Trade The Butterfly Pattern

Trading The Bullish Butterfly Pattern

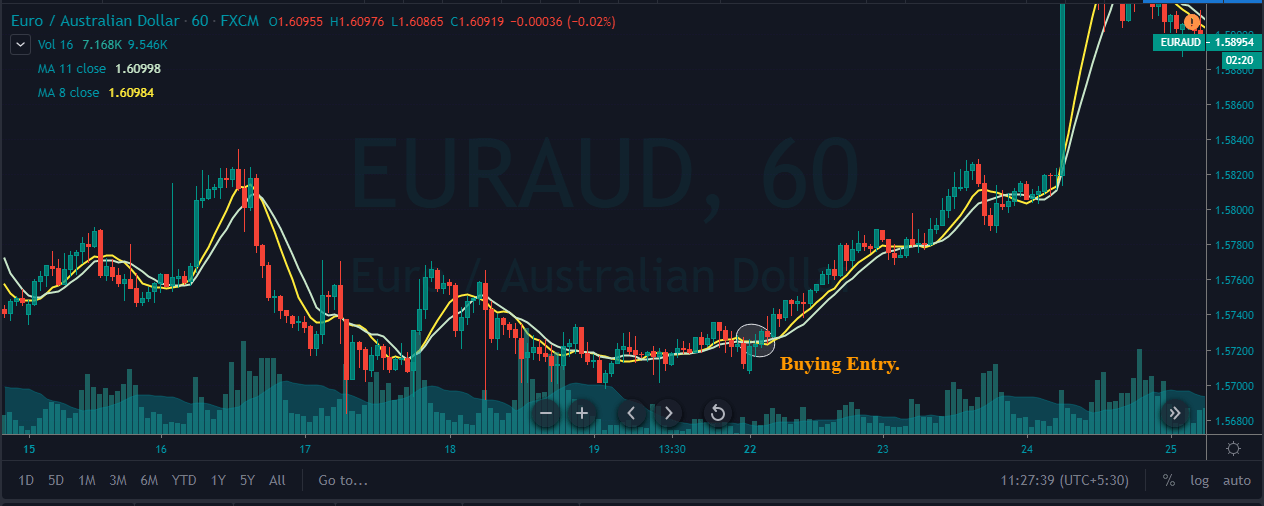
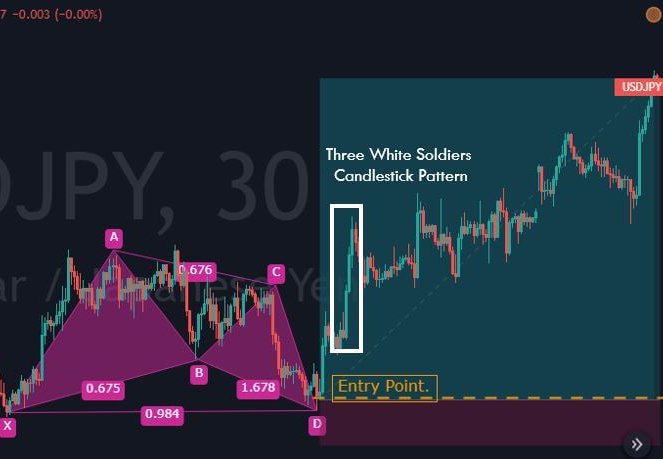
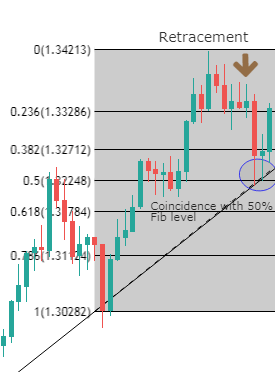
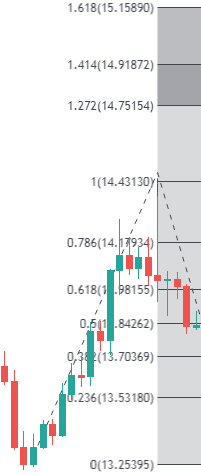
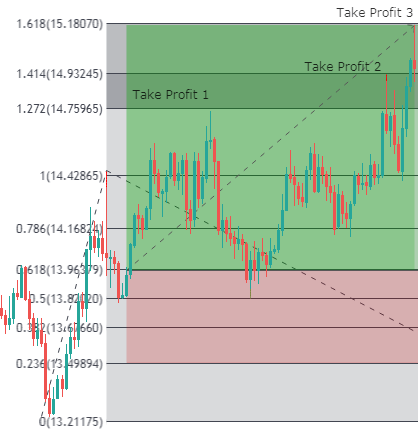
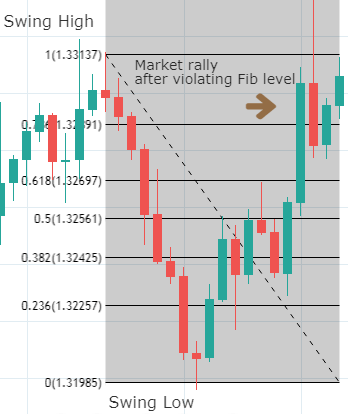
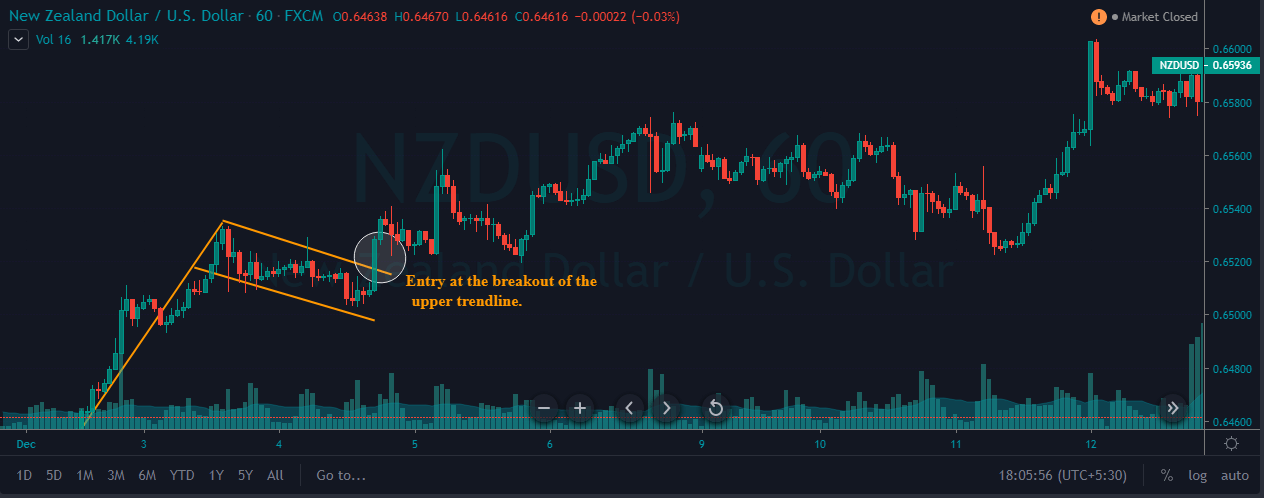
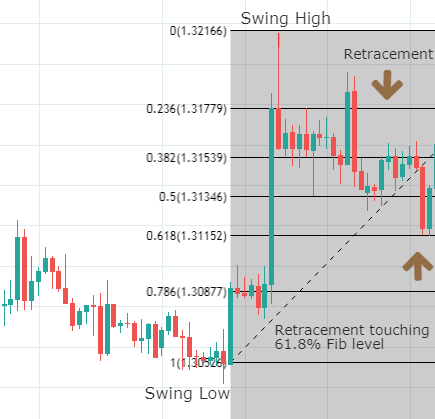
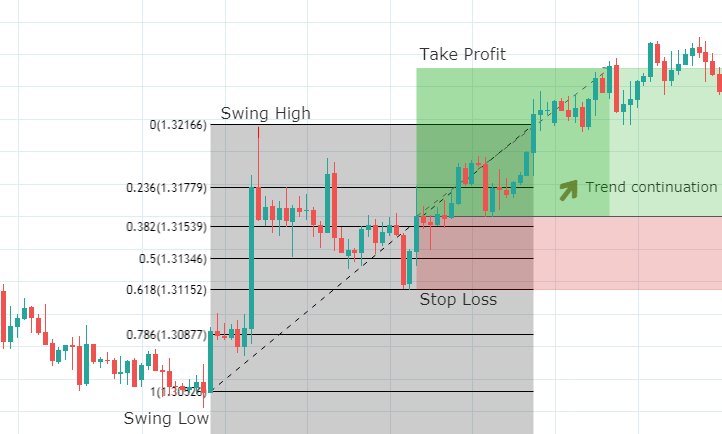
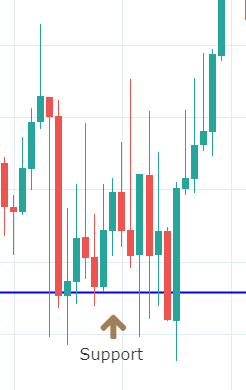
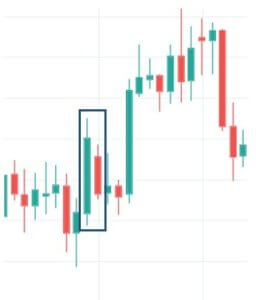
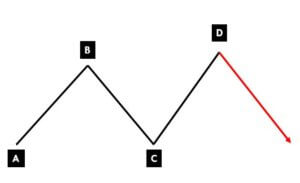
The below picture is a 30-minute chart of the USD/JPY Forex pair. We have identified the Butterfly pattern and plotted Fib levels on to that. As we can see, the first X-A leg started as a random bullish move on the price chart. The second A-B bearish move retraces close to the 78.6% of the X-A move.

Furthermore, the B-C moves reach close to 88.6% of the A-B move. The last C-D bullish move reaches almost close to the161.8% of the B-C movement. So after the appearance of all the four legs, we confirm the formation of the Bullish Butterfly Pattern. Now let’s how we are going to trade this pattern.

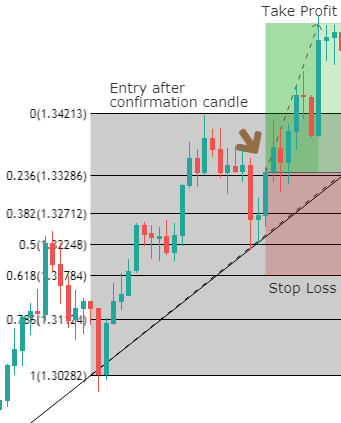
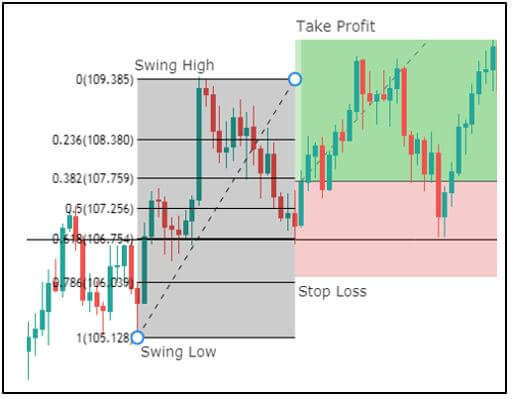
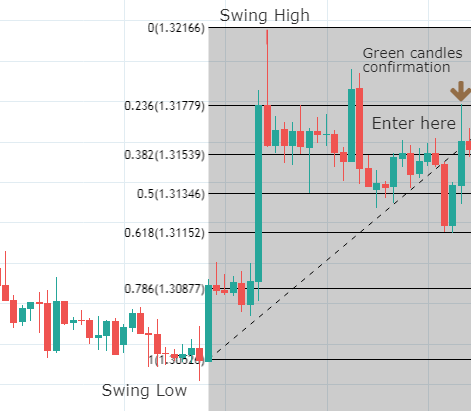
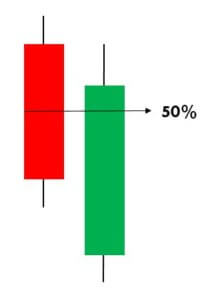
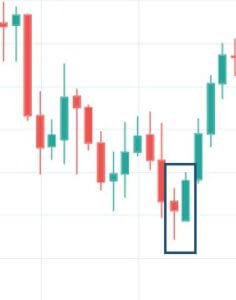
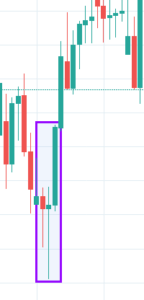
Once the price action completes the CD move, we must wait for 2 to 3 bullish candles to take a buy entry in the USD/JPY pair. We must enter the market right after the appearance of the Green confirmation candles. As we can see in the above image, the market blasted to the north right after the appearance of confirmation candles.

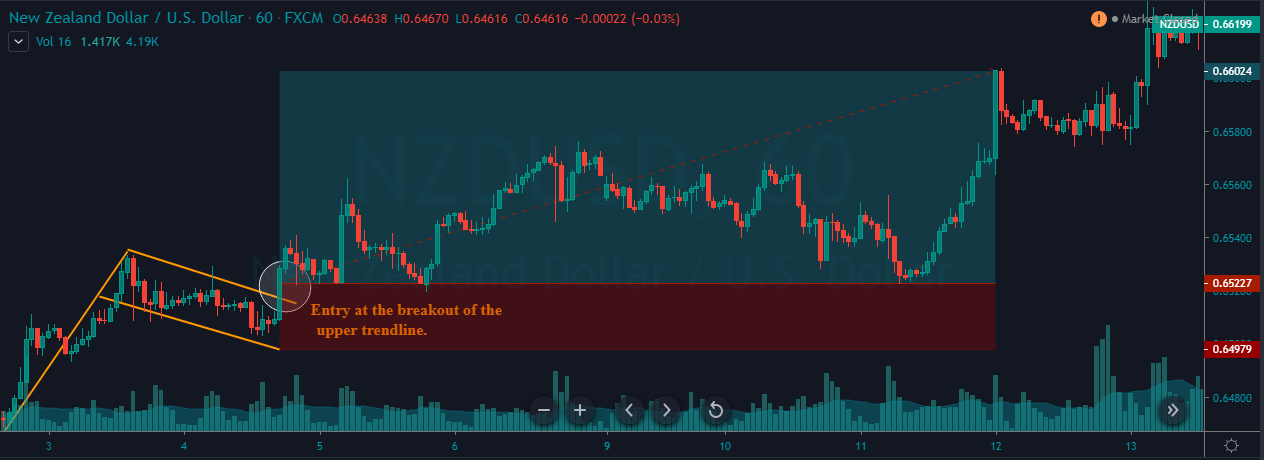
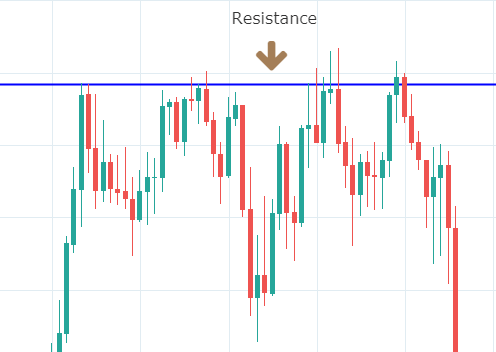
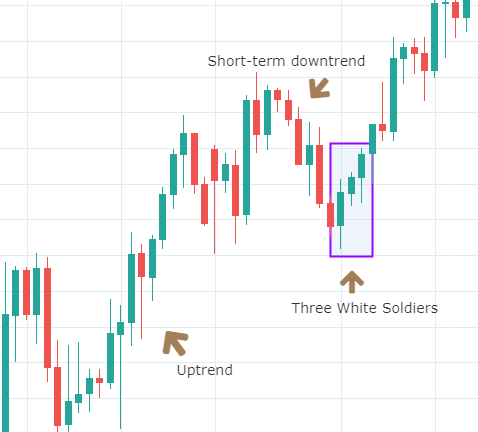
Always remember that we are dealing with probabilities and not certainty while trading. So as technical traders, we must adjust according to the market sentiment. The ideal way is to exit our positions when the price approaches the level of point A. But in this particular trade, the market shows excessive volatility as we can see the appearance of a ‘three white soldiers’ candlestick pattern. As per our learnings, we know when this pattern appears, the trend is going to continue.

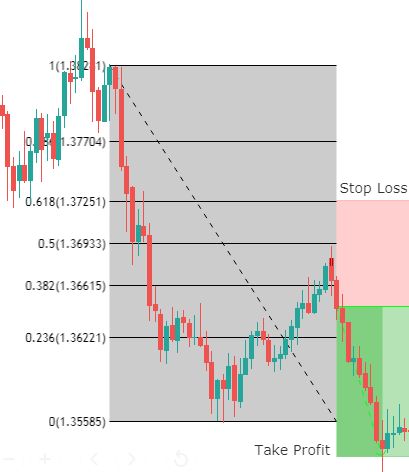
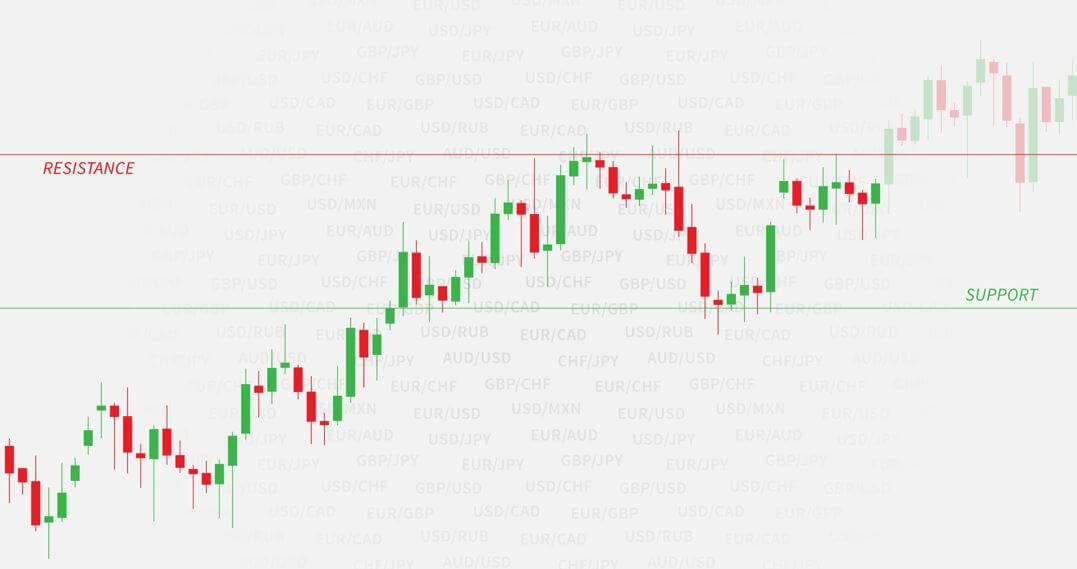
So we must place deeper targets in this Forex pair. That’s the reason why we didn’t book any partial profits and closed our whole position at a significant resistance area. So in any given trade, always decide your risk-management according to the market situation. Furthermore, we put the stop loss just below the X point, which is the safest position to set a stop-loss. Because, if the price breaks this point, directly it invalidates the Butterfly pattern.

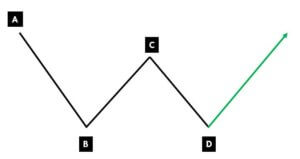
Trading The Bearish Butterfly Pattern

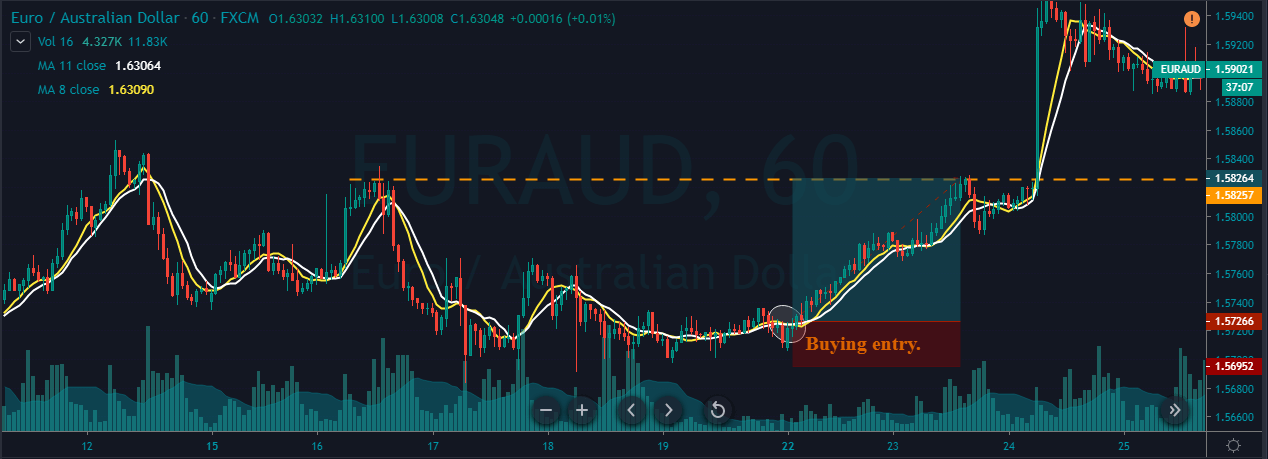
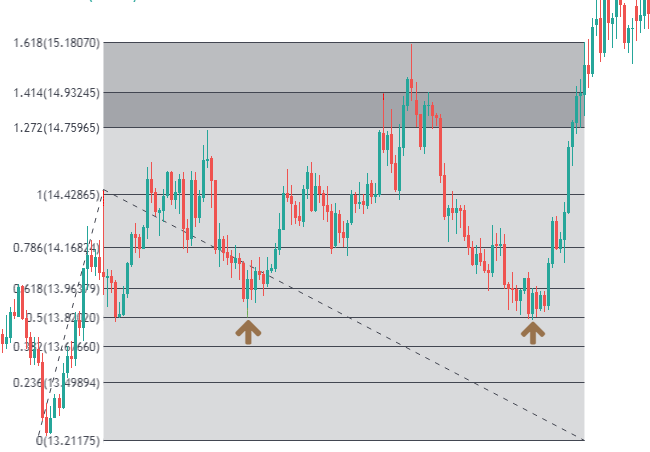
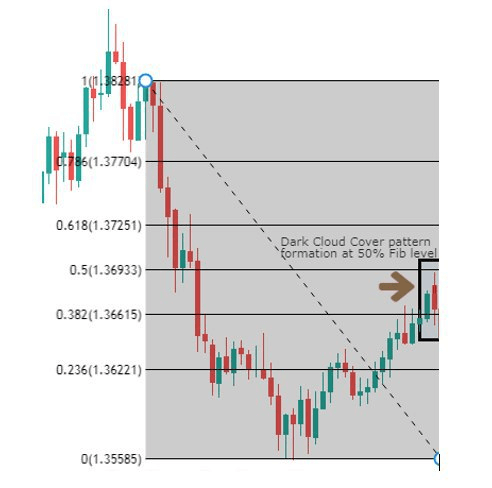
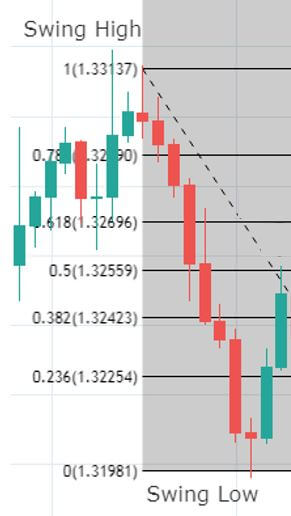
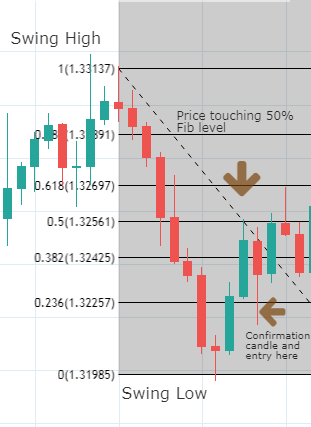
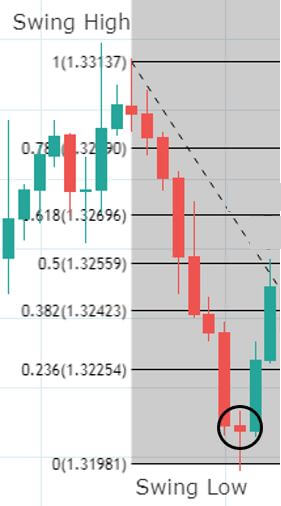
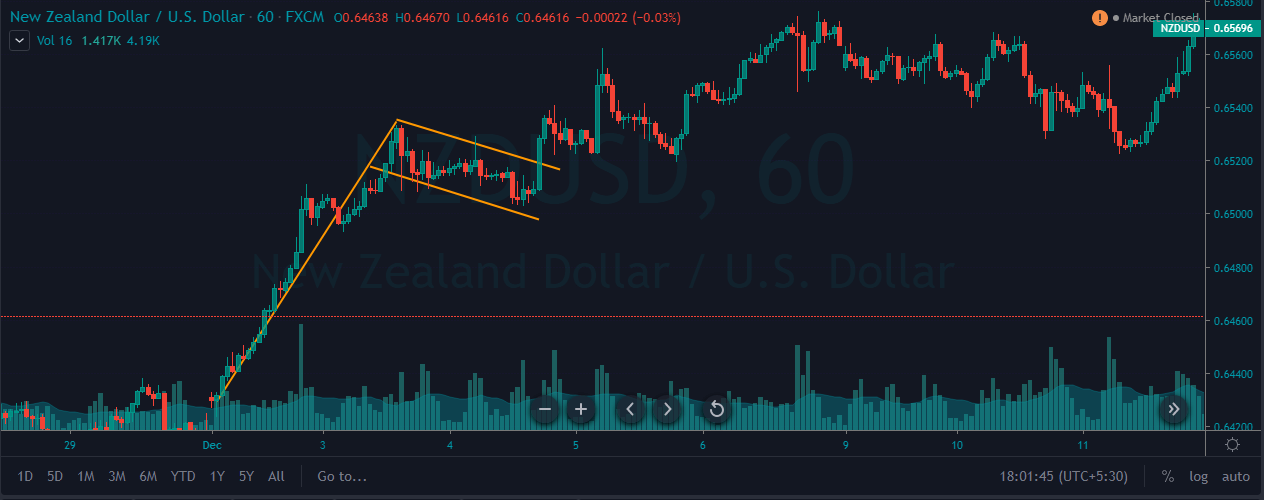
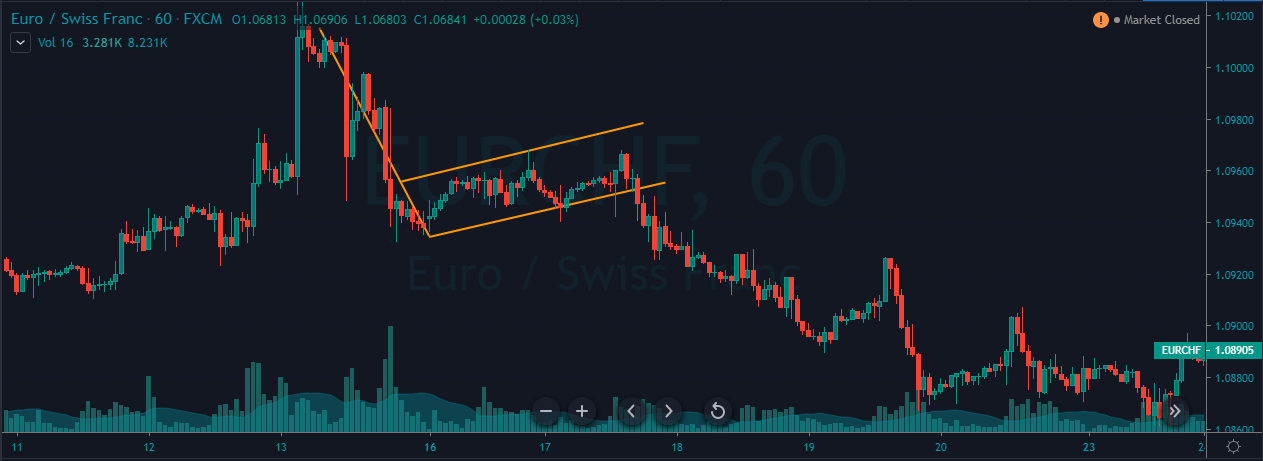
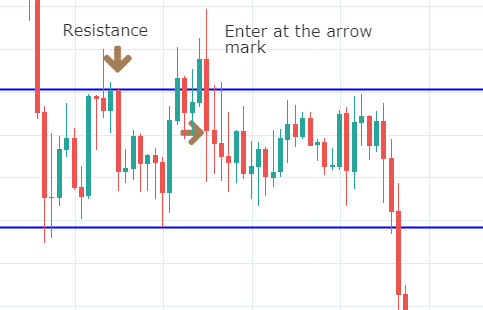
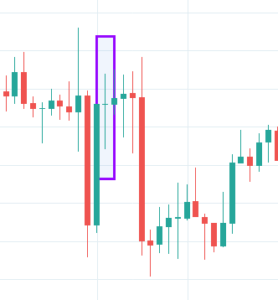
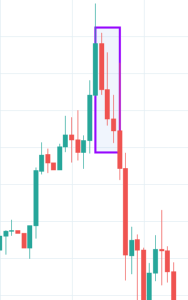
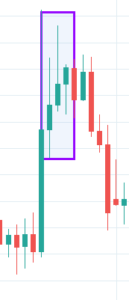
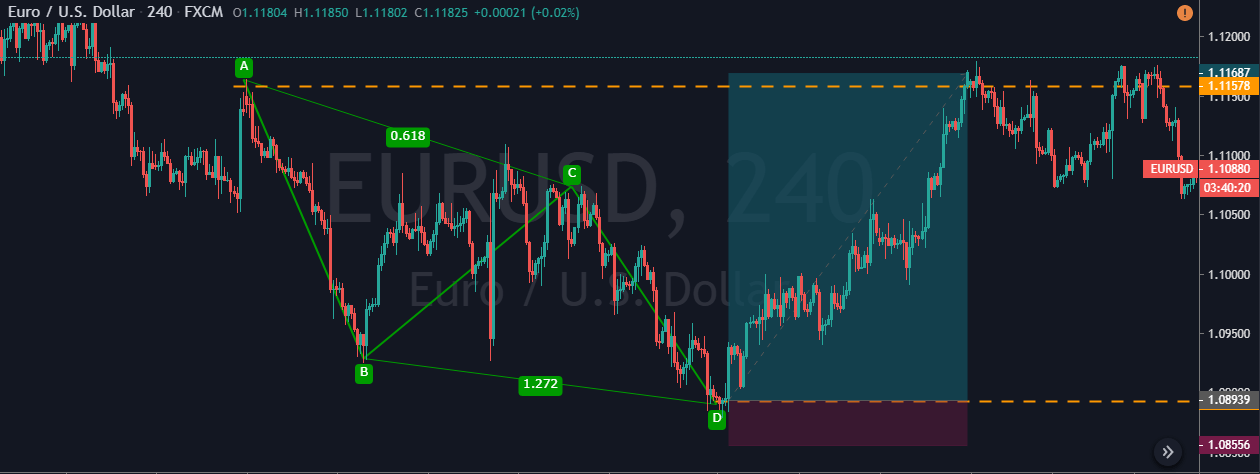
The below image represents the 240-min chart of the GBP/USD Forex pair. We have identified the formation of a Bearish Butterfly pattern in this chart. In a downtrend, the first X-A leg started as a random bearish movement in the market. The A-B leg is a bullish move that retraces close to the 78.6% of the X-A leg. Then the third B-C movement is the bearish move again, and it retraces close to the 38.2% of the A-B move. Then finally, the C-D move happened, which completes the formation of the Bearish Butterfly Pattern.

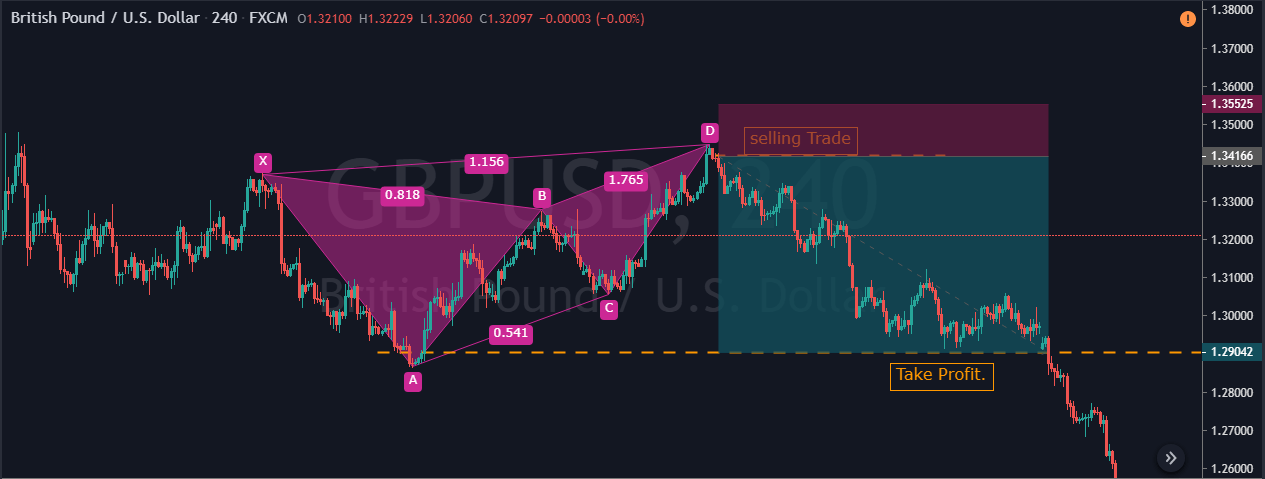
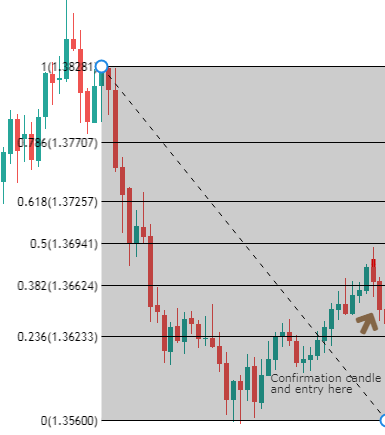
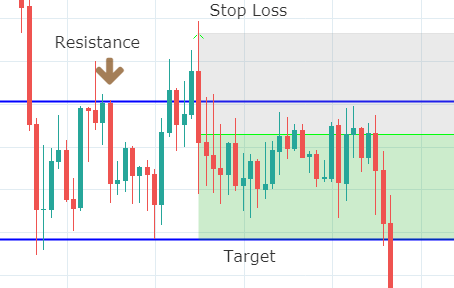
As we can see in the above picture, the last leg retraces to the upside, and it was close to the 161.8% extension of the BC move. When the price action completes the C-D leg, it prints a couple of red confirmation candles indicating a potential market reversal. Hence in this pair, we took a sell at D point, and the stop-loss placement was just above the D point. We didn’t book any partial profit at point B or C; instead, we closed our whole position at our final target, which is point A.

When and When Not to Trade The Butterfly Pattern?

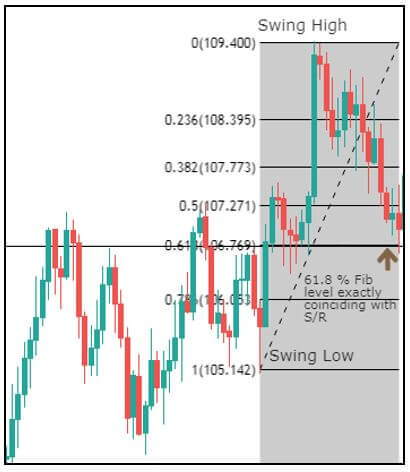
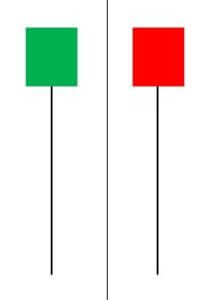
The good thing about Harmonic patterns is that they work very well in all the types of markets. They also work wonderfully in every market condition. We believe you have clearly understood that the Butterfly is a reversal pattern. We must use all of our previous learnings to win a trade. For instance, if a bullish Butterfly pattern is formed in a strong downtrend, try to avoid trading that pattern. This is because it is difficult for a single pattern to completely reverse the market trend.

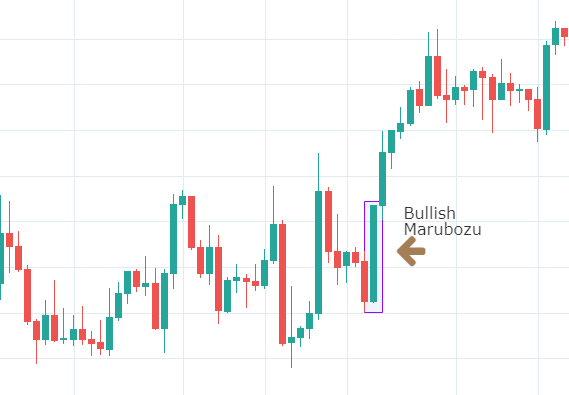
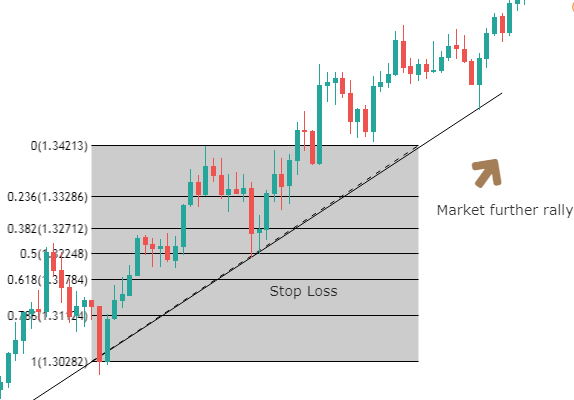
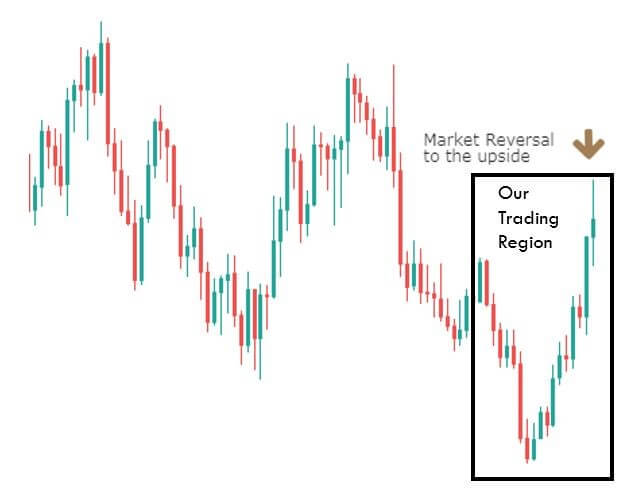
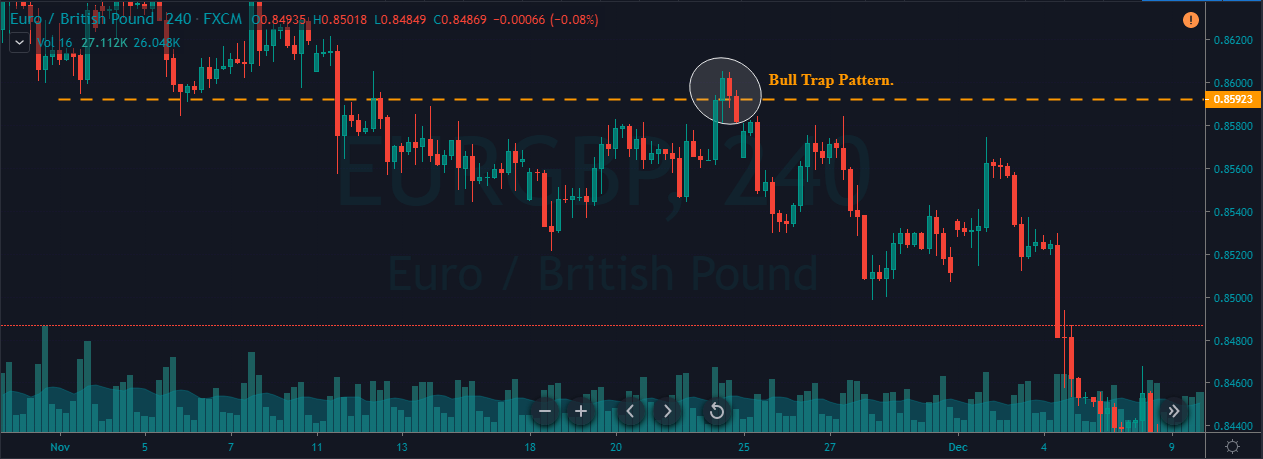
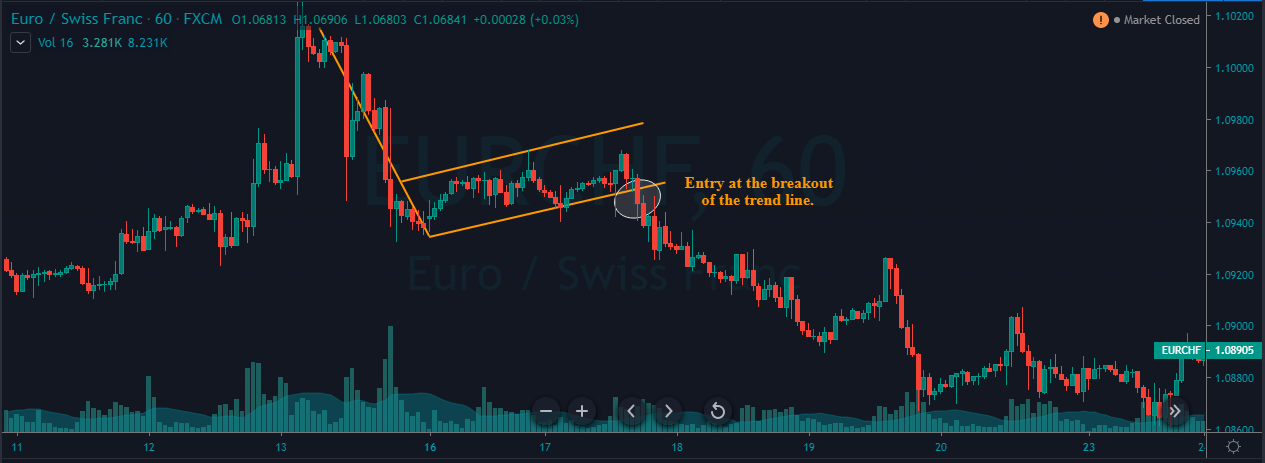
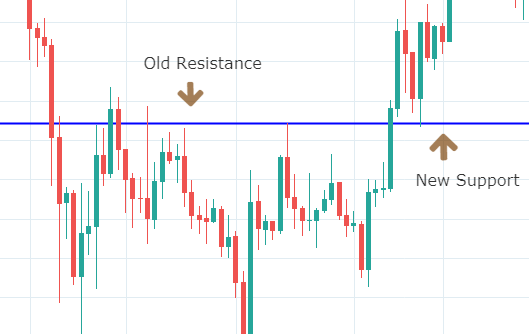
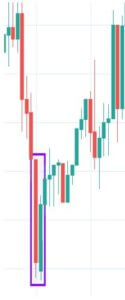
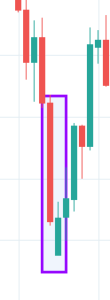
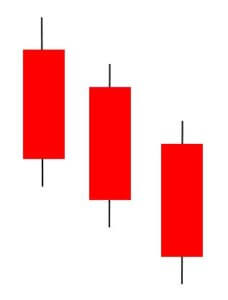
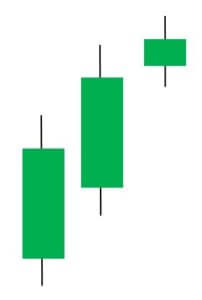
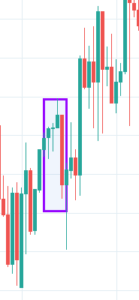
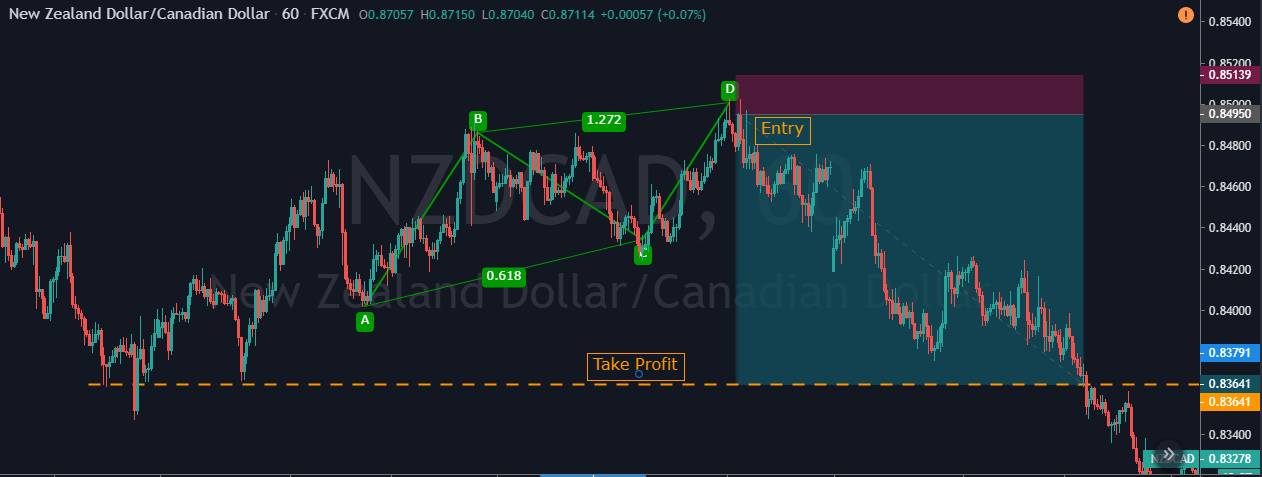
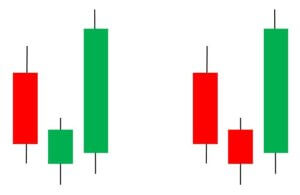
If the market was in an uptrend, which is now turning into a dying channel, and if we identify a bearish Butterfly pattern on the price chart, the probability of it being an accurate trading signal is more. Sometimes we can observe the market printing a pattern within the pattern. This also increases the likelihood of our trades. For instance, we can see the formation of a ‘Three White Soldiers’ pattern (below chart) in one of the examples we discussed.

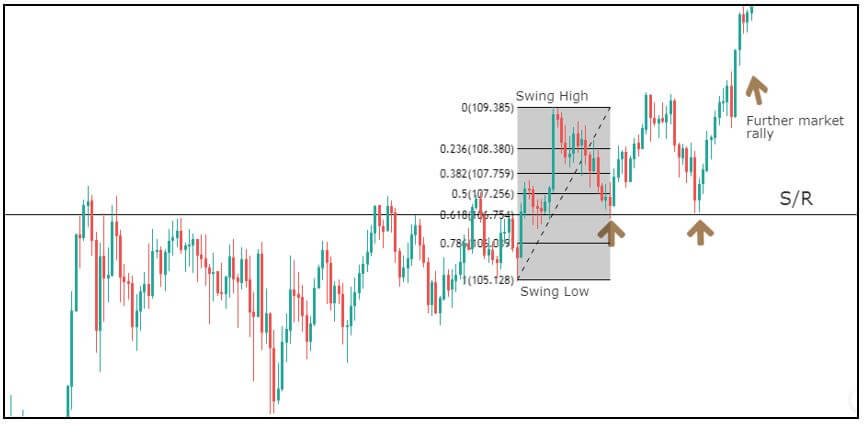
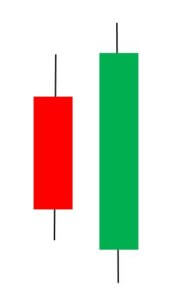
This example is not in the context of trading the Harmonic pattern as a whole but in the context of placing our take-profit orders while trading Harmonic patterns.

Alternative to Harmonic Patterns?

It is a bit difficult for new traders to learn and implement the Harmonic patterns on their trades. So, in the beginning, new traders can also use other forms of technical analysis tools to trade the market. These harmonic patterns are used by most of the professional traders in the industry as they provide an excellent risk to reward ratio. But once you gain some experience, you can try trading harmonic patterns on the demo account, and if you are confident enough, you can apply them to the live charts.

In the end, price action trading is the only tool which can be considered as a complete alternative to the harmonic pattern trading. But a large part of the traders in the industry does not know how to use price action alone to trade the market. So for them, candlestick pattern trading combined with technical indicators is the best method to trade. Overall, yes, there is an alternative to harmonic pattern trading. However, most of the traders in the market aren’t aware of it.

Bottom Line

The one main benefit of identifying and trading the Butterfly pattern is that it helps the traders to identify the top and bottom of the price action so that they can ride the whole trend. The Butterfly pattern is the easiest one in the harmonic group, which provides highly profitable trading signals. The Fibonacci extension levels are an integral part of trading the Butterfly pattern. If the Fib ratios are not attached to your pattern, make sure to add the fibs manually to your price chart so that you can visualize the pattern correctly. Best of luck!

Categories
Forex Course

67. Using Fibonacci Extensions To Place Accurate Take-Profit Orders

Introduction

We have discussed the many applications of the Fibonacci levels in our previous course lessons. Now its time to explore the scope of these levels in the most integral part of trading, which is money management. We are all familiar with the ‘take-profit’ order and also know how crucial it is to determine the same before entering a trade.

There are numerous ways to determine the ‘take-profit‘ levels to maximize our profits, but the Fibonacci levels are said to be extremely accurate. In this article, we will validate the accuracy of the Fibonacci indicator in determining the ‘take-profit’ levels.

Placing Accurate Take-Profit Order Using Fib Levels

To find a trade, we need first to establish a significant trend. The primary trend could either be a continuation of a previous trend or beginning of a new trend after a market reversal. In the below chart, we can observe the market reversal to the upside. We must wait for its retracement; if the retracement follows all the rules of our Fibonacci strategy (discussed in the Fibonacci article), we can proceed to take the trade.

In the below image, we can notice a pullback coming in from the swing high. We will be evaluating this swing high using the Fibonacci levels. The Fibonacci levels used in this particular strategy for determining the accurate ‘take-profit’ placement are different from the usual Fibonacci levels we used in all the previous articles.

We are going to use ‘Fibonacci Extensions’ instead of retracements here. These extensions can be plotted on to the charts by using an indicator that can be found in most of the trading platforms. We use the Tradingview platform for our charting purpose, and this indicator can be found on the drawing panel of TradingView. It is available in the sub-menu of the Fibonacci tool folder and named as ‘Trend-Based Fib Extension.

To plot Fibonacci extension on the chart, first, click on a significant low, then drag the cursor and click on the recent high. Finally, drag the cursor back to the swing low. We can also highlight the Fib ratios by clicking on the retracement levels. Don’t forget to include the Fib ratios on the chart that are above 100%, as our take-profit methodology is based on those ratios.

The below chart shows how the Fibonacci Extensions are plotted on the chart using the swing low and swing high. We also see from the chart that the retracement is exactly reacting from the 50% Fib levels, which could a sign of trend continuation. But to be sure, it is prominent to have a confirmation candle at this place.

We get a bullish confirmation candle in the direction of the dominant trend, after which a potential trade entry can be made to the ‘buy’ side.

Right after entry, it is essential to determine our take-profit and stop-loss areas. Here is the part where we will be using our Fibonacci Extensions. The strategy is to take some profits at 127%, and then at 141% and remaining profits at 161%.

The take-profit points are clearly shown in the below chart. One can see that the market falls exactly after touching the respective Fib extension levels. By following this method, one can maximize their gains by taking profits at every subsequent point. The risk to reward ratio in this trade is also outstanding.

The below chart shows that the market continues to take support at the 50% fib level and eventually breaks out above our final take-profit order. The trend has completely reversed from a downtrend to an uptrend.

Conclusion

The Fibonacci tool can be used to find potential exit points in a trade with a great degree of accuracy. Hence, rather than taking a simple approach to determining the target points of the trade, we must make use of Fibonacci Extention levels to maximize our grains. Please remember that these extensions are not guaranteed levels too. So it is important not to depend upon them completely. Cheers!

[wp_quiz id=”64724″]
Categories
Crypto Guides

5 Things To Consider Before Investing In Cryptos

Introduction

Cryptocurrencies have been buzzing our lives continuously ever since the Bitcoin boom at the year-end of 2017. The people who didn’t give a serious thought about investing in cryptos before that period has started taking it seriously, at least after that boom. One thing is for sure. Cryptocurrencies are here to stay; there is no doubt about that.

Hence, it is common for a potential investor to think if they should be investing in cryptos or not. Our answer is ‘Yes,’ they should be. However, investors should be very careful before investing in this space. So, we are providing some tips and considerations one should ponder upon before venturing into the world of cryptocurrencies.

📋 Always invest the money which you are ready to lose

We all save money for a rainy day. We are always advised by our parents when we start our financial life to save at least 10% of your paycheck. We never know what unexpected expenses pop up, and we should be able to face them without any inconvenience; otherwise, it is easy to fall in a debt pit.

Hence don’t ever invest in cryptocurrencies from your savings. We never know how the highly volatile markets of Cryptos will treat us. Always invest the money which you are ready to lose so that you don’t sell off your investments at the wrong time only because you need money.

📋 Do your research

Don’t invest in anything just because your friends/colleagues/cousins are doing it. Do your research before you venture into something new. Only after getting enough knowledge and when you think you have a grip on it, (like – when to buy and when to sell) start investing in cryptocurrencies. It is always advisable to start with the prominent ones like Bitcoin and Ethereum.

Then gradually jump into the niche coins if you want to. When one would like to invest in niche coins, it is better to go through the white paper, the tech behind the new currency, people who are developing the coin, etc. so that you will be aware if it is a scam. As the crypto industry is full of scams and fraudsters, we should be very cautious.

📋 Diversifying your investments

When people start out investing in cryptocurrencies, most of them start with Bitcoin and stay with Bitcoin only. There are many other coins other than Bitcoin. Try to invest in at least ten coins that have huge potential. You can check the market capitalization or pick the currency based on the number of coins in circulation. So that you won’t lose all your money when the value of a single coin has fallen.

We are all familiar with the saying, ‘Don’t put all your eggs in a single basket.’ Hence don’t invest all your money in only Cryptocurrencies. It would be helpful if you diversified the investment portfolio. You may invest in potential markets like Stocks, Mutual funds, Real estate, Bonds, etc. Since the cryptocurrency market is extremely volatile, it is advised that you may consider investing 10% of your portfolio in this space.

📋 Securing your coins

Once you invest in cryptos, you better don’t leave them in your accounts in the exchange. All the hacks that ever happened on cryptos happened on only exchanges so far. We have a variety of wallets to choose for, say paper wallets, electronic wallets, hardware wallets, desktop wallets, mobile wallets, etc. In turn, you can choose different wallets to use as well. For a long term investment, you may choose hardware wallets while for the short-term traders, mobile wallets can be used as they are easily accessible.

📋 Track the investments

Once you invest in cryptos, you should start tracking the performance of the coins so that you would be informed all the time. We have apps to monitor the same where we must enter the coin name, the number of coins purchased date of purchase, and other minor details. Apps like Blockfolio and Bitmap can be considered for this purpose.

While these are the essential points to consider, alternatively, you can follow people on different platforms who are best in the said fields, which reaffirms your learnings. Don’t sell off all your crypto investments when you say huge profits, try to sell on a percentage basis so that you can cash in on when there is a spike. At the same time, one will have money to buy in dips. Finally, be proud that by investing, you are a part of the crypto revolution. Cheers!

Categories
Forex Course

65. Combining Fibonacci Levels With Candlestick Patterns

Introduction

In the previous lessons, we understood how Fibonacci levels could be combined with trendlines to generate confirmation signals. After discussing many applications of the Fibonacci indicator, we are now ready to explore some complex strategies using these levels. In this lesson, we will be discussing how the Fibonacci levels can be used with Japanese candlestick patterns.

The candlestick patterns are an intrinsic part of trading, and we cannot ignore them. We have learned many candlestick patterns in the previous lessons, and you can find them starting from here. We have also learned that these patterns can not be used stand-alone, and we should be using any reliable indicators to confirm the signals generated by these patterns. So we will be using Fibonacci retracements to confirm the opportunities generated by the chart patterns.

For the explanation purpose, let’s discuss one of the most reliable candlestick patterns – Dark Cloud Cover. To know more about this pattern, you can refer to the second part of this article. We will be trading the market today by combining both Fibonacci levels and the Dark Cloud Cover pattern.

Strategy – Dark Cloud Cover Pattern + Fibonacci Levels 

For explaining the strategy, we considered a downtrend, on which we will be plotting our Fibonacci indicator and later evaluate its retracement. The below chart shows the same with a trading region in which we will be identifying our swing high and swing low. We will also see if the retracement shown in the chart is going to react at the important Fib levels.

In the below chart, we can see the market has moved down quite swiftly from the swing high to swing low. This shows the strength of the underlying downtrend. Trading a retracement of a strong and big move on any side is always preferable. The next step is to plot the Fibonacci levels on the chart.

After the Fibonacci indicator is rightly plotted as shown in the below chart, let’s see what happens at the important Fibonacci levels, such as 50% or 61.8% level. In the chart below, we see that the last Red candle of the retracement exactly touches the 50% level and closes midway of the previous Green candle.

These two candles together remind us of one of the very well known candlestick patterns – The Dark Cloud Cover. More importantly, this pattern is formed exactly at the 50% Fib level. So if we get a confirmation to the downside, it could result in a perfect setup to go short on this pair.

In the above picture, we can clearly see the formation of a bearish confirmation candle. So we can confidently take short positions in the market by placing a stop-loss near the 61.8% level with a target below the recent low.

The above chart shows how the trade works in our favor by hitting our pre-determined ‘take profit.’ We can see that, right after the entry was made, the market moves so fast in the direction of the trend producing continuous red candles. This shows the accuracy of candlestick patterns when combined with indicators like Fibonacci. Since the market is still in a strong downtrend, aggressive traders can take profit at the second or third swing low of the trend, after crossing the initial ‘take-profit.

Conclusion

From the previous articles, we have seen how the Fibonacci tool can be used with support resistance levels, trendlines, and now even candlestick patterns. By this, we can be assured that the Fibonacci tool is potent and should never be underestimated. Instead, we recommend you to widen its usage in technical analysis to identify more accurate trading opportunities.

[wp_quiz id=”64541″]
Categories
Forex Basic Strategies

Trading The Bullish & Bearish ‘Cup and Handle’ Pattern

Introduction

The patterns on the Forex charts occur when the price movement of an underlying asset is in the form of the shapes that we come across in daily life. These are visual patterns, and they provide a logical entry point along with appropriate stop-loss and take-profit order placements. The Cup and Handle is one such pattern; this is one of the oldest chart pattern identified by technical trading experts back in the late 20th century. This pattern is very reliable and very commonly used by traders across the world.

American trader and author ‘William J. O’ Neil’ defined the Cup and Handle pattern in his 1988 classic, “How to Make Money in Stocks.” This pattern occurs in all the types of the markets and is not confined to Forex or Stocks. We can also find this pattern in almost all of the timeframe. Most traders prefer trading this pattern on a higher timeframe. Having said that, this pattern produces reliable trading signals on the lower timeframes as well.

The Cup and Handle is a continuation pattern that occurs after the ongoing bearish or bullish trend. In an uptrend, when the price action reaches a peak point, if there is a price wave down, followed by a rally (approx. the same size of the wave down), this pattern is formed. It means that the price action has created a U-Shape or the Cup, and the Handle is for the confirmation and entering the trade. After the Cup, most of the time, price action turns sideways, or it drifts downwards that appear in the form of a handle on the price chart.

According to market situations, the Handle takes different forms. It prints in the form of a triangle, rectangle, or even congestion. The critical point for the Handle is that its extension shouldn’t be smaller than the Cup. The Handle should not even drop into the lower half of the Cup. For instance, if a cup forms between 0.1000 and 0.1100, the Handle must not go below 0.1050. Identifying the Cup and Handle pattern on the price charts is easy compared to the other patterns that we have discussed until now.

The Cup And Handle Pattern – Trading Strategy

Buy Example

The below image represents the formation of a Cup and Handle pattern on the EUR/USD 15 minute chart. The highlighted part in the below chart is the Handle, and we can see the Cup on to its left.


There are many different ways to enter a trade using this pattern. In this particular example, let’s learn the most common way, which is the breakout method. A lot of advanced traders prefer trading the breakouts as they are reliable and work pretty well with the Cup and Handle pattern as well.

In the above chart, we can see that we had entered the market by placing a buy order when the price broke the primary resistance line. Now we can see why breakout trading is very reliable while trading this pattern. Our take-profit order was at the major resistance area, and stop-loss was just below the Handle. Here, we have seen how to trade this pattern for intraday trading. However, if you are a swing trader who plans to hold your position for more extended targets, please check out the next example.

Sell Example

In the below NZD/CAD 15 min Forex chart, we can observe the formation of an inverted Cup and Handle pattern.

Right after the formation of the Cup, the price moved in sideways and resulted in a handle-like structure. After struggling a bit, the price broke the support line and made a new lower low. We have taken the entry in this pair after the appearance of a bearish confirmation candle. Right after our entry, we can see the market dropping down and printing a new low.

As a basic rule, the stop-loss placement was just above the Handle, and we ride more extended targets in this pair. We closed all of our positions when the market had a hard time print a new lower low. If you are a trader who likes to ride deeper targets, close your position when you see a consolidation. The reason is that a consolidation phase implies that both the buyers and sellers are strong. So at that point, it is not easy for the price to print a brand new lower low.

Limitations Of The Cup and Handle Pattern

Everything strategy or a pattern will have some limitations to it, and the Cup and Handle pattern is no exception. Market experts believe that this pattern is unreliable to trade in an illiquid market. The depth of the Cup plays a significant role in the strategy to perform. If the depth of the Cup is more, it might generate false trading signals.

This pattern can be found quite often on a lower timeframe. Most of the time, on lower timeframes, the Cup forms without the Handle. So make sure to pair this pattern with other reliable indicators or price action techniques to filter out the false signals.

Bottom Line

William O’Neil spent 20 years to broaden his views towards various patterns and ways to trade them. The Cup and Handle pattern is one of the results of all that fantastic experience. His broader view allowed him to shift his attention from the classical trading patterns to wonderful patterns like these. Remember that you need to be at least a little better than the other traders out there to ace the market.

Hence it is important to have a different point of view that millions of traditional retail traders out there. The problem with the setup is that most of the traders use a similar approach to exit their positions. The way we showed you to close the positions when the market turns into consolidation is one such creative idea that we have to follow to have an edge. All the best!

Categories
Forex Assets

Assessing The USD/UAH Exotic Forex Currency Pair

USD/UAH is the abbreviation for the currency pair US dollar against the Ukrainian Hryvnia. It is classified as an emerging currency pair. The volatility, liquidity, and volume in this pair, is significantly low. In this pair, the US dollar is the base currency, and UAH is the quote currency.

Understanding USD/UAH

The value of the pair as a whole represents the value of UAH that is equivalent to one US dollar. It is quoted as 1 USD per X UAH. For instance, if the value of USDUAH is 24.19, then about 24 Hryvnias are required to purchase one US dollar.

Spread

The difference between the bid price and the ask price is referred to as the spread. Spread usually varies from broker to broker, and also on the execution model used by the brokers.

ECN: 20 pips | STP: 23 pips

Fees

As the name pretty much suggests, the fee is the charge paid to the broker on each trade. Below is the fee on ECN and STP accounts.

ECN – 5-10 pips | STP – 0 pips

Slippage

Due to the changes in the volatility and the broker’s execution speed on the trade, a trader does not get the exact price he needed. And the difference between the two prices is called slippage.

Trading Range in USD/UAH

Risk management is a vital factor in trading. The trading range is a tabular representation of the pip movement in a currency pair in different timeframes. And these values help in determining the gain or loss on a trade.

Note: The product of the pip movement value and the pip value (per standard lot) yields the profit/loss in a trade for a particular timeframe.

Procedure to assess Pip Ranges

  1. Add the ATR indicator to your chart
  2. Set the period to 1
  3. Add a 200-period SMA to this indicator
  4. Shrink the chart so you can determine a large time period
  5. Select your desired timeframe
  6. Measure the floor level and set this value as the min
  7. Measure the level of the 200-period SMA and set this as the average
  8. Measure the peak levels and set this as Max.

USD/UAH Cost as a Percent of the Trading Range

The total cost of a trade is determined by the sum of the spread, slippage, and the trading fee. And this varies from time to time, based on the volatility of the market. Below are the tables that represent the costs for different volatilities and timeframes.

ECN Model Account

Spread = 20 | Slippage = 3 |Trading fee = 5

Total cost = Spread + Slippage + Trading Fee = 20 + 3 + 5 = 28

STP Model Account

Spread = 23 | Slippage = 3 |Trading fee = 5

Total cost = Spread + Slippage + Trading Fee = 23 + 3 + 5 = 31

The Ideal way to trade the USD/UAH

Firstly, the percentage values depict the cost variation on the trade. The magnitude of the percentage is directly proportional to the cost of the trade.

We can see that the minimum pip movement in 1H, 2H, and 4H timeframe is 0 pips. So, it is pointless to trade in the lower timeframes. However, one may trade this pair on the higher timeframes, like the 1D, 1W, and 1M. To reduce costs even further and to have decent volatility, one may preferably trade when the volatility of the market is above the average values.

Furthermore, limit orders is another way through which a trader can bring down their costs considerably. This is because limit orders, unlike the market orders, do not have any slippage on it. For instance, the total cost on an ECN account for limit orders would be,

Total cost = Spread + Slippage + Trading Fee = 20 + 0 + 5 = 25

Corollary

We can see that on average volatilities, it almost takes a week range to cover the costs if the trade goes in the direction of the trade.  That means this pair is unsuitable to trade short-term. The use of limit orders to catch the price entry at the absolute minimum of the week, combined with ultra-reliable timing, is the only way to succeed. There are lots of better pairs to choose from.

Categories
Forex Basic Strategies

Identifying & Trading The Bull Trap Pattern In The Forex Market

Introduction

A Bull Trap is one of the unique patterns that can be found in the Forex market. This pattern is comprised of two highs were the second high is failing to hold higher, and as a result, prices push to the new low. Unlike most of the patterns, a Bull Trap pattern generates false buying signals and indicate us to be cautious when we identify this pattern on the price charts. Hence it is also known as a whipsaw pattern.

The up-move that happens trick the buyers & investors into making bullish trades as they look identical to a buy signal. But the signal is not real, and they end up generating losses on long positions. Traders must seek confirmation after the breakout so that they can filter out these false buying signals and escape the Bull Trap. Bear Trap is the opposite of the Bull Trap pattern, which occurs when sellers fail to hold the prices below the break down level.

Psychology Behind The Bull Trap Pattern

The markets will be in a downtrend printing brand new lower lows & lower highs continuously. The price action then hits the major resistance level and starts pulling back. When the pullback begins to struggle, some of the aggressive traders and investors tend to take their long positions. Then, suddenly, one strong candle breaks the resistance line with power.

At that stage of the market, emotions are on a peak point, so as a result, most of the traders take buy entries believing the breakout. The market then prints one red candle, and the price action respects the resistance level and starts to hold below the resistance level. At this point, most of the trader will be hoping for the market to go up, but the prices roll into the sell-side.

How Does The Bull Trap Occur?

Example 1

As we can see in the below 15-minute EUR/JPY Forex chart, price action hits the resistance line twice, but both the times it failed to break the line. However, the third-time, price action broke the major resistance line with power. This would have resulted in most of the traders taking their long positions. When the four small candles held above the resistance line, it gives extra confirmation to the traders to buy this currency pair, but that was just a trap by the sellers. After some time, the price action dropped back, and that would affect most of the traders’ emotions negatively.

This kind of situation is common, and sometimes novice traders tend to immediately jump to the opposite side. But for professional traders, their emotions never play a role in decision making. So never take the opposite trade if that is not a part of your plan. In the above chart, we shouldn’t be going short unless the second or third bearish candle is formed after the beginning of a downtrend.

Example 2

In the below EUR/GBP chart, the pair was in an overall downtrend. During the pullback phase, when price action reached the major resistance area, most of the amateur traders visually see that as a bullish market. Price action respects the resistance line twice, but on the 25th of Nov, when strong buyers broke the resistance line, it creates the illusion of a buy signal in this pair.

But the buyers failed to hold the price higher, and the very next candle pushed the price below the resistance line. When the price broke the resistance line, amateur traders activate their buy trades. Still, technical traders will always wait for the prices to hold above the resistance line and take the buy entry only after the confirmation. In this example, prices never held above the resistance line, so there was no trade buy trade for professional traders. On the other hand, inexperienced traders end up booking losses.

Trading The Bull Trap Pattern

In the above examples, we discussed how to identify the Bull Trap pattern. Now, let’s understand how to trade this pattern. In the below EUR/AUD Forex chart, the price action tried to break the resistance line twice, but both of the time buyers failed to perform. On the 3rd of Jan, buyers broke the resistance line with some strong power. After the break, inexperienced traders would have activated their buy positions. But always keep in mind that the breakout never confirms the buy entry. We should be keeping a close look at the price after the breakout and only trade once we get the confirmation.

As you can see in the above chart, after the breakout, many candles held above the resistance line. After watching close to fifteen candles, we can confirm that the resistance has turned to support. The hold after the breakout confirms that the sellers failed to take prices lower.

Entry, Stop-Loss & Take-Profit

When buyers held the prices above the resistance line for a while, it is a clear indication of a buy signal. So now we enter the market as soon as the confirmation is done. We have decided to go for a smaller stop-loss because the hold confirms that the sellers left the ground.

Our take-profit is at the higher timeframe resistance area. We can see the price dropping back right after our take-profit level as the price tested the resistance line. Interestingly, a bull trap pattern is formed again above our take-profit order. This is the ideal way to trade this pattern, and most of the professional traders follow the same. Patience is the key to trade the Forex market. If you are patient enough to follow all the rules of the game, you will win for sure.

Conclusion

Bull Trap occurs when the prices fail to hold above the breakout. It could happen for various reasons. Some of them are buyers not being interested in pushing the prices higher, or they might have been booking the profits. On the other hand, professional sellers might have jumped into the market to take sell trades. As a result, they end up dropping the prices below the resistance levels, which will eventually result in triggering the stop-loss orders of the trapped buyers.

The best way to identify the Bull Trap pattern is to analyze the momentum of the buyers in the Forex market. If the buyers fail to hold the prices above the breakout, do not take long positions and never let the emotions drive your decision making.

Categories
Forex Course

64. Trading Support & Resistance Levels Using Fibonacci Levels

Introduction

In the previous lessons, we understood how to use the Fibonacci tool to trade the pullback of a trend. We have also learnt how these Fib levels are not foolproof. Now, in this lesson, let’s extend this discussion to see how the Fibonacci tool can be used in conjunction with Support and Resistance – arguably the most critical levels on a price chart.

Support is the area where the price rejects to go down and bounce back further. This area acts as a floor where the price gets stopped. Resistance is the opposite of Support. At this level, the price finds it very hard to go up as it acts as a ceiling. The general idea is to buy at the Support and sell at Resistance. But blindly buying and selling at these levels carry huge risk as there is no guarantee that these levels will work each time.

So let’s use Fibonacci levels to determine the working of these S&R levels. Basically, we are combining both Support Resistance and Fib levels to increase the accuracy of trading signals generated. Let’s get started.

In the below chart, we have identified a strong resistance area, and now we must wait to see if it creates an area of Support after breaching the Resistance. It is always advisable to buy at ‘resistance turned support.’ Also, if the price has broken a strong resistance with multiple touches, there is a higher chance of it turning into Support. At the marked region below, we can see the price breaking the strong resistance area.

In the marked regions below, we can see the price retracing after breaking the Resistance. So in order to combine this support resistance level with Fib levels, we must identify the swing low and a swing high. As we can see below, we have also plotted the Fibonacci levels on the chart using a Fib indicator.

Ideally, if we get a retracement at the 61.8% Fib level and a confirmation candle, we can confidently enter for a buy. If the market does not react at any of the Fib levels, this could be a sign that the Support is no longer strong, and it can be broken.

As per the theory of Support and Resistance, the market must react at the previous Resistance and bounce off. From the below chart, it is clear that the retracement has reached our S/R line, which is exactly coinciding with the 61.8 Fib level. Now it is a clear indication for us to go long once we see a confirmation candle.

In the below chart, we can see that the price has exactly bounced off from the 61.8% Fib level and printed a bullish candle giving us a confirmation sign. Right after the confirmation candle, we can place our buy trade with a stop-loss at 78.6% Fib level and take-profit anywhere near the high.

Further, in the below chart, we can see the market making higher highs breaking the previous resistance levels. From this trade, we learn that, when Fibonacci is used near S/R as a confirmation tool, it increases the odds of that level performing. The price will surely take Support at the Fib levels and continue its trend.

One can notice that the ‘buy’ happens precisely at the 61.8% Fib level near Resistance turned support line. The market continues to take Support at this level until, eventually, it breakouts on the upside. This shows the power of the Fibonacci indicator when combined with S&R levels.

There are many other credible indicators that are reliable and can be combined with S&R levels. But Fibonacci is one of the most used ones by the traders across the world.

[wp_quiz id=”64461″]
Categories
Forex Basic Strategies

Trading The ‘Symmetrical Triangle’ Chart Pattern Using SMA

Introduction

A Symmetrical Triangle is one of the most reliable chart patterns in the market. This pattern is characterized by converging two trend lines, which are drawn by connecting a series of peaks and troughs. The Symmetrical Triangle pattern is made up of price fluctuations where each swings high and swing low makes lower highs and higher lows. Essentially, the coiling movement of price action creates the structure of a Symmetrical Triangle. When the triangle is forming on the price chart, it indicates that neither the sellers nor the buyers are pushing the price far enough to create a clear uptrend or downtrend.

This pattern is also known as the ‘coil’ because, most of the time, it forms in a continuation phase. Symmetrical Triangle pattern consists of at least two lower highs and two lower lows. So when these points are connected, the lines converge, and the Symmetrical Triangle takes shape. A part of the trading community believes that if this pattern is formed in an uptrend, the price will break upward. Likewise, if the pattern forms in a downtrend, the price action will break downward. However, these are just assumptions and are not entirely true.

The reason for the formation of the Symmetrical Triangle on the price chart is because of the lack of volume and price movement in any underlying currency pair. This eventually results in the formation of a coiling pattern. Hence it is merely impossible to find out which side of the pattern will breakout.  The only way to trade this pattern is to let the breakout happen on any of the sides and take the trade only after confirmations.

Symmetrical Triangle Chart Pattern – Trading Strategies

Conventional Way – Buy Example

Step 1 - Identifying The Pattern

We can see the formation of a Symmetrical Triangle pattern in the below GBP/NZD Forex pair. We can observe the market coiling and not moving in any certain direction, which eventually resulted in this pattern.

Step 2 - Entry, Stop-Loss & Take-Profit

In the below chart, we had taken the entry when the price action broke the upper trend line. This pattern is pretty reliable but needs a lot of patience as the only way to trade is by stalking the charts. We can notice the market blasting to the north immediately after the breakout of the upper trend line. The stop-loss is placed just below the lower trend line, and the take-profit is placed at the higher timeframe’s resistance area.

Conventional Way – Sell Example

Step 1 - Identifying The Pattern

The formation of the Symmetrical Triangle pattern can be seen in the below AUD/JPY Forex pair. The market was in an overall downtrend, but from 28th – 30th January, it turned into a consolidation phase, which resulted in the formation of this pattern.

Step 2 - Entry, Stop-Loss & Take-Profit

However, on 30th Jan, the lower trend line was broken, indicating a sell signal in the AUD/JPY Forex pair. The entry can be right after the breakage of the lower trend line if you are an aggressive trader. But for conservative traders, it is recommended to watch for the bearish confirmation candles and then take the trade.

Here, we have gone for two targets. The first one was at the recent low, and the second target was a bit deeper, which is at the higher timeframe’s support area. If you are an intraday trader, then the TP1 is a good location for you to close your position. But if you are a swing trader, TP2 is the best match. Most of the time, the breakout trades do perform, and that is the reason for us to use the recent higher low as an appropriate stop-loss placement.

Symmetrical triangle + Simple Moving Average

In this strategy, we have paired the Symmetrical Triangle pattern with Simple Moving Average to identify accurate trading signals. SMA is a technical indicator used by almost every technical trader to identify the market trend. A smaller period average reacts more to the price action, whereas the larger period tends to respond less. If the SMA is below the price action, it means that the trend is up, and if it is above the price action, it indicates a bearish trend.

Step 1 - Identifying The Pattern & Plotting SMA On To The Price Chart

We can observe the formation of a Symmetrical triangle pattern on the EUR/NZD Forex chart.

Step 2 - Knowing What Not To Do

One of the most common ways of trading the Symmetrical Triangle and SMA is to let the price action go above or below the MA line to take an entry. But that approach is riskier, and let’s see why. In the below image, we have marked two circles where the MA generates both buy & sell signal. It is clear that the selling signal failed to perform, and the price action goes above the SMA. When the price broke the SMA, some traders might have taken buy entries, but that’s an immature way to trade this pattern. The reason for the formation of the Symmetrical Triangle is due to the lack of volume or price movement. So there is no way to know which side of this pattern will break.

Step 3 - Entry, Stop-Loss & Take-Profit

The correct way to trade the Symmetrical Triangle pattern is to use both of the trading tools in conjunction with each other. When the SMA goes below the price action, it confirms that the prices are more likely to break upside. When strong buyers break the Symmetrical Triangle with strong power, it’s a clear indication for us to go long. So we have entered the market right after the price broke above the upper trend line of the pattern.

If you are a confirmation trader, we recommend you wait for the price action to hold above the Symmetrical Triangle to take a ‘buy’ entry. For this particular strategy, we placed the stop-loss below the SMA, and take-profit was at the higher timeframe’s resistance area. After our entry, we can see the buyers blasting to the north, and we end up milking 100+ pips in this Forex pair.

Conclusion

The Symmetrical Triangle pattern is widely used among traders. The difficult part of trading this pattern is predicting the direction of the breakout. All we can do is to watch the charts until the breakout happens and anticipate the trade. The traditional way to book the profit is at the beginning of the triangle itself. However, we can use some other approaches such as higher timeframe’s S&R areas, supply-demand zones, or exiting the position when the market turns into a consolidation phase.

We hope you had a good read. Let us know if you have any questions in the comments below, and we would love to answer them. Happy Trading.

Categories
Forex Course

63. Reasons Why We Should Never Completely Depend On Fib levels?

Introduction

In the previous article, we learnt how exactly to trade using the Fibonacci levels. There are many other ways through which Fib levels can be traded. Some of them include trading these levels using S&R, Trendlines, and even candlestick patterns. Before learning all of these ways, we must know that these levels are not guaranteed and cannot be traded stand-alone. So in this article, let’s discuss why one should be very careful while trading Fibonacci retracements.

Fibonacci Levels Will Not Be Respected Always

Every technical level ultimately breaks at a certain point in time, and that is the case with Fibonacci levels as well. In the previous article, we had learnt that Fibonacci levels also act as potential support and resistance areas. So these levels do break just as how S&R levels break. Therefore we must keep in mind that these levels are not foolproof.

Let’s understand this with the help of an example. But before that, make sure to read our article on ‘How to trade Fib retracements’ to understand this better. You can find that lesson here.

In the price chart below, we can see an initial big move to the downside. So basically, here we must wait for the retracement, and that retracement must touch the Fibo levels. Let’s see what happens in the next step.

We saw the retracement (below chart) of the downward move, and we have placed the Fib levels from swing high to swing low since it is a downtrend.

Then we can see the retracement reaching the 50% Fib level and holding there. Ideally, at this point, the retracement must stop, and the market’s original downtrend should continue. Also, we should be placing our ‘sell’ trades as the Red confirmation candle can clearly be seen.

But, to our surprise, we observe that the price did not respect our strategy, and the market shot up to the north, violating all the Fibonacci levels, as shown in the below chart.

While Fibonacci retracement levels give us a high probability of the trade working in our favor, like any other technical analysis tool, they don’t always work. One can never be entirely certain that the price will respect the 50% or 38.2% or any Fibonacci level for that matter.

If you are an experienced technical trader, you wouldn’t have placed a sell trade in the above scenario. It was clear that the sellers are losing momentum. The formation of a bearish Doji candle at the bottom (below chart) is another confirmation of a trend reversal.

So we should be looking at the bigger picture, or we should take the help of any other technical tools to confirm the signals generated by the Fibonacci levels. Never completely depend on them.

Conclusion

Apart from the things that we discussed above, there is another issue while using these Fib ratios, which is determining the appropriate swing low and swing high. Everyone looks at charts differently. They trade at different time frames and have their own fundamental reason for buying or selling the currency pair.

Swing high for one trader might likely be different than swing high for another. And when the Fib ratios are placed incorrectly, of course, the trading signals generated won’t be accurate. Also, the prerequisite for Fibonacci trading is trending markets. When the market is in a consolidation or moving sideways, it is obviously not possible to trade with these ratios.

We hope you understood this lesson well. If you find this complicated or if you have any questions, please let us know in the comments below. Cheers.

[wp_quiz id=”64257″]
Categories
Crypto Guides

Top 4 Ways To Earn Cryptocurrency For Free

Introduction

Cryptocurrencies have been one of the most spoken topics in the last decade. That too, in the last three years, the interest in investing or trading cryptos has been the maximum. We have also been discussing a lot about cryptocurrency lately in our detailed guides. We understood the various properties of cryptos and what makes this currency truly amazing. So, if you are a novice trader or investor or just a reader, we believe that you have at least a little interest in owning some of the top cryptos in the market.

One can buy cryptos easily in different ways, such as purchasing them in an exchange or using services like localbitcoin.com, etc. While these are some of the easiest ways to purchase cryptos, all of them involve investing your own money. But what if we say there are various ways in the market where you can earn cryptos for free? Yes. Many people are already grabbing these opportunities and earning a good amount of cryptos without having to invest their hard-earned money.

We have listed four of the most efficient ways to earn crypto for free. Please note that earning these cryptos does involve some amount of work from your side because nothing on this planet is truly free. However, you are not required to put any of your funds or take a full-time job for a crypto company. So let’s see the different possible ways to earn free cryptos.

💸 Through Airdrops

This is by far the most popular way of earning free cryptos. Airdrops work just like giveaways. Any crypto startup would prefer giving their coins for free in order to spread their name. It’s a marketing strategy where the participants of the airdrop get to avail free cryptos. There is a minimum amount of work involved in this process, like follow the company’s Twitter account, joining their telegram page, etc.

Anyone with an active ERC-20 compatible Ethereum Wallet can participate in these airdrops. Make sure to do your research to find the airdrops offered by some of the most potential crypto companies; because the free cryptos that you have earned in airdrops must increase in value later to make a profit out of them.

As we can see below, the last Stellar’s airdrop involved an offering of close to 375 million Stellar coins.

Picture Taken From – Blockchain.com

💸 Coinbase Earn Programme

Users of one of the very well-known crypto exchange – Coinbase, can earn free cryptocurrencies by completing some of the interesting courses provided by them. These courses include lessons about the basics of how certain cryptocurrencies work. The point here is that this exchange offers free coins of crypto to their users by educating them and creating exposure to that crypto.

Picture Taken From – Coinbase

We can currently earn cryptos worth $186 (as of Feb 2020) by just signing up with Coinbase and completing the courses offered by them. Dai, EOS, Stellar, and Zcash are some of the familiar cryptos that can be earned through this program. You can follow this link to start with the courses.

💸 Participating In the Bounty Programs

Free cryptocurrencies can be earned through participating in various bounty programs offered by the crypto/blockchain companies. There are different types of bounties, such as Bug bounties, Content bounties, Social bounties, and Signature bounties. In bug bounties, cryptos are offered to the people who help the companies in finding bugs in their code. The rest of the bounties involve creating content and exposure for both crypto start-ups and well-established companies in different forums. So these programs are not just for tech-savvy individuals but also for promotors.

Recently, Coinbase has offered about $30,000 worth of cryptos to an ethical hacker who founds potential bugs in their system.

Picture Taken From – Hackerone

💸 Through Affiliate Marketing

Many of the cryptocurrency companies have their own affiliate marketing programs for individuals or companies who are willing to promote and generate sales for them. For instance, companies like Trezor, Ledger, Binance, and LocalBitcoins offer 10% – 40% of commissions to their referrals. Details about each of these affiliate marketing programs can be found in their corresponding websites.

Bottom line

There are many other ways through which free cryptocurrency can be earned, but these seemed to the most effective ones. Not every company that offer free cryptos have the best interest for their customers. So please do thorough research about the authenticity of any program you are willing to take part in. All the best.

Categories
Forex Basic Strategies

Most Profitable Ways To Trade The Triple Top Chart Pattern

Introduction

The Triple Top is a bearish reversal pattern that helps traders in identifying the peak areas of the market. This pattern occurs when the market prints three consecutive tops nearly at the same price level of any underlying asset. The areas of the touchpoints are the resistance levels, and the pullback between these points is known as the swing lows. After the third high or third touchpoint, if the price breaks the support and goes below, the pattern is said to be complete.

Traders can then activate their positions on the sell-side. Most of the traders try to be extra conservative and wait for the exact pattern to occur. But it can be challenging to find the Triple Top Reversal pattern with all the three highs at the same in size. We should always remember that the technical analysis is more of art and less of science. So even if 80% of the pattern rules are met, we can take the trades by confirming those signals with other credible technical indicators.

The Psychology behind the Triple Top Pattern

The appearance of a Triple Top Pattern implies that the buyers are slowly losing momentum in the market. It might also mean that the buyers are not willing to push the price higher. At the same time, the sellers are interested in taking the price lower. The Triple Top pattern is a way more powerful pattern than most of the other credible patterns in the market. This is because the third failed attempt of the buyers implies that the sellers are way too aggressive than the buyers. Hence we can expect stronger downward moves.

Triple Top Pattern – Trading strategy

The Triple Top pattern occurs very rarely on the higher timeframe. Even if it occurs, this pattern often takes a lot of time to develop fully. However, on an intraday timeframe, this pattern can be observed quite often.
Step 1: Identifying the TTP on a price chart

In the below AUDCHF Forex chart, we can see the market printing a clear Triple Top chart pattern.

Step 2: Entry 

The strategy is to wait for the breakdown to happen so that we can activate our short positions. On the 27th of January, we can observe the breakdown that occurred in this pair, and that can be considered as a clear Sell Signal.

Step 3: Stop-loss & Take Profit

We can activate our sell positions as soon as we see a bearish confirmation candle. We can go for two different targets in this trade. Both are at the higher timeframe’s support area. Most of the traders believe that their target must be double as compared to the size of the Triple Top pattern, but it’s just a myth. Always book the profit according to the market circumstances.

If the trend is super strong, go for the deeper targets. Contrarily, if the market momentum is fading, book the profit at any significant area. Traders who are well versed with pattern trading can add positions when the market goes back to the entry point so that they can ride the whole show again. While trading the breakout or break down patterns, always place the stop-loss near the recent low.

Triple Top Pattern + Double Moving Average

In this strategy, we have paired the Triple Top pattern with the Double Moving Average to identify accurate sell signals. A moving average will help us in identifying significant trends, trading opportunities, and entry/exit levels. Many traders believe that if they find the magic number of the period, then they can easily beat the market, but it’s not true. There are infinite numbers of periods available, and traders should practice only 3 to 4 periods, to use this indicator effectively.

Step 1: Identifying the TTP on a price chart

In the below chart, we can observe the market printing the Triple Top pattern on the NZD/JPY 60-minute Forex pair. We have applied the double MAs on to the price chart.

The traditional way to trade this pattern is to wait for the break down to happen and then go for sell just like we did in the above example. But in this strategy, let’s tweak things a bit by adding the double moving average to the plot. In this strategy, we are using the 14 and 9-period average. This strategy is purely for the intraday traders only.

Step 2: Entry, Stop-loss & Take Profit

After price action printing the third top, if we observe an MA crossover happening, we can activate our sell positions even before the breakdown. By following this approach, we get to enter the trade ahead of time, while the breakdown traders wait for the break down to activate their position. Most of the professional traders use this approach to maximize their profits.

There are many ways to close our positions. We can book profit at a significant support area. The placement of stop-loss depends on the trader’s trading style. If you are an aggressive trader, the smaller stop-loss is good. But expect more hits before the trade performs. If you are a conservative trader, use an extra spacious stop-loss.

Bottom line

A pattern is said to be paramount when it offers the best risk-reward ratio trades. Also, the pattern must have a higher probability of occurring in intraday timeframes. The Triple Top is one such pattern that offers both of these demands to every trader. Also, remember that the Triple Top is a bearish reversal pattern, so only take short positions when you see this pattern on the price charts. Apart from the ones mentioned above, there are different other ways to activate our position in the appearance of this pattern. But the above ones are the safest and most profitable ways to trade.

Try identifying and trading this pattern on a demo account before trading on the live charts. We hope you find this article informative. If you have any questions, please let us know in the comments below. Happy Trading.

Categories
Crypto Guides

What Problems Do Stable (cryptocurrency) Coins Solve?

Introduction

We have learnt a lot about cryptocurrencies and their properties in our previous guides. Even though this financial instrument has gone through a lot of up & down in the last three years of the past decade, many financial experts believe that this asset class can still be considered a potential investment. Some experienced crypto traders believe that Bitcoin, at its peak (~$18,000 in Dec 2017), is still undervalued. This is because of the strong fundaments Bitcoin possesses. Not just Bitcoin, the entire crypto market has enormous investment potential in this decade.

The Need for Stable Coins

But there is one thing that concerns both short-term and long-term crypto investors – which is undoubtfully the volatility. Most of the cryptos currently present in the market possess huge volatility. This is one crucial reason why most of the investors are not confident enough to invest in this space. This volatility is also the reason why cryptos cannot be used as a standard medium of exchange. Hence the need for a Stable Currency or Stable Coin has risen.

A Stable Coin is a currency that has all the critical properties of typical crypto while achieving price stability. This stability in price is achieved by pegging their value to the major fiat currencies like USD & Euro in a 1:1 ratio. One of the very first and famous stable coins is Tether, and its value is pegged to USD. So the value of one Tether (₮) is always equal to one US Dollar ($). The main goal of any stable coin is to achieve maximum decentralization while maintaining price stability. But in the case of Tether, even though it has most of the properties of crypto, it is highly scrutinized ever since it is pegged with the USD.

Significance of Stable Currency

Stable Currency, as the name suggests, provides both short-term & long-term stability for the traders and investors. Short-term stability allows users to make day to day transactions just like fiat currencies. While the long-term stability provides confidence for the investors to include these stable coins in their portfolio. For instance, in the case of extreme bear markets, crypto traders and investors must need some stable storage where they can protect their portfolio from significant losses. The only other way is to convert all these cryptos to desired fiat currencies and convert back to crypto again once the downtrend is over. This sounds redundant. Isn’t it?

But with the help of stable coins in their portfolio, investors can just trade the cryptos that are bleeding for stable coins and hold them without having to worry about the volatility. Apart from the investment point of view, stable coins can also help short-term crypto traders to confidently keep their profits that they have gained within the exchange wallets (in the form of stable coins). But in the absence of stable coins, they will have to continuously worry about them losing their profit value due to the high volatility.

If you are interested in adding stable coins to your portfolio, we have mentioned some of the most promising ones below.

TetherMakerDAOTrue USDCarbon

Many stable currency projects like these have come to existence after Tether, and some of them showed promising results. However, a completely decentralized stable coin that can be used for day-to-day transactions securely is yet to come.

Categories
Forex Assets

Asset Analysis – USD/RON Forex Exotic Currency Pair

Introduction

USDRON is the abbreviation for the US Dollar against the Romanian Leu. This pair comes under the roof of emerging currency pairs. The volume in this pair is pretty low, and the volatility is high. Here, the US Dollar is referred to as the base currency and the RON the quote currency.

Understanding USD/RON

The fluctuating price in the exchange market specifies the value of RON equivalent to one USD. It is quoted as 1 USD per X RON. For instance, if the market price of this pair is 4.4723, then about 4½ RON is required to buy one US Dollar.

Spread

Spread is the difference between the bid and the ask prices set by the broker. It is not the same with all brokers. It also varies from the type of execution model used by the broker.

ECN: 19 pips | STP: 21 pips

Fees

The fee is the commission that is paid to the broker on each position you take. This, too, varies from the type of execution model. Typically, there is no fee on STP accounts. However, there are a few pips of fee on ECN accounts.

Slippage

Slippage is the difference between the price requested by the client and the price he actually got from the broker. This happens only on market orders. The primary reasons for its occurrence are,

Market’s volatility

Broker’s execution speed

Trading Range in USD/RON

A trading range is the representation of the pip movement in a currency pair for different timeframes. With these values, we can determine the gain or loss in a trade for a specified time frame. All that must be done is, multiply the required value from the below table with the pip value. This will yield the profit/loss for one standard lot.

Procedure to assess Pip Ranges

  1. Add the ATR indicator to your chart
  2. Set the period to 1
  3. Add a 200-period SMA to this indicator
  4. Shrink the chart so you can assess a large time period
  5. Select your desired timeframe
  6. Measure the floor level and set this value as the min
  7. Measure the level of the 200-period SMA and set this as the average
  8. Measure the peak levels and set this as Max.

USD/RON Cost as a Percent of the Trading Range

Apart from assessing the profit or loss on a trade, we can also determine how the cost varies as the volatility changes. Below is a tabular representation of the same.

ECN Model Account

Spread = 19 | Slippage = 3 |Trading fee = 3

Total cost = Slippage + Spread + Trading Fee = 3 + 19 + 3 = 25

STP Model Account

Spread = 21 | Slippage = 3 | Trading fee = 0

Total cost = Slippage + Spread + Trading Fee = 3 + 21 + 0 = 24

The Ideal way to trade the USD/RON

Trading emerging currency pairs is different from trading major and e pairs. This pair’s high volatility and low trading volume make it infeasible to trade any time during the day. So let’s take some info out from the above tables and try finding the ideal times to enter this pair.

From the table, it can be ascertained that the percentage values are high in the min column and pretty low in the max column. This means that the total costs on the trade increases as the volatility decreases. So, to have equilibrium between the two, it is perfect to enter during those times when the volatility is around the average values. This will ensure both sufficient volatility and affordable costs.

Another simple technique to reduce total costs is by trading using limit and stop orders instead of market orders. In doing so, the total costs will reduce significantly as the slippage will not be considered for limit/stop orders. The reduction in the costs is represented in the below table as follows.

Categories
Forex Basic Strategies

Trading The Bullish & Bearish ‘Flag Pattern’ Like A Pro

Introduction

A Flag Pattern is one of the very well-known trend continuation patterns. Visually, this pattern looks like a flagpole and a flag, hence the name ‘Flag Pattern.’ A flagpole is printed by the sharp price upward move, followed by the symmetrical pullback, which forms the flag on the price chart of any underlying currency pair. When the flag breaks the trend line, it triggers the next trend move of an underlying asset. In simple words, flag forms when price action turns sideways after the sharp upward movement. This pattern can be seen on any timeframe; however, it is mostly found on lower timeframes such as 15, 5 or 3-minute chart.

Flag patterns can be both Bearish & Bullish

Bullish Flag Pattern

The bullish flag pattern starts with a strong upward move. This move implies that the sellers are entirely off guarded as the buyers took over the entire show. Eventually, the price action peaks, and it prints a pullback. The higher high and lower low of the pullback will be parallel to each other. This action results in the formation of a tilted rectangle. This whole process appears like a bullish flag pattern on the price chart.

By placing the trend line at the upper and lower end of the pullback, we can observe the diagonal parallel nature of that pullback. The breakout of the upper trend line indicates that the trend is ready to resume, and that is the best time to activate an extended position.

Bearish Flag Pattern

The bearish flag pattern is just the opposite of the bullish flag pattern that we discussed above. When the price action hits bottom, it prints the pullback where the lower low and higher high are parallel to each other.

The breakout of the lower trend line indicates that the trend is ready to resume, and it’s the best time to go short in any underlying asset.

Flag Pattern – Trading Strategies

Bull Flag Pattern Strategy

A Bull flag is a trend continuation chart pattern that indicates the likeliness of the market to move higher. (Uptrend Continuation)

Pattern Confirmation Criteria:

  • Find out a strong uptrend in any currency pair. In other words, the range of candles should be more bullish.
  • After the strong move, wait for the pullback to occur. A pullback is generally in the form of lower low and lower high. Here’s where we can expect to see a bull flag pattern on the price chart.
  • Draw the upper and lower trend lines on the price chart. When the price action breaks the upper trend line, it a sign to go long.

Here’s how the bull flag pattern looks like on price chart.

Entry – In the below NZD/USD Forex chart, we can see that the pair was in an overall uptrend. During the pullback phase, price action has printed the bullish flag pattern. The breakout of this pattern indicates a clear buy signal in this currency pair.

Stop-Loss & Take-Profit – When the price action breaks the upper trend line, it’s a sign to go long in this pair. The bull flag is quite a reliable pattern, so we can place our stop-loss just below the second trend line (lower part of the tilted rectangle). Placing the take-profit order is purely based on your trading style. If you are an aggressive trader, go for extended targets; but if you are a conservative trader, use smaller targets. In this particular trade, we closed our full position at one of the significant resistance areas.

Bear Flag Pattern Strategy

A Bearish Flag Pattern is also a continuation chart pattern, but it indicates the downward movement of the market. (Downtrend Continuation)

Pattern Confirmation Criteria:

  1. Find out a steady downtrend in any currency pair. In other words, the range of candles should be more bearish.
  2. After a strong move, wait for the pullback to occur. A pullback is typically in the form of a lower higher low and higher high. Here’s where we can expect the formation of a bearish flag pattern on the price chart.
  3. Draw an upper and lower trend line on the price chart. When price action breaks the lower trend line, it’s a sign to go short.

Here’s how the bearish flag pattern looks like on price chart.

Entry – In the below EUR/CHF 60 Forex chart, the overall market was in an uptrend. Then suddenly, sellers overwhelmed the buyers by printing a couple of strong red candles. If a bearish flag pattern appears on the price chart, we can confirm that the downtrend is going to continue. In the below picture, we can clearly see the formation of a bearish flag pattern. We can activate our sell positions as soon as the lower trend line breaks.

Stop-Loss & Take-Profit – In this trade, we must go for minimal stop-loss because the market is in a consolidation phase and not in a strong downtrend. We had closed our whole position when the price action started struggling to print a new lower low and lower high.

Bottom Line

The Flag pattern is always created by a swift up/down move, followed by the consolidation, which runs between the parallel lines. Always use the breakouts of the Flag pattern to take the positions.

Always remember that the trend is your friend. Take only buy trades in the appearance of a Bullish Flag and sell trades in the presence of a Bearish Flag.

Traditional ways suggest that the stop-loss must be set below the pole of the flag, but we don’t always have to follow this idea. While trading flag breakouts, the stop-loss just below the recent low is good enough.

In the Forex market, the flag pattern performs very well in active trading hours as most of the swift moves (like flagpole formation) occur in busy hours only. If you are a strict confirmation trader, let the price action to retest the trend line to activate your trades. This procedure will help you in picking the higher probability trades, although you’ll miss the higher-momentum moves that don’t pause to continue moving.

Categories
Forex Assets

Analyzing The USD/EGP Exotic Forex Currency Pair

Introduction

USDEGP is the abbreviation for the US Dollar against the Egyptian Pound. The USDEGP is classified under the emerging currency pairs, and the volatility in these pairs is quite high. In this pair, the US Dollar is the base currency and the EGP the quote currency.

Understanding USD/EGP

The price of USDEGP specifies the value of EGP equivalent to one USD. It is quoted as 1 USD per X EGP. So, if the market price of this pair is 15.673, then 15.673 units of EGP are required to purchase one US Dollar.

Spread

The difference between the bid and ask price is referred to as the spread. This value varies from broker to broker as well as how they execute the trade. The approximate spread on ECN and STP accounts is shown below.

ECN: 20 pips | STP: 21 pips

Fees

The fee is a commission that is to be paid to the broker for each trade you execute on an ECN account. On STP accounts, the fee is nil.

Slippage 

The price you receive from the broker is usually different from the price when you executed. And the difference between these two prices is referred to as the slippage. The factors affecting slippage include,

  • Market’s volatility
  • Broker’s execution speed

Trading Range in USD/EGP

The trading range is a tabular representation of the pip movement in a currency pair for different timeframes. With it, one can assess their risk on the trade for each given timeframe.

Procedure to assess Pip Ranges

  1. Add the ATR indicator to your chart
  2. Set the period to 1
  3. Add a 200-period SMA to this indicator
  4. Shrink the chart so you can assess a large period
  5. Select your desired timeframe
  6. Measure the floor level and set this value as the min
  7. Measure the level of the 200-period SMA and set this as the average
  8. Measure the peak levels and set this as Max.

USD/EGP Cost as a Percent of the Trading Range

As the name pretty much suggests, this is a trading range table that represents cost variations (in terms of percentage) for different timeframes and volatilities. These values are useful in determining the ideal times of the day to trade this pair.

ECN Model Account

Spread = 20 | Slippage = 3 |Trading fee = 3

Total cost = Slippage + Spread + Trading Fee = 3 + 20 + 3 = 26

STP Model Account

Spread = 21 | Slippage = 3 | Trading fee = 0

Total cost = Slippage + Spread + Trading Fee = 3 + 21 + 0 = 24

The Ideal way to trade the USD/EGP

In emerging currencies, the volatility is high, and the traded volume is low. So is it not ideal to enter the market any time during the day. So, let’s interpret the above tables and find the best times of the day to trade this currency pair.

The magnitude of the percentage is directly proportional to the cost of the trade. And since the percentage is higher in the min column, we can conclude that as the volatility increases, the cost reduces. However, our main aim is not only to reduce costs but to have good volatility and trading volume as well. Hence, to ensure both, it is ideal to trade when the volatility is at/above the average values in the volatility table.

Moreover, one can bring their costs slightly lower by trading using limit orders instead of market orders. This will cut off the slippage on the total cost of the trade. An example of the same is given below.

Categories
Forex Course

62. Using Fibonacci Retracements To Enter A Trade

Introduction

In the previous article, we understood the definition of Fibonacci and how the Fibonacci levels are derived. Now we shall see how to use these levels to enter a trade and formulate a trading strategy around it.

The strategy we are going to discuss can be used not just in the Forex market. It can also be used in different other markets such as Stocks, Commodities, Cryptocurrencies, and ETFs. This is essentially a trend trading strategy that takes advantage of a pullback in a trend. The Fibonacci levels later prove to be critical areas of support and resistance that most traders keep a close watch on. Let’s get started with the strategy.

Step 1: Identify an initial big move. We are going to trade its retracement.

A trend helps the traders to identify the direction of the market and to determine where the market will head further. A big price movement indicates that the market has reversed from its original direction and will possibly continue further in that direction.

In this example, we have identified a big move on the upside, and we shall see how to trade its retracement to join the trend. Let’s use Fibonacci levels to enter the trend at the right time.


Step 2: Use the Fibonacci tool and plot the levels on the chart

After placing Fibonacci levels on the chart, we need to wait for a retracement and see where it touches the Fib levels. The most desirable condition is when the price bounces off after touching the 50% or 61.8% fib ratio. These ratios are also known as Golden Fib ratios. In the below chart, we can see the formation of a bullish candle as soon as the Red candle reaching the 61.8% level.

In an uptrend, always make sure to plot the Fib levels from Swing Low to Swing High. Likewise, in a downtrend plot, the Fib levels on the chart from Swing High to Swing Low.

Step 3: Enter only after confirmation 

Typically, traders are taught to place their buy orders as soon as the price reaches the 61.8% level. Do not do that. Only place the trades after the appearance of at least a couple of bullish candles. In the below chart, the formation of a green candle at 61.8% gives us an additional confirmation that the trend is going to continue after the retracement. Traders can also confirm this buy signal by using reliable technical indicators. This is how the chart would look at the time of entering the trade.

Step 4: Take-Profit and Stop-Loss placement

It is important to place accurate Stop-Loss and Take-Profit orders to mitigate the risk and maximize profits. In this strategy, stop-loss is placed just below the 61.8% Fib level. If the price breaks this Fib level, the uptrend gets invalidated, and we can expect the beginning of a downtrend.

We can place the take-profit order at the nearest’ high’ of the uptrend and trail the stop-loss until it is triggered. The minimum risk to reward of this trade is 1:1, which is not bad. But since it is a continuation of the trend, we can wait until it makes a new high and take profits there. This will result in a 1:2 risk to reward trade.

Below is how the setup of the final trade looks like.

We can clearly see the price respecting the Fibonacci levels, and the trade here went exactly the way we predicted.

Conclusion

Fibonacci retracements are a part of the trend trading strategy that most traders observe during an uptrend. Traders try to make low-risk entries in the direction of the trend using these Fibonacci levels. It is believed that the price is highly likely to bounce from the Fibonacci levels back in the direction of the initial trend. These Fib levels can also be used on multiple time frames. When this tool is combined with other technical indicators, we can predict the outcome of the trade with a greater degree of accuracy.

[wp_quiz id=”63028″]
Categories
Forex Assets

Learning The Costs Involved While Trading The USD/RUB Pair

Introduction

USD/RUB is the tick symbol for the US Dollar against the Russian Ruble. This emerging currency pair has high volatility and usually low volume. Here, the US Dollar is the base currency, and the RUB is the quote currency.

Understanding USD/RUB

The price of this pair determines the value of RUB that’s equivalent to one US Dollar. It is quoted as 1 USD per X RUB. For example, if the market price of this pair was 68.69, then these many Rubles are required to purchase one US Dollar.

Spread

It is the difference between the bid price and ask price in the exchange market. This value is set by the brokers and varies from each other. Also, it varies on the type of execution model.

ECN: 21 pips | STP: 23 pips

Fees

This fee is levied by stockbrokers as well. The fee on ECN and STP account is given below.

ECN: 3-10 pips | STP: 0 pips

Slippage

The difference between the investor’s intended price and the real price executed by the broker is called slippage. Slippage happens solely due to the changes in the market’s volatility and speed with which the broker executes a trade.

Trading Range in USD/RUB

The trading range is a tabular illustration of the minimum, average, and maximum volatility in a currency pair for a given timeframe. Using these values, traders can quickly assess their risk on the trade for any of the given timeframes.

Procedure to assess Pip Ranges

  1. Add the ATR indicator to your chart
  2. Set the period to 1
  3. Add a 200-period SMA to this indicator
  4. Shrink the chart so you can assess a substantial period
  5. Select your desired timeframe
  6. Measure the floor level and set this value as the min
  7. Measure the level of the 200-period SMA and set this as the average
  8. Measure the peak levels and set this as Max.

USD/RUB Cost as a Percent of the Trading Range

Total cost is the sum of the slippage, spread, and the trading fee. This varies based on the volatility of the market. And below is a table that represents the cost variation for different volatilities.

ECN Model Account

Spread = 21 | Slippage = 3 |Trading fee = 3

Total cost = Slippage + Spread + Trading Fee = 3 + 21 + 3 = 27

STP Model Account

Spread = 23 | Slippage = 3 | Trading fee = 0

Total cost = Slippage + Spread + Trading Fee = 3 + 23 + 0 = 26

The Ideal way to trade the USD/RUB

Note that, the larger the value of the percentages, the higher is the cost on the trade and vice versa. The table clearly says the costs are high for low volatilities as the magnitudes of costs are high in the min column. But, it is not really ideal to trade in these extreme regions. To ensure decent volatility with comparatively low costs, it is ideal to trade this pair when the Volatility is around the average value in the trading range table.

We can see that slippage is a pretty heavy variable in the total costs. However, it can be nullified simply by placing orders using limit/stop orders rather than market orders. The drop in the total costs on the trade is represented in the below table as follows.

We can see, also that there are substantial costs when trading the USDRUB pair, even ion a daily timframe. That means that you will need to be right on direction and extension of the movement to be profitable, because, on an average trading range it would require about 12 hours of positive price movement to cover the trading costs. Therefore it is recommended to trade this exotic pair on swings of more than a week, to reduce the percent of the movement that is absorbed by the trade cost.


Categories
Forex Assets

Understanding The USD/PLN Exotic Currency Pair

Introduction

USD/PLN is the abbreviation for the US dollar against the Polish Zloty. It is an emerging currency pair in the forex market. The volatility in this pair is high, and the trading volume is less compared to major and cross currencies. In this pair, USD is the base currency, and PLN is the quote currency.

Understanding USD/PLN

The value of this pair determines the value of PLN that is equal to one US dollar. It is quoted as 1 USD per X PLN. For example, if the value of this pair is 3.8146, then around 4 PLN is required to buy one USD.

Spread

In forex, one of the most used terms is the spread. Spread is the difference between the bid price and the ask price of the market. This value is decided by the broker and varies from the type of account model.

ECN: 18 pips | STP: 21 pips

Fees

There is some fee on every trade you execute. And this, too, varies from type of account model. For instance, there is no fee on the STP account and a few pips on ECN accounts.

Slippage

Slippage occurs only on market orders. By definition, it is the difference between the trader’s required price for execution and the actual price the order was executed. This value depends on the broker’s execution speed and the market’s volatility.

Trading Range in USD/PLN

Assessing the profit that you can make and the loss that you can incur is a vital risk management tool. And below is a table that represents the minimum, average, and maximum volatility in different timeframes, which will help determine profit/loss values.

Procedure to assess Pip Ranges

  1. Add the ATR indicator to your chart
  2. Set the period to 1
  3. Add a 200-period SMA to this indicator
  4. Shrink the chart so you can determine a large period
  5. Select your desired timeframe
  6. Measure the floor level and set this value as the min
  7. Measure the level of the 200-period SMA and set this as the average
  8. Measure the peak levels and set this as Max.

USD/PLN Cost as a Percent of the Trading Range

An excellent application to the above table is the cost as a Percent of the Trading Range. The below tables illustrate how the cost varies based on the volatility of the market. And these values will help us an idea on the best times of the day to enter into this currency pair.

ECN Model Account

Spread = 18 | Slippage = 3 |Trading fee = 3

Total cost = Slippage + Spread + Trading Fee = 3 + 18 + 3 = 24

STP Model Account

Spread = 21 | Slippage = 3 | Trading fee = 0

Total cost = Slippage + Spread + Trading Fee = 3 + 21 + 0 = 24

The Ideal way to trade the USD/PLN

Before getting right into it, let us comprehend what the tables actually mean. The higher the value of the percentage, the higher is the cost of the trade and vice versa. From the table, we can clearly ascertain that the percentages are high in the first (min) column, indicating that the costs are high when the market volatility is low.

Now, talking the ideal time to trade this currency pair, you may trade this pair during those times when the volatility is above the average values. In doing so, you will be assured with sufficient volatility and low costs as well.

Furthermore, if you wish to reduce your costs much more, you may place orders using the limit/stop instead of the market. This will completely nullify the slippage on the trade and will, in turn, bring down the total costs significantly. As an example, the above table, when the slippage is made, is nil is illustrated below.

Categories
Crypto Daily Topic Crypto Guides

Is Crypto Money Laundering A Real Problem?

What is Money Laundering?

Money Laundering is the legitimization of money earned through illegal means. Generally, it is the separation of money obtained through illegal activities and mixed with the money made from legal sources like small businesses that accepts cash as the primary mode of payment. The legitimized money is again funneled to the criminal enterprises to fund illegal activities.

Different Ways of Money laundering

Money laundering is prevailing for many decades in our financial history. Governments have been continuously upgrading the technology to avoid the money laundering cases, especially to reduce the funding of illegal activities. Cash still occupies the first place when it comes to laundering the money. Because it is difficult to trace the money that is transacted in cash. Hence selling/buying drugs, trafficking, and theft are mostly dealt with cash.

Gold is another popular form of laundering money. Other than these, we have large banks that don’t question with the source of the wealth when the cash is deposited in their vaults, casinos, tax havens, etc. But ever since the revolution of Cryptocurrency has begun, this asset is paving new ways for money laundering. Let’s discuss more about this below.

Is Money Laundering Using Cryptos A Real Problem? 

There are significant concerns across most of the governments with regard to money laundering using cryptocurrencies. But most of them are not true when it comes to reality. It is estimated that since 2009 approximately $2.5 billion worth of Bitcoins are laundered, whereas ~ $100-$300 billion dollars are being laundered every year in different ways.

Hence, if we compare the stats, the amount of money laundered using Cryptocurrency is very sparse. Moreover, it is not advisable to launder money using Cryptocurrency as all the crypto networks are permissionless and transparent for literally anyone to check. It is easy to put together the Bitcoin transactions as the transactions are only pseudo-anonymous.

How are cryptocurrencies used to launder money?

These are some of the ways how Cryptocurrency is used for money laundering:

₿ While most of the cryptocurrencies are regulated there are some exchanges that aren’t. This means they don’t perform KYC procedures and none of the details of their customers is collected while they perform crypto transactions. This makes it challenging to match the transactions made by their customers to their id’s. When several such transactions are made using unregulated crypto exchanges, a degree of privacy is added which may eventually result in using that money for illegal activities.

Exchanging the Cryptocurrency with different altcoins, thus making it difficult to know the origins of the actual cryptos. This can also quickly be done by participating in an ICO.

Using Bitcoin ATM’s, we can deposit fiat cash and take Cryptocurrency at any place where a crypto ATM is available.

As the cryptocurrency market is too volatile, it is easy to show that the illicit income is a result of some profitable venture or some other currency appreciation.

With ever-increasing online payments using Cryptocurrency, we can easily create an online company which accepts Bitcoin and convert black money into clean Bitcoin.

How are the governments controlling the crypto money laundering?

Governments are taking various measures by developing multiple tools to link the transactions to the ids of the users using KYC details. Anti-laundering laws are amended to include cryptocurrencies. The US, Canadian, and European governments have made changes to the rules already. Some governments are, in turn, taking measures by legalizing cryptos so that the transactions would be made through regulated exchanges instead of fraudulent ones.

Finally, it can be said that, since the usage of digital cash is going to be inevitable, all measures are being taken to curb the negativities that we see in today’s world with fiat cash. If you have any questions, shoot them in the comments below. Cheers!

Categories
Forex Course

60. Introduction To Fibonacci Trading

Introduction

We have completed learning most of the basics related to candlesticks and its patters in the previous lessons. In the upcoming articles, let’s upgrade our technical trading skills by learning Fibonacci Trading. This field of study deals with trading the price charts using Fibonacci levels and ratios. In this article, we will briefly talk about what this Fibonacci trading is all about.

Fibonacci levels and ratios were devised by a famous Italian mathematician, ‘Leonardo Fibonacci.’ This Italian number theorist introduced various mathematical concepts that we use in the modern world, such as square roots, math word problems, and number sequencing.

Leonardo Pisano Fibonacci 

Picture Source – Thoughtco

He found out a series of numbers that created ratios. The ratios described the natural proportion of things in the universe. The ratios are derived from the following number series: 0, 1, 1, 2, 3, 5, 8, 13, 21, 34, 55, 89, 144. This number series always starts at 0 and then adding 0+1 to get 1, which is the third number. Then, adding, the second and third numbers to get 2, which is the fourth number and so on.

The Fibonacci ratios are generated by dividing a Fibonacci number to its succeeding Fibonacci number. For instance, both 34 & 55 are Fibonacci numbers, and when we divide 34 with 55, we get 0.618, which is a Fibonacci Ratio. We also call them as Fibonacci Retracements. If we calculate the ratios between two alternative numbers, we get Fibonacci Extensions. For example, when we divide 34 by 89, it will be equal to 0.382, which is a Fibonacci Extension. Below, we have mentioned a few Fibonacci Retracement and Extention values for your reference.

Fibonacci Retracements - 0.236, 0.382, 0.500, 0.618, 0.764 etc.

Fibonacci Extensions - 0, 0.382, 0.618, 1.000, 1.382, 1.618 etc.

Many theories say that once the market makes a big move in one direction, the price will retrace or return partly to the previous Fibonacci retracement levels before resuming in the original direction. Hence traders use Fibonacci retracement points as potential support and resistance levels.

Many traders watch for these levels and place buy and sell orders at these prices to enter or place stops. Traders also use Fibonacci extension levels as profit-taking zones. In order to apply Fibonacci levels on the charts, we need to identify Swing highs and Swing low points, which will be discussed in the upcoming articles.

Fibonacci trading is one of the major branches of Technical Analysis. So it becomes compulsory for every trader to learn what this is all about. In the 21st century, almost all of the brokers provide charting software where we can find Fibonacci tools like indicators and Fibonacci calculators, which makes this aspect of trading very simple and easy.

[wp_quiz id=”62566″]
Categories
Forex Assets

Trading The USD/CZK Exotic Forex Currency Pair

Introduction

USDCZK is the short-form for the US Dollar against the Czech Koruna. Since CZK is involved in this pair, it is classified as an exotic currency pair. Here, the US Dollar is called the base currency and the CZK the quote currency.

Understanding USD/CZK

The value of USDCZK determines the value of CZK equivalent to one USD. It is quoted as 1 USD per X CZK. So, if the market value of this pair is 22.4773, then many Koruna is required to buy one US Dollar.

Spread

Spread is the difference between the bid and the ask prices set by the broker. The amount of spread varies based on the type of execution model.

ECN: 16 pips | STP: 18 pips

Fees

The fee is a commission that has to be paid to the broker for every trade the clients take. This value depends on the type of execution model used by the broker. As a matter of fact, there is no fee on STP accounts.

Slippage

The difference between the trader’s required price and the broker’s executed price is referred to as the slippage. The slippage size depends on the broker’s execution speed and the volatility of the market.

Trading Range in USD/CZK

The minimum, average, and maximum volatility of the market are necessary to assess the profit/loss that can be made on a trade. And is a representation of the same for USDCZK.

Procedure to assess Pip Ranges

  1. Add the ATR indicator to your chart
  2. Set the period to 1
  3. Add a 200-period SMA to this indicator
  4. Shrink the chart so you can determine an extensive period
  5. Select your desired timeframe
  6. Measure the floor level and set this value as the min
  7. Measure the level of the 200-period SMA and set this as the average
  8. Measure the peak levels and set this as Max.

USD/CZK Cost as a Percent of the Trading Range

The total cost depends on the volatility of the market. Below is a table that shows the variation in the total costs for different volatilities in terms of percentages.

NOTE: These percentages are obtained by finding the ratio between the total cost and the volatility of the market in different timeframes.

ECN Model Account

Spread = 16 | Slippage = 3 |Trading fee = 3

Total cost = Slippage + Spread + Trading Fee = 3 + 16 + 3 = 22

STP Model Account

Spread = 18 | Slippage = 3 | Trading fee = 0

Total cost = Slippage + Spread + Trading Fee = 3 + 18 + 0 = 21

The Ideal way to trade the USD/CZK

The volatility in this currency pair is pretty high compared to major and minor currency pairs. And the costs are low by default for the exotic currency pairs. However, it is not ideal for this pair at any time.

The main focus of exotic currencies is to trade when the volatility is not too high. Hence, trading when the volatility is around average and maximum values in the volatility table will ensure decent volatility with lower costs as well.

Another simple technique to reduce costs is by placing limit/stop orders instead of executing by the market. In doing so, the slippage will be taken away from the total costs, which will, in turn, reduce the total cost of the trade.

Categories
Crypto Guides

Hyperledger Technology – The Enterprise Blockchain Solution

Introduction

Blockchain is proving to be ubiquitous in a short period from its invention, with the first significant application being a cryptocurrency. Just like how we use HTML while browsing the internet today, blockchain is going to be the hidden layer in many applications, soon making users not even know that blockchain is implemented in the software we are using. Hyperledger technology is an open-source umbrella project of different blockchain platforms and related tools developed by the Linux Foundation to address enterprise-level issues with blockchain technology.

Since blockchain is the underlying technology of the Hyperledger project, it has been made open source so that anyone can contribute to the code, thus making the development faster to meet the enterprise-grade requirements. IBM, Intel, and SAP Ariba are other significant contributors to the Hyperledger project. There are different platforms available in Hyperledger Technology, prominent ones being Hyperledger Fabric, Hyperledger Sawtooth, and Hyperledger Indy. Let us have a look at these platforms in detail below:

🧬 Hyperledger Fabric

Hyperledger Fabric is the first project proposed to Linux’s Hyperledger project, where IBM has made a significant contribution. This platform is best suitable for healthcare, agriculture, manufacturing, and capital markets. The Fabric project can bring transparency and clarity to the real world. Tuna fish is a 40-billion-dollar market plagued with a lot of illegal activities right from the source to the consumer plate.

Using the Hyperledger Fabric project ‘Supply Chain of Tuna fish’, we can track each part of the process. While there will be many actors playing their role in the network, not every actor is know about the entire process. Only the fisher and say the owner of the restaurant, which uses the tuna, will be updated with the whole process as requires so that they can transact privately. Hyperledger Fabric V2.0 is the latest standard release in Jan 2020.

🧬 Hyperledger Sawtooth

Intel made most of the contributions to the Hyperledger Sawtooth project. The Sawtooth platform supports the dynamic change of the consensus algorithm, which is very helpful at the enterprise level. This enables the enterprises and consortia to make transactions, consensus algorithms that support their business needs.

Also, another unique characteristic of Sawtooth is that it supports both permissioned and permissionless blockchain networks. Like Fabric, Sawtooth is also used in the Supply chain. Sawtooth Marketplace is used for trading digital assets in specified amounts, whereas Sawtooth Private UTXO is used for digital asset creation and trading. Version 1.2 is the latest release of Sawtooth.

🧬 Hyperledger Indy

Hyperledger Indy is a unique platform that stores digital identities of different blockchains and distributed ledgers. The stored digital identities are interoperable across various domains and different blockchains. It indeed acts as a decentralized repository of identities, which drastically helps in reducing identity thefts if used across the globe.

To quickly deploy these platforms at the enterprise level, different tools are developed as well where Hyperledger composer is the one used to deploy Hyperledger Fabric, but it is almost dead now. Hyperledger Caliper, Cello, Explorer, Quilt are some other tools that are used.

Conclusion

Hyperledger, as an enterprise-grade platform for blockchain implementations in various industries, is encouraging the adaptation of blockchain widely. This being an opensource project, many people are contributing to the source code, which is, in turn, moderated by the governance board and approves the changes in a very efficient and transparent way. The Hyperledger umbrella has many projects in the pipeline, which will bring more efficiency in the business, thus saving millions in cost.

Categories
Forex Assets

Asset Analysis – EUR/HKD Exotic Currency Pair

Introduction

EUR/HKD is the abbreviation for the Euro area’s euro against the Hong Kong dollar. It is classified as an exotic currency pair that usually has high volatility and low trading volume. Here, the EUR is the base currency, and the HKD is the quote currency.

Understanding EUR/HKD

The current value of the pair represents the value of HKD that is equivalent to one USD. It is quoted as 1 EUR per X HKD. For example, if the value of this pair is 9.8764, then these many units of HKD are required to buy one US dollar.

Spread

In trading, the difference between the bid price and the ask price is referred to as the spread. Spread typically varies from broker to broker. The approximate spread on ECN and STP accounts is given below.

ECN: 17 pips | STP: 18 pips

Fees

The fee is the commission you pay to your broker for each position you open. The value of this, too, is in the hands of the broker. However, note that there are no fee STP accounts.

Slippage

Slippage is the difference between the price at which the trader executed the trade and the price he actually received from the broker. Essentially, slippage depends on two factors:

  • Broker’s execution speed
  • Market’s volatility

Trading Range in EUR/HKD

Knowing how much profit you can make or how much loss you can incur in a trade in a specific time frame is vital. The Trading Range can be assessed using the table given below. It represents the minimum, average, and maximum pip movement in EURHKD in different timeframes.

Procedure to assess Pip Ranges

  1. Add the ATR indicator to your chart
  2. Set the period to 1
  3. Add a 200-period SMA to this indicator
  4. Shrink the chart so you can determine a large period
  5. Select your desired timeframe
  6. Measure the floor level and set this value as the min
  7. Measure the level of the 200-period SMA and set this as the average
  8. Measure the peak levels and set this as Max.

EUR/HKD Cost as a Percent of the Trading Range

Total cost is not constant for every trade you take. It varies based on the volatility of the market. And the variation of it can be obtained from the two tables given below.

ECN Model Account

Spread = 17 | Slippage = 3 |Trading fee = 3

Total cost = Slippage + Spread + Trading Fee = 3 + 17 + 3 = 23

STP Model Account

Spread = 18 | Slippage = 3 | Trading fee = 0

Total cost = Slippage + Spread + Trading Fee = 3 + 18 + 0 = 21

The Ideal way to trade the EUR/HKD

Exotic currency pairs tend to have high volatility and low volume. And it is not ideal to trade during these times. So, let us find out the best times of the day to trade this currency pair by comprehending the above tables.

The higher percentages depict higher costs on the trade. It can be ascertained that the percentages are on the upper side in the min column. Hence, we can conclude that the costs are high when the volatility of the market is high and vice versa.

And, when it comes to determining the right time to enter the market, one may open positions when the volatility of the market is around the average volatility. This method will ensure both decent volatility and low costs.

Market orders result in slippage, and limit orders do not. Hence, placing limit orders is another way through which one can considerably reduce their total costs on the trade.

Categories
Forex Assets

Analyzing The USD/NOK Exotic Forex Currency Pair

Introduction

USD/NOK is the abbreviation for the US Dollar against the Norwegian Krone. This pair comes under the classification of exotic currency pairs. In this pair, USD is the base, and NOK is the quote currency.

Understanding USD/NOK

The value of USDNOK determines the value of NOK that is equivalent to one US Dollar. It is quoted as 1 USD per X NOK. So, if the market value of this pair is 9.2913, then these many units of Norwegian Krone are required to buy one US Dollar.

Spread

Spread is the difference between the bid price and the ask price in the market. This difference is the revenue for the brokers. Spread typically varies on how the broker executes the trades. The approximate spread on ECN and STP accounts is given below.

ECN: 13 pips | STP: 15 pips

Fees

The commission that a broker charges their clients is referred to as the fee. This is not constant and varies from broker to broker. The fee on ECN accounts is around 5-10 pips, and on STP accounts, it is nil.

Slippage

Slippage is the difference between the trader’s demanded price and the actual executed price. Market volatility and the broker’s execution speed are the reasons for slippage to occur.

Trading Range in USD/NOK

A trading range is the tabular representation of the minimum, average, and maximum pip movement in a currency pair. Below are the values of USDNOK that help us assess the profit/loss one can incur in a trade.

Procedure to assess Pip Ranges

  1. Add the ATR indicator to your chart
  2. Set the period to 1
  3. Add a 200-period SMA to this indicator
  4. Shrink the chart so you can determine a large time period
  5. Select your desired timeframe
  6. Measure the floor level and set this value as the min
  7. Measure the level of the 200-period SMA and set this as the average
  8. Measure the peak levels and set this as Max.

USD/NOK Cost as a Percent of the Trading Range

Here we take the ratio of the total cost on the trade and the volatility values and represent them in percentages. These percentages are then used to determine the cost variation in trade in different timeframes.

ECN Model Account

Spread = 13 | Slippage = 3 |Trading fee = 3

Total cost = Slippage + Spread + Trading Fee = 3 + 13 + 3 = 19

STP Model Account

Spread = 15 | Slippage = 3 | Trading fee = 0

Total cost = Slippage + Spread + Trading Fee = 3 + 15 + 0 = 18

The Ideal way to trade the USD/NOK

In this section, we interpret what the above percentages actually mean and how to make use of it.

The magnitude of the percentages represents how high or low are the costs of trade. So the higher the values, the higher is the cost and vice versa. From the table, it can be ascertained that the costs are pretty on the higher in the min column. This means that the costs are high when the market’s volatility is low. But it is not ideal to trade during these times due to high costs.

To have an equilibrium on costs as well as volatility, it is perfect for entering during those times when the volatility of the current market is around the average values.

Now, if you still wish to reduce your costs, you may trade using limit orders instead of market orders. This will completely nullify the slippage on the trade and hence bring down the total cost as well.

Categories
Forex Assets

Everything About The USD/MXN Forex Currency Pair

Introduction

USDMXN is the abbreviation for the US Dollar against the Mexican Peso. It is classified as an exotic currency pair that usually has high volatility and low trading volume. Here, the US Dollar (on the left) is the base currency, and the MXN (on the right) is the quote currency.

Understanding USD/MXN

The market price of USDMXN represents the value of MXN that are required to purchase to one US Dollar. It is quoted as 1 USD per X MXN. So, if the market price of this pair is 18.7615, then this amount of MXN is required to buy one USD.

Spread

The difference between the bid and the ask price is referred to as the spread. Its value varies from the type of execution model of the broker.

ECN: 16 pips | STP: 17 pips

Fees

For every position a client takes from the broker, he must pay some fee on each. Note that there is no fee on STP accounts. However, there are few pips of fees on ECN accounts.

Slippage

The difference between the price requested by the client and the price that was given by the broker is referred to as the slippage. Its value depends on the volatility of the market and the broker’s execution.

Trading Range in USD/MXN

Assessing the amount of money you will win and lose beforehand, in a particular timeframe is critical in trading. Below is a volatility table through which one can determine the minimum, average, and maximum profit/loss they can encounter in a specified timeframe.

Procedure to assess Pip Ranges

  1. Add the ATR indicator to your chart
  2. Set the period to 1
  3. Add a 200-period SMA to this indicator
  4. Shrink the chart so you can assess a large time period
  5. Select your desired timeframe
  6. Measure the floor level and set this value as the min
  7. Measure the level of the 200-period SMA and set this as the average
  8. Measure the peak levels and set this as Max.

USD/MXN Cost as a Percent of the Trading Range

By applying the total cost to the above table, we can even determine the cost variation in a trade. The ratio between the two expressed in percentage will help us determine the ideal times of the day to trade the currency pair.

ECN Model Account

Spread = 16 | Slippage = 3 |Trading fee = 3

Total cost = Slippage + Spread + Trading Fee = 3 + 16 + 3 = 22

STP Model Account

Spread = 17 | Slippage = 3 | Trading fee = 0

Total cost = Slippage + Spread + Trading Fee = 3 + 17 + 0 = 20

The Ideal way to trade the USD/MXN

Comprehending the above tables is simple. The percentage values are directly proportional to the total cost of the trade. It is seen that the percentages are comparatively high on the min column and vice versa. Now, coming to the ideal time to enter the market, it would be when the volatility of USDMXN is somewhere around the average pip movement. Trading in such moments will ensure low costs as well as lower liquidity.

Furthermore, you reduce costs by placing orders using limit/pending orders instead of market orders. This will significantly bring down the total costs as the slippage will be zero at this point in time. I hope this article will help you trade this pair in a much efficient way. Cheers!

Categories
Forex Course

59. Trading The Candlestick Charts Using Support and Resistance Levels

Introduction

In the previous few lessons, we have discussed many candlestick patterns and how to trade them. Those basics are very important for us to master Technical Analysis. Before leaving the Candlestick topics, let’s discuss THE most important concept in technical trading i.e., Support & Resistance. We shall first understand what Support and Resistance are, and will learn how to trade them on the Candlestick charts.

What Is Support?

Support is the level at which the price finds it difficult to fall below. Eventually, the price will bounce back up at this particular level. The support level acts as a floor that restricts price action to go down further. Some technical traders describe ‘Support’ as an area where demand overcomes supply. Because at this level, the demand for any currency will be more, hence the selling stops, and buying continues. The price reaction of any given asset would look something like the image below at the Support level. We can clearly see the price bouncing back up once it reaches the support level. (Blue Line = Support Level)

What Is Resistance?

Resistance is just the opposite of the support level. It is the level where price finds it difficult to break through to rise above until it is pushed back down. It acts as a ceiling restricting the price action to go up further. Basically, it is an area where supply overcomes demand. The price reaction of any underlying currency at a resistance looks something like the image below. We can see the price reaching the resistance line many times but unable to break through it. We must remember that at any point, Support can turn into Resistance and Resistance can turn into support. Hene, it is called S&R.

Pairing candlesticks with S&R

The fundamental method of technical trading is to buy at Support and Sell at Resistance. But this does not always work as there is no sure shot assurance that the Support and Resistance levels will hold for long. Hence traders need to look at other important factors while trading at Support and Resistance.

When buying near Support, we must wait for the consolidation at that area and only buy when the price breaks above that small consolidation. In that way, we can be sure that the price is respecting that level and is starting to move higher. The same concept applies when selling at resistance. Wait for consolidation and then enter a short trade when the price drops below the low of the small consolidation.

Below is an example of a short trade.

After entering the trade, make sure to place the stop-loss just below the low and above the high of Support & Resistance, respectively.

According to technical analysis principles, if a Support level or Resistance level is broken, their role is reversed, i.e., Support becomes Resistance and Resistance becomes Support. The psychology behind this phenomenon is that, when price breaches a key area, some will get out, and some hold on to their trades to see what happens. When price retraces back to the key area, people who have held it, go out and making the price bounce at the previous Support and Resistance.

Conclusion 

Traders always suspect a reversal at the key Support and Resistance as there is a high probability that price will reverse at these key levels. Some traders who had open positions exit at these price levels and others initiate new positions at these levels, depending on which side the price are they. Support and resistance levels are psychological levels at which many traders place orders to buy (support) or sell (resistance) making them supply or demand levels. That is why it is crucial to learn about Support and Resistance.  Also, support and resistance levels can be identified more easily using candlesticks, as a candle is very graphical, displaying wicks when the price bounces back from bottoms or tops. Identifying these significant levels forms the basis for Technical Analysis. Cheers!

[wp_quiz id=”61918″]
Categories
Forex Assets

Understanding The Trading Costs Involved In USD/TRY Exotic Currency Pair

Introduction

USDTRY, an exotic currency pair, is the abbreviation for the US Dollar against the Turkish Lira. One can expect high volatility in these pairs. Here, the US Dollar is called the base currency and TRY the quote currency.

Understanding USD/TRY

The value of USDTRY depicts the value of TRY equivalent to one USD. It is quoted as 1 USD per X TRY. So, if the market value of this pair is 5.9878, then 5.9878 Liras are required to buy one US Dollar.

Spread

Spread is the difference between the bid price in the market and the ask price in the market. These prices are set by the brokers. Hence, the prices from each broker differ. Moreover, it varies from the type of execution as well.

ECN: 12 pips | STP: 14 pips

Fees

The commission that you pay to your broker for taking a position in a currency pair is a fee on the trade. This, too, depends on the type of execution model. There is typically no fee on STP accounts. And on ECN accounts, there are a few pips of fees.

Slippage

Slippage is the difference between the trader’s requested price and the broker’s executed price. It depends on two factors, namely, the broker’s execution speed and market volatility.

Trading Range in USD/TRY

The trading range is the range of the pip movement in a currency pair on different timeframes. With it, traders can determine their minimum, average, and maximum risk on a trade in a specified time frame.

Procedure to assess Pip Ranges

  1. Add the ATR indicator to your chart
  2. Set the period to 1
  3. Add a 200-period SMA to this indicator
  4. Shrink the chart so you can determine a large time period
  5. Select your desired timeframe
  6. Measure the floor level and set this value as the min
  7. Measure the level of the 200-period SMA and set this as the average
  8. Measure the peak levels and set this as Max.

USD/TRY Cost as a Percent of the Trading Range

Apart from knowing how many pips the market moves in a given timeframe, it is also necessary to understand the total cost variation in a trade. And below are two tables (for ECN and STP) that will help determine the best time of the day to trade in the currency pair with reduced costs.

ECN Model Account

Spread = 12 | Slippage = 3 |Trading fee = 3

Total cost = Slippage + Spread + Trading Fee = 3 + 12 + 3 = 18

STP Model Account

Spread = 14 | Slippage = 3 | Trading fee = 0

Total cost = Slippage + Spread + Trading Fee = 3 + 14 + 0 = 17

The Ideal way to trade the USD/TRY

The costs on major currencies are pretty low, and the volatility is great. So it is ideal to enter any time in the market to trade these pairs. But, when it comes to exotic pairs, the volatility, as well as the costs, are quite high. Hence, one must be aware of when exactly they should trade these currencies.

The percentages in the above tables are directly proportional to the volatility of the market. Hence, we can conclude that costs are when the volatility is low and vice versa.

To determine the ideal times of the day to trade, you must glance at the volatility table and check if the current volatility if nearby the average values mentioned in the tables. If they are more or less in that range, you are good to trade that currency pair because this will assure a balance between both volatilities as well as costs.

Also, another simple way to reduce costs is by getting rid of the slippage on the trade. This can be done by executing orders using limit orders instead of market orders. In doing so, the total costs will reduce by a significant amount, and so will the cost of the trade.

Categories
Forex Assets

Trading The USD/SEK Exotic Forex Currency Pair

Introduction

USDSEK, the US Dollar against the Swedish Krona, is an exotic currency pair in the forex market. USD is called the base currency and SEK the quote currency. Coming under the classification of exotic pairs, the volatility in this pair is pretty high.

Understanding USD/SEK

The value of USDSEK represents the quantity of SEK that is required to purchase one US Dollar. It is quoted as 1 USD per X SEK. So, if the current of this pair is 9.6123, then these many units of Swedish krona are required to buy one US Dollar.

Spread

Spread is the difference between the bid price and the ask price set by your broker. It varies from each broker. It also varies on how they execute the trade as well.

ECN: 12 pips | STP: 14 pips

Fees

There is some fee associated with each trade you take in the market. The fee, too, varies from broker to broker and the type of execution model.

Fee on ECN – 5-10 pips

Fee on STP – 0

Slippage

Slippage is the algebraic difference between the price needed by the client and the price the broker actually gave him. There is this difference due to the market’s volatility and the speed of execution of the trade. Note that slippage is quite high on exotic pairs.

Trading Range in USD/SEK

The below table is the representation of the minimum, average, and maximum pip movement on the USDSEK pair. These values help us assess the gain that can be made or loss that can be incurred in a trade in a given timeframe.

Procedure to assess Pip Ranges

  1. Add the ATR indicator to your chart
  2. Set the period to 1
  3. Add a 200-period SMA to this indicator
  4. Shrink the chart so you can determine a large time period
  5. Select your desired timeframe
  6. Measure the floor level and set this value as the min
  7. Measure the level of the 200-period SMA and set this as the average
  8. Measure the peak levels and set this as Max.

USD/SEK Cost as a Percent of the Trading Range

An application to the above table is the cost variation in a trade. By calculating the ratio between the total cost and the volatility values, we can determine the perfect times of the day to trade in the market. The comprehension of it is discussed in the upcoming topics.

ECN Model Account

Spread = 12 | Slippage = 3 |Trading fee = 3

Total cost = Slippage + Spread + Trading Fee = 3 + 12 + 3 = 18

STP Model Account

Spread = 14 | Slippage = 3 | Trading fee = 0

Total cost = Slippage + Spread + Trading Fee = 3 + 14 + 0 = 17

The Ideal way to trade the USD/SEK

Trading exotic currency pairs are different from trading major and minor currency pairs because volatility and volume are different. And when it comes to costs, the costs are higher in exotic pairs compared to major and minor pairs.

The magnitude of the percentage depicts the costs on the trade and is proportional to it. High values in the min column tell that the costs are high when the market volatility is low and vice versa.

To have sufficient volatility with affordable costs, one may trade those times when the volatility is around the average values.

Moreover, limit orders also help in reducing the costs by a significant amount. This is because only market orders have slippage, and limit orders don’t. Hence, cutting off slippage from the total costs will reduce the costs of the trade considerably.

Categories
Forex Course

58. Exploring More Candlestick Patterns – Cheat Sheet!

Introduction

In the previous lessons, we have discussed many candlestick patterns out of which some were single, some were multi-candlestick patterns (Dual & Triple). But there are many more patterns that one needs to be aware of. Since it is not possible to cover each and every one of them, we have picked some of the most profitable and important patterns everyone should be aware of. So, this article basically acts as a cheat sheet for any reference. By referring to this guide, one can get the basic price-action structure of all these important patterns that are mentioned below.

Hammer Candlestick Pattern

It is a single candlestick pattern signaling a possible reversal to the upside. The Hammer is mostly seen after a prolonged downtrend. On the day this pattern is formed, the market will be inclined towards the sell-side. As the candle comes to a close, the market recovers and closes near the unchanged mark or maybe a bit higher.


That is a clear indication of the market reversal. We must take trades only after the appearance of a confirmation candle and not before. So we see a bullish candle on the charts immediately after the Hammer pattern, consider buying the currency pair.

Doji Candlestick Pattern

This pattern is formed from a single candle and is considered a neutral pattern. A Doji represents the equilibrium between demand and supply. The appearance of this pattern indicates a tug of war in which neither the bulls nor the bears are winning.


In the case of an uptrend, the bulls will be winning the battle, and the price goes higher, but after the appearance of Doji, the strength of the bulls is in doubt. The opposite is true in case of a downtrend. If we come across this pattern, we must wait for extra confirmation to take any action.

Piercing Candlestick Pattern

The Piercing Pattern is a two candle reversal pattern that implies a possible reversal from downtrend to an uptrend. This pattern is typically seen at the end of a downtrend. The second candle in the pattern must be bullish and should open below the low of the previous day and closing more than halfway into the previous day’s bearish candle.


We generally will have two options after noticing this pattern. Either we can buy the forex pair to benefit from the uptrend that is about to begin, or we can look at buying ‘options’ to reduce risk.

Engulfing Candlestick Pattern

It is two candle reversal pattern that is formed at the end of a downtrend or an uptrend. Bullish Engulfing Pattern is formed when a small ‘Red’ candlestick is followed by a large ‘Green’ candlestick that completely engulfs the previous day’s candle. For a Bearish Engulfing Pattern, the situation is vice-versa.


The shadows of the small candle should be preferably short, and the body of the large candle should overpower the entire previous day’s candle. When we come across a Bearish candlestick pattern, we must activate our sell trades and vice-versa.

Meeting Line Candlestick Pattern

This pattern is a two candle reversal pattern that occurs in a downtrend. The first candle must be a bearish candle followed by a second long bullish candle that gaps down and closes higher. It has the close at the same level as the close of the first candle.


This pattern only signals partial bullishness and buying strength, but not completely. Traders must look for other signs of reversal than just relying on the pattern stand-alone because just the Meeting Line pattern is not a clear confirmation for a complete reversal of the trend.

Harami Candlestick Pattern

It is a dual candlestick reversal pattern indicating the reversal of a bullish or bearish trend. In Bullish Harami pattern, the first candle is usually a Red candle with a large real body, and the second one is a small Green Candle. It’s opposite in the case of a bearish Harami pattern.        

Traders must look at the appearance of a bullish Harami pattern as a good sign of taking long positions in the market. Likewise, we must be shorting once we confirm the appearance of the bearish Harami Pattern.

Three Black Crows Candlestick Pattern

This pattern consists of three Red candles and predicts the reversal of an uptrend. It does not occur very frequently, but when it occurs, we can be sure that the market is going to reverse.


The first candle in this pattern is a long bearish candle that appears in a prevailing uptrend. The second and third are also approximately the same size and color, indicating that bears are firmly in control. This pattern is most useful for long-term traders, who take short positions and hold them for several weeks.

Abandoned Baby Candlestick Pattern

It is a three candle reversal pattern that occurs during a downtrend. The first candle in this pattern is a bearish one. The second candle is a Doji, which gaps down from the previous candle. The third candle is a long bullish candle and opens above the second candle.


We must take long positions only if the price breaks above the third bar in this pattern. Also, make sure to use a stop-limit order for additional risk management.

Deliberation Candlestick Pattern

The Deliberation is a three-line bearish reversal candlestick pattern that occurs during an uptrend. This pattern is comprised of three bullish candles. The first and second candles have significantly large bodies than the third one.


This pattern signals a bearish reversal of the current uptrend. The confirmation is usually a Red candle that overcomes the midpoint of the second candle’s body. We can take aggressive short positions in the currency pair right after we notice the confirmatory candle. This pattern is rarely seen on the price charts, but it does appear, it is highly rewarding.

Three Line Strike Candlestick Pattern

We have discussed single, dual, and triple candlestick patterns till now. Three Line Strike is the first four candlestick pattern, which signals the continuation of the current trend. This pattern can be found in both bullish and bearish markets, depending on the trend.

In an uptrend, the first, second, and third are bullish, and each candle needs to close above the previous candle. The fourth candle is bearish and closes below the open of the first candle. We can take long positions only after the trend is confirmed by technical indicators like RSI & MACD

Learning to recognize and interpret candlestick patterns is important for anyone who aspires to be a professional technical trader. Perfecting this skill will take time and practice. But once you master these patterns, you can trade with enough confidence as you will know how to read the market better.

That’s about candlestick patterns and how to trade them. In the upcoming lesson, we will see how to trade candlesticks using support and resistance levels. We hope you practice these patterns better and become a better trade. Kindly let us know if you have any questions in the comments below. Cheers.

[wp_quiz id=”61830″]
Categories
Forex Assets

Analyzing The USD/HUF Forex Exotic Currency Pair

Introduction

The US Dollar versus the Hungarian Forint, in short, is represented as USDHUF. It is an exotic currency pair in the forex market. It has got high volatility and lower volume compared to major and minor currencies. Here, USD is the base currency, and HUF is the quote currency.

Understanding USD/HUF

The value of this pair represents the number of HUF that are required to buy one US Dollar. It is quoted as 1 USD per X HUF. If the current market price of USDHUF is 307.72, these many Hungarian Forints are needed to purchase one unit of USD.

Spread

Spread is the primary way through which brokers generate revenue from their clients. The pip difference between the bid price and the ask price is their revenue, which is referred to as the spread. Spread is different on ECN accounts and STP accounts.

ECN: 16 pips | STP: 15 pips

Fees

On ECN accounts, one has to pay some pips of fee on each position you take. The fee is usually high on exotic pairs and comparatively less on major and minor pairs. However, on STP accounts, the fee is nil.

Slippage

Slippage in trading is the difference between the client’s intended price and the price the broker actually gave him. Slippage is affected by two factors:

  • Broker’s execution speed
  • The volatility of the market

Trading Range in USD/HUF

The representation of the minimum, average, and maximum volatility of a currency pair is the trading range. It shows the volatility of the market in different timeframes. And these values help in figuring the profit that can be gained or loss that can be incurred on a trade.

Procedure to assess Pip Ranges

  1. Add the ATR indicator to your chart
  2. Set the period to 1
  3. Add a 200-period SMA to this indicator
  4. Shrink the chart so you can assess a large time period
  5. Select your desired timeframe
  6. Measure the floor level and set this value as the min
  7. Measure the level of the 200-period SMA and set this as the average
  8. Measure the peak levels and set this as Max.

USD/HUF Cost as a Percent of the Trading Range

Cost as a per cent of the trading range is the representation of the cost discrepancies for different volatilities and timeframes. With these values, we can determine the moments of the day when the costs are less. And this shall be discussed in detail in the next topic.

ECN Model Account

Spread = 16 | Slippage = 3 |Trading fee = 3

Total cost = Slippage + Spread + Trading Fee = 3 + 16 + 3 = 22

STP Model Account

Spread = 15 | Slippage = 3 | Trading fee = 0

Total cost = Slippage + Spread + Trading Fee = 3 + 15 + 0 = 18

The Ideal way to trade the USD/HUF

We know that exotic currency pairs typically have high volatility and low trading volume. Also, the total costs on trade are pretty expensive. Hence, one must be choosy while deciding when to enter the market.

The higher percentage values in the min column represent that the costs are high when the volatility of the market is low. And the opposite is the case for lower percentage values. However, it is not ideal to trade during any of these times.

One may trade these currency pairs during those times of the day when the volatility values are around the average values. This will ensure decent volatility as well as low costs on the trade.

Furthermore, another simple way to reduce costs is by trading using limit orders and not market orders. Because this will take away the slippage on the total cost, and this will, in turn, reduce the total cost significantly. An example of the same is given below.

With slippage

Spread = 16 | Slippage = 3 |Trading fee = 3

Total cost = Slippage + Spread + Trading Fee = 3 + 16 + 3 = 22

Without slippage

Spread = 16 | Slippage = 0 |Trading fee = 3

Total cost = Slippage + Spread + Trading Fee = 0 + 16 + 3 = 19

Categories
Forex Basic Strategies

Trading The ‘AB=CD’ Harmonic Pattern Using Fibonacci Ratios

Introduction

H.M Gartley published a book known as ‘Profits in the Stock Market’ in 1932. In this book, Gartley shared the entire group of harmonic patterns that are widely being used by traders across the world. AB=CD is one such pattern from the harmonic group. As time has passed, professional traders and market technicians improved this pattern a lot. They have also incorporated the Fibonacci ratios to this pattern, which will be discussed in this article.

AB=CD is a reversal pattern that helps traders in predicting when the price action of an underlying asset is about to reverse. It is a visual geometric pattern comprised of three consecutive price swings. This pattern helps to identify the trading opportunities in all types of markets, on any timeframe, and in any kind of market condition. Bullish AB=CD pattern helps traders in identifying higher probability buy trades, whereas bearish AB=CD patterns help in determining selling opportunities.

This pattern includes a total of four letters – A, B, C, D. Each turning point represents a significant high or low on the chart. These turning points are referred to as AB move, BC move, and the CD move. Let’s see how traders must perceive this pattern in the upcoming sections.

AB=CD Pattern Rules

Bullish AB=CD Pattern

  • The bullish AB=CD pattern always appears in a downtrend.
  • First of all, point A to B will be any random downtrend move.
  • Then the price action must go into the counter side of the AB move, printing the B to C move.
  • The original selling trend should resume and print the CD leg resembling the AB leg.
  • Once all these three moves are completed, we can conclude that the market has printed the bullish AB=CD pattern
  • Activate the buy trades only at point D.

Bearish AB=CD Pattern

  • Bearish AB=CD pattern is nothing but a mirror image of the Bullish AB=CD pattern.
  • The pattern begins with a bullish line from point A to B.
  • These points could be any random move in an uptrend.
  • B to C move should reverse the trend of the market but shouldn’t cross point A.
  • C to D move should be equal in size to point A and B.
  • Once all these moves are completed, we can conclude that the market has printed the bearish AB=CD pattern
  • Start taking sell trades only from point D.

AB=CD Pattern – Fibonacci Ratios

As already mentioned, Fibonacci ratios can be used to confirm the validity of the AB=CD patter. Below are the fib levels that are incorporated in the AB=CD pattern by trading experts for pattern validation.

BC leg is the 61.8% Fib retracement of AB leg.

CD leg is the 127.2% Fib retracement of BC leg.

Only at these retracement levels, the length of AB will be equal to the length of the CD.

Only take the trades if these above Fibonacci levels are matching with the setup on your charts. Ignore the setup if the Fib levels aren’t matching.

As you can see in the above image, the BC move retraces 61.8 of the AB and CD move is the 127.2% extension of the BC move. Also, the length of the AB move is equal to the extent of CD, i.e., both the movements must take the same time to develop on the charts. If any underlying currency pair is confirming all the mentioned rules, only then we can safely anticipate a higher probability trade.

AB= CD Pattern Trading Strategy

We believe by now, you understood the formation of the AB=CD pattern very well. Now let’s combine this pattern with the Fibs ratio as discussed to learn how to trade this pattern in the right way. As soon as we identify this pattern on the price chart, the only problem most of the traders have is while determining the accurate Fib ratios. Novice or intermediate traders go wrong most of the time in this aspect. As a result, they lose their trade. So make sure always to set the accurate fibs ratio and only then trade the AB=CD setup.

Bullish AB=CD Pattern

In the below EUR/USD 240 minutes chart, we can see that the pair was in an overall downtrend. We can also see that the CD move is equal in size to AB move. Also, after applying Fib ratios, we now know that the BC is 61.8% retracement of the AB move, and CD is the 127% extension of the BC. Therefore we can confirm the validity of the Bullish AB=CD pattern.

Entry, Stop-loss & Take Profit

Execute a buying trade at point D. Furthermore, always place the stops just below the D point. This is because, if price action goes beyond this point, it invalidates the pattern. This pattern provides two ‘take profit’ targets. The first one is point C, and the other is point A. We have closed our full position at point A because after activating our trade, the price action immediately blasted to the north. This indicates that we can expect more extended targets in this pair.

Bearish AB=CD Pattern

In the below 60 minute chart of the NZD/CAD Forex pair, the market was in an uptrend. This means that if at all, we are expecting an AB=CD pattern, it will be bearish. Notice that the AB is completely equal in size to the CD move. Following the rules of the pattern is critical while trading the AB=CD pattern. After applying Fibs, we can see that the BC is 61.8% retracement of the AB move, and the CD move was also a 127% extension of the BC move on the price chart. This confirms the authenticity of the bearish AB=CD pattern. We have executed a sell trade at point D. Although it was not a smooth ride, we have closed our full position at the major support area.

Bottom Line 

AB=CD is one of the most popular trading patterns in the market. It is straightforward to identify, confirm, and trade as well. Also, we get to see this pattern frequently in the market, and traders can pair it with other forms of technical analysis to improve the odds of their trades. Always remember to follow the rules of the game; else, it is very difficult to win the game of trading. We hope you find this strategy useful. Try applying this strategy on a demo account and then apply it on the live charts. If you have enough questions, let us know in the comments below. Cheers!

Categories
Crypto Guides

What Is SegWit & Why Is It Required?

Introduction

There are over two thousand cryptocurrencies and tokens in the market, and all of them have a set of rules to ensure they work properly. These rules are also referred to as protocols, and they are continuously in progress. Similarly to any computer code, mobile phones, and apps, the cryptocurrency protocols must be updated and improved, which means teams of programmers work every day to detect code errors, improve their performance and add new functionality. And SegWit is one of the updates that has been implemented in the Bitcoin protocol.

What is SegWit? 

Pieter Wuille was the man who came up with the idea of SegWit at a Bitcoin conference in 2015. Wuille claimed that SegWit was a possible solution to the flaw in the Bitcoin protocol. SegWit was a proposed solution to the problem of transaction malleability. Transaction malleability is a way of saying that coins can be stolen from the user just by changing tiny pieces of transaction information.

How does transaction malleability work?

Let’s say Bob sends 10BTC to Billy. But, with transaction malleability, Billy can trick Bob into sending him 20BTC instead of 10. The transaction malleability flaw in Bitcoin’s code enables Billy to tamper Bob’s witness before the transaction is confirmed on the blockchain network.

In this case, the transaction ID changes, but the transaction does not (10BTC were still sent from Bob to Billy). Now, Billy contacts Bob, saying that he hasn’t received 10BTC, though he actually has. Since the transaction id was altered, Bob checks and sees that the original transaction hasn’t been confirmed. So, seeing this, Bob sends 10BTC again to Billy. And Billy now receives 10 BTC more and 20 BTC in total.

The patch to transaction malleability

As mentioned earlier, a patch is a solution to this glitch in the Bitcoin protocol. SegWit is a patch designed by Pieter Wuille to bring a stop to transaction malleability. To prevent witness data from being used to alter the transaction ID, Peiter suggested removing it from the transaction. Hence, it is given the SegWit, which is the abbreviation for segregated witnesses, means to remove or separate the witness data.

A segregated witness creates something called as sidechain where witness data is stored aside from the main blockchain. This method efficiently prevents transaction IDs from being changed by dishonest users. Also, a smart thing about SigWit is that it’s backward compatible. So the nodes that are updated with the SegWit protocol can still work with nodes that are not updated yet. Such an update is called a soft fork, as opposed to updates that are not backward compatible, which are called hard forks.

Wuille wanted SegWit to be backward compatible so that the witness data was still recorded on the main blockchain. To solve this problem, he encrypted all the witness data of a block on the SegWit sidechain and then stored this root code on the main blockchain. Hence, transaction malleability was successfully patched without a hard-fork update.

The Pros on SegWit

💡 Patch to the transaction malleability – The problem of the malleability of transactions was solved by SegWit.

💡 Faster Blockchain transactions – SegWit makes the network much lighter. More transactions can be performed without increasing the overall block size.

💡 Room for more development – Things don’t end just at transaction malleability. If the use of blockchain increases drastically, the issue of scalability must be figured. And SegWit helped lightning network technology come to reality.

Conclusion

The problem of transaction malleability was a real concern to Bitcoin. A patch to it was really in need. Hence, Pieter Wuille came up with a successful patch to it. And this brought talks about the bright future of the Bitcoin platform. We hope you understood the concept of segregated witness (SegWit). If you have any questions, let us know in the comments below. Cheers!

Categories
Forex Assets

USD/DKK – Analyzing the Exotic Forex Pair

Introduction

USD/DKK is the abbreviation for the US Dollar against the Danish Krone. This pair is considered as an exotic currency pair that typically presents high volatility and low trading volume. The US Dollar is the base currency, and the Danish Krone is the quote currency.

Understanding USD/DKK

The value of USD/DKK represents the value of DKK that is equivalent to one US Dollar. It is quoted as 1 USD per X DKK. So, if the current value of this pair is 6.9868, then these many Danish Krones are required to purchase one US Dollar.

Spread

Spread is the difference between the bid and the ask price of a currency pair. It is the primary way through which brokers generate revenue. It varies from broker to broker and also the model of execution.

ECN: 14 pips | STP: 15 pips

Fees

The fee is simply the commission that you pay on each trade you take.

Fee on ECN – 3-6

Fee on STP – 0

Slippage

Slippage is the difference between the price which was intended by the client and the price he got from the broker. This difference changes with the market’s volatility and the broker’s execution speed. Slippage on exotic pairs is typically high.

Trading Range in USD/DKK

As it is pretty evident from the table, the trading range is an illustration of the pip movement in a currency pair in different timeframes. These values help us determine the minimum, average, and maximum profit or loss that can be incurred in a trade during a specified time frame. Another application for this table is discussed in the next topic.

Procedure to assess Pip Ranges

  1. Add the ATR indicator to your chart
  2. Set the period to 1
  3. Add a 200-period SMA to this indicator
  4. Shrink the chart so you can determine an extensive period
  5. Select your desired timeframe
  6. Measure the floor level and set this value as the min
  7. Measure the level of the 200-period SMA and set this as the average
  8. Measure the peak levels and set this as Max.

USD/DKK Cost as a Percent of the Trading Range

Cost as a percent of the trading range is an application to the above volatility table. The below two tables depict the total cost variation in different volatilities and timeframes for ECN and STP accounts.

Note: The percentages are obtained by finding the ratio between the total cost and the pip movement values in the above table.

ECN Model Account

Spread = 14 | Slippage = 3 |Trading fee = 3

Total cost = Slippage + Spread + Trading Fee = 3 + 14 + 3 = 20

STP Model Account

Spread = 15 | Slippage = 3 | Trading fee = 0

Total cost = Slippage + Spread + Trading Fee = 3 + 15 + 0 = 18

The Ideal way to trade the USD/DKK

What do the percentage values mean? Comprehending the above tables is simple. The higher the magnitude of the percentage, the higher are the costs for that particular volatility and timeframe. Similarly, lower percentage values mean that the costs are low.

Trading during high volatilities or when the cost is high is not ideal. So, to ensure an equilibrium between the two, it is best to enter the market during those times when the volatility is around the mid values illustrated in the volatility table.

Apart from this, one can reduce their total costs significantly by placing orders using limit/pending orders instead of market orders. This will altogether remove the slippage factor on the total cost and bring down its value by a high number.

As already mentioned, exotic currency pairs are highly volatile and have low trading volume. This results in higher costs on the trade. Hence, if you really want to trade this pair, it is recommended to follow the above-mentioned mentioned techniques to reduce costs by a considerable amount. Cheers!

Categories
Forex Course

57. Trading Triple Candlestick Patterns – Part 2 (Reversal)

Introduction

We have discussed some of the major triple candlestick continuous patterns in the previous articles. In this lesson, let’s talk about the triple candlestick reversal patterns. Morning Star and Three Inside Up patterns are very well known as they provide some of the most profitable signals. Let’s get right into the topic.

Morning Star Candlestick Pattern

Morning Star is a bullish candlestick pattern consisting of three candles and is interpreted as a bull force. The pattern is formed following a downtrend and indicates the start of an uptrend, which is a complete reversal. After an occurrence of the Morning Star, traders seek reversal confirmation through additional technical indicators. The RSI is one such indicator which tells that the market has gone into an oversold condition and that a reversal can happen anytime.

Below is how a Morning Star Pattern looks like on a price chart

Criteria for the Morning Star pattern

  1. The first candle is a long bearish candle with little or no wicks.
  2. The second candle is a smaller bullish or bearish candle that captures the indecision state of the market, where the sellers start to lose control.
  3. The third and last candle is a long bullish candle that confirms the reversal and marks a new uptrend.

A trader must lookout for a bullish position in the Forex pair once they identify the Morning Star pattern on the charts. Another important factor for traders to consider is to pair this pattern with a volume indicator for additional confirmation.

Three Inside Up Candlestick Pattern

The Three Inside Up is also a triple candlestick reversal pattern. This pattern indicates the signs of the current trend losing momentum, and warns the market movement in the opposite direction. It is a bullish pattern that is composed of large bearish candle, a smaller candle contained within the previous candle, and then a bullish candle that closes above the second candle.

Below is the picture of how the Three Inside Up pattern would appear on a chart.

Criteria for the pattern

  1. The market should be in a downtrend with a large bearish first candle.
  2. The second candle should open and close within the real body of the first candle, which shows that sellers have stopped selling further.
  3. The third candle is a bullish candle that closes above the second candle, trapping all the short-sellers and attracting the bulls.

Traders must take long positions at the end of the third candle or on the following green candle, which provides additional confirmation. This pattern is not always reliable when used stand-alone. So there are chances that the trend could reverse once again quickly. So risk management should be in place before taking any trades. A stop-loss must be placed below the second candle, and it depends on how much risk the trader is willing to take.

Conclusion

The opposite of the Morning Star candlestick pattern is the Evening star. Even this is a reversal pattern, but it signals a reversal of an uptrend into a downtrend. Likewise, the opposite of the Three Inside Up pattern is the Three Inside Down pattern, which reverses an uptrend. Learn about more triple candlestick patterns and how to trade them. The more you research, the better trader you will be. Cheers.

[wp_quiz id=”61446″]
Categories
Forex Course

56. Learning The Triple Candlestick Patterns – Part 1 (Continuous)

Introduction

After acquiring a fair bit of knowledge about Single and Double candlesticks patterns, let’s now proceed and learn the Triple Candlestick Patterns. A Triple Candlestick Pattern, as the name clearly suggests, is formed by three candles. In the next couple of articles, we discuss two Continuation patterns and two Reversal patterns to understand how these patterns are formed. Also, most importantly, we will be learning how to trade these patterns as well. So in this article, we will be discussing the basic & well-known Continuous Triple Candlestick Patterns – Three White Soldiers and Falling Three Methods.

Three White Soldiers Candlestick Pattern

Three White Soldiers is a bullish triple candlestick pattern that predicts the reversal of the short term downtrend. The reversal of this short term trend leads to the continuation of the long term trend, and hence this pattern is classified as a continuation Pattern. This pattern consists of three long-bodied candles that open within the previous candle’s body and close above the previous candle’s high.

Below is how the Three White Soldiers candlestick pattern looks on the price chart

Criteria for the pattern

  1. The second and third candles should open within the body of the previous candle
  2. All three candles in the pattern should not have very long shadows.
  3. The continuation pattern is confirmed by other technical indicators such as the RSI and EMA.

Three White Soldiers pattern is used by traders for both entry and exit. Traders, who were short in the currency pair will look for exit and traders who were following the long term uptrend take a bullish position and enter the market.

Falling Three Methods

The Falling Three Methods is a major trend continuation pattern and is sometimes referred to as five candle patterns because of the confirmation candles at the first and fifth positions. These two long candles confirm the trend and its continuation. The sole of this pattern is the three counter-trend candlesticks in the middle. This pattern should never be considered as a reversal pattern; it is a clear trend continuation pattern.

Below is an image of how the pattern looks on the price chart

Criteria for the pattern

  1. The Falling Three Methods is a bearish continuation pattern with two long candlesticks in the direction of the main trend and three counter-trend candles in the middle of the two big bearish candles.
  2. The series of small-bodied candles should be of the same color. However, a bearish Doji as the third candle can also be considered.

This pattern is used by traders to initiate new short positions or add to an existing one. A trade is taken only after the fifth candle, which confirms that the trend is going to continue. There are also traders who use the 10-day moving average to confirm that the market is in a downtrend. While trading this pattern, one needs to make sure that this pattern is not at the key support level.

Conclusion

These are two famous triple candlestick trend continuation patterns. Make sure not to use these patterns stand-alone. They must be paired with other credible technical tools like indicators or chart patterns to confirm the authenticity of signals they generate. In the upcoming lesson, let’s look at some of the Reversal Triple Candlestick Patterns. Cheers!

[wp_quiz id=”61436″]
Categories
Forex Assets

Understanding The USD/THB Exotic Forex Pair

Introduction

USD/THB is the abbreviation for the US Dollar versus Thailand’s Thai Baht. It is an exotic currency pair which usually has high volatility and low trading volume. US Dollar, in this pair, is the base currency, and the Thai Baht is the quote currency.

Understanding USD/THB

The value of USDTHB represents the number of THB that are equivalent to one USD. It is quoted as 1 USD per X THB. So, if the market price of this pair is 30.98, then one has to produce 30.98 THB to buy one USD.

Spread

Spread is the difference between the bid and the ask price of the currency pair set by the brokers. It typically varies from broker to broker and also from the type of order execution. The spreads on ECN and STP accounts are as shown below.

ECN: 10 pips | STP: 11 pips

Fees

There is a fee associated with every trade you take. The fee is also referred to as the commission on the trade. Its value is usually a constant but varies from the type of execution model. The fee on STP accounts is nil, while there are a few pips of fee on ECN accounts.

Slippage

Slippage is the difference between the trader’s required price and the price at which his trade was executed. Since exotic pairs are highly volatile, the slippage is quite high.

Trading Range in USD/THB

Below we shoe a table representation of the minimum, average, and maximum pip movement in a currency pair. These values help us determine the profit or loss that can be made on a trade in a given amount of time. All you have to do is, multiply any one of the below values with the value per pip ($32.26). The result is the potential profit gained or lost on the trade for one bar of the timeframe.

Procedure to assess Pip Ranges

  1. Add the ATR indicator to your chart
  2. Set the period to 1
  3. Add a 200-period SMA to this indicator
  4. Shrink the chart so you can assess a large period
  5. Select your desired timeframe
  6. Measure the floor level and set this value as the min
  7. Measure the level of the 200-period SMA and set this as the average
  8. Measure the peak levels and set this as Max.

USD/THB Cost as a Percent of the Trading Range

The cost as a trading range represents the cost variation in trade in different volatilities of the market. It is presented in percentages of the total range. Thus, it helps determine the best moments to enter the market to ensure lower costs.

ECN Model Account

Spread = 10 | Slippage = 3 |Trading fee = 3

Total cost = Slippage + Spread + Trading Fee = 10 + 3 + 3 = 16

STP Model Account

Spread = 11 | Slippage = 3 | Trading fee = 0

Total cost = Slippage + Spread + Trading Fee = 11 + 3 + 0 = 14

The Ideal way to trade the USD/THB

Trading exotic pairs are different from trading the major and minor pairs. However, there are times when one can trade this pair by making attempts to reduce the costs.

The magnitude of the percentages represents the costs of the trade. The higher the percentages, the higher are the costs on the trade. It can be seen from tables that the costs are high on the min column and comparatively lower in the max column. This clearly means the costs are high during high volatilities and vice versa.

However, when it comes to determining the right time to trade, one must trade during those moments when the volatility is around the higher values because this will ensure pretty great volatility as well as low costs.

Furthermore, another simple way to reduce costs is by trading using limit/stop orders instead of market orders. Limit orders will eliminate the slippage and significantly reduce the total cost of the trade.

Finally, we can see that we must be pretty sure of the direction and extension of the trend to trade the USDTHB, and avoid trading it intraday. Using the daily chart and limit orders, we still would need almost 4 Hours of a positive movement (with the trade) to pay the costs. Therefore we practical setups would ask for at least 2-3 days of market action for propper reward-to-risk factors.

Categories
Forex Course

55. Learning The Dual Candlestick Patterns – Part 2 (Reversal)

Introduction

In the previous lesson, we learned Continuous Dual Candlestick Patterns by taking examples of the two most traded patterns. In this lesson, we will see how to generate trading signals using Dual Candlestick reversal patterns. We will mainly look at the two widely used dual candlestick patterns – Engulfing and Dark Cloud Cover patterns. As the names suggest, both of these patterns consist of two candlesticks, and when we see them on a price chart, we should be anticipating a trend reversal shortly.

Engulfing Candlestick Pattern 

Engulfing is a two-candle trend reversal pattern. It got its name from the fact that the second candle completely engulfs the first candle, irrespective of its size. There are both Bullish Engulfing and Bearish Engulfing patterns. A Bullish Engulfing can be identified when a small (preferably) red candle of the downtrend is followed by a large green candle that overpowers the previous candle entirely. Vice-versa for a Bearish Engulfing Pattern.

Below is the picture of how the Bullish Engulfing pattern looks like on a chart.

Criteria for the pattern

  • The body of the second candle should be at least twice the size of the first candle.
  • Even though it is a dual-candlestick pattern, Bullish Engulfing gives the best reversal signals when the bullish candle engulfs the bodies of four or more previous candlesticks.
  • It is better if the Engulfing candle does not have any upper wicks. This shows the buying interest among investors and increases the likelihood of Green candles in the following days.

The Bullish Engulfing Pattern is a powerful reversal pattern that has the potential to reverse the current downtrend and turn it into an uptrend. Hence, traders always look out for this pattern and take big positions in the market by adding to their ‘long’ positions.

Dark Cloud Cover Candlestick pattern

The Dark Cloud Cover pattern is a bearish reversal candlestick pattern that is formed from two candles. In this pattern, the Red candle opens above the close of the prior candle and then closes below the midpoint of the previous green candle.

This pattern implies that buyers are trying to push the price higher, but sellers finally take over and push the price sharply down. A shift in momentum causes the trend to reverse, and this marks the beginning of a new downtrend.

Below is an image of the Dark Cloud Cover pattern that makes a reversal of the trend.

Criteria for the pattern

  1. The first requirement is to have an uptrend that is clearly visible on any chart.
  2. The second candle should be a gap up that, by the end of the day, comes down and closes as a bearish candle.
  3. The bearish candle needs to close below the midpoint of the previous bullish candle.

Traders usually wait for confirmation before taking aggressive short positions in the underlying Forex pair. The confirmation is just another Red candle following the first Red candle. On the close of the third candle, traders sell the currency and exit on the following days as the price continues to decline. They place stop-loss just above the high of the bearish candle.

Conclusion

The Engulfing pattern is a bullish reversal pattern, which is one of the easiest patterns to identify and trade. Talking about the bearish reversal Dark Cloud Cover pattern, it has the potential to identify the lower lows and lower highs, which is very rewarding on the downside. This was about the Dual Candlestick reversal patterns. Please explore more patterns of this kind to increase your exposure. In the next lesson, we will talk about the triple candlestick patterns and their types. Cheers!

[wp_quiz id=”60890″]
Categories
Forex Course

54. Learning The Dual Candlestick Patterns – Part 1 (Continuous)

Introduction

In the previous article, you were made familiar with different single candlesticks patterns that gave both continuous and reversal signals. In this article, we shall acquaint ourselves with the rest of the most popular double and triple candlestick patterns. In the following sections of the article, we will talk about the continuous double candlestick patterns – Tweezer Tops and Bottoms & Harami. Both of these candlestick patterns involve two candles, and they indicate signs of trend continuation in the market.

Tweezer Tops and Bottoms Candlestick Pattern

Tweezer patterns are double candlestick patterns that indicate a continuation of the current trend. But a broader context is needed to confirm the signal since Tweezers can occur frequently. A topping pattern occurs when the highs of two candlesticks occur at almost exactly the same level following a bullish candle. A bottoming pattern occurs when the lows of two candlesticks occur at almost exactly the same level following a decline in price.

The idea behind the topping and the bottoming pattern is that the first candle shows a strong move in the direction of the short term trend. While the second candle may be a pause or even a candle that completely reverses the previous day’s action. It means a short-term shift in momentum has occurred, and the price moved in the direction of the long term trend.

The image below shows how the pattern looks and explains the concept clearly.

Charts are taken from Tradingview

Pattern Confirmation Criteria

  • The first candle needs to have a large real body, i.e., the difference between open and close should be preferably big.
  • The second candle can be of any size. But if it is larger than the previous candle, the price can accelerate soon in the same direction.

Traders view this pattern as a potential sign of trend continuation and enter into a new position depending on the broader trend, with a minimum stop loss.

Harami Candlestick Pattern

Harami is a candlestick pattern that is formed by two candlesticks and indicates a continuation in the trend. Let’s discuss the Bullish Harami pattern to understand this concept better. A Bullish Harami Pattern essentially shows that the short term downtrend in an asset is coming to an end, and the market may continue its uptrend.

The pattern is formed by a long candlestick followed by a relatively smaller body. The second candle is completely contained within the vertical range of the previous body.

The chart below shows a Bullish Harami pattern. The few candles before the pattern indicate a short term downtrend in the currency, and the Green candle represents a slightly upward trend, which is wholly contained within the previous candle.

Charts are taken from Tradingview

Pattern Confirmation Criteria

  • It is necessary to have initial candles that indicate a clear short-term downtrend and that a bearish market is pushing the price lower.
  • The second candle needs to close near the middle of the previous candle, signaling a higher likelihood that a reversal of this downtrend will occur, and the price will move in the direction of the major uptrend.

Traders look at the appearance of the Bullish Harami pattern as a good sign of entering into a long position on an asset. This pattern is also combined with single candlestick patterns for confirmation signals. The opposite is the case for Bearish Candlestick Patterns.

While Tweezer Tops patterns are more flexible and easy to identify, Harami has a mandatory requirement of a ‘Doji’ (Candles with tiny body and long shadows) as the second candle. Both of these are trend continuation patterns with a high degree of accuracy. There are many more dual candlestick trend continuation patterns which you should be researching on your own. In the next lesson, we will be discussing double candlestick trend reversal patterns. Cheers!

[wp_quiz id=”60881″]
Categories
Crypto Guides

Lightning Network – A Potential Solution To Blockchain Scalability Issue?

Introduction

Cryptocurrencies that were in the boom a few years back are still in the business, and it is believed that their decentralized blockchain technology will keep them alive for a very long time.

The transactions on credit cards and debit cards are different from that of transactions on cryptocurrencies. VISA (a payment provider) processes about 4,000 transactions per second. In fact, it has a capacity of 65,000 transactions to process per second. But, a typical Bitcoin Blockchain, on the other hand, can process only up to seven transactions per second with a block size of 2MB. Hence, there is a clear issue of scalability. Also, the Bitcoin transaction costs are pretty high when compared to other traditional transaction methods. Thus, to solve this issue, the ‘Lightning Network’ technology came into existence.

What is the Lightning Network technology, and why do we need it?

The Lightning Network technology is a system that is used to process a transaction instantly. This technology was developed to send and receive payments instantly without any hassle and also to reduce transaction fees. In the next section, let’s see the backend of this technology.

Working of the Lighting Network Technology

⚡ A multi-signature wallet with some amount of Bitcoins is set up either by the sender or the receiver.

⚡ The public blockchain network keeps a record of the user’s wallet address and the balance sheet* (smart contract). This process is referred to as the payment channel.

*Balance sheet – An agreement that proves how much Bitcoin belongs to whom.

⚡ When the payment channel is wholly set, the parties can make any number of transactions without the involvement of the blockchain network.

⚡ On each transaction, the parties update their multi-signature wallet to keep track of how many Bitcoins were sent to whom.

⚡ So, basically, the balance sheet is the one that is always updated and not the blockchain network. A copy of this balance sheet is maintained by both parties.

⚡ Finally, when all the transactions are completed, the payment channel is closed. The most recent balance sheet is presented to the blockchain network for verification. And when the transaction is confirmed, the users receive their share of Bitcoins into their wallets.

The Interconnected Lightning Network

A great feature of the Lightning Network is the interconnection in the network. Let us understand this with an example. For instance, let’s say there is a payment channel between P1 and P2. And there is P3 who has a payment channel with P2. Now, if P3 wants to transact with P1, a separate channel need not be created between P3 and P1. P3 can send the coins to P2, and P2 can, in turn, send it to P1 and complete the transaction. Hence, making the Lightning Network interconnected.

The Present and Future

Presently, the proof-of-concept is being implemented on the Bitcoin Testnet. And an experimental implementation is being carried on the Bitcoin Mainnet. In fact, this technology has come into the real world in a few countries, and it ought to grow in the coming years. That’s about Lightning Network and its working. Let us know if you have any questions in the comments below. Cheers!

Categories
Forex Course

53. Trading The Single Candlestick Patterns – Part 2

Introduction

In the previous lesson, we discussed some basic single candlestick patterns, which gave us trend continuation signals. In this lesson, we will look at reversal patterns that are formed by a single candlestick and how traders should perceive them.

These patterns are very important to learn as they indicate clear market reversals. So essentially, when we find these patterns on the charts, we should anticipate a reversal and take our trades accordingly.

The Hanging Man Candlestick Pattern

A Hanging Man is a single candlestick pattern that occurs during an uptrend. They give warning signals that markets are going to fall. This candlestick pattern is composed of a small body, a long lower shadow, and no upper shadow. Since it is a reversal pattern that reverses the current uptrend, The Hanging Man indicates the selling pressure that is starting to increase. Below is how the Hanging Man candlestick would look like.

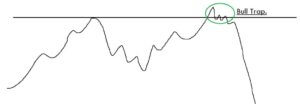
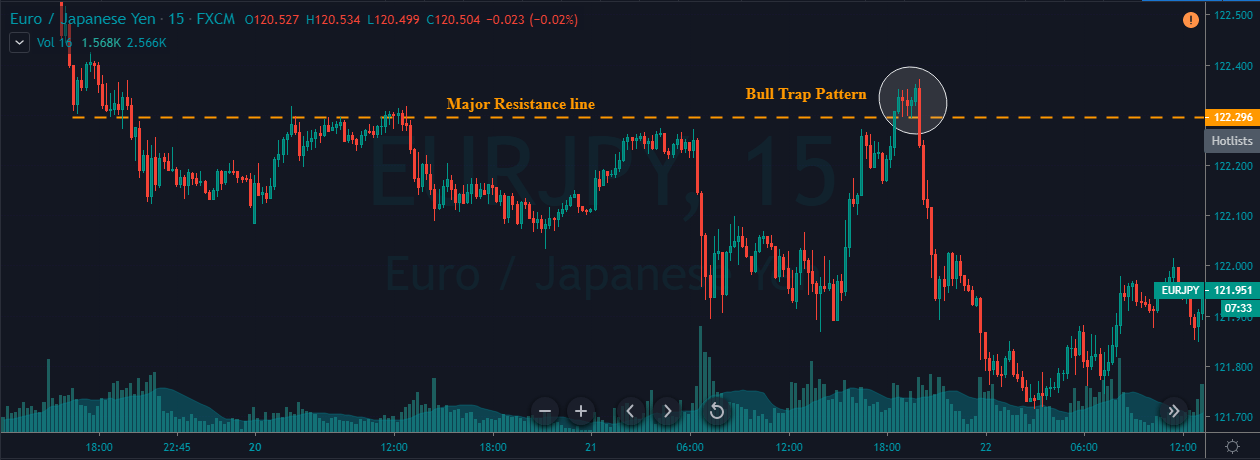
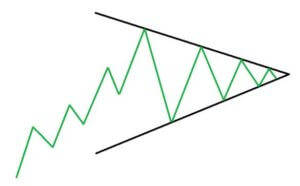
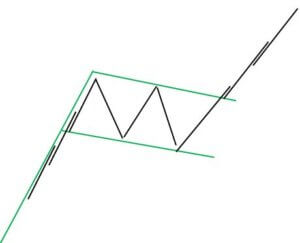
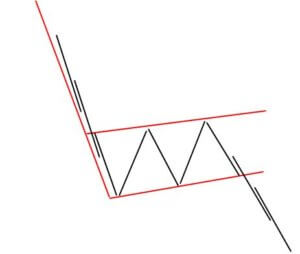
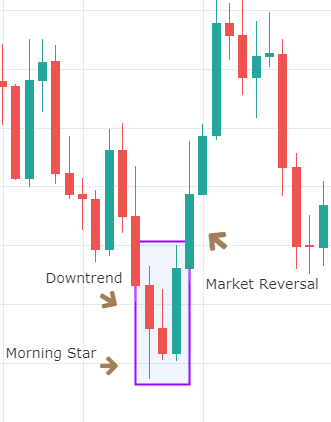
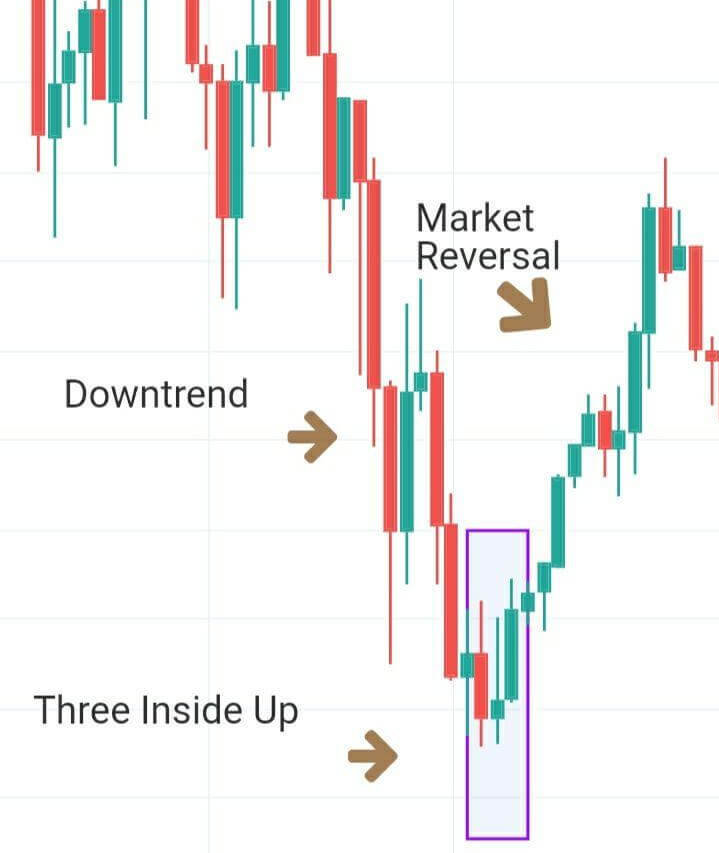
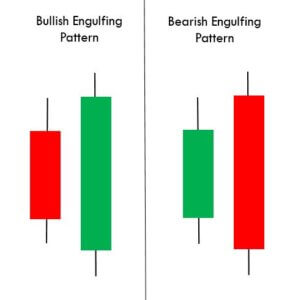
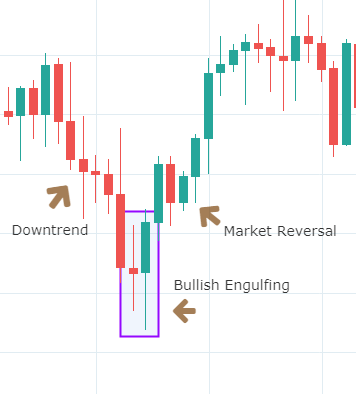
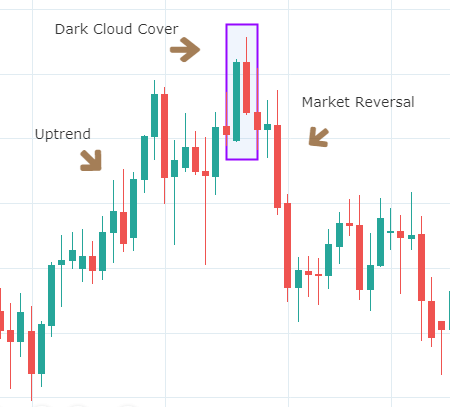
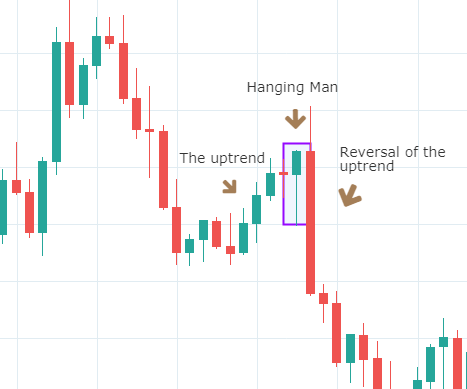
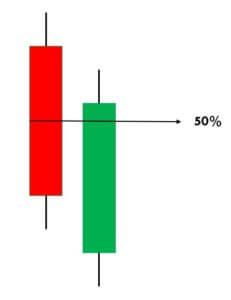
Below is a picture of how this pattern would like on the chart and how the trend reversal takes place.
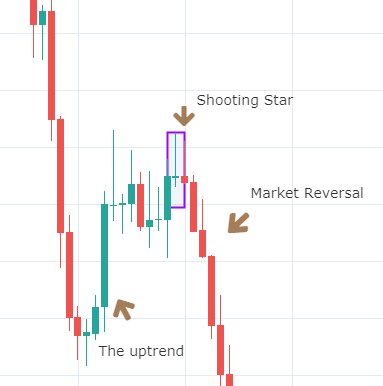
Pattern Confirmation Criteria

  • Hanging Man is a single candlestick pattern that forms after a small rally in the price. The price rally can also be big, but it should at least be composed of few candles moving higher overall.
  • The candle must have a small body and a lower shadow at least twice the size of the real body.
  • This pattern is only a warning and a bearish candle after the formation of this pattern is highly desired. This is necessary for the Hanging Man pattern to prove to be a valid reversal. This is called confirmation.

The Hanging Man pattern is used by traders to exit long positions or enter into new short positions. After entering for a short position, stop loss can be placed above the high of the Hanging Man candle.

The Shooting Star Candlestick Pattern 

A Shooting Star is a bearish single candlestick pattern which also indicates a market reversal. It has a long upper shadow with little or no lower shadow and a small body.

This pattern typically occurs after an uptrend and forms near the lowest price of the day. The Shooting Star pattern can be seen as the market creating potential resistance around the price range. It implies that the sellers stepped in, erasing all the gains, and pushed the price near the open. Basically, at the appearance of this pattern, buyers are losing control, and sellers are taking over.

Below is a picture of how the pattern would look like on a chart

Pattern Confirmation Criteria

  • The pattern must appear after an advance in price. The price must rally in at least alternate green and red candles if not in all green candles.
  • The distance between the highest price of the candle and the opening price must be twice the length of the body of the candle.
  • It is best if there is no shadow below the body of the candle.

Traders should not take immediate action after the formation of this pattern. They should wait to see what the next candle does following the Shooting Star. If they see a further price decline, they may sell or short that currency pair. However, if the price continues to rise, it means the uptrend is still intact. So traders must favor long positions over shorting.

The difference between the Hanging Man and the Shooting Star is in the length of upper and lower shadows along with the context. By now, we have understood how continuous and reversal single candlestick patterns work. In the upcoming lessons, we will be learning dual candlestick patterns and their implication. Cheers!

[wp_quiz id=”60770″]
Categories
Crypto Guides

What Should You Know About A Cryptocurrency Exchange?

Introduction

The cryptocurrency exchange is a place that allows trading cryptocurrencies through a trading platform. These are platforms where people can exchange one cryptocurrency for another one, and even for fiat currencies, for that matter. Their operation is very similar to a traditional financial exchange. The cryptocurrency exchange’s primary operation is to allow the buying and selling of digital assets as well as other assets (fiat currencies). Note that digital cryptocurrency (DCE) is another reference to a cryptocurrency exchange. These exchanges can be like a stock exchange or a currency exchange.

Cryptocurrency Exchange Explained

As mentioned, these exchanges are similar to traditional financial exchanges. To clearly understand this, we may bring out the differences between the crypto exchanges and the conventional exchanges. I a cryptocurrency exchange, buyers, and sellers trade based on the current market price of the cryptocurrencies. Here, exchanges play the role of the middleman. Just like on the stock market, there is some fee charged on each transaction.

Some exchanges deal only with cryptocurrencies, while others that deals with the exchange of both cryptocurrencies and fiat currencies. For example, in these exchanges, you can trade the US dollar for Bitcoin.

Cryptocurrencies are typically unstable in terms of value and sourcing. For instance, cryptos like Bitcoin have been under major dispute events where the value of Bitcoin changed dramatically in a very short time, or incidents where the major exchanges went down due to thefts and frauds.

Talking about the most popular and reliable exchanges, Coinbase’s GDAX (AKA Coinbase Pro) is an example of that. Also, there are exchanges run by third parties where there is a middleman, and  decentralized exchanges that mimic traditional exchanges like IDEX. In decentralized systems, trading is based on smart contracts and is not powered by a centralized third party system for the most of it. Trading with centralized exchanges will require a lot of information to be produced. However, they do allow the trading of fiat currencies. DEX exchanges, one the other hand, require lesser information but they do not allow exchanging of fiat currencies.

Classification of Cryptocurrency exchanges

Based on the exchange’s organizational hierarchy and overall controlling bodies, we can classify them as Centralized Exchanges and Decentralized Exchanges.

The Working Of A Centralized Cryptocurrency Exchange

Since these exchanges are centralized, they are run by a third-party or other organizations. More like a bank for exchanging fiat currencies. Here, the middleman takes control over whatever the assets are being traded on the network.

The Working Of A Decentralized Cryptocurrency Exchange

A decentralized exchange (DAX) is a cryptocurrency exchange which operates without the existence of a third party, or a central authority. In simple terms, decentralized exchanges allow peer-to-peer trading of cryptocurrencies. However, there have been signs that these exchanges have been suffering from low trading volumes and market volatility. And to solve this issue, protocols like 0X, Stellar, and Bitshares are being implemented.

Top Cryptocurrency Exchanges

There are several crypto exchanges to from, but not all have the features and technicalities. Below are the exchanges we have listed out by considering factors like user-friendliness, accessibility, security, and fees.

  • Coinbase
  • Kraken
  • Poloniex
  • Bitstamp
  • Coinmama
  • Bitsquare
  • Binance
  • Bitbuy.ca

These exchanges and many more are discussed in other articles, and you may find them here. So watch out this space for more great crypto content.


Categories
Forex Course

52. Trading The Single Candlestick Patterns – Part 1 (Continuous Patterns)

Introduction

In the previous article, we have discussed the basics of candlestick patterns. We also understood that there are different candlestick patterns like single, dual, and triple depending on how many candlesticks are involved. We also know that in each of these types, there are continuous and reversal patterns.

In this article, let’s discuss ‘Single Continuous Candlestick Patterns.’ As the name suggests, a single continuous candlestick pattern is formed by just one candle, and the appearance of this pattern indicates that the trend will continue in its actual direction. This means the trading signal generated by this pattern is based on a single candle’s trading action. The trades taken based on a single candlestick pattern can be extremely profitable, provided the pattern has been identified and executed correctly.

Now let’s see an example of one of the most important single continuous candlestick patterns.

The Marubozu Candlestick Pattern

Marubozu is a candlestick with no upper and lower shadow (appearing bald). Essentially, this pattern has a single candle with just the real body, as shown below.

The Marubozu candle can be both bullish and bearish, depending on the major trend. The Marubozu, in an uptrend, suggests that the buying strength of the currency pair is still prevailing in the market, and the trend is supposed to continue. The same is the case if it appears in a downtrend (Bearish Marubozu), which is a sign of trend continuation.

As always, a Red candle represents Bearish Marubozu, and a Green candle represents Bullish Marubozu.

Below is the picture of how the Marubozu pattern looks on a price chart.

A bullish Marubozu indicates that there was so much buying interest in the currency that the market participants were willing to buy the currency at every price point during the day (considering a daily time frame chart). The buying interest is so much that the pair closed near its highest point for the day. So, when such a pattern appears on the chart, it is recommended to build long positions in that Forex pair with appropriate stop-loss and take profit.

The Spinning Top Candlestick Pattern 

The Spinning Top is a very interesting candlestick pattern. Unlike other patterns, the Spinning Top is not specifically a continuous or reversal pattern. It can be indicating both depending on the market condition. A Spinning Top is a candlestick with a small real body and upper & lower wicks being identical in size.

It basically conveys the market indecision as both bulls and bears weren’t able to influence the market. When a trader encounters this pattern in a trending market, he/she needs to be prepared for two situations:

  • Either there will be another round of huge buying or selling
  • Or the markets could reverse significantly in either direction

Below is how the Spinning Top Candlestick pattern appears on a price chart.

During such uncertainty, it is recommended to trade in the options segment of the market to profit from this candlestick pattern.

This was about single candlesticks patterns and their significance. There are many more single candlestick patterns, but we hope you got the gist. We recommend you research and learn as many single patterns as you can on the internet. In the upcoming articles, we will look into some of the reversal single candlestick patterns and how they are different from the continuous patterns we discussed today. Cheers!

[wp_quiz id=”60570″]
Categories
Forex Assets

Analyzing The USD/SGD Forex Currency Pair

Introduction

US dollar versus the Singapore dollar, in short, is referred to as USDSGD. USD stands for the US dollar and is the base currency, and SGD stands for the Singapore dollar and is the quote currency. This currency pair comes under the sack of exotic currency pairs. Unlike the major and minor currencies, exotic currencies tend to have high volatility and low volumes.

Understanding USD/SGD

Comprehending the value of USDSGD is simple. The number of SGD equivalent to one USD is the value of the currency pair USDSGD. It is quoted as 1 USD per X SGD. So, if the value of this pair is 1.3641, then 1.3241 units of SGD are to be produced to purchase one USD.

Spread

Spread is a term given to the difference between the bid price and ask price of a currency pair. This value varies from broker to broker and on the type of execution model.

ECN: 7 | STP: 9

Fees

The fee is similar to the commission that is paid on each trade. This value, too, varies based on how the brokers execute a trade. Note that there is no fee on STP accounts. However, there is a fee on ECN accounts. And for exotic pairs, the fee is pretty high.

Slippage

Slippage is the difference between the price that a trader expected to receive and the price he actually got. There is always this difference due to the volatility of the market and the broker’s execution speed.

Trading Range in USD/SGD

Assessing the profit or loss that a trader is liable for is considered to be a vital factor in trading. This can easily be determined using the table below, which represents the pip movements in the currency pair in a given timeframe.

Procedure to assess Pip Ranges

  1. Add the ATR indicator to your chart
  2. Set the period to 1
  3. Add a 200-period SMA to this indicator
  4. Shrink the chart so you can assess a large time period
  5. Select your desired timeframe
  6. Measure the floor level and set this value as the min
  7. Measure the level of the 200-period SMA and set this as the average
  8. Measure the peak levels and set this as Max.

USD/SGD Cost as a Percent of the Trading Range

The total cost on a trade does not remain static even though you’re trading with the same broker. It varies depending on the volatility of the currency pair. To find the variation of these costs, we consider the values in the pip movement table and find the ratio with the total cost, and represent in percentage.

ECN Model Account

Spread = 7 | Slippage = 3 |Trading fee = 3

Total cost = Slippage + Spread + Trading Fee = 7 + 3 + 3 = 13

STP Model Account

Spread = 9 | Slippage = 3 | Trading fee = 0

Total cost = Slippage + Spread + Trading Fee = 9 + 3 + 0 = 12

The Ideal way to trade the USD/SGD

As mentioned, exotic pairs are pretty expensive to trade. However, it can still be traded in some moments when the costs are low.

It can be ascertained from the above table that the percentages are maximum in the min column and minimum on the max column. This means that the costs are high when the market’s volatility is low and vice versa.

Now, to ensure moderate volatility with affordable costs, it is ideal to trade when the volatility of the market is somewhere around the average values of the volatility table.

Slippage is a variable in the total cost that can be erased by trading using limit orders instead of market orders. In doing so, the costs will be reduced by a significant value. For example, if the total cost on the trade was 13 (including slippage=3), then the costs would be reduced to 10 as slippage is not considered.

Categories
Forex Assets

Understanding The USD/HKD Exotic Forex Pair

introduction

USDHKD is the abbreviation for the US dollar and the Hong Kong dollar. The USDHKD is an exotic currency pair. Exotics are pairs that are thinly traded in the foreign exchange markets and are not widely used in the global markets. One can expect high volatility and low volumes on this pair. Here, USD is referred to as base currency and HKD as the quote currency.

Understanding USD/HKD

The value of USDHKD represents the value of the Hong Kong dollar that is equivalent to one US dollar. It is quoted as 1USD per X HKD. For example, if the market price of USDHKD is 7.7684, then these many units of HKD are required to purchase one USD.

Spread

Spread is the difference between the bid price and the ask price of a currency pair. This value is set by the brokers, and it varies from different brokers. The type of execution model brings a variation in the spreads.

ECN: 5 | STP: 9

Fees

When you execute any trade through your brokers, there is a fee that has to be paid. The fee differs from brokers to brokers, as well as their execution type. Typically, there is no fee on STP accounts.

Slippage

Slippage is the difference between the trader’s intended price to execute a trade and the price he actually received from the broker. There is always this difference due to the volatility of the market and the broker’s execution speed. As a matter of fact, slippage is pretty high on exotic pairs.

Trading Range in USD/HKD

The trading range is the depiction of the minimum, average, and maximum pip movement of a currency pair. And these values help in assessing one’s risk on a trade. By finding the product of the volatility value with the pip valueyou can determine the profit or loss that can be incurred in a specified timeframe.

Procedure to assess Pip Ranges

  1. Add the ATR indicator to your chart
  2. Set the period to 1
  3. Add a 200-period SMA to this indicator
  4. Shrink the chart so you can determine a large time period
  5. Select your desired timeframe
  6. Measure the floor level and set this value as the min
  7. Measure the level of the 200-period SMA and set this as the average
  8. Measure the peak levels and set this as Max.

USD/HKD Cost as a Percent of the Trading Range

This calculation is an extremely helpful tool to analyze the cost variations in a trade. This table is basically a representation of the total cost variations in different timeframes and volatilities of the market. The costs are represented as a percentage of the range, and the magnitude of it depicts the cost of the trade.

ECN Model Account

Spread = 5 | Slippage = 5 |Trading fee = 1

Total cost = Slippage + Spread + Trading Fee = 5 + 5 + 1 = 11

STP Model Account

Spread = 9 | Slippage = 5 | Trading fee = 0

Total cost = Slippage + Spread + Trading Fee = 9 + 5 + 0 = 14

The Ideal way to trade the USD/HKD

Exotic pairs are expensive to trade when compared to major and minor currency pairs. However, it does not mean that one must completely avoid it. There are a few ways by which one can minimize the costs on the trade and take positions on it.

The higher the magnitude of the percentage, the higher is the cost of the trade. It is evident that the values are significant on the min column and comparatively small on the max column. Hence, costs are high for low volatilities markets and vice versa.

When it comes to picking the right time to enter the market, it is ideal to take positions when the volatility of the market is around the average values. From this, one can be guaranteed with affordable costs and decent volatility.

Slippage has a significant weight on the total cost of a trade. However, slippage can be wiped out. Trading using limit orders instead of market orders will take away the slippage on the trade. The next table displays the costs using limit orders.

Spread = 5 | Slippage = 0 |Trading fee = 1

Total cost = Slippage + Spread + Trading Fee = 5 + 0 + 1 = 6

Categories
Forex Course

51. Fundamentals Of Candlestick Patterns

Introduction

In the previous course lessons, we have discussed the basics of candlesticks along with the pros and cons of using them. From this lesson, we will learn the basic candlestick patterns and their usage. As discussed, the idea of candlesticks charts has started in Japan in the late 1870s. These charts were then introduced to the outside world by Steve Nison through his first book, ‘Japanese Candlestick Charting Technique.’

In this lesson, let’s discuss the primary advantage of using candlestick charts. Although a single candlestick gives us many details about the price movement of an asset, a sequential set of candlesticks is more powerful. These sets are also known as patterns in simple trading language, and using these patterns, traders across the world take trading decisions.

Expert traders have decoded many such patterns and rigorously backtested them to analyze what those patterns will eventually result in. They also examined how the market direction will change after the appearance of these patterns on the charts. Now, let’s see the different candlestick patterns one must know.

Different types of candlestick patterns

There are single, dual, and triple candlestick patterns depending on how many candlesticks are involved in them. For example, if there are the candlestick pattern is formed by three candlesticks, it is known as the triple candlestick pattern. Every single pattern has its own significance and can be found in most of the Forex charts.

The main intention of identifying any candlestick pattern is to understand the further price movement in the market. Hence these patterns are classified into two different types – Continuation Patterns & Reversal Patterns. When we identify a continuation candlestick pattern on the chart, it means that the market will continue in the same direction as the underlying trend. Contrarily, if we identify a reversal pattern on the charts, we can expect the price to change its direction. Also, these patterns are internally classified as bullish and bearish continuous/reversal patterns, which will be discussed in the upcoming lessons.

Examples of Continuation Candlestick Patterns

  • Deliberation Pattern
  • Concealing Baby Swallow Pattern
  • Rising Three Methods Pattern
  • Separating Lines Pattern
  • Doji Star Pattern

Examples of Reversal Candlestick Patterns  

Some of these are single candlestick patterns, while some are multiple candlestick patterns. We shall be discussing each of these patterns in detail in our future articles.

Psychological context of candlestick patterns

The candlestick patterns demonstrate the psychological trading that takes place during the period represented by a single or multiple candles. We need to start imagining the price movement as a battle between buyers and sellers. Typically, Buyers expect that prices will increase and drive the price up through their trades. Whereas sellers bet on falling prices and push the price down with their selling interest.

Also, the Japanese gave very visual names to these patterns so that it impacts the mentality of a trader. For instance, pattern names like Hanging Man and Dark Cloud Cover represent negativity, while the patterns like Three White Soldiers and Morning Star indicate positive market results. Hence, as soon as we hear the names of these patterns, our sub-conscious memory will know whether the forecast of the market is positive or negative.

Benefits of trading candlestick patterns

Although initially conceived for daily timeframes, Candlestick patterns can be used by swing traders, day traders, and even long term investors. Below are some of the significant advantages of these patterns.

  • They are very easy to identify and comprehend. They provide a detailed description of the occurrences and happenings in the markets.
  • Interaction between the buyers and sellers can easily be understood just by reading the pattern and without having to analyze the market entirely.
  • Candlestick patterns can be used in conjunction with other indicators for extra confirmation on the trading signals generated.
  • They display reversal patterns that cannot be seen in other charts like Line & Bar charts.

That’s about the introduction to Candlestick patterns. In our upcoming lessons, we will discuss different candlestick patterns and how to generate trading signals using these patterns. So, stay tuned.

[wp_quiz id=”60271″]
Categories
Forex Assets

What Should You Know Before Trading The CHF/JPY Currency Pair

Introduction

CHFJPY is a symbolic representation of the Swiss franc against the Japanese yen. Here, CHF is the base currency, and JPY is the quote currency. Since it does not have USD involved, it is classified as a cross-currency pair.

Understanding CHF/JPY

The market price of this pair is the number of JPY that are required to purchase one CHF. It is quoted as 1 CHF per X JPY. For example, it’s current value is 112.31, then 112.31 yen are needed to buy one Swiss franc.

Spread

Spread in forex is the difference between the bid price of a currency and the ask price of it. And this pip difference is used up by the brokers as a form of fee. However, it is not a fixed value. It varies from brokers to brokers.

ECN: 1.3 | STP: 2.1

Fees

Spread is not the only form of fee that is levied by the brokers. There is a commission on the trade as well. The commission is nil on STP accounts, but pips on ECN accounts.

Slippage

When entering a trade using market orders, the trader does not get the exact price he intended when he executed it. There might be a difference in pips. This difference is referred to as slippage. Slippage may be in favor of or against the trader.

Trading Range in CHF/JPY

The trading range is simply a representation of the minimum, average, and maximum pip movement in a currency pair. With these values, one can assess how much money a trader will be risking in a particular timeframe. For example, if the average pip movement on the 4H in this pair is 15 pips, then a trader can expect to win or lose $150.6 in about 4H or so.

Procedure to assess Pip Ranges

  1. Add the ATR indicator to your chart
  2. Set the period to 1
  3. Add a 200-period SMA to this indicator
  4. Shrink the chart so you can determine a large time period
  5. Select your desired timeframe
  6. Measure the floor level and set this value as the min
  7. Measure the level of the 200-period SMA and set this as the average
  8. Measure the peak levels and set this as Max.

CHF/JPY Cost as a Percent of the Trading Range

Apart from knowing the profit or loss can one can incur in a given timeframe, it is necessary to assess the cost of these trades as well. Below is a table that represents the cost variation in different volatilities. And these costs are determined by finding the ratio between the total cost and the volatility.

ECN Model Account

Spread = 1.3 | Slippage = 2 |Trading fee = 1

Total cost = Slippage + Spread + Trading Fee = 2 + 1.3 + 1 = 4.3

STP Model Account

Spread = 2.1 | Slippage = 2 | Trading fee = 0

Total cost = Slippage + Spread + Trading Fee = 2 + 2.1 + 0 = 4.1

The Ideal way to trade the CHF/JPY

The forex market is open 24hours. However, it is not ideal to enter the market at any time. There are times when the costs are low, and times when it’s high.

The percentages in the table are directly proportional to the costs of the trade. It is seen that the percentages are high in the minimum column, and low in the maximum column. Hence, we can conclude that costs are inversely proportional to the volatility of the market. Now, when it comes to choosing the right time to trade, it is best to enter during those times when the volatility of the market is around the average values. This will ensure enough volatility in the market and low costs as well.

In addition, placing orders using limit/pending orders reduces costs too because this will completely nullify the slippage on the trade and will bring down the total cost significantly.

Categories
Forex Basic Strategies

Identify Reliable Trading Signals Using ‘Piercing Line’ Candlestick Pattern

Introduction

The Piercing Line is a simple and effective candlestick pattern, and it is used to trade the bullish reversals in the market. This pattern typically appears in a downtrend. Also, when it appears in a significant support area, we can consider it more reliable. Piercing Line is a two candlestick pattern where the sellers influence the first candle, and the second candle is responded by enthusiastic buyers. Piercing Line essentially indicates the bears losing control, and bulls taking over the market.

  1. First of all, in a downtrend, the first candle of the pattern should be bearish.
  2. The second candle should be bullish, and it should open lower than the closing of the previous candle, and it must close above the midpoint of the bearish candle.

This indicates that buyers now overwhelmed the sellers. In terms of supply-demand, this pattern shows that the supply is depleted somewhere, and the demand for buying has increased. Remember not to trade this pattern alone. Always use it in conjunction with some credible indicators or other trading tools to further enhance the probability of winning.

Piercing Line Pattern Trading Strategies

Piercing Line Pattern + Percentage Price Oscillator

In this strategy, we have paired the Piercing Line pattern with the Percentage Price Oscillator to generate credible trading signals. The Percentage Price Oscillator is a momentum indicator. It consists of a centerline, histogram, and the two moving averages. Just like the MACD indicator, the PPO also represents the convergence and divergence in price action. This indicator gives a crossover at the overbought and oversold market conditions.

When price action crosses the centerline, it means that the bullish or bearish momentum is super strong. We want to let you know that PPO is not that popular in the industry. Also, it is not available in the MT4 terminal. However, you can download this indicator from this link and add it to your MT4 terminal. If you are a Tradingview user, search the PPO indicator in the indicators tab, and you should be able to find it.

Step 1 – Find out the Piercing Line pattern in a downtrend.

Step 2 – Once you find the Piercing Line pattern, the next step is to wait for the reversal to happen on the PPO indicator at the oversold market conditions.

In the below CHFJPY chart, the market was in an overall downtrend. We can see the market printing Piercing Line pattern, and that is an indication of a trend reversal. We can also see the PPO indicator giving crossover in the overbought area at the same time. Both of these clues indicate a clear buy signal in this pair. We can also see the price action showing divergence, which is another clue to go long. If we are able to find all of these clues on a single price chart, we shouldn’t mind placing bigger trades.

Step 3 – Stop-loss and Take Profit

PPO indicator quite often gives high probability trading signals. So when we take trades of that kind, most of the time, we must place the stop loss just below the first candle of the Piercing Line indicator.

There are several ways to book profits. For this particular strategy, we can close our position when the PPO reversed at the overbought area or when the market starts printing the opposite pattern. If you plan to make more money in a single trade with extra risk, it is advisable to book the profit at the higher timeframe’s major resistance area.

In the below chart, we can see that we have closed our whole position at the major resistance area and the stop-loss order was just below the recent low.

Piercing Line Pattern + Double Moving Average

In this strategy, we have paired the Piercing Line pattern with the Double Moving Average. Moving Average is a very well-known indicator in the industry. Many average indicators are available in the market. If you are using the lower period average, expect more trading signals. Contrarily, if you are using the higher period average, expect fewer but accurate signals.

Step 1 – First of all, find out the Piercing Line pattern in a downtrend.

Step 2 – Activate the buy trade when the lower period MA crosses the higher period MA. In the below EURAUD Forex chart, the price action was in a downtrend, and around the 22nd of December, the market prints the Piercing Line pattern. This means that the sellers now have a hard time to go lower, and buyers took over the market. Furthermore, when a lower period moving average crosses the higher period moving average, it is a clear indication to go long. After our entry, price action immediately prints a brand new higher high.

Step3 – Stop-loss and Take Profit

If you are an aggressive trader, use the recent low for stop loss. But if you are a conservative trader, make sure to place wider stop losses. If you plan to ride the longer moves, wait for the price action to hit the daily support area. But if you plan to go for intraday trades only, we suggest you exit your position when the double MA gives the opposite signal.

In the below chart, we can see that we have closed our full positions at the higher timeframe major resistance area, and stop-loss was just below the recent low. Overall, it was a 3R trade.

Bottom Line

Piercing Line pattern is a bottom reversal pattern, and it is one of the very well-known bullish reversal patterns. We can say that this pattern is exactly the opposite of the Dark Cloud Cover pattern. We won’t be able to see this pattern very frequently on the price chart, but when it appears, a trend reversal is guaranteed. Sometimes you will find this pattern in the consolidation phase, but it’s not worth your time to trade it in ranges. So it is always recommended to find this pattern in a clear trending market because that’s where we can generate more effective signals. The only limitation of this pattern is that it requires the use of other technical tools to confirm the signal and cannot be used stand-alone. But that’s the case of most of the candlestick patterns, so that’s not a major limitation.

That’s about the Piercing Line candlestick pattern. Let us know if you have any questions in the comments below. Cheers!

Categories
Forex Assets

Analyzing The CAD/JPY Forex Asset Class

Introduction

CADJPY is the abbreviation for the currency pair, the Canadian dollar against the Japanese yen. This pair is one of the most extensively traded cross currency pairs. In CADJPY, CAD is referred to as the base currency and JPY as the quote currency.

Understanding CAD/JPY

The value of CADJPY is the value of JPY, which is required to purchase one CAD. It is quoted as 1 CAD per X JPY. For example, if the current market price of this pair is 82.651, then these many units of Japanese yen are needed to buy one Canadian dollar.

Spread

The bid price is the price used to sell a currency, and ask price is the price used to buy a currency. There is always a difference between the two prices. This difference is called the spread. It varies from broker to broker and also the type of their execution model.

ECN: 1.1 | STP: 2

Fees

Similar to stockbrokers, there are forex brokers who charge a few pips of fee on each position a trader opens and closes. This fee is no different from the commission brokers levy. On STP accounts, the fee is nil, while on ECN accounts, it is between 6-10 pips depending on the broker one is using.

Slippage

Slippage in trading is the difference between the price requested by the trader and the price he actually received. The two factors responsible for slippage are,

  • The volatility of the market
  • Broker’s execution speed

Trading Range in CAD/JPY

A trading range is a tabular representation of the number of pips a currency pair moved in a given timeframe. It represents the minimum, average as well as the maximum pip movement in six different timeframes. These values prove to be important for assessing one’s risk on a trade. For example, if the minimum pip movement in CADJPY on the 4H timeframe is ten pips, then a trader can expect to lose $917 in about 4H.

Procedure to assess Pip Ranges

  1. Add the ATR indicator to your chart
  2. Set the period to 1
  3. Add a 200-period SMA to this indicator
  4. Shrink the chart so you can determine a large period
  5. Select your desired timeframe
  6. Measure the floor level and set this value as the min
  7. Measure the level of the 200-period SMA and set this as the average
  8. Measure the peak levels and set this as Max.

CAD/JPY Cost as a Percent of the Trading Range

As already mentioned, there is a fee for every trade you take. And knowing the percent fee on the trades you are taking is important, as it depends on the volatility of the market and the timeframe you are trading.

Below is a representation of the total cost variation on trade in terms of percentages. Since costs on ECN accounts are different from STP accounts, we have two separate tables for this concept.

ECN Model Account

Spread = 1.1 | Slippage = 2 |Trading fee = 1

Total cost = Slippage + Spread + Trading Fee = 2 + 1.1 + 1 = 4.1

STP Model Account

Spread = 2 | Slippage = 2 | Trading fee = 0

Total cost = Slippage + Spread + Trading Fee = 2 + 2 + 0 = 4

The Ideal way to trade the CAD/JPY

Before getting right into it, let us comprehend the above tables. The higher the values of the percentages, the higher are the costs on the trade. It is pretty evident from the table that, percentage values are on the higher side in the min column and comparatively lower in the max column. This means that the costs are high when the volatility of the market is low and vice versa. Also, the trades that are taken based on a long term perspective, the costs are considerably low.

One may trade the high volatility markets to minimize your costs, or trade during low volatility by paying high costs. However, it is ideal to enter during those times of the day when the volatility is close to the average values. During these times, one can expect comparatively low costs with enough volatility as well.

On a further note, another simple and effective way to reduce costs is by trading using limit orders. This entry method will take slippage out of the total costs and bring down its value considerably. An example of the same is given below.

Spread = 2 | Slippage = 0 | Trading fee = 0

Total cost = Slippage + Spread + Trading Fee = 2 + 0 + 0 = 2