Categories
Crypto Guides

Monero – One Of Those Cryptocurrencies That Ensure 100% Privacy!

Introduction

We have seen the in-depth analysis of different cryptos so far and understood that new coins keep coming up, improvising the shortcomings of the previous ones. Monero is such cryptocurrency.

Monero was launched in 2014 as an open-source, privacy-oriented crypto, operating on the concept of blockchain technology to completely anonymize the transactions in the network. Monero literally means coin in Esperanto. This crypto was initially named BitMonero, forked from the codebase of Bytecoin. Later it was renamed as Monero after a different group led by Johnny Mnemonic took over the project.

Objective

Monero aims to make the platform opaque for outside observers completely. The transactions are made entirely obscured by anonymizing the sender and receiver details. This is done by disguising the addresses used by the users transacting on the platform. While all the cryptocurrencies promise the future of privacy, the degree of confidentiality varies. But Monero achieves the full level of privacy, making it a widely used currency in the dark web.

Mining process

Mining Monero doesn’t need any specialized hardware; hence, there is no need for any significant initial investments in mining the coin. Anyone with a computer can mine the coin and earn rewards.  The founders believe that everyone is equal, and they didn’t even allocate any percentage of coins for them during its inception. They have just used the funds volunteered by the community to develop the currency.

How is the complete privacy ensured?

To ensure complete privacy, Monero uses features such as ring signatures, stealth addresses, and ring confidential transactions. Let us look at the below briefly.

Ring Signatures: While making a transaction in the blockchain network, one must sign the transaction using his private key. In the case of ring signatures, the private sign of the user transacting is combined with the signatures of the other ten users in the network, thus making a ring signature genuinely anonymous.

Stealth Addresses: These are randomly generated one time used addresses for a transaction using the public key of the user making a transaction. Since these are only used one time, the outside observers will have no idea about the transactions.

Ring Confidential Transactions: Ring CT was introduced in January 2017 to conceal the number of coins being transacted in a transaction. They stopped using Ring CT in October 2018.
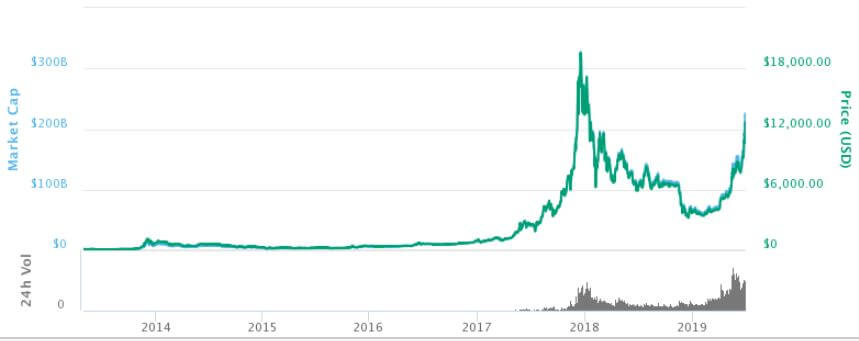
Market Cap

Monero stands at 13th place in the world of cryptocurrencies, with the market value of around $1.06 Billion, while the value of each coin is at $61.60 as on 03/11/2019. The 24-hour trading volume is approximately $191 Million, with ~17 Million coins circulating in the market. Monero is traded with the ticker symbol ‘XMR’ in all of the cryptocurrency exchanges.

Challenges faced by Monero

Since Monero ensures complete privacy for the transactions, the usage of the currency is particularly popular in the dark web. While, still Bitcoin holds prominence in both the legitimate and illegitimate transactions across the world, owing to its knowledge amongst the people, there is a slow shift towards Monero with the people who wants to cover their tracks. Certain ransomware attackers demand the money exclusively in Monero to decrypt the encrypted files.

The rich privacy feature has made Monero a popular coin shortly after its inception, while its usage in the dark web markets is widely questioned. That’s about Monero. If you have any questions, let us know in the comments below. Cheers!

Categories
Forex Market

Dealing With Liquidity & Volatility In The Forex Market

What is liquidity?

When a trader starts his trading journey, one of the things he finds most attractive is the amount of liquidity offered by the forex market. The latest figures suggest that the daily trading volume of forex is close to $5.1 trillion.

Liquidity is the ability to trade a currency pair on demand. In simple terms, it is the measure of how easily a currency can be exchanged. When you are trading major currency pairs, you have an exceedingly high amount of liquidity. This liquidity is provided by financial institutions, big businesses, and retail traders as well. However, not all the currency pairs are liquid; liquidity depends on whether a currency pair is major, minor, or exotic. Major pairs typically have high liquidity compared to the other currency pairs. In the next section, we will look at some of the money management principles in trading with respect to liquidity.

Liquidity and Risk

A market with low liquidity has chaotic moves and gaps because of the absence of buyers and sellers at any given point of time. These gaps occur when news announcements are made over the weekend or if an event happens at the same time. The chart below depicts such a gap after a news release.

According to money management principles, when you know that there will be a change in liquidity levels between Friday to Monday, it is not advised to carry huge positions on Friday. The risk drastically increases, if the price opens above your stop loss on Monday, it will become a market order, and this loss will be much higher than the predefined loss (determined using stop-loss). A conservative trader especially should not take any positions during times of news releases.

Retail forex traders need to manage liquidity risk by lowering their leverage and putting stop losses based on higher time frames. In this way, you would be safe from any kind of gaps that happen at the beginning of the week.

Volatility

Volatility refers to the currency fluctuations in the global exchange market. Price movements can vary from hour to hour, minute to minute, and second to second, depending on many factors. A lot of forex traders enjoy volatility, but it comes with a risk. Therefore it is important to manage volatility and do plenty of research before placing a trade.

Eliminating the risk of volatility

In order to make the most out of volatility, follow the below-mentioned techniques:

Volatility strategies

Money management, in relation to volatility, essentially suggests traders invest in strategies that can perform in different market conditions. Some of the strategies that can be used to turn the volatility in your favor include widening your targets, placing tight stop-losses, and analyzing the higher timeframes.

Stay diversified

Don’t rely too much on any asset class or forex pair. If one investment performs poorly, other investments may perform better over that same period and thereby reducing your overall losses. This happens due to the difference in volatility across various asset classes. A balanced portfolio protects from losses and provides a high return on investment.

Money management should always be a top priority for every trader, as these principles guide us while taking trading decisions. A lot more concepts related to money management will be discussed in the upcoming articles.

Categories
Forex Basic Strategies Forex Trading Strategies

What Should Know About Trading Ranges Using Support & Resistance?

What is Range trading?

It is said that the market only trends for 30% of the time. So it becomes necessary to have a range trading strategy to take advantage of the other 70% of the time. Range trading is not difficult, but it requires discipline and determination to make most out of it. When a market is trending, it forms a pattern of higher highs and higher lows, in case of an uptrend. The move, in this case, is really strong and is known as an impulsive move. The other type of movement is known as the corrective move, which comes in the form of a pullback. Impulsive moves are stronger than corrective moves.

When the market is making any such moves, it finds itself stuck between a high or low and continues to oscillate between these two points. It means buyers and sellers are equally strong, and this creates a very choppy environment.

Traders now trade these extremes and continue to trade until price breaks out on either of the sides. These two points act as potential support and resistance points, used by traders to place their orders.

In the above chart, we have drawn a few lines from where the market bounced off. The price action in those areas creates many trading opportunities. The instrument in the chart first trends down and then puts up a low (marked by line 1). Initially, you might think it as a downtrend and expect the pattern of lower lows and lower highs to continue.

Then you see the market rally to line 2, from where the market falls back to line 3 but does not fall till line 1. This highlights the fact that the market is no more trending. The market instead could be stuck in a range between line 1 and line 2. These are not ‘defined’ prices. Always consider them as zones with a margin of error both outside and inside the range. A trader will look to position himself/herself at these zones of support and resistance that forms the range.

Why support and resistance?

The price that is stuck between these two extremes has a lot of significance. This is because, at this point, the price can either Stop, Reverse, or Breakout. When you have the right knowledge, it will stop you from simply pushing the buttons and will make you trade with a defined strategy.

Range = Consolidation

A range is nothing but a price consolidation of the overall trend move. It could either end the current trend or cause a reversal. The different price behavior pattern in the range creates many trading opportunities, which can be traded by all types of traders, depending on their risk appetite. Now let’s discuss some important trading strategies using support and resistance of ranges.

Strategy Using Technical Indicators

Using technical indicators to trade can aid your trading strategy. Especially while trading ranges, many indicators can be a part of your trading plan. Here, we have used the Stochastic Indicator as a tool to trade the ranges.

In the above image, the two lines represent the support and resistance of the range formed. When the price reaches the resistance at point 1, the Stochastic enters the overbought area, and the slowdown in momentum is the confirmation signal for a sell. The resistance pushes the price back to support (point 2), but this time the momentum is very strong, hence no entry. The stochastic also does not enter the oversold area clearly. Next time the price goes to resistance with greater momentum, and the Stochastic too does not give an entry signal as it is not in the overbought area. This means one shouldn’t be going short at this point.

Overall, there is only one risk-free trade available in the above chart, and that is at point 1 (short).

Strategy Recap

Firstly, we should be able to see the price at one of the extremes. When that happens, the indicator should show either be at overbought or oversold conditions. The momentum of the price should be an important factor that determines our entry. If we see reversal patterns, this could be the best entry with a good risk to reward ratio. Do not forget to place protective stops much below or above the support and resistance levels, respectively. This will always protect your trades from a false breakout.

When not to buy at support and sell at resistance in ranges

You must have probably heard traders saying that more time a level is tested, the stronger it becomes. This is not true in the case of our range break-out strategy. You need to start paying attention to the price patterns at these ends. If the price has made multiple touches, it could be getting ready for a breakout in the direction of the higher time frame.

The above chart is an example of such a scenario. It shows a range, and at point 1, you can see the strength in the candle as price pushes towards the resistance area. The next push makes the price to consolidate at the extreme. It appears to be a battle between the bulls and bears. It is also making higher lows as a part of the uptrend. Hence a breakout after this point is not surprising.

You don’t want to see the higher lows at the resistance extreme and lower highs at the support extreme.

The resistance could still work, and a reversal could happen, but this type of price action does not give much confidence for shorts. Only aggressive traders may find some entry in that consolidation, for a potential long. They can put a protective stop below the higher low that was formed before the accumulation.

We hope you find this strategy informative. Let us know if you have any questions in the comments below. Cheers!

Categories
Crypto Guides

Knowing About the EOS Cryptocurrency & Its Blockchain

Introduction

EOS is the native cryptocurrency of the EOS blockchain. EOS blockchain is a decentralized open-source platform built to support the development of decentralized apps (DApps) with core functionalities helping to develop industrial-scale applications.

The EOS blockchain platform was announced its white paper in 2017 by a private company called block.one. The platform came into the market as an open-source platform in June 2018. The EOS is informally called the ‘Ethereum Killer’ in the crypto community. That is because this platform offers almost all the features of the original Ethereum platform but with a lot of improvements. These improvements enable DApp developers to build industrial level applications with ease.

Objective

While there are many blockchain platforms in action now, we can say each one has its unique features suitable to different industries in the market. Each platform is developed to overcome the shortcomings of its predecessor. EOS platform has been introduced to improve functionalities offered by Bitcoin and Ethereum platforms. EOS whitepaper says it is possible to run 1000 transactions per second during the initial stages, and later it aims to run a million transactions per second. Thus enabling industrial level applications to be run on the platform without scaling issues. Moreover, the platform has made transaction fees-free, making people choose EOS over other cryptos.

Consensus

So how does the EOS work to hit a million transactions per second? EOS uses the Delegated Proof of Stake (DPoS) as its consensus algorithm. There will be only 21 block producing nodes in the network. These blocking producing nodes are chosen by the people in the network who hold EOS cryptocurrency on a voting process, which happens continuously. Thus, maintaining the integrity of the users in the system is of utmost importance to the block producing nodes. Hence the transaction should be validated by only these 21 nodes to get confirmed in a block, and it is a relatively straightforward process. The block producing nodes are rewarded with EOS for validating the nodes.

EOS ICO

To ensure the native currency of the platform (EOS) is widely available, a billion coins were sold on the Ethereum platform as ERC 20 tokens. The ICO was held for an entire year. 10% of these tokens are reserved for Block.one, the founding company. EOS raised a record amount of $4 billion in its ICO, although the working product wasn’t available in the market then.

Market Cap

EOS stands at seventh place in the crypto world with close to $3 Billion in value. The price of each coin is $3.25 as of 30/10/2019. The 24-hour trading volume is around $2.5 billion, with 938 Million coins circulating in the market.

Price History

EOS began trading with a price of $1.03 in July 2017. The coin didn’t get much attention for the first four months, and the price started slumping. By November 2017, it was trading at $1.21, and by January 2018, it is traded at $18.06. Then from a peak of $18.06, it fell to $4.08 by March 2019. It slowly increased and decreased from then without a very drastic change, and the price as on 30th October 2019 is $3.25.

Conclusion

There has been a lot of negative talk about EOS, but crypto enthusiasts see high potential in the EOS platform because of the promising features it offers. Applications can be written in any language on EOS, unlike the Ethereum platform, which allows only its native programming language, Solidity. Hence not only crypto enthusiasts but also industry experts believe that the EOS platform is revolutionary due to its scaling and flexibility options.

Categories
Forex Course

16. Trading The London Session

Introduction 

The London session, also referred to as the European session, is the session where a significantly high amount of trading happens. The London session opens at 3:00 AM EST and is rigorously traded for eight hours straight.

There are several big financial institutions in Europe. So, the trading volume in the FX market during this session is extremely high. Due to this, many retail traders also show massive participation during this session. Hence, the London session was named the forex capital of the world.

There are thousands of transactions every minute during this session. As per sources, 30% of all forex transactions are executed during the European session.

In the previous lesson, we saw the average pip movement in the Tokyo session for some majorly traded currencies. The average there came to around 53. Now, coming to the London session, the average is much higher than the Tokyo session. The number stands at 72. During this session, the FX majors, as well as minors, tend to move by large amounts.

The below table gives you an idea of the average pip movement for some intensively traded currencies.

More about the London Session

As mentioned, London is considered as the Forex capital of the world. The majority of the volume in the market comes during the London session. Hence, there is high liquidity during this session.

The London session opens during the closing time of the Asian market. During the Asian session, the market usually goes through a consolidation phase. But, when London opens its shops, the consolidation comes to an end, and the market begins to move in a trend state. However, during the middle of this session, the market slows down and begins to consolidate. This could perhaps be due to the fact that the traders are waiting for the New York market to open. It has also been observed that the market reverses its direction at the end of the session. This could mean that the large players are booking their profits.

As far as trading in this lesson is concerned, this is the ideal session for the trend traders. A trend trader can analyze the markets during the Asian session and gear up to take trades when the London market opens.

The best currencies to trade during the London session

It is clear from the table that we can trade any pair in the market. There is sufficient liquidity in most of the currency pairs. Specifically speaking, one can keep a close eye on pairs such as EURUSD, GBPUSD, USDCHF, USDCHF, GBPJPY, EURJPY, etc. Moreover, as there is a heavy volume of trading in these pairs, the spreads here are very tight.

Thus, this brings us to the end of this lesson. In the next lesson, we shall discuss the New York session. For now, test your learning by taking up the quiz below.

[wp_quiz id=”46939″]
Categories
Forex Course

15. All About Trading The Tokyo Session!

Introduction

Japan’s capital Tokyo, is the most majorly traded market in the Asian continent. That is, in Asia, the highest volume comes from the Tokyo market. In fact, it is considered the financial capital of Asia. Moreover, it is the third-largest trading center in the world.

The Tokyo session, also referred to as the Asia session, opens at 8:00 PM EST and is traded until 5:00 AM EST. In terms of Japan’s local time, the trading happens between 9:00 AM to 6:00 PM. As ‘Yen’ is the currency of Japan, 16.50% of all the Yen transactions take place during this time. And as far as all currency transactions are concerned, the value lies at 21%.

The one that matters the most during any session is the pip movement in different pairs. Below is a table which represents the average pip movement for some of the major currency pair.

Now, the average of the above currency pairs turns out to be around 53 pips. This number is less when compared to the New York session and the London session.

Some facts about trading the Tokyo session

During this session, the market is seen to fade away its momentum. That is, the market is seen to be quite flat. In technical terms, the market usually goes through a consolidation state. This session might not be the ideal session for the ones looking for large pip movement. However, this session can be great for scalpers.

Tokyo market typically is known to correct the overbuying and selling in the New York session. The market makes drastic moves during the NY session and comes to slows down its pace during the Tokyo session. Therefore, the liquidity during this session is quite feeble.

It is not just the central banks and hedge funds that move the market. Since Japan is the largest exporter in the world, a large number of transactions come from the exporters as well.

Also, the Bank of Japan is an active participant in the forex market during the Tokyo session. This is because it intervenes the curb appreciation in the Yen regularly.

Which currency pairs should you focus on?

The market conditions and situations tend to change from time to time, so it becomes uncertain to predict the exact movement of pairs. However, if we were to consider the average rates, we can keep an eye on the news from countries like Australia, New Zealand, China, and Japan. The news from these countries comes during the Tokyo session or just before its open. And the news usually pumps up the volatility and liquidity of the market. Hence, one can have a focus on AUD, NZD, and JPY pairs.

When the Tokyo session comes to an end, the London markets open, which causes overlap between the two sessions. So, to be part of the significant movements, keep an eye on GBP, EUR, and CHF along with AUD, NZD, JPY, and USD.

This is a brief review of the Tokyo session. We shall discuss the other sessions as well in the upcoming lessons. Take the below quiz to know if you have learned the concepts right.

[wp_quiz id=”46800″]
Categories
Crypto Guides

Learning The Fundamentals Of ‘Tether’ – The Stable Cryptocurrency!

Introduction

Tether is a cryptocurrency founded in 2015, and it was initially known as ‘Realcoin.’ Tether tokens are issued by Tether Limited, a company based in the British Virgin Islands as per the New York Times. The official website says the company is incorporated in Hong Kong, with offices in the US. This company is associated with the Bitfinex, a Hong Kong-based cryptocurrency exchange, which is also one of the biggest in the world. Many members who are on the board of Tether Limited are associated with Bitfinex exchange, as well.

Objective

The value of any cryptocurrency is volatile. We can see the steep increases and decreases in the value of any crypto within a matter of days or hours, as well. We know that these Cryptocurrencies offer a wide range of features that fiat currencies don’t assure.  Therefore, Tether was designed as a stable coin promising the stability of fiat currency with the features of a cryptocurrency as well. Tether is meant to be backed one for one by some of the major fiat currencies like USD, Euro, JPY, etc. If we take the example of USD, the value of each Tether is always one dollar (USDT). For every one tether created, one US dollar is stored as a reserve.

Importance of Tether in the crypto world

Many crypto exchanges across the globe find it extremely difficult to work with traditional banks. The exchanges find it challenging to store USD or any conventional fiat currency as reserves for the payments. Hence major crypto exchanges like Bitfinex hold clients balance in Tether rather than in USD. This means, if the clients hold any money in the exchange and don’t have any open positions, that money is held as Tether in the exchange. It is converted into USD only when the client wants to redeem the cash. Hence Tether offers to be a stable alternative for USD for the crypto exchanges across the world.

Market Cap

Tether is in the fifth position in terms of market cap in the crypto world with a value of more than $4 billion. The price of each Tether is stable and is one dollar or Euro, etc. as described above. The average 24-hour trading volume is just above $43 billion, while the circulating supply is around $4.1 billion in the market as on 1st Nov 2019.

Controversies

Tether has a fair share of controversies in its kitty. As the central banks hold the appropriate amount of gold reserves equivalent to the new currency issued in the market, Tether Limited holds the equivalent amount of US Dollars in its reserve for the Tether coins circulated in the market. Lately, there are claims that the company doesn’t hold enough reserves in USD, claiming Tether Ltd haven’t been too transparent with the audits as to where and how much of the reserves have been stored in different places.

The December 2017 Bitcoin price surge is also attributed to be the work of the Tether limited. It is alleged that the company has created Tether coins out of thin air and bought Bitcoin at a lower price, eventually attributing the price surge of the currency. Thus, there are growing fears in the crypto market that if there are no adequate reserves of USD backing the Tether, the value of the coin should be determined by the market rather than maintaining it stable. Despite all these controversies, this cryptocurrency is still one of the most traded ones in the crypto space because of its stability factor.

Categories
Forex Market

What Should You Know About Funding Your Forex Trading Account?

Introduction

A forex account, also known as the foreign exchange account, is used to hold and trade different currencies. When a trader opens an account with a forex broker, they will have to fund his account with his home currency, and then they get to buy or sell foreign currencies using that money. Today, opening a forex account and funding that account is a pretty seamless process. All you need to do is to choose a reliable and credible Forex broker, open an account with them, and fund it to start trading. Forex brokers provide many options to fund a trading account. Let’s look at those methods in this article.

Funding methods in forex

To attract traders, forex brokers offer a wide range of payment options for both deposits and withdrawals. They are categorized into the following methods.

Offline payments

Offline payment options involve traditional means of funding trading account which includes:

  • Local deposit
  • Western union
  • Bank wire
  • Cheque

These methods are best used when you want to trade in huge amounts of money. However, before you transfer this large amount of money, make sure that you know the broker well enough and that you trust them completely. Payment via Bank wire and other methods are relatively more expensive and take at least six days or more. The reason for this method being expensive is because it involves bank transaction fees and currency exchange services fees. These are additional costs which are levied when you make payments.

The disadvantage of using the above method is that if you fall prey to a scam, it will get hard to get your money back. The broker will provide you with the transaction ID, which is the only proof of payment.

eWallet payments

eWallet payments are getting more and more popular nowadays due to their ease of use, relatively lower transaction costs, and faster execution. In fact, most brokers offer instant deposits and withdrawals with eWallets. Some of the widely used eWallet funding methods include:

  • Neteller
  • Skrill
  • Paypal
  • CashU
  • Webmoney

Using the eWallet payment method is often better than using offline payment methods. eWallet service providers offer higher protection of trading account, which means if you want a refund of your deposit, your eWallet can get the job done for you easily. It acts as a medium between the merchant (the forex broker) and the customer (the trader). Forex brokers also offer special bonuses when you use your eWallet very frequently or make transactions with huge volume.

Debit/Credit cards

Funding your trading account using debit/credit cards is another popular way for traders to deposit instantly. However, the bank will enforce a limit on deposit and withdrawal based on the trader’s capacity. If you notice the broker is carrying out any malicious activity, you can take back all your money using a facility called ‘chargeback.’ Note that a ‘chargeback’ does not guarantee your money back. Therefore traders need to be cautious when funding their account using debit/credit cards. Even the credit card details will be exposed, of course, when using this method for transactions.

Best way to fund your trading account

After looking at different funding methods, eWallet payments turn out to be the best option for funding for the following reasons:

  • Lower transaction cost (relatively) – Deposits and withdrawals can be done almost cost-free, which are usually covered in spreads charged by the broker.
  • Safe – eWallets ensure the safety of your money, with great transparency.
  • Fast execution – Deposits and withdrawals are faster via eWallets as it is instant in most of the cases. You can also link your debit or credit card to your eWallet and use them.

This covers most of the ways through which you can fund your trading account. If you have any questions, let us know in the comments below. Cheers!

Categories
Forex Course

14.The Different Sessions In The Forex Market

Introduction

The forex market is traded all across the world. In fact, it is open 24 hours. And these markets are traded in countries when their national markets are open. There are about four major countries where vast lumps of cash flow in and out of the forex market and thereby keeping it very liquid and volatile. To trade professionally, having an idea of the different markets open and close is vital. Hence, in this lesson, we shall be going over the various sessions in the forex market.

Forex market trading sessions

Though all countries trade in the forex market, there are a few countries where the massive volume of trading takes place. The 24 hours trading in the forex market is divided into four sessions. These four sessions are given as follows:

• The Sydney Session 

• The Tokyo Session

• The London Session

• The New York Session

Moreover, the open and close of these sessions vary based on the season as well. One session falls between March/April to October/November, and the other starts from October/November and goes up to March/April. The former is the spring/summer session, and the latter is the Fall/Winter session.

Trade timings during Spring/Summer (in the US)

Trade timings during the Fall/Winter (in the US)

Note that the time represented is the local time (US) and the EST, and is different from every country’s standard time. However, the standard market timings for most countries lie within 7:00 AM and 6:00 PM.

Furthermore, there is an overlap between sessions. That is, during the overlap, the Forex market is traded by two regions simultaneously. For example,

The New York and the London session has an overlap between 8:00 AM – 12:00 PM EST

The Sydney and the Tokyo session overlaps between 7:00 AM and 2:00 AM

And the London and the Tokyo session overlaps between 3:00 AM to 4:00 AM.

These overlapping sessions are essential for traders because at that time is when more liquidity and volatility are created in currency pairs. This is so because traders from two markets operate simultaneously.

Hence, this completes the lesson on the different sessions in the forex market. And in further lessons, we shall discuss each one of the sessions in detail. For now, test your learning of this lesson by taking up the quiz below.

[wp_quiz id=”46553″]
Categories
Crypto Guides

Understanding The Basics Of Binance Coin

Introduction

For crypto enthusiasts, Binance is a well-known word as it is one of the largest cryptocurrency exchanges. The word Binance is a portmanteau of Binary and Finance. Binance coin was initially launched on the Ethereum platform and later was moved on to the Binance’s proprietary blockchain (Binance Chain).

Binance was founded by its CEO Changpeng Zhao who is known as CZ in the world of cryptocurrency, with co-founder & CTO Roger Wang.

Objective

The objective of the Binance coin creation was to serve as a medium for transaction fees, which includes trading fees, exchange fees, and listing fees on the Binance exchange. Just like Ether fuels the Ethereum blockchain platform, Binance coin fuels the Binance exchange. Like any other cryptocurrency, this coin can be traded as well in many of the cryptocurrency exchanges. Binance initially had its headquarters in China, and then in Japan, because of local government regulations. Finally, it had to move its headquarters to Malta.

Binance Coin ICO

Binance coin had its Initial Coin Offering from June 14th to June 27th in 2017. Before the  ICO happened, the network minted a total of 200 million tokens. 50% of the total tokens mined (100 million) were reserved for the ICO, and they raised approximately $15 million. The funds raised are used in three different ways; 35% of the funds raised were used to build and maintain the platform. 50% of the funds were used for branding and marketing the platform. The remaining 15% are reserved for emergency contingencies.

Fee model of the exchange

As mentioned earlier, in Binance exchange, BNB acts as a token for transaction fees. There is a benefit for using BNB token for transaction fees in the exchange. At present, Binance charges 0.1% on each trade, but if we use BNB token for transacting, the exchange offers a discount. For the first year, the concession stands at 50%, and from there on, it will be halved till the 4th year. That means, for the second year the discount would be at 25%, the third year it is 12.5% and 6.75% for the fourth year. From the fifth year onwards there wouldn’t be any discounts. Hence, there are high chances of the coin value to get depreciated as the discount decreases for each passing year. Therefore to combat the depreciation, Binance plans to burn 50% of its coins, i.e., a total of 100 million coins overtime to stabilize the currency.

Consensus 

Binance Chain uses the Tendermint Byzantine fault tolerance (BFT) consensus mechanism. The network uses different types of nodes in the system to validate and broadcast the transactions to other nodes. Validator nodes, as the name suggests, validate the transactions in the network. Witness nodes act as a witness for the consensus process and broadcast transactions to all the nodes involved in the network. Finally, the accelerator nodes are owned by the organization to speed up the validation process.

Market Cap

Binance coin stands in eighth place in terms of market cap with a value of approximately 3 billion dollars. Each coin is traded at $19.91 as of 28/10/2019. The 24-hour trading volume is $353 million, while a total of 155 million BNB’s are available in the market as of now.

Conclusion

Binance coin is one of the most innovative cryptos out there in terms of its consensus and usage. As discussed, the founders plan to burn 50% of their coins to stabilize the value of the currency. 20% of the profits are to be burnt every quarter, eventually burning 100 million of the existing tokens. By looking at the history of the coin, the industry experts believe that the currency will sustain the market and emerge as one of the leading cryptocurrencies due to its strong backing and security.

Categories
Crypto Guides

Litecoin – Short guide to The Bitcoin Of Altcoins!

Introduction

Litecoin is an early Bitcoin spinoff as it was started in October 2011. It was created by Charlie Lee, who was a Google employee and a former director at Coinbase. Litecoin is a peer to peer cryptocurrency released via an open-source client through Github under the MIT/X11 license. It is one of the most commonly traded coins in the world of cryptocurrency and has a market value of billions. Forked initially from Bitcoin protocol, Litecoin takes the underlying source code from Bitcoin and making specific changes to increase the transaction speed of the network.

Objective

Litecoin is famously called silver to the bitcoin’s gold, i.e., in the world of cryptocurrency; if bitcoin is gold, then Litecoin is like silver. Mainly Litecoin was developed to overcome the shortcomings of Bitcoin. When it comes to the block time (the time taken to generate a block), Litecoin takes 2.5 mins to create a block while bitcoin takes 10 mins for the same. Hence, the Litecoin network is four times faster than the Bitcoin network.

Consensus Used

Litecoin uses a proof of work algorithm called Scrypt. Unlike Bitcoin’s Proof of work algorithm (SHA 256), Scrypt is more efficient as it prevents customization for hardware solutions and favors high-speed random-access memory. Hence miners find it easy to mine without much complexity as this algorithm allows them to use central processing units or graphics processing units.

Market Capitalization

Litecoin is in sixth place in terms of market cap in the cryptocurrency world with $3.9 Billion value while the price of each coin is at $61.70 as of October 27th, 2019. 63.5 million number of coins are in circulation in the market with 24-hour trading volume as $4.3 Billion.

Price History

Litecoin was traded first with a price of $4.30 in April 2013. By November 2013, it was selling at a double-digit price of $35.78. The form then has seen a continuous downfall and maintained a moderate standard rate until April 2017. It had seen a slow and steady rise from April 2017 with $10.28 to $297.18 in Jan 2018. The coin has yet again seen a downfall in 2018, with a price of $30.99 by December 31st, 2018. This crypto has been performing well in 2019 when compared to the previous year, with its highest rate in the year with $145.45 in June 2019. Industry experts are bullish about the growth of the coin due to its transaction speed and other vital properties.

Total number of Coins

Cryptocurrencies have a cap when it comes to production. While Bitcoin has a cap of 21 million coins, Litecoin has a cap of 84 million coins, which means only 84 million Litecoins can be ever mined from the network.

Rewards

For running and maintaining the network, the miners are rewarded for each block generated. Litecoin network rewards the miners with 25 Litecoins for every block generated. However, the reward gets halved for every 8,40,000 blocks made. In August 2019, the network halved the rewards as the milestone was reached, and hence the reward as of now per block is only 12.5 LTC.

Bottom line

The main aim of any cryptocurrency is to stabilize itself as a medium of exchange. While Litecoin has approximately around 100,000 users, it is nowhere near to be the standard medium of exchange amongst the cryptocurrencies. Still, as the usage of cryptocurrencies increases, Litecoin holds an excellent position to attain the place due to its transaction speed.

Categories
Forex Market

The Basics of Spread & Slippage

Spread

Did you know that each time you place a trade, you pay a fee to the broker for providing the opportunity & platform to trade? Spreads act as a fee on zero-commission accounts (STP accounts). A spread is simply the price difference between the purchase price and selling price of an asset. The broker always shows two quotes of currency – one at which they sell the underlying asset to you and another at which they buy the underlying asset from you. The spread between these two prices makes the broker’s revenue from the foreign exchange transactions they perform for their clients.

Bid-Ask spread

There are two types of forex rates, the Bid and the Ask.

The price you pay to buy the forex pair is called Ask. It is always slightly higher than the market price.

The price at which you sell the forex pair is called Bid. It is always slightly lower than the market price.

The price that you see on the chart is always a Bid price. The ‘Ask’ price is always higher than the ‘Bid’ price by a few pips. Spread is essentially the difference between these two rates.

Spread = Ask – Bid

For example, when you see EUR/USD rates quoted as 1.1290/1.1291, you buy the pair at the highest Ask price of 1.1291 and sell it lower Bid price of 1.1290. This particular quote shows a spread of 1 pip.

Types of spreads

The kinds of spread depend on the rules of the broker. Spreads can either be fixed or floating.

Fixed spreads remain fixed no matter what the market conditions are at any given point of time. The advantage of this type of spread is that the broker will not be able to widen the spreads during volatility.

Floating, also known as variable spreads, are continually changing. They widen or tighten depending on the supply and demand of currencies and market volatility.

Slippage

Slippage is a phenomenon in the forex market where currency prices change while an order is being placed, thus causing traders to enter or exit trades at prices higher or lower than they desire. Slippage happens because of the imbalance of buyers, sellers, and trade volumes. It also occurs when the market is less active with lower liquidity.

For instance, a trader wants to buy a currency pair at $1.0015 (Current Market Price) with a broker of his choice. Once he submits the buy order, the best-offered price suddenly changes to $1.0020. It is considered as a negative slippage of 5 pips. In the same example, if the best-offered buy price suddenly changes to $1.0005, it is regarded as a positive slippage of 10 pips.

How to avoid slippage?

Slippage cannot be entirely avoided if you trade using market orders, but it can be reduced. One way a trader can minimize slippage is to ensure that their broker has many liquidity providers. Another way is to avoid trading during periods of high volatility as prices move faster and at wider intervals. To check volatility, traders can make use of technical indicators such as Bollinger bands or Average True Range.

The only way to entirely avoid slippage is by using strategies that employ limit orders on entries and exits.

Categories
Forex Basic Strategies

Heard Of The Amazing ’20 Pips Per Day’ Strategy?

Introduction

Forex is the most liquid and volatile market in the world. The average pip movement in the major currency pairs is around 100 pips. However, as a retail trader, it is not impractical to grab 100 pips every single day. Though there are some strategies out there, it is very challenging to make 100 pips per day every day. But, there is 20 pips strategy, 30 pips strategy as well as 50 pips strategy, which is much reliable than the 100 pips strategy. So, in this lesson, we shall be discussing the 20 pips strategy.


The 20 Pips Strategy


The strategy is very simple and straightforward. According to this strategy, when the price breaks above a range in a logical area, you must go long, and when it breaks below a range in a logical area, you must go short. So, this strategy is basically a breakout strategy. However, it’s not as straightforward as it sounds. There are some criteria one must consider before trading this strategy.

❁ Considerations

Currency Pair

You can trade this strategy on any currency pair. However, it is recommended to focus mainly on major and minor currency pairs.

 Session

Though the market is open 24 hours, it does not mean you can apply this strategy any time during the day. To keep it safe, it is advised to trade only during the times when there is high liquidity. That is, the London – New York overlap would be the best time to apply this strategy. Else, the London session or the New York session will work perfectly fine as well. And it is great if you do not trade it during the Asian session, as markets don’t usually break out during this period.

 Timeframe

Timeframe plays an important role when it comes to trading a strategy of this type. To make 20 pips a day, it is ideal to stay between the 1hour timeframe and the 15-minute timeframe.

Indicators

This strategy does not require any technical indicators.

How to trade the 20 pips strategy

Below is a step by step process to trade this strategy.

  1. Open the candlestick chart of any currency pair, preferably, a major or minor currency pair.
  2. Firstly, go to the 1-hour timeframe in the chart and see if the market is in a logical area to buy or sell (Ex: Support and resistance).
  3. If yes, then wait for the price to break above or below the consolidation area.
  4. Check the strength of the breakout on the lower timeframe (15 minutes). Based on the strength, prepare to hit the buy or sell.

 Trading the 20 pips strategy on the live charts

• Buy example

Below is the chart of AUDUSD on the 1-hour timeframe. We can see that the market has been bouncing off from the purple line. So, this becomes a logical area to buy. At present, the market is holding at the purple support line. And it was in a tiny range for like ten candles. Now, to apply the strategy, we need the market to break above this range.

In the below image, we can see that the market breaks above the range with a big green candle. But, before hitting the buy, we must switch to the lower timeframe and see if the momentum of the candle that broke the range was strong or not.

In the below 15 min chart, we can clearly see that the broke above the range in just two green candles. This is an indication that the buyers have come up strong. Hence, now we can prepare to go long.

Coming to the take profit and stop loss, the take profit would, of course, be 20 pips, and the stop loss can be kept a few pips below the support area. Alternatively, you can even go for a 1:1 RR by keeping a stop loss of pips.


• Sell example

Note that this strategy can be applied when the market is in a trending state as well. Below is the chart of EUR/USD on the 1-hour timeframe, and we can see that the market is in a downtrend. The market keeps making lower lows and lower highs. At present, it can be seen that the market is pulling back, and a green candle has appeared. Now, all we need is the price to break below the pullback to give us a heads up that the downtrend is still active.

In the below chart, we can see that, in the very next candle, the market broke below the pullback area. Hence, we can prepare to go short after getting confirmation of the strength from the lower timeframe.

In the below 15-minute timeframe chart, we can see that the momentum of the candle was sufficiently robust during the breakout. Hence, we can consider shorting in now.

As far as the take profit and stop loss are concerned, it remains the same as the previous example. That is, 20 pips take profit with 20 pips stop loss.

Bottom line

A great feature to consider about this strategy is that it can be used in any state of the market. However, all the criteria mentioned above must be met for the strategy to work. If you’re a beginner in trading, then this could be an ideal strategy to get started with. And if you have experience in trading, you can try enhancing the strategy by applying some indicators and patterns.

Note that this strategy, just like other strategies, does not provide 100% accuracy. There are times when this strategy fails, as well. Hence, it is recommended to use this strategy in conjunction with other strategies to have a better winning probability. Happy Trading!

Categories
Forex Course

13. General Myths In The Forex Market Every Trader Must Be Aware Of

Introduction

Forex is the market for trading currency pairs. It is a real business that happens over the internet. However, many new traders do not take it seriously and often associate it with gambling. And this misconception still exists in the minds of people. Hence, it is necessary to fade these thoughts away as it could lead to significant losses in the long term.

Having that said, in this lesson, we shall discuss some of the myths and facts about the forex market, which are vital for traders to know.

Myths about the Forex Market

Forex is a get-rich-quick scheme

Many traders enter into this market with the assumption that they can make quick profits consistently. They start off with a small capital do make quite a good amount of money. This entices them, and they begin to maximize their lot sizes. In the end, they lose all of their profits, including their capital in just one trade. So, do not ever enter the forex market, considering it to be a game of gambling as it can completely blow away your account within no time.

Professional traders have an accuracy of 100% profitability

Whosoever be the trader, when they trade in the forex market, it is almost impossible to have only profitable trades. This is because; sometimes, there are events that happen to occur without the knowledge of the trader. And during these times, there is a high probability for the trade to go against your direction. So, the consistency of a successful trader is around 80-90%.

Stop-losses are purposefully triggered by the broker

Many traders believe that their stop-losses are hunted by their broker. But, this is just a misconception in the minds of people. Note that brokers have absolutely nothing to do with your stop-loss. It is the market itself that hunts for your stop-loss.

There exists ‘THE best strategy’ in trading

Many novice traders, in fact, all novice traders, go in search of the best strategy to trade. But, the truth is that the best strategy is not an absolute term. There are a countless number of strategies out there, and it all depends on you on how you adapt to it. Hence, there the concept of  ‘best strategy’ is just a myth.

You need to have a financial degree to trade in forex

Well, a great fact to know about the forex market is that you do not need any degree to qualify to trade. However, as we always say, education is definitely required for you to succeed in the market even though it is not a formal one.

The price movements in the forex market are entirely random

Even though the forex market is extremely hard to predict, the price movements are not entirely random. There are different ways through which a trader can assess the conditions of these prices. With the help of Technical Analysis or statistical (quant) methods, a trader can moderately anticipate the price action of currency pairs and thereby they can have an edge in the market.

This brings us to the end of this lesson. We hope we’ve cleared out some of the misconceptions you had about the forex market. To have a recap to this lesson, we have a quiz set up for you below.

[wp_quiz id=”46291″]
Categories
Crypto Guides

Understanding The Basics Of Bitcoin Cash

Introduction 

As the name suggests, one can easily conclude that Bitcoin Cash is forked from the original Bitcoin protocol. It is also called as Bcash and is created in 2017. A Mining pool known as ‘ViaBTC’ proposed the name Bitcoin Cash for this cryptocurrency. In 2018, Bcash was further split into Bitcoin Cash ABC and Bitcoin SV (Satoshi Vision). This coin is traded in the cryptocurrency exchanges with BCH as the symbol.

Objective

The central vision of Satoshi Nakamoto to invent cryptocurrency is to enable the usage of the cryptos in day to day transactions. That, too, without any central authority having control over the same. As Bitcoin gained traction, the transaction fees, and the validation of the transaction started taking longer than usual. This unusual time to validate the transaction didn’t make it suitable for the day to day transactions. Hence the industry experts, after much deliberation, decided to fork the original Bitcoin protocol and create a new coin.

How is the BCH different from Bitcoin?

The block time, i.e., the time take for the generation of each block by validating the transactions, is 10 minutes, which is typically the same as Bitcoin protocol. But the block size, i.e., the number of transactions that a block can hold is around 1 MB for the Bitcoin network at the time in 2017 (when the network was forked to create BCH), but the block size of a block in BCH is designed to be 8 MB to 32 MB. The number of transactions that the BCH protocol can hold during a test in September 2018 surged to more than 25,000 transactions per second, giving fierce competition to traditional operations performed by VISA and Mastercard per second. Bitcoin Cash also doesn’t incorporate Segregated Witness (SegWit), a protocol in which the Bitcoin network used to increase the number of transactions per block. (Segregated Witness is an implementation in the system to remove metadata of the block to increase the block size)

Consensus

BCH also uses a POW consensus algorithm, just like Bitcoin protocol. Both Bitcoin and BCH are capped at 21 million coins. The complexity of the challenge proposed by the network changes for every 2016 blocks as they both use an algorithm with similar complexity for mining the coins.

Market Capitalization

Bitcoin Cash stands at the fifth place in terms of market cap with $3.8 Billion in value while the price of each coin being $210.51 (as on 23/10/2019). The 24-hour trading volume is $1.6 Billion, with a supply of ~18 Million BCH coins in the market.

Price History

In August 2017, the coin started trading for the first time at $294.60. By January 1st, 2018, it was trading at $2534.82, which is around 760% increase compared with the initial inception. The surge in pricing is due to the crypto boom between November and December 2017. By January 16th, it saw a decline of 26% and traded at $1,772. From then on, this coin had a continuous decrease till November 2018, when the currency split into two medals.

BCH had a tremendous growth as the block size started at 8 MB and reached 32 MB at present as per the plan during its inception. This makes this crypto, a viable currency for day to day transactions.

Categories
Forex Market

What Is Pip & Why Should You Know About It?

What is a pip?

Essentially, a pip represents the price interest point. It is known to be the smallest numerical price move in the forex market. As you know that most currencies are priced to 4 decimal places, obviously, any change in price would start from the last decimal point. For example, in the price quote, $1.0002, ‘2’ indicates the pip value. A pipette means the 5th decimal place, while pip is the 4th decimal place.

For most pairs (except JPY), it is equivalent to 0.01% or 1/100th of one percent. In the forex market, this is referred to as Basis Point (BPS). One BPS is equal to 0.01% and denotes the percentage change in the exchange rate.

Calculation of move

Now that you know what pip means, let us see how it changes the profit and loss in your trading account. Large positions will have greater monetary consequences in your balance. The formula for calculating the value of the position is:

Position size x 0.0001 = Monetary value of pip

Let us use the above formula and apply it in some real pairs. If you open a position of 1000 units, the pip value can be calculated as 1000 (units) x 0.0001 (one pip) = $0.1 per pip.

When you open buy positions and market reacts in your favor, for every pip movement, you will earn $0.1, and the same is the case for a sell position. If the market moves against you after you buy or sell, $0.1 will be lost per pip movement as the trend continues in the opposite direction. Increasing or decreasing the number of positions will have the exact effect on the pip value.

Different currencies and their pip value

Pip value varies per currency as they are dependent on how it is traded. It also depends on the trading platform and the price feed. It is important to know that there are brokers who show four digits as pip, and some show five. One of the most important points you need to know is the average daily trading range, in order to gauge volatility in the market.

Average daily pip movement of major currency pairs

Conclusion

To conclude, pips are the smallest increment by which a currency pair can change in value and represents the fourth decimal of a currency pair other than the Japanese yen. In the case of Japanese yen, the pip is located at the second decimal place. Proper knowledge of pips will help you determine your stop loss size, as it is a major part of any strategy. One should never underestimate the simplicity of pip. Now that you have learned what a pip means, you can proceed to more trading concepts. Cheers!

Categories
Forex Basic Strategies Forex Trading Strategies

How To Trade Options With a Directional Bias Strategy

Introduction

A challenging question every trader comes across in his trading career is: whether he should be buying a call option or a put option? Traders establish directional bias by studying high-level charts, support and resistance levels, price action, and fundamental indicators. Dow Theory suggests that the market will continue to move in the same direction until an external force causes a reversal or break in the trend.

Directional bias plays a major role in the ‘trend-reversal’ strategy than in the ‘trend following’ strategy. Directional bias will help a trader decide if he should be going long or short in options. You can also identify the direction of the market trend. Once you establish a directional bias, you will have greater confidence in executing your trading strategy. During the process of execution, none of the actions are emotionally driven.

How to develop a directional bias?

Any trade which includes thorough preparation should consist of establishing directional bias, and it is a two-step process.

  1. Predicting the direction of the price move and overall trend.
  2. Identifying the trigger points and trading rules that will confirm our directional bias.

Determining a directional is just one step towards making a successful trade. There are many more things we need to put together before taking a trade. After backtesting a few strategies, establish some trading rules. Remember to include only those rules that confirm your directional bias. Confirming directional bias is an excellent habit that improves the success rate of trades.

A successful trading strategy is more about the right planning and psychology rather than a single entry technique or trading system. Options trading is said to be complex, hence requires a lot of knowledge before one can trade it. Other than that, you need to consider factors that are specific to options like time decay, option theta, option beta, and option gamma. We explain here how it is to be done correctly.

Directional bias through momentum indicators

The easiest way to establish directional bias is by using momentum indicators and price action analysis. If prices are trending in an upward direction, making higher highs and higher lows, traders should look to buy. On the other hand, if prices are making lower lows and lower highs, traders should look to sell. In this strategy, momentum indicators can be used as an additional confirmation tool.

Example of buying a call option

In the above picture, the orange line graph represents the momentum indicator. The price action pattern shows a formation of higher highs and higher lows, with the indicator pointing towards the buy-side. The candlestick pattern should be such that there is no opposing force that could possibly reverse the current trend.

Point of entry: The exact point of entry would be after the formation of at least one higher high and higher low. This is confirmed by the momentum indicator, which shows a sudden rise above the average value. This is a low-risk entry with maximum reward.

Take profit and stop loss: When the momentum indicator no longer makes higher highs and higher lows with the main trend, it is a sign that the trend might be coming to an end. Hence, you should book profits here. Stop-loss in this strategy should be placed below the previous higher low.

Note: All the trades discussed above are to be executed using a call option and not using the cash segment. It is advised to choose the strike prices accordingly. There could be some differences in the entry price and stop loss of options when compared to spot prices.

The same rules apply for sell trade as well, but here a put option needs to be bought, and you would essentially want to look for lower lows and lower highs.

Directional bias through Moving averages

We would like to conclude our methods of establishing directional bias with the use of ‘moving averages.’ This is one such technical indicator, which can be used to develop any new strategy. For this strategy, we use the 20-day moving average as it is considered to be one of the most powerful moving averages.

In the above figure, we have plotted the 20-day Moving average using the yellow line. This is a simpler strategy as compared to the momentum indicator strategy. Here, if you see the price trading above the 20-day MA, you should form a directional bias to buy. And if the price is trading below the 20-day MA, you should form a directional bias to sell.

Point of entry: When price crosses the MA line on any side and stays there for more than four candles, you should be taking entry in that direction of the trend. More the number of candles better will be the entry.

Take profit and stop loss: You can continue to hold on to the trade until the price reverses and crosses the other side of the MA line. If it crosses, book out your profits. Stop-loss can be placed at the high or low from where the market reverses.

Conclusion

If you use any other way of developing directional bias, make sure that it needs to be simple. If it becomes complicated, it can increase the complexity of your trading strategy. Having a directional bias will make you trade in the direction of the dominant trend, which is less risky. Finally, a trader needs to abstain from opening positions that have no directional bias.

We hope you find this article informative. If you have any questions regarding this strategy, please let us know in the comments below. Happy Trading!

Categories
Crypto Guides

DASH – Everything You Should Know About This New Age Cryptocurrency

Introduction

The word “Dash” is created from Digital Cash, thus signifying it is a virtual currency in its name itself. This coin was introduced by Evan Duffield in 2014, initially naming it as Xcoin. Later it got rebranded as Darkcoin as it was being used in the dark web for illegal activities due to its inherent features. The coin finally got renamed as Dash in March 2015. Dash is significantly different from the other cryptocurrencies in the market. It is an open-source cryptocurrency run in the form of DAO – Decentralized Autonomous Organization. We ll understand what a DAO in the latter part of the article.

Objective

Dash is created by forking the bitcoin network. Evan Duffield thought the bitcoin protocol could be improvised, especially the transaction speed and the governance structure, and thus started dash as an altcoin to bitcoin. The source code for the coin was taken from the bitcoin itself. Some tweaks were made to improvise the functioning as required. The block timing, i.e., the time taken to mine a single block, is 2.5 minutes compared to 13 minutes of bitcoin, thus making it four times faster. Apart from the transaction speed, the transaction in DASH is more private than the original bitcoin protocol.

Consensus

Dash uses a combination of Proof of Work (POW) and Proof of Stake (POS) mechanisms. Primarily it uses POW using a hash function called “X11”. While POS functionalities are used to reward its miners for hosting, maintaining, and updating the blockchain. Every cryptocurrency must have nodes to perform different activities in the network, but dash has two types of nodes, masternodes and normal nodes.

Difference between masternodes and normal nodes

Nodes are nothing but computational devices in the network used to host, validate, maintain the ledger copies, and secure the system. The masternodes perform all these duties while also having the vote function for the governance of the network. Masternodes contain the complete copy of the ledger, while normal nodes can have a partial copy. Normal nodes help in mining more coins as they concentrate on only mining. To be a masternode, one should deposit an upfront sum of 1000 Dash coins with a specific set of hardware requirements like RAM, hard disk space, CPU, and network bandwidth.

Masternodes help in the special transactions that DASH has to offers. They are PrivateSend and InstaSend.

PrivateSend

PrivateSend is used if the transactions need to be untraceable. This is achieved by dividing the entire size of the transaction to the small similar size transactions and mix them before executing a transaction. This makes the transaction untraceable as the senders and receiver’s accounts are not noticeable.

InstaSend

InstaSend feature is the extraordinary feature offered by the Dash. The validation process is done by only masternodes, thus making them instantaneous in real-time. This enables real transactions using Dash and can be used with merchants.

DAO

Decentralized Autonomous Organizations are the ones that work autonomously based on the precoded set of rules during the company’s inception. The founders and shareholders make decisions based on the voting process, and hence they are very transparent. DASH is essentially a DAO.

Market Cap

Dash currently occupies 18th position in the market cap with $625 million in value. The current trading price of the dash is $68.67, with a 24-hour trading volume of $216 million.

With all these features, Dash is amongst the most distinguishable cryptocurrencies out there, which proves that real-time usage of cryptocurrencies in our day to day life is indeed possible.

Categories
Forex Course

12. The First Step In Your Trading Journey

Introduction

Trading the forex market involves high risk. As per statistics, 95% of the traders fail in this domain. Hence, having expertise and experience in trading is very necessary for staying away from the 95%. And in this course, we’re here to guide you on how to be a successful trader. So let’s discuss what your first step should be in your trading journey.

Demo Trading

As mentioned, forex is a very risky business. One must never enter the live market during their initially early stages. So, brokers help the novice traders by providing a facility to demo trade. With a demo trading account, one can place live trades in the market just like a real trading account. In this account, you get virtual cash to place trades on the live charts. Moreover, in this platform, you get all the features and tools that are available on a real trading platform. And the best part is that this platform is provided by brokers for free of cost.

Advantage of Demo Trading

Helps test your strategies and techniques

There is no strategy that will work with 100% certainty. So, testing a new strategy on the real account can cause damage to your account balance. But, with a demo account, you can test your strategies without any risk.

Gives you a hands-on experience on placing orders

In forex, there are different types of orders. With a demo account, one can test the working of all these orders without the fear of losing money.

Helps concentrate on analysis rather than emotions

Emotions play a major role when it comes to trading. Emotions in trading can lead to huge losses as it takes over the actual analysis. One can reduce emotions entering into them while trading, only when they start gaining experience. Hence, trading in a demo account can help you focus on your analysis rather than emotions taking over.

How to create a trading plan

Well, having experience in demo trading is insufficient to start trading the live markets. A systematic plan for trading plays a vital role, as well. Below is an example of how you can create a perfect plan for yourself.

Choose your time zone: Though the forex market is a 24 hours market, it is not ideal to trade anytime in the day. Hence, you must choose those zones which bring in great liquidity and volatility in the market.

Fix your timeframe: You must be firm on one set of timeframes because switching over timeframes is a clumsy way of trading.

Choose the right currency pairs: There are about 28 majorly traded currencies. Keeping track of all these is a challenging task. So, you must select only a few currencies and analyze them deeply.

Have one fixed strategy: Novice traders look for new strategies every trading day. But, this is completely the wrong way to trade as it becomes more like gambling than real trading. So, you must have one standard strategy in which you can keep optimizing with experience.

Maintain a trading journal: This can be the most vital plan in your trading plan. However, many take this for granted. With a journal, one can keep track of their past transactions and get a statement on the number of loss & win trades. It will give you a clear picture of your consistency. This can help you improve your trading by learning from past mistakes.

By following these steps, you can be sure that you are up to a great start on your trading journey. Take the below quiz to check your learnings.

[wp_quiz id=”45923″]
Categories
Forex Market

What Are The Different Types Of Orders In The Forex Market?

What is an order?

One of the first things every forex trader should know is about the different order types and implications of each one. An order in forex determines how you will enter or exit the market. Today, in trading, more options are available than just buying and selling at the current market price. With different order types, one can make the most of their trading opportunities.

Why are different order types needed in the forex market?

There needs to be some automation in the forex market. As we know that forex is 24 hours market, investors’ holdings, and their net worth keeps changing 24/7. If an open position is not managed regularly, the profit/loss figure can change drastically. Also, it is not possible to manage your positions all the time if you are working full time.

Therefore, in such a scenario, pending orders came in handy. These are tools investors and traders in the forex market use to manage their open positions. ‘Orders’ allow the traders to ensure that the value of their trades remain within certain bounds even though the market is open all day. Now let’s look at different order types.

Market order

Market orders are the most common types of orders used in the forex market. It is just an order to buy an asset at the current market price. Market orders are executed on a real-time basis when placed. Since prices in the forex market are changing rapidly, the order may be completed at a different price than you intended. This is known as slippage in market terminology. Slippage may work in the favor or against an investor. A market order creates an open position immediately.

Pending order

A pending order is an instruction to buy or sell an asset when certain conditions are met. It is a type of market order that gets executed only when certain conditions are fulfilled. It is a conditional market order. Pending orders eliminate the need to monitor the screen for placing trades continuously. It sets up an automatic order system that will execute trades instantly when the conditions are met. There are different types of pending orders. They are:

  • Buy Limit Order
  • Sell Limit Order
  • Buy Stop Order
  • Sell Stop Order

Let’s understand each of these orders below.

Buy & Sell Limit Order

It is an order placed by the traders to buy or sell a currency at a particular price. Typically, this price is better than the current market price. Traders can find both buy and sell limit orders in most of the trading platforms. A buy limit order will always be below the current market price (or sometimes equal), while a sell limit is always above the current market price (or sometimes equal). For instance, if you want to buy EUR/USD at 1.05 and the current market price is 1.11. You can place a limit order at 1.05, and your order will automatically get executed if the currency pair reaches this price.

Application limit orders

Let us assume that the market is in a downtrend. As a trend, you wish to sell precisely at the support and resistance line. Since a market order does not assure the precise price, you can prefer placing a sell limit order instead. This is because, with a limit order, your order will get executed at the exact price you were willing to take the trade.

Buy & Sell Stop Order

This is the converse of Limit order. By using this order, traders can place a buy order above the market price and a sell order below the market price. By doing this, they can increase the odds of entering or exiting the trade at their preferred price.

Application of stop orders

Let’s say the market is in a range and there is some news coming up which you think will break above the range and head north. You being a breakout trader wish to buy it after the breakout. During the news, the volatility is so high that it is hard to get hold of a good price if executing a market order. So, here is where a stop order comes to action. With this order, you can keep a buy stop order just above the range, as it will execute the trade automatically when the price hits the buy stop price.

Stop-loss order

It is an order placed by the traders to limit their losses on the trades they take. By using this order, a currency pair can be bought or sold once its price reaches a particular price, also known as ‘Stop Price.’ For instance, if you buy USD/CAD for $1.31 and not willing to lose more than $0.1 when you exit, you can place your stop-loss order at $1.21. This order only gets executed if and only if the price of the currency goes below $1.21.

Conclusion

There are more premium orders that are being provided by the advance brokerage firms. Some of them include Trailing Stop-Loss Order, After Market Order, and Bracket Order, etc. The forex market is gradually moving towards artificial intelligence for executing trades. The latest development in ‘orders’ is the creation of dependent orders. This means the investor can place two orders simultaneously, and based on the input, only one of the two will be executed. Dependent orders use complex algorithms that execute trades with minimal human intervention.

Categories
Crypto Guides

What Should You Know About Ripple? The Most Centralized Cryptocurrency!

Introduction 

In our previous articles, we have seen that Bitcoin has inspired and paved the way for a multitude of new and affordable platforms using cryptocurrencies. Ripple is one such platform developed by Ripple Lab’s incorporation, a US-based company in 2012. It is a payment platform built upon a distributed open-source protocol. This best part about this cryptocurrency is that it is backed by major Banking and financial institutions. They use Ripple for transferring money, commodities, cryptocurrencies, or any other units of value like flier miles or free mobile minutes.

Objective

The Objective of Ripple is to rule over all the international transactions worldwide. They have come up with this objective as the cost of international transactions is too high if we transact using traditional means. It also takes days to settle the transaction. The most innovative idea behind this platform is that we can use the network to transfer any currency, not only cryptocurrency, to be more specific. Thus, making the platform currency independent. Ripple Network, also knows as RippleNet, enables many banks and financial institutions to send and receive money smoothly throughout the world.

How is Ripple different from other cryptocurrencies?

In the world of blockchain, the upcoming networks or platforms are trying to eradicate the existing systems. Ripple is doing precisely the opposite. Instead of trying to remove them, this technology is trying to cooperate with them to make them better. Several products by Ripple Labs (XCurremt, XVia, and XRapid) are being used by several banks to perform transactions globally. The native cryptocurrency of the platform XRP plays an essential role in the system.

Let us see how the transactions are performed globally using Ripple technology. The currency which is being transacted is converted into XRP before the transaction. As the recipient receives the money, the user will have an option to convert the XRP into his/her desired currency. Thus, XRP plays a bridge between two different currencies in this case. The transaction fees for this transaction is as less as $0.00001. This transaction fee disappears from the network after the transaction is processed.

Market Capitalization 

Ripple’s XRP is in third place in terms of market capitalization amongst Cryptocurrencies. Currently, this crypto is trading at $0.295, while the total market cap is around 12 billion dollars. The 24-hour trading volume is $1,729,560,739. The maximum number of coins the XRP ever can have is 100,000,000,000, while 43,242,653,330 out of them are already in circulation (43.2%).

Pros and Cons of Ripple

We have already seen that many banks have trust in Ripple technology and started using this network. By using this technology, some world-renowned banks claim that they are potentially saving 70% of the transaction costs annually. Since all the coins are minted already, inflation i.e., the value of Ripple, remains stable over the period.

Ripple is highly centralized, unlike other cryptocurrencies. 61% of the coins minted are in control of the founders of the Ripple Labs. They decide when and how much of the coins are released. Hence centralization is the major con. In May 2018, Ripple was accused of alleged cheating through its ICO.

Conclusion

Since 2013, many traditional platforms that serve international transactions have adopted Ripple as an alternative remittance option to its customers. By December 2014, Ripple combined its services with Earhports payments systems, making it the first-ever partnership of Ripple with a giant payments network. Western Union, American Express, and Unicredit are some of the largest customers of this technology, making the technology achieve its goal closer every passing day.

Categories
Forex Course

11. The Different Order Types In The Forex Market

Introduction

In the world of trading, the order types are identical, irrespective of the market you’re trading. The type of the ‘Order’ refers to how you wish to enter or exit a trade. If you’re new to the world of trading, you might only know two order types – Buy and Sell. But there are other order types that serve different purposes, and improve the way you trade. In this lesson, we will be discussing some of the most used orders in the forex market.

Types of Orders

There are about four order types widely used by traders. These are

  • Market Order
  • Limit Entry Order (Buy Limit, Sell Limit)
  • Stop Entry Order (Buy Stop, Sell Stop)
  • Stop Loss Order

Apart from the above, there are other orders that are exclusively offered by specific brokers like ‘Trailing Stop-Loss’ and ‘Profit Booking Order’ but in this article, we shall confine only to these four types.

Understanding the Bid and Ask prices

Let us first discuss these two terms as they form the base for understanding the order types.

Bid price

The bid price is the price at which the broker is willing to buy the currency pair from you. So, when you short sell a currency pair, you will be executed at the bid price.

Ask price

Ask price is the price at which the broker is willing to sell the currency pair to you. So, if you go long (buy) on a currency pair, you will be filled at the ask price.

With this under consideration, let us continue our discussion on different order types.

Market Order

This is the most basic form of order. In a market order, you get filled at the current market price. It is basically the best price available in the market to buy/sell a currency pair.

For example, let’s say the bid price of EURUSD is 1.2150, and the ask price is 1.2152. Now, if you execute a market buy order on this one, you will get filled at the ask price, i.e., at 1.2152. Similarly, if you go short on this pair, you will get filed at 1.2150.

Market orders are fast. A trader uses that order to enter a marker no matter what. That speed and fill guarantee comes at the cost of the slippage is the market has moved from the instant the trader pulls the trigger to when the order is filled.

Limit Entry Order

Limit entry order is an order where a buy order is placed less than the current market price, and a sell order is placed above the current market price.

For example, let’s say the current market price of AUDUSD is 0.6750. Now, if you want to buy it at 0.6725, you will have to place a Buy Limit order at this price. And if you want to short it at 0.6790, you will need to place a Sell Limit order at this price.

Limit orders can be used as entry or as exit orders.

As entry orders, you are applying the logic of buy low and sell high (on short-sell limit orders). A limit order is handy to spot a support area while the price moves back and get filled as the price approaches support.

As exit orders, they are handy to take profits. You place a limit to sell at your profit-taking level on long trades and you place a buy limit order at your profit target level on short trades.

Stop Entry Order

A stop entry order is the reverse of a limit entry order. Here, you can place a buy order above the current market price and a short sell order below the current market price.

For example, let’s say the current market price of GBPJPY 1.6570. Now, if you think the market will head up only if the price breaks above 1.6590, you must place a Buy Stop at the price you wish to buy. So, when the price goes up to 1.6590, your buy order will be executed.

Stop-Loss Order

A stop-loss order is special order for closing a trade. This order is placed against the price at which you bought/sold the currency pair. This is done to avoid further losses from trade. Since this order ‘stops’ the losses, it is called a ‘stop-loss’ order.

For example, let’s say you bought a currency pair at 1.1320. Now, for this trade, if you place a stop-loss at 1.1250, the positions will be closed when the market touches this price, hence, protecting you from further losses.

This completes the lesson on basic order types in the forex market. We will discuss the more premium broker specific orders in our future lessons. For now, take the below quiz and check what you have learned the concepts right.

[wp_quiz id=”45527″]
Categories
Forex Course

10. Understanding Lots & Different Types Involved

Introduction

In the stock market, securities are traded in a number of shares. Similarly, in the Forex market, currencies are traded in units of the currency. And these units are combines into different tradable sizes, and they are called as ‘Lots.’ Hence, to buy and sell currency pairs, you must trade in the form of lots. There are different lot sizes depending on the number of units you trade. For example, 10,000 units are referred to as a mini lot and 100,000 units as a standard lot. Now, in this lesson, we shall understand other lot sizes along with some examples.

What is a lot in Forex?

A lot in Forex is the number of units of a currency pair. Note that one unit is not equal to one lot. Instead, a collection of units of a currency pairs make a lot. And depending on the number of units that are involved in making up a lot, there are different lot sizes in the market.

Different Types of Lots in Forex

Depending on the number of units, we can classify Lots in four types.

Standard Lot

The size of this lot is 1 and is made up of 1000,000 units of a currency pair. So, buying 100,000 units of EURUSD is as good as saying you have bought 1 lot of EURUSD.

Mini Lot

In terms of lot size, the quantity of ‘lots’ in a mini lot is 0.1. And one mini lot consists of 10,000 units of a currency pair.

Micro Lot

The quantity of lots in a micro lot is 0.01. And this lot is made up of 1,000 units. So, buying is 1 micro lot means, buying 0.01 lots or 1,000 units.

Nano Lot

0.001 lots make up one nano lot, and it consists of 100 units of a currency pair.

Now, let us take some examples and clear out the differences in these types.

Examples

E.g., 1: Buying 5 standard lots.

Lot size distribution = 5 * 1 standard lot

Number of units = 5 * 100,000 = 500,000 units

E.g., 2: Selling 1.5 standard lots

Lot size distribution = 1 * 1 standard lot + 5 * mini lots

Number of units = 1.5 * 100,000 = 150,000

E.g., 3: Buying 3.2 mini lots

Lot size distribution = 3 mini lots + 2 micro lots

Number of units = 3.2 * 10,000 = 32,000

Leverage trading

You must have seen brokers who let traders trade with as low as $100. In fact, they let you trade mini lots with it. Now, you must be wondering how one can trade 10,000 units with just $100 in their account. Well, this is facilitated by the brokers as they offer to trade with ‘leverage.’

In leverage trading, brokers let you take positions larger than the capital you possess. And as far as the mechanism of this is concerned, a broker lends you with the required money to take a position. And for this, they keep some amount of your capital as deposits. This deposit stays with them until your trade is open. When the trade is closed, the complete deposit is returned back to you. Leverage, also referred to as margin, is usually measured in ratios or in percentages. A detailed explanation of this shall be discussed in further lessons.

Hence, this completes the lesson on Forex lots and its types. And below is a quiz to help you check if you have grasped the concept better.

[wp_quiz id=”45130″]
Categories
Crypto Guides

Understanding The Basics Of ‘Ethereum’ – A Revolutionary Cryptocurrency

Introduction

The most talked-about cryptocurrency after Bitcoin is Ether. Ether is second in market capitalization after Bitcoin. While the Bitcoin network is only about minting Bitcoins using the POW consensus algorithm, the Ethereum platform is much more than just the cryptocurrency that the network helps in minting. Vitalik Buterin developed the Ethereum platform by taking inspiration from Bitcoin whitepaper. He wants Ethereum to be something called ‘World Computer.’

Objective

The worldwide web(www), which came into existence with the advent of the internet, transformed our lives completely. To login to different websites, we store our email id’s and passwords in various machines, though the devices may be personal. Still, the credential information is stored in the servers of different websites around the world. Hackers make these servers as targets and steal our information, which results in a breathtaking loss. Hence Ethereum’s goal is to protect user’s data. Ethereum wants to disrupt the client-server model by using thousands of nodes across the globe run by individual volunteers.

Ether

So, where does Ether come into picture amidst all this? It is the cryptocurrency of the Ethereum platform. Ether is generated when each block of transactions gets added to the existing blocks in the Ethereum network. The number of coins made every year is a fixed amount as per the determination of the network. By now, we understand that the Ethereum platform offers decentralized internet or DApps – decentralized apps. As the services cannot be taken free of cost, Ether also helps in fueling the performance of these apps. To perform any transactions in the decentralized apps functioning on the Ethereum platform, one must pay in Ether. The transaction fees are also called as gas as it is the fuel to perform transactions.

Market Capitalization 

Ether is traded under the name of ETH in cryptocurrency exchanges. Each Ether costs about $172.49, while the market cap of Ethereum is around 18 billion dollars. The 24-hour trading volume is approximately 7 billion dollars.

Consensus Used

Consensus algorithms are the backbone of any blockchain network. Bitcoin and Ethereum both use Proof of Work (POW) as a consensus algorithm today. But Ethereum aims to move to Proof of Stake (POS) as POW is very costly concerning the power consumption and computational resources consumption as well. Ethereum hard fork is impending where the significant change is going to be the switch from POW to POS.

Price History

Ether started with zero price on July 30, 2015. 2016 was a slow-growth year for ETH, while 2017 saw tremendous gains beginning from the start of the year itself. By December 2017, the price was around $800. By January 2018, it achieved its highest rate ever with 1,261.03 dollars. A severe downfall has been seen in the same year; by June, it halved the value to $531.15 by December; it even reduced to $141.33. 2019 has been somewhat stable year compared to the previous years. In July 2019, the price was around $300, and at present, the price is at $172.49.

Conclusion

While Bitcoin has given birth to the concept of cryptocurrency, Ethereum went a bit ahead and explored the true potential of blockchain technology with decentralized apps. After Bitcoin, Ethereum is the next go-to cryptocurrency concerning any measure one can check. Ether price has been kind of stable this year, and investors can hold on to it for the long term as the hard fork of the Ethereum is only going to make the coin even better. Stay tuned for more informative content on individual cryptos.

Categories
Crypto Guides

What Is Market Capitalization? Top Cryptocurrencies With Highest Market Cap!

Introduction

Market capitalization is estimated for publicly traded companies in general to determine the value of that company. The value is calculated based on the total number of outstanding shares in the market multiplied by the individual share price. In simple words, the market cap is nothing but the market value of a publicly trading company.

Initial Public Offering (IPO)

Initial Public Offering or IPO’s are widely known. Companys which issue IPOs are publicly trading companies willing to raise capital for investing in the business to diversify and expand the company. When a company issues IPO, it agrees to sell a certain stake of the company to the public to raise the company. There are many successful IPO’s since 1602, when the first-ever IPO was recorded. Global companies like Amazon and Apple crossed one trillion-dollar in market cap, making them powerful than some smaller countries.

Initial Coin Offering (ICO)

Similar to IPOs, we have ICOs called Initial Coin offering with regards to cryptocurrencies. ICOs help crypto companies to raise funds that will be invested in creating a new coin, service, or dApps. These companies generally release a white paper detailing the aim of the ICO, minimum capital they intend to raise, and the basic design and properties of the product they are trying to create. Many investors plan to invest in ICOs to make quick bucks and earn tremendous profits. The result of some of the prominent ICOs promises the same.

Hence, the market cap of a cryptocurrency is determined by the number of outstanding coins in the market multiplied by the individual value of a coin.

Now, let’s look at the top 10 cryptocurrencies in terms of market capitalization.

  1. Bitcoin (Market Cap – $146.1 BN)

Bitcoin is the first-ever cryptocurrency, and it is obvious that this crypto tops the list in terms of market cap. The market cap of Bitcoin is $146,141,293,771, with the total number of coins in circulation being almost 18 million. As we all know, only 21 million Bitcoins can ever be mined.

  1. Ethereum (Market Cap – $19.1 BN)

Ethereum rightly earned its second place as it was developed to overcome the limitations of bitcoin, and it has become the second favorite amongst the investors. The market cap of Ethereum is around $19,191,075,792 with 108,182,195 coins in circulation.

  1. Ripple (Market Cap – $12.8 BN)

Ripples XRP takes third place with $12,833,995,058 as a market cap. The total number of coins in circulation is around 43,166,787,298. This crypto earned its credibility by gaining support from some of the most powerful centralized institutions like Federal Reserva.

  1. Tether (Market Cap – $4.1 BN)

Tether has been developed to be a stable coin, i.e., the price will always be maintained as one dollar. This coin has been developed to have the stability of fiat currency while having the key properties of cryptocurrency. The market cap of Tether is $4,121,497,986, with 4,108,044,456 coins being circulated in the market.

  1. Bitcoin Cash (Market Cap – $3.9 BN)

Bitcoin cash is created by forking the main Bitcoin platform. The market cap is around $3,956,035,700 with 18,061,950 number of coins in the market.

  1. Litecoin (Market Cap – $3.4 BN)

Litecoin is a spinoff of Bitcoin, thus earning the name of altcoin, which means alternate coin (to bitcoin). Around 63,484,804 Litecoins are currently circulating in the market.

Some of the other cryptos with high market cap include

Binance Coin (Market Cap – $2.8 BN)

EOS (Market Cap – $2.7 BN)

Bitcoin SV (Market Cap – $1.5 BN)

Stellar (Market Cap – $1.3 BN)

All the above information is as of 16th October 2019. For real-time figures, you can visit this website.

The adoption and usage of cryptocurrencies will only increase in the future as they are here to stay. At the peak of the bitcoin price in December 2017, the market cap of all the cryptocurrencies was around 125 billion dollars, and as of today, it is 221.3 billion dollars. Given the history, the market cap of all the cryptocurrencies can quickly reach a trillion dollars in the near future.

Categories
Forex Course

9. Understanding The Concept Of ‘Pip’ In Detail

Introduction

‘Pip,’ the word sounds pretty familiar, right? Well, that’s because this is a fundamental term when it comes to trading in the forex market. Pip forms the base for reading the price changes in the currencies. Hence, understanding this lesson is very important. So, let’s begin by defining what a pip is.

What is a pip?

Pip is a unit of movement in currency pairs. It basically tells, by how many values the price of the currency pair has changed. A pip is the same for all the pairs except for the currencies paired with JPY. One pip for every JPY pairs is 0.01 while it is 0.0001 for the rest. Hence, the fourth decimal place in the price of the currency pair represents a pip for non-JPY pairs, and the second decimal place in the price represents a pip for JPY pairs. Now, let us comprehend this with an example.

Let’s say the current market price of EURUSD is 1.1000. We say a currency price has moved by one pip when the price rises to 1.1001. Similarly, when the price goes up to 1.1008, we say the price has moved to by 8 pips (w.r.t 1.1000). Taking it further, if the price goes up even higher until 1.1010, we say the market has risen by 10 pips. From these three examples, we can come up with the formula for pip as follows:

Pip = current market price – initial price under consideration (For long position)

Pip = initial price under consideration – current market price (For short position)

Let’ say the CMP of USDCAD is 1.3230. Later, the price shoots to1.3293. Let us calculate how many pips have this pair increased.

Pip = 1.3293 – 1.3230

Pip = 0.0063

Hence, the currency has risen by 63 pips.

Pips extended

The change in the value of the price on the fourth decimal point represents the pip change between 0-9.

The change in the value of the price on the third decimal point represents the pip change between 10 and 99.

The change in the value of the price on the second decimal point represents the pip change between 100 and 999.

The change in the value of the price on the first decimal point represents the pip change between 1000 and 9999.

Let us understand this by an example. Let’s say the current market price of a currency pair is 0.5829.

Here, 9 indicates 9 pips,

2 indicates 20 pips,

8 indicates 800 pips, and

5 indicates 5000 pips.

What is Pip a value?

The pip value adds value to the pip by determining its ‘worth’ in terms of the base currency. Pip value for a currency pair can be calculated using the below formula.

Pip value = change in the value of counter currency * exchange rate ratio

Example: Let’s say the price of GBPUSD is 1.2450. That is, 1 GBP is equal to 1.2450 USD. Now, if price moved by one pip, i.e., to 1.245. The pip value for this can be calculated as follows.

Pip value = 0.0001 USD * (1 GBP/1.2450 USD)

Pip value = 0.00008032 GBP

Hence, by trading one unit GBPUSD, you will make 0.00008032 GBP. Similarly, trading 100,000 units of this pair, you will get 8.032 GBP.

What is Pipette?

Apart from pips, brokers represent quotes in pipettes, as well. An increase in the decimal place of a pip will get you the pipette value. So, the 5th decimal and 3rd decimal place represents pipettes for non-JPY pairs and JPY pairs, respectively.

For example, if the price of EURUSD increases from 1.21001 to 1.21002, we say the price has risen by 2 pipettes.

That’s all about Pips. If you have any more questions, let us know by commenting below. Don’t forget to check your learning by answering the below questions.

[wp_quiz id=”44951″]
Categories
Forex Market

Trading Energy Commodities – Crude Oil, Coal & Natural Gas

Introduction

Energy belongs to that category of commodities, which has the most significant impact on our daily lives. Energy prices affect the cost of almost everything that we consume on a daily basis, including the clothes we wear, the fuel we put in our cars, and the electronic gadgets. They, in turn, determine the increase or decrease in the prices of homes, hospitals, schools, etc. We cannot imagine ourselves in a world without energy.

The unit that is used to define the quantities of energy is the British thermal unit (Btu), which measures the heat content of fuels. According to the Energy Information Agency (EIA), every year, worldwide energy consumption exceeds 575 quadrillions Btu and is expected to reach 736 quadrillions by 2040.

Major energy commodities

Highly traded energy commodities are from non-renewable energy sources, except for ethanol and electricity generation. These commodities are very liquid when it comes to trading. Traders can also invest in these commodities through ETFs and CFDs.

Crude oil

Crude oil is one of the most actively traded commodities in the world. The price of crude oil affects many other commodities, including natural gas and gasoline. Crude oil comes in different grades. Light Crude oil is traded on the New York Mercantile Exchange (NYMEX). This type of crude oil is popular because it is the easiest to distill into other products. The next grade of oil is Brent Crude oil, which is primarily traded in London and is seeing the increasing interest. The last grade of oil is the West Texas Intermediate (WTI) oil from U.S. wells. The product is light and sweet and is ideal for making gasoline. The reports for crude oil are found in the U.S. Energy Information Administration (EIA) reports. This report is released every Wednesday around 10:30 PM ET. Traders take investment decisions based on the data of this report.

Coal

Coal is a fossil fuel that is formed from dead plant matter trapped between rock deposits. Coal is used as an energy source for hundreds of years. This mineral generates 41% of the global supply of electricity and plays a crucial role in other industries. The top 5 coal-producing countries are China, the USA, India, Australia, and New Zealand.

Natural gas

Natural gas is formed either by methane-releasing microorganisms in swamps or by pressurizing organic material deep underground. Three major reserves for natural gas are Canada, USA, and Russia. This commodity has many applications, from electricity generation to fertilizers. Natural gas futures and ETFs are available for traders and investors. The price of natural gas depends on the demand and supply of the commodity itself.

Energy commodities can also be traded through Forex Brokers these days. Many of the credible and regulated and unregulated Foreign exchange brokers allow their customers to trade all the major energy commodities like Crude Oil, Coal, and Natural Gas.

Factors affecting the prices of energy commodities

  • Market growth
  • Energy efficiency
  • Population growth
  • Electricity penetration
  • Industrialization in developing economies

Conclusion

Investors who want to invest in the energy sector should track the indices of that sector. These indices measure the production and sale of energy. One can also monitor the performance of energy company shares prices. Energy company’s revenue depends on the price of the commodity they are selling. Other factors include production costs, competition, and interest rates. That’s about Energy commodity. Cheers!

Categories
Forex Basic Strategies

Understanding The N-period Narrow Range Trading Strategy

Introduction

There are three states in the market – trend state, channel state, and range state. A trending market is the one where the market makes higher highs or lower lows, and a ranging market is a state where the price goes through a consolidation phase. The channels can be considered as a particular case of range as they work similarly to a range, but are tilted.

What is consolidation?

To understand this strategy, we must first understand the concept of consolidation. Consolidation is a technical term in trading where the market loses momentum and starts to move in the form of a range.

A common tendency of the market is that, when the price starts to move in a range and begins to consolidate, it prepares blast in one of the sides. So, people always keep an eye on currency pairs, which are in a consolidation phase.

N-Period Narrow Range

In the N-period narrow range, the period N takes two values –4 and 7. So, we have the 4-period narrow range and the 7-period narrow range. These two are also referred to as the NR4 (Narrow Range 4) and the NR7 (Narrow Range 7).

The NR4 and NR7 trading strategy

This strategy is basically a modified range breakout strategy where the market consolidates in the beginning and then blasts out of a narrow range.

In NR4, number 4 refers to the period under consideration. That is, for NR4, the last four days are taken into consideration, and for NR7, the last seven days are taken into account.

What is the NR4 and NR7 strategy?

It is a breakout trading technique where we consider the last four or sever days to apply this strategy. And in these four or seven days, we compare the range of all these days and determine if the current day is an NR4 or NR7 day. Once we obtain the NR4 or NR7 day, we gear up to go long or short.

Calculating the range

Firstly, to trade this strategy, consider the candlestick chart on the daily timeframe. The range of a particular day is calculated as the difference between the high price and the low price.

What is the NR4 day and the NR7 day?

NR4 day

In layman’s terms, the least fluctuated day (4th day) in the recent four days is called the NR4 day. Technically, it is the day whose range is the smallest out of the previous four trading days.

NR7 day

Similarly, when the 7th day in the last seven days moves the least number of pips, it is referred to as the NR7 day.

How to trade the NR4/NR7 strategy?

Following is a set by step procedure to trade this strategy:

  1. Find the high and low of the last few days (seven for NR7 and four for NR4).
  2. Calculate the range (high – low) for each day under consideration.
  3. Compare these range values with the previous days.
  4. Determine if the present day is an NR4 or NR7 day. If so, then wait for the price to break out of the high or low of the NR4/NR7 day.

If the market breaks above the high, then it is an indication for a buy, or if it breaks below the low, then it is an indication for a sell.

Illustration to trade the N-period Narrow Range

Trading the NR4/NR7 strategy is simple. But, as far as the consistency of this strategy is concerned, one can make more out of this strategy only when the NR4/NR7 day appears in the right location. Hence, understanding ‘where’ the NR4/NR7 occurs is very vital. So, let’s consider a few examples to support this statement.

Below is the chart of USD/CAD on the Daily timeframe. We can clearly see that the market is moving in a channel state. Now, to trade this strategy, we blend it with the working of a channel.

Trading a channel is pretty straightforward. When the price is at the bottom of the channel, we look for buying opportunities, and when it is at the top of the channel, we look for short-selling opportunities. With this mind, we try spotting the NR4/NR7 days in these regions.

Below is the magnified image of the chart where we’re going to analyze the market. Initially, the market came down rolling until the bottom of the channel and began to hold down there. And the candle which held at the bottom turned out to be the NR7 day as it has the smallest range compared to the previous six days. This is an indication that the market (sellers) is slowing down. Later, the market blasts up north and breaks the high of the NR7 day. Therefore, now we can prepare to go long.

And as we can see, the trade performs exceptionally well. This is because the location was in favor of the NR7 day.

Continuing with the same chart, the market which was at the bottom of the channel now moves up to the top of the channel. During this up move, the market loses its momentum every step of the way and ends up giving us the NR4 day at the top of the Channel. Hence, once the price breaks below the low of the NR4 candle, we can go for the short sell. And as a result, the market does break through the NR4 day and heads down south.

Bottom line

Trading in the markets is not an easy task. There is no indicator, pattern, or strategy that can consistently work standalone. There are several other considerations that should be made before getting into a trade. For example, in the above trades, we saw how we combined the NR4/NR7 with the concept of channels and made a profit from them. Also, for any strategy, you trade, make sure that there is logical reasoning behind taking the trade. We hope you find this strategy informative. If you have any questions, please let us know in the comments below.

Categories
Forex Basic Strategies

Trade Breakouts Like A Pro With This ‘Breakout Trading Strategy’

Introduction

In previous strategies article, we have discussed the ‘Turtle Soup Strategy by fading the Donchian channel.’ We hope you tried that strategy. In today’s article, let us discuss how to trade breakouts. We will also cover some of the best strategies used by professional traders to trade breakouts. Aggressive traders prefer trading this Breakout strategy compared to the conservative ones.

What is breakout trading?

To understand breakout trading, it is necessary to know the two important types of breakouts.

Defining a breakout

Breakout trading is an effort to enter the market when price moves outside a defined price range. The price range could be between support and resistance or between swing high and swing low. It is good if the breakout is accompanied by high volume.

Breakout of support and resistance

This type of breakout is quite simple and straight forward. The breakout of support and resistance should ideally happen with a big and bold candle. Because that shows the genuineness of the breakout. In the below chart, the candle closes well above the support and resistance level. In the below figure, it can be noticed instantly. A rule of thumb is that the bigger the breakout candle, the better it is.

Breakout of swing high and swing low

Very similar to the support and resistance breakout, this type of breakout has an additional filter. The filter is nothing but to trade the setups that offer the best outcome. In a swing high and swing low breakout, we enter the market after the price crosses a long-time high (1hr or 4hr high). That high should be followed by a strong sell-off. Conversely, the same is true for a swing low.  A trader must backtest their strategy before applying them to the live markets.

Best Breakout Strategy

To increase the accuracy of the signals generated by this strategy, we use an indicator known as Volume Weighted Moving Average (VWMA). It is a very simple technical indicator that is used for volume analysis. It resembles a moving average but is based on volume. It gives extra information than just the price of an asset. This indicator can be found on most of the trading platforms by default, and when plotted, it looks something like this.

Step 1: Identify the swing highs from where the market sold off very strongly and traveled a fair amount of distance. Mark that price on the chart.

The first step of a breakout strategy is to identify those levels and mark them as breakout trading levels. This step is important because we should pay attention to only significant and clear levels.

The resistance level we have identified in the above figure is a significant level. If you look closely, you will see rejection off the resistance level took the price down three times. Whenever there was a rally, the swing high stopped the price.

Step 2: Wait for a break and close above the resistance level

Once we have identified the swing highs, it’s just a game of patience and waiting. Next, we need a breakout candle to close above our resistance level. This is a sign that bulls are in full power.

It is not the end yet. We need confirmation from the VWMA indicator. This will give us the green signal to enter the trade in this breakout.

Step 3: Buy when the price closes above the VWMA

The final step of the breakout strategy is confirmation from the VWMA indicator. You should buy only if the VWMA is stretching above the close of the breakout candle. Visually, the VWMA should look stretched up. It is better if the moving average inclination is towards the upside.

Let’s understand this more clearly with the help of a chart.

In the above chart, prior to the breakout, the VWMA moved gradually higher, and after the breakout happened, the VWMA moved aggressively higher. This shows a strong presence of volume behind the breakout.

We haven’t still talked about placing our stop loss, which is crucial to reduce your losses in a trade. We also need to know where to book profits. This brings us to the final step of the strategy.

Step 4: Put stop loss below the breakout candle and take profit when you see a break below the VWMA

It is obvious to place the protective stop loss below the breakout candle. Because, if the price breaks below the candle that initiated the breakout, it will quickly tell that it was a false breakout.

Our take profit technique is automatic because a break below the VWMA suggests no more buyers are willing to participate in the current rally. We want to book profit at the early sign of market rollover.

We have taken the example of a buy trade. The same rules apply for a sell trade but in reverse. The best breakout strategy can be used in all market trends, whether up or down.

Bottom line

One of the advantages of our breakout trading strategy is that you’re trading with the momentum of the price. A final tip for all the traders while using this strategy is that, if the breakout happens after a big news event, then it is likely that big institution money is behind this breakout. When both fundamentals and technicals are working for you, the probability of success increases. We hope you find this strategy useful. If you have any questions, please let us know in the comments below. Cheers!

Categories
Forex Course

8. Which Is The Right Currency Pair To Buy & Sell?

Introduction

By now, we know that trading Forex market involves trading of currencies pairs rather than just a single currency. The working mechanism of this is quite different from that of the stock market. In the previous lessons, we learned how the buying and selling of a  currency pair work. However, this is still insufficient to take a trade on these currencies. Though you have the knowledge of which pair is strong or weak, choosing the right currency pair plays a vital role. There are times where you make a loss even if your analysis of the currency was correct. In this lesson, we shall try keeping you away from incurring these events.

Strength of the currency pairs

As discussed in the previous lessons, in a currency pair, we have something called as a base currency and a quote currency. To brush things up, the left currency on currency pair is called the base currency, and the one on the right is called the quote/counter currency. To trade the forex market successfully, one must do their analysis on both the currencies of the currency pair. For example, if you wish to trade the EURUSD currency pair, having knowledge in either EUR or USD is insufficient. Instead, you must have insights on both the currencies. This will not only prove the rightness of your analysis but will also reduce your risk considerably. Now, let us understand this in detail.

The answer to ‘why’ you must consider both currencies in a currency pair in your analysis rather than just one currency lies in the previous lessons. Well, when you go long/short on a currency pair, you are actually buying one currency and simultaneously selling the other one. So, if you analyze only one currency, you will be blindly be hitting a buy or sell on the other currency. Hence, it becomes equally important to consider the other currency in your analysis as well. For example, if you buy AUD/USD thinking that AUD is strong, there is no certainty that the prices of this pair will rise, as USD has its role to play as well.

Choosing the apt pair to trade

The answer to choosing the right currency pair is self-explanatory. It is always recommended to choose a currency pair where one of them is strong, and the other is equally weak. For example, let’s say in the USD/CHF pair, USD is strong, and CHF is weak. Ideally, one would buy a currency that is strong and would sell a currency pair that is weak. Coming to the case of USD/CHF, if you buy this currency pair, you are buying the USD and even selling CHF at the same time. Hence, you are basically doubling your success probability or halving your failure probability. If we were to visualize this currency pair, the USD would be shooting to the north while the CHF would be dropping towards the south. And in the form of a currency pair (where the base currency is taken into consideration), the chart would visually look in one direction, which is upward.

Apart from strong vs. weak pairs, you can even trade strong/weak vs. neutral pairs as well. But, note that it is highly risky to trade a strong vs. strong or weak vs. weak as the overall direction of the market becomes hard to predict. We hope you understood this concept. Now, let’s take a quick quiz.

[wp_quiz id=”44815″]
Categories
Forex Market

What Should You Know About Trading Metals?

Introduction

We have discussed metal commodities briefly in the previous article. In this article, let’s understand trading metals in detail. Trading precious metals were only possible by wealthy investors in earlier days. But now, every retail forex trader gets to trade these metals with the advent of CFD trading. Hence, a lot of investors hold metals in their portfolios by investing a significant chunk of their money in metals. Metals create a balanced portfolio as they are considered a hedge against inflation. Metals such as gold and silver can be treated as safe-haven bets since their scarcity provides support to their value.

Gold – The highly traded metal

Among all the metals, Gold is the most actively traded metal. This metal possesses intrinsic properties such as durability, malleability, and conductivity. These properties offered by gold account for its superiority. They also find their primary use in jewelry making. As with other commodities, forces of demand and supply determine prices of gold. The gold market is also influenced by risk parameters, market sentiment, and inflation trends. Investors turn to gold and invest heavily when there are signs of a global economic slowdown. The slowdown could be due to reasons like recession, political crisis, or government debt.

Because of these reasons, Gold is mostly traded by long term investors. They only look for signs of gold entering a bull or bear market. The trend can be determined with the help of equity indices. A strengthening economy means weaker demand for gold.

Silver

Silver is seen as the best metal trading option right after gold. It has its own merits. This metal is used in various industries, making it more sensitive to business conditions and trading activities. Hence, the prices of silver are more volatile than that of gold. So we can say that silver is ideal for short term traders.

Platinum

Platinum is also seen to gain value during times of economic and financial crisis. However, because of scarcity in the availability of platinum, the price is much higher compared to gold. Therefore it is less frequently traded. It still is a robust and safe-haven alternative, especially when the Gold is overbought in the market. The industrial use of Platinum is kind of similar to that of silver, making it price-sensitive to business conditions. In recent times, the demand for platinum in industrial usage is reduced by the increased use of catalytic converters.

You can trade metals with Forex brokers too

One of the important advantages of trading metals is that they give protection against inflation, which is not offered by any other financial instrument. Taking this into consideration, a lot of Forex brokers offer above mentioned precious metal trading against major currencies such as the US dollar, Japanese yen, Euro, Australian dollar, Canadian dollar, and British pound. You will also find metals such as Copper and Palladium on their platform. Some of the metal currency pairs include XAU/USD (Gold), XAG/USD (Silver) and XPT/USD (Platinum).

Conclusion

Even if it obvious, we must tell you that buying and selling precious metals do not mean the actual delivery of these commodities. We trade these metals over the counter (OTC). In this type of trading, there is high risk involved. So make sure you have a risk management plan in place, else there is a possibility of you losing all the money you have in your trading account. Some vital risk management tools include stop-loss and order cancellation. They will always protect the balance of your account.

Categories
Crypto Guides

What Is A Bitcoin Address & Why Should You Know About Them?

Introduction

In our previous articles, we have seen the properties, purpose, and working of cryptocurrencies taking bitcoin as an example. Now, let’s understand what a Bitcoin address is. This topic is vital since It is this address that enables Bitcoin to hold the property of Psuedonomity.

The transactions of Bitcoins are stored in a public decentralized distributed ledger. When we say its a public ledger, anyone can go to the Bitcoin website and check the transactions which are validated in the blockchain platform in real-time. One might wonder, in such case, how the pseudonymity of the user is ensured? Here comes the role of the Bitcoin address.

What is a Bitcoin address?

Two people transact Bitcoins using the Bitcoin address of each other. If we take the analogy of a bank, a Bitcoin address can be compared to the bank account number of a person. One should let the other person know their Bitcoin address for the transaction to happen. A typical Bitcoin address is alphanumeric, with 16-35 characters.

Currently, there are three types of address formats. The address formats only differ with respect to the characters which they begin with. The addresses start with either 1, 3, or bc1. Below are some of the examples of standard Bitcoin addresses.

1BvB6SEYstWetqTFn5Au8m6GFg7xJaNVN2

3J9891WpEZ73CNmQviecrn7iWrnqR4WNLy

bc1qar6srrr78fkvy5l643ly9nw9re59gtzzwf5mdq

Generating a Bitcoin Address

To generate a Bitcoin address, you should first download a bitcoin wallet. A Bitcoin wallet is a software that allows users to send, receive, and store Bitcoins securely. Storing Bitcoins is nothing but storing the private keys of that Bitcoin. These private keys are used to authorize a transaction and thereby unlocking the Bitcoins. More about Private keys and types of wallets will be discussed in further articles. So basically, once you download the wallet, you can generate a countless number of Bitcoin addresses. Every time you want to sell or receive Bitcoins, you can request a new Bitcoin address.

How to use the Bitcoin address effectively?

Even though your identity is not mentioned upfront, you can be traced by your Bitcoin address. Some wallet providers might ask for your identities while creating a Bitcoin wallet. Some times, even your e-mail ID will be linked to your Bitcoin address. So it is always advisable to generate a new Bitcoin address for each transaction you choose to do. Since Bitcoin is a public ledger, anyone can know how many Bitcoins you hold using your Bitcoin address. It is a time-consuming process, but there is a possibility. That is what we are trying to say. However, if a single-use address is used, they can’t know the exact amount you hold.

Since the Bitcoin address is long with alphanumeric characters, it gets difficult for someone to actually type out the entire address to send Bitcoins to you. So the best way to share your Bitcoin address is by getting a relevant QR code. Using a QR code to represent your address is the best way to make your address easily accessible to anyone. Anyone can scan and process the payments just by scanning the QR code without any hiccups.

Conclusion

The Bitcoin address plays an essential role in the entire Bitcoin functionality as it is the face of any Bitcoin transaction. One thing a person will know through your Bitcoin address is the account balance associated with that address. So it is not recommended to share your address publically on any of the social media platforms. As discussed, try to use different Bitcoin addresses every time you transact. However, you can publically share any one of your addresses in order to be extra secure. Cheers!


Categories
Forex Assets

An Overview of the Commodity Markets

Introduction

Trading that deals with raw materials, either manufactured or available as natural resources, are known as commodity trading. Investors, today can access around 50 major commodity markets. These are further divided into soft commodities and hard commodities. Hard commodities are natural resources that are mined or extracted, such as gold, silver, and oil. Soft commodities are agricultural products or livestock such as corn, coffee, sugar, and wheat.

Traders can invest in commodities in multiple ways. The most popular method of investing in commodities is by buying a futures contract. You also can purchase commodities through ETFs. Some of the U.S. commodity exchanges are the Chicago Mercantile Exchange, Chicago Board of trade, New York Board of Trade and New York Mercantile Exchange.

Different categories of commodities

Agricultural commodity trading

The commodities that fall under this category are sugar, coffee, cocoa, cotton, corn, and wheat. Many assume that agricultural markets are not thickly traded, but that’s a myth. In fact, coffee is the second largest commodity in the world, after oil.

The factors which impact the price of agricultural commodities are supply/demand, weather, trade agreements with other nations, new technology, taxation, etc. There are regulatory bodies that decide how a particular commodity should be produced and sold.

Energy commodity trading

This is an extremely popular category of commodities that includes Brent crude oil, WTI crude oil, gasoline, and others. The reason why these commodities are important is that they are an integral part of numerous industries. They have the power to move an entire economy. For example, an increase in oil prices will affect aviation companies, paint industries, tire companies and many more.

Countries like Russia and Saudi Arabia heavily depend on oil for revenues. Factors such as supply and demand play a major role in determining oil prices. Some other factors (which are specific to oil) include OPEC (Organization of the Petroleum Exporting Countries) meeting outcome, political statements, International agreements, etc.

Metal commodity trading

This category includes precious metals like Gold, Silver, Platinum, and Palladium. Earlier trading in precious metals was only possible by rich investors, but now with the introduction of CFD trading, traders can easily invest in metals along with wide leverage options. Supply and demand once again affect the prices of gold and other metals. Other factors include economic changes in China and India (as they are the world’s largest consumers), taxation, and Federal reserves’ interest changes.

Commodities on Forex Brokers 

Despite the fact that Forex is primarily a market for trading a variety of currencies, most Forex brokers offer a wide range of other various trading assets to their customers. By doing this, these brokers are helping their customers in diversifying their investments.

Currency trading brokers allow trading precious metals such as gold, silver, and platinum. Traders can also invest in energy commodities that include crude oil and natural gas. Forex brokers that provide commodity derivatives and CFDs are getting more and more popular and in-demand than the brokers who deal with only currencies and nothing beyond.

Guidelines to Commodity Trading

Novice traders should look at broad trends while investing and trading individual commodities. They could look at levels of crops being produced, metals being mined, and the oil extracted. Because these factors can give them clues about the direction of the market. Similar to this, inventory levels can also be a great tool for analyzing commodity markets. Continuous drawdown in inventory levels can lead to higher prices, while inventory buildup can lead to lower prices.

Technical analysis is another widely used method to trade commodities. This type of analysis uses historical prices and trends to predict the future. True technical traders do not pay any attention to fundamental factors but just price-action. But, our recommendation is to look at both fundamental factors and technical analysis in order to get the best trading results while dealing with commodities.

We hope you had a good read. If you have any questions, let us know in the comments below. Cheers!

Categories
Forex Course

7. How Does Profit & Loss Take Place When You Are Trading in Forex?

Introduction

Forex is that market where buying and selling of currency pairs take place. Unlike the stock market, where you need to consider only one stock to analyze, in the forex market, you will have to examine two different currencies to trade one instrument, as instruments here are traded in pairs. Hence, the correlation between currencies plays a major role while trading a currency pair.

Understanding the Current Market Price (CMP)

The current market price (exchange rate) of a currency pair tells you the number of units of the quote currency you’re required to pay to buy one unit of the base currency. For example, let’s say the exchange rate of EURUSD is 1.1000. Here, to buy one unit of EUR, you will have to pay 1.1000 USD. So, basically, while trading a currency pair, you are buying one currency and simultaneously selling the other currency.

Extracting money from the Forex market

Our purpose in this market is to make money. And to make money (profit), understanding the relationship between the two currencies in a currency pair becomes vital. Now coming to the objective, a trader must buy a currency pair when they expect the base currency to have more potential to show strength in the future, comparative to the quote currency. Or in simple terms, to make a profit from a trade, you must go long on the currency pair when you think the base currency will increase in value relative to the quote currency. (Going ‘long’ in Forex is nothing but buying the currency pair and going ‘short’ is nothing but selling it)

Complete trade example

For instance, the CMP of USD/CAD as 1.3240. And let’s say you believe that the USD/CAD is going to drop in the near future. So, you wish to short sell this currency pair. Consider your short sold 10,000 units of USD/CAD. Here, by selling this pair, you have internally sold 10,000 US Dollars and bought the equivalent Canadian Dollars (10,000 USD * 1.3240 = 13,240 CAD). After some days, you see that the prices have dropped to 1.3180. Now, since the value of this currency pair has changed, the 10,000 US Dollars in CAD will be turn out to be, 10,000 USD * 1.3180 = 13,180 CAD. Now, when you sell this currency pair at the CMP, you will actually be buying 10,000 USD and selling 13,180 CAD.

In the above example, let us see if you made a profit or a loss. Initially, you had sold 10,000 USD to buy 13,240 CAD. At this point, you are sitting with 13,240 CAD. Later, you bought back that 10,000 USD, and you paid (sold) just 13,180 for it. That is, you are still left with 60 CAD (13,240 – 13,180) with you.

Hence, you made a profit of 60 CAD ( which is ~45 USD).

Quick cheat sheet

When you buy a currency pair (buy – base currency, sell – quote currency), you need the price of the currency pair to appreciate in value.

Conversely, when you sell a currency pair (sell – base currency, buy – quote currency), you need the price of the currency pair to depreciate in value.

Now let’s check if you understood the concepts right by answering the below questions.

[wp_quiz id=”44276″]
Categories
Crypto Guides

How Does A Cryptocurrency Work? (Example – Bitcoin)

In the previous articles, we have learned the definition, properties, and purpose of cryptocurrency. But it is vital for us to know how cryptocurrencies work. In this article, let us find out that by taking the example of Bitcoin.

Below are some of the important terminologies you should know before going further.

Peer to Peer Network (P2P) – The networks where computational devices are joined together with the internet instead of using a central server are called peer to peer networks. Hence there is less chance of a network failure than the standard server model to form a network.

Miners – Miners are the participants in the network who validate transactions. Thus, the creation of new Bitcoins is often referred to as the mining of bitcoins.

Nodes – The individual computational devices in the network are called nodes. The nodes are joined to form a P2P network.

Consensus algorithms – To validate the transactions, the miners in the network should agree whether a transaction is valid or not. The blockchain network uses consensus algorithms to get this job done.

How does the Bitcoin network work?

The blockchain network is set up in a peer to peer way, enabling decentralization of the network effectively, removing the server model. Bitcoin network bundles a certain number of transactions into a block, and these blocks are linked using cryptographic hashing techniques. The miner should validate these blocks for the authenticity of the transactions. To confirm them, the system proposes a challenge to the miners, and the first miner to solve the problem, propagates the message throughout the network. The solution to the challenge is called ‘nonce.’ The complexity of finding this nonce increase as the number of blocks keeps increasing in the system. The other miners validate and approve the transactions if the transactions are not fraudulent.

Bitcoin as reward

The miner who achieves the solution first gets rewarded in the network in the form of Bitcoins. This is how and why the Bitcoins are generated in the network. The miners should be rewarded to keep them motivated and committed to the network. Without miners, the network wouldn’t be sustainable.

To transact Bitcoins in the network, users must pay transaction fees as well. These transaction fees are also in Bitcoin. Hence these transaction fees and Bitcoins generated are paid as a reward to the miners for validating the transactions.

POW as a consensus algorithm

Bitcoin uses Proof of Work (POW) as a consensus algorithm. POW proposes a challenge to the network, which is to be solved to validate the transactions. But why is it necessary? Because POW discourages denial of service. Below are the steps involved in POW in general.

  • The service requester requests service from the service provider.
  • The service provider gives a challenge that should be a bit complex for the service requester to resolve but easy enough for the service provider to check.
  • The service provider proposes this challenge to avoid the exploitation of the service from the service requester.

The exact same concept is used in the Bitcoin network, as well. The miner must expend a considerable amount of computational energy and electricity to solve the challenge. Because by doing this, he/she will not validate fraudulent transactions to be accurate. If they do validate fake transactions, they will lose all the time and computational power they spent and also the chance of gaining a reward. POW is the most efficient consensus algorithm so far, and it makes the Bitcoin network efficient.

We hope you understood the working of Bitcoin. Cryptocurrencies other than Bitcoin with different blockchains and consensus work in a different way. You will know about each of them in the upcoming articles. Let us know if you have any questions in the comments below. Cheers!

Categories
Forex Market

Contract For Difference (CFDs) Explained!

What is CFD?

A contract for difference (CFD) is a form of derivative trading. CFD allows a trader to speculate on prices of global financial markets such as shares, indices, commodities, and of course, currencies. While trading CFDs, a trader gets to bet on both upside and downside movements of the market. The profit and loss for CFD are calculated by taking the difference between the entry and exit prices and multiplying it by the number of units. CFDs always comes with an expiration date, before which you need to close your position. Trading these CFDs may appear sophisticated and complex in the beginning, but once you start trading them, it becomes easy to handle.

Leverage trading CFDs

CFDs are a leveraged product, which means a trader needs to maintain an optimum level of capital in their trading account to execute a trade. As it is leverage/margin trading, this capital can only be a small percentage of the full position’s value. While margin trading allows a trader to magnify their returns, losses will also be more as a trader will lose leverage times the capital he is betting on. Hence it is always recommended to go for less leverage. If you are a novice trader, we suggest you not to go beyond 2X leverage. And obviously, the gains and losses will be based on the value of a CFD contract.

Costs involved while trading CFDs

There are three types of costs a trader may incur while trading CFDs. Each of them is explained below.

Holding cost – At the end of each trading day (mostly at 5 PM New York time), if the positions are open in your account, it will be subject to a charge called ‘holding cost.’ Holding costs will depend on the CFD, direction of the position, and the holding rate.

Spread – CFDs always come with a spread, which is the difference between the buy and sell price. This price is decided by the broker, and it varies from broker to broker. A trader will have to enter a buy trade at the buy price quoted by the broker, and exit using the broker quoted sell price. The narrower the spread, the less the price needs to move in trader’s favor for their profits to start. These spreads are extremely competitive across all the brokers.

Market data charges – For getting live market feed and accurate prices, a trader must pay the relevant market data subscription fees. However, this fee is mostly applicable to stock CDFs and varies from broker to broker.

Things to remember

Like any other market, there are high risks involved in trading CFDs as well. CFDs are complex in nature (at least for novice traders), they carry a high risk, so it is important to do your research before you start trading. Also, since CFDs are leveraged products, losses can easily exceed your total investment. In volatile markets, your account balance can drop down to zero or even to a negative balance in no time. Following best trading practices like proper applying risk management to your trades will increase the chances of profiting.

We hope you find this article informative. Let us know if you have any questions in the comments below. Cheers!

Categories
Forex Course

6. Different Ways Of Trading The Forex Market

Introduction

Forex is a market to trade foreign currencies. It is traded 24 hours electronically over-the-counter, meaning the transactions are performed over the networks around the world. One way to trade the forex market is for one party to buy a currency, and the other to sell it. This method is referred to as spot forex trading. Apart from this, there are other ways to trade the Forex market. And in this lesson, we shall discuss these different ways.

Forex market and its types

If we were to consider the primary forex market asset types, we could find four. They are:

Spot Forex Market

Currency Futures

Currency Options

Currency Exchange-traded funds

Now, let us explain the working of each one of them in detail.

Spot Forex Market

As discussed, in the spot forex market, currencies are bought and sold for a short period of time, based on the current market price (CMP). The prices in this market are settled in cash, on the spot, bases on CMP. Hence, the spot market is also called a ‘cash market’ and ‘physical market.’ The settlement of orders in the spot market takes two days, while in the futures market, it takes much longer.

Spot trading is the most popular form of trading where the majority of the retail traders trade on. There is great liquidity in this market, and brokers even offer tight spreads on them. Apart from retail traders, other participants in this market include commercial banks, central banks, arbitrageurs, and speculators.

Currency futures market

In the currency futures market, the buyer buys a contract of one currency by paying another currency. While the seller of the contract holds the opposite obligation. And this obligation is due on the expiration date of the future. The ratio of the currencies is settled in advance between both the parties (the time when the contract is made). The parties make a profit or a loss depending on the difference between the real effective price on the date of expiry and the settled price.

Currency Options

A currency option is a type of options contract that gives the buyer the right, but not the obligation, to buy or sell a currency pair at a given price before a set time of expiry. To get this right, the holder of the option pays a premium to the seller who is known as an option seller.

There are two types of currency options, ‘Call option’ and ‘Put option.’ A call option gives the buyer the right to buy a currency pair at the strike price before the expiry date. A put option gives a buyer the right to sell a currency pair at the strike price before the expiry date. Currency options are a popular way of protecting against loss.

Since the options are a bit complex, let’s understand them with an example. If you believe that the price of the Euro will rise against the US dollar, you can buy a currency call with a strike price of 1.31000 and expiry at the end of the month. If the price of EUR/USD is below 1.31000 on the expiration day, the option expires worthless, and you would lose the premium paid. On the other hand, if EUR/USD increases to 1.50000, you can exercise the option and buy the currency for 1.31000 (At strike price). By doing this, you have generated high returns on your investment by using options.

Currency exchange-traded funds

Back then, Exchange-traded funds (ETFs) were only available for the stock market. But in the present, ETFs have expanded to the Forex market as well.

A currency ETF is a fund that clubs a single or typically a bunch of currency pairs. These funds are managed by financial institutions and are offered to the public for purchase on an exchange board. Hence, one can trade ETFs just like any share on the stock market.

These are the four primary ways of trading the Forex market. Now take the quick quiz below to know if you have understood the above concepts.

[wp_quiz id=”42577″]
Categories
Crypto Guides

Why Do We Need Cryptocurrencies? What Is Their Purpose?

Introduction

Cryptocurrencies are digital tokens used in the place of conventional fiat currency for the exchange of goods and services. The digital tokens are generated and regulated using encryption techniques called cryptographic hash functions, ensuring security and anonymity.

Why do we need cryptocurrency?

We are living in the digital era, where everything around us is changing swiftly. Not only our phones are smart now, but also our homes. We can speak and see people using video calls at a very cheap rate now. With virtual reality, we can create a different world around us by sitting on a couch. All of these weren’t even possible just a decade ago. But technological innovation has bought us to where we are today. We are amid the fourth industrial revolution today, which fundamentally changes the way we live, work, and relate to each other. Artificial Intelligence, Machine Learning, and Blockchain technologies pave the way for the same. Hence came the age of digital currencies, and they are transforming the way we transact with each other throughout the world.

Let us see in a particular way below on how cryptocurrencies can solve the problems that our traditional fiat currencies cannot solve.

Fraudulent currency

Cryptocurrencies solve the issue of fraudulent currencies. As they are generated and regulated using cryptographic hashing techniques, it is highly impossible to create counterfeit currencies. They are not being minted to create a hard copy of the same type with the same feature. These digital tokens are stored in the blockchain platform, where there is no worry of duplicity.

Double spending

The concept of digital currencies was there even before Bitcoin, but they couldn’t be attained in reality. The obstacle was the double-spending. A digital asset shouldn’t be spent twice to different persons at the same time. Today’s cryptocurrencies operate on blockchain technology. Blockchain technology effectively deals with the double-spending problem as there is a validation procedure involved using a consensus mechanism.

Transferring funds

We can transfer vast amounts of funds to any country around the world in less than 10 minutes. There is no limit to the transaction. The transaction fees are low when we compare with the traditional transaction charges. It takes around 3 to 5 days when we transact using a fiat currency of that size. Taking this much time is not efficient in this age of digital, and cryptocurrencies came to the rescue.

Decentralized network

Cryptocurrencies are generated in a decentralized network without any central bank controlling the system. Since there is no one controlling it, the currency will be stable if the credibility and maintenance of the system are good.

Bottom line

It is time for us to at least try using these cryptocurrencies. Traditional currencies are not going anywhere in the near future, but some credible cryptos are already proving their purpose by solving the problems that fiat currencies couldn’t solve.  Governments have also recognized the huge benefits that these currencies offer and are making or changing laws to favor cryptocurrencies. Not many governments have regulated these digital tokens yet, but the move has started.

Categories
Forex Market

Everything You Need To Know About The Forex Currency Pairs

In the previous articles, we have discussed the overview of the Forex industry as a whole. In this article, let us understand in detail about the currency pairs which Forex is fundamentally about.

How does it work? 

A currency pair is a code representing the interaction of two different currencies. In that pair, the first currency is known as the Base currency, and the second one is called the Quote currency. When you are buying a currency pair, you are essentially buying the base currency and selling the quote currency. It is vice-versa for selling.

When you see a currency quoted as 1.32., it means you can exchange 1 unit of base currency for 1.32 units of the quote/counter currency. When the value of currency changes, it is always relative to another currency. If the value of GBP/USD changes from 1.26345 to 1.26460 the next day, it means that the Pound has appreciated relative to U.S. dollar or U.S. dollar has depreciated relative to Pound as it will cost more USD to purchase 1 Pound.

What are the major currency pairs?

The most liquid currency pairs are known as major currency pairs. These are the pairs where USD is involved either as a quote currency or base currency. Some of the most popular currency pairs include EUR/USD, USD/JPY, GBP/USD, USD/CHF, and USD/CAD. They represent some of the largest economies of the world and are traded in high volumes. These currencies also have low spreads, which is good for traders.

Minor or cross-currency pairs

Cross-currency pairs are nothing but the crosses of major currencies. They do not include the USD in them. Some of the popular cross-currency pairs include EUR/GBP, EUR/JPY, and EUR/CHF. Even though the trading volume of these pairs is significantly low compared to the major currency pairs, they do contribute with a large amount of volume to the Forex market. Let’s understand more about the volatilities and preferences of these minor currencies.

  • Predicting the EUR/GBP currency pair is most difficult compared to other currencies.
  • Traders prefer trading EUR/JPY as they believe it is easier to forecast, thus making it a popular cross-currency pair.
  • EUR/CHF is also popular because of the fact that the Franc is a safe-haven currency. It is traded during times of high volatility.

Here we have only discussed the EUR crosses. We recommend you to explore more cross-currency pairs and understand each of their volatilities. There is another type of currency pair known as Exotics. In this type of currency pairs, one currency is Major while the other an upcoming currency. Examples – USD/TRY & USD/MXN.

Commodity currencies

Australian dollar and New Zealand dollar are the currencies that are greatly influenced by commodity prices. The Australian dollar is greatly affected by mining commodities, beef, wool, and wheat. Aussie (AUD) is strongly influenced by China as these two countries are huge trading partners. USD/CAD is also one currency that is affected by commodities like oil, timber, and natural gas. The Canadian dollar price movement is strongly related to the U.S. economy. New Zealand, however, is heavily influenced by news release of agriculture and tourism. Along with commodities, the effect of central banks and reserve banks shouldn’t be underestimated. Changes in monetary policy from either of the country’s banks will lead to huge volatility.

The point we are trying to make here is that each of the currency pair’s price movements is influenced by some of the other external factors. As you start your journey in trading Forex markets, you will understand these influencing factors in detail.

What moves these currency pairs?

As discussed above, there a lot of independent factors that move the price of these currencies. But the fundamental factors are interest rates, economic data, and politics. Let’s understand these in detail.

Interest rates – Central banks raise or reduce interest rates to maintain financial stability. This increases demand for currencies whose interest rates are high, as investors get a higher yield on their investments.

Economic data – Economic releases are reports that give a glimpse of the nation’s economy. Relevant economic data include CPI, Non-farm payroll, GDP, Retail sales, and PMI. This data will have a positive or negative effect on that country’s currency.

Politics – Trade wars, elections, and changes in the ruling government introduce instability, which reflects in the Forex market. The decision the government’s take can boost or depreciate the economy.

Which currency pair should you trade? 

If you are new to forex, choose the currency pair which has the most liquidity. Always start with Major pairs before exploring the others. Analyze the fundamentals of a currency. If you know technical analysis, you can combine it with technical indicators to know and understand when to trade. Do not use leverage; even if you do, use appropriately so that you don’t wipe out your account. To learn more about Forex trading from the very basics, you can sign-up for our free Forex course here. Cheers!

Categories
Crypto Guides

Bitcoin – The First Scalable Cryptocurrency Ever!

In the previous article, we have discussed the evolution and properties of cryptocurrencies. Now, let’s understand Bitcoin, which is the first scalable cryptocurrency.

Introduction

It has been around 11 years since Bitcoin has come into our lives. I am saying that because everyone who knows about bitcoin, at some point, would have wondered should they invest in it or not. Some have invested and gained so much from it. I’m sure you would have heard of the term Bitcoin millionaires. Of course, some have seen losses as well. Ever since the inception of Bitcoin, there is so much talk and hype about cryptocurrencies. Some governments have even made some changes to the existing laws to support cryptocurrencies. While some governments made laws against this digital currency. It all began with one crypto, Bitcoin. Hence, it is important for us to know the evolution of Bitcoin, which is still considered as a synonym of cryptocurrency.

How it all began?

It all began when a pseudonymous person called Satoshi Nakamoto released a whitepaper on October 31, 2008. The white paper described the blockchain technology and the Bitcoin cryptocurrency. When the technologists read the document, many thought it is ground-breaking technology and wanted to see it working in rea, while some wanted to explore the properties of blockchain other than cryptocurrencies. Nakamoto not only released the white paper but also mined the first block of the Bitcoin network in Jan 2009. Thus, he began the journey of Bitcoin.

The first-ever recorded transaction

The first recorded purchase transaction using Bitcoin happened in May 2010. Laszlo Hanyecz, a computer programmer,  paid 10,000 BTC for 2 Pizzas, and it was merely $25 back then. At today’s price of the bitcoin, the pizzas cost around $80 million. Cryptonizers celebrate that day as Bitcoin Pizza day to date.

Price history

In July 2010, the price of one Bitcoin was at $0.08. In February of 2011, the price came up to $1. Then it gradually started increasing as more and more people came to know of it and started investing. By June 2011, the price surged to $11. By April 2013, the bitcoin achieved a three-digit rate of $266. By November, the same year, it reached a four-digit figure of $1242.

Picture Credits – bitcoinwiki.org

From there on, there have been fluctuations depending on the demand and various rumors about the coin. In 2017 December, the price rose to $19,783.06, the highest ever. As of October 2019, the price of one Bitcoin is $8,300.

Birth of new coins from Bitcoin

Bitcoin Cash and Bitcoin Gold are two coins forked from the Bitcoin blockchain. These are some of the major altcoins (alternate coins) in today’s cryptocurrency market. Bitcoin inspired the birth of many other cryptocurrencies. We can say that these altcoins emerged only after Bitcoin proved the market potential. Ethereum, Litecoin, XRP are some of the examples.

Emergence of the cryptocurrency market

Cryptocurrency exchanges started their operations after the rise of new cryptos in the market. Bitcoinmarket.com is the first exchange ever. However, the exchange is defunct now. In July of the same year, Mt.Gox was launched as well. Around 2013 and in early 2014, nearly 75% of the Bitcoins transaction across the world happened through Mt.Gox. In 2014, they had to liquidate the funds because nearly 850,000 bitcoins were stolen from the exchange. This is the biggest disaster in Bitcoin history ever.

Bottom line

At present, everything in our life is getting digitalized. So why not the currency we use? Bitcoin is that new-age digital currency which has a massive potential to transform the currency space. It is not too much to say that it has achieved the same already. Let’s see what more wonders this crypto can create in the near future. Stay tuned for more exciting and engaging content. Cheers!

Categories
Forex Course

5. How Large & Liquid Is The Forex Market?

When compared to other markets like the stock and commodity market, the foreign exchange market is the largest in the world in terms of size and liquidity. In this lesson, we shall go over some insights on the size and liquidity of the forex market.

Where is the Forex market headquartered?

The stock markets across the world have different central exchanges where all the transactions are processed. But, in the case of the forex market, there is no central exchange (physical counter) where the transactions can be processed. In fact, this market runs electronically, connected by a network of banks. This, in short, is called an interbank market or an over-the-counter (OTC) market. Hence, this enables traders to trade in the forex market from anywhere in the world. Also, this is one of the reasons for its high volume of trading.

Forex market’s volume

The amount of money traded in the forex market is humongous. Being the most traded market, the value of it reaches up to $3 trillion. The number is made up of all the types of transactions performed in the market. The amount of different transactions is listed as follows:

$1,005 billion comes from spot transactions

$1,714 billion is added from forex swaps

$362 billion accounts for outright forwards

$129 billion for estimated gaps

Currency distribution in the Forex market

There are about seven currencies on which most transactions take place. Out of these currencies, the US Dollar dominates with around 85% of all the operations in the forex market. Next up in the line stands EUR, which is then followed by JPY and GBP. A graphical representation for the same is given below.

Here, the sum of all the variables totals to 200%, as currencies are traded in pairs.

What are the Foreign Exchange Reserves?

They are the assets that comprise banknotes, bonds, deposits, etc. The central bank of a country holds these with two primary purposes. One to maintain the balance payments of a country and the second is to control the confidence in financial markets. These reserves can be held in more than one currency.

According to the International Monetary Fund (IMF), 64% of the world’s forex reserves are made up of the US Dollar. And after USD comes GBP, JPY, and EUR comprising of 4%, 4%, and 2% of the world’s FX reserves, respectively.

Liquidity of the Forex market

Liquidity is simply the possibility to square off a position smooth and quick without causing the market to make a drastic move. In simple terms, liquidity is the level of supply and demand in the market. So, when there are large numbers of buyers and sellers in the market, we can call this market to be highly liquid.

With respect to the Forex market, it is the most liquid market in the world. This implies that the forex market constitutes a large number of participants (buyers and sellers). With high liquidity, one can liquidate their positions much faster and at their quoted price. Moreover, high liquidity causes the prices to move smoothly, gradually, and in small steps. Hence, this even leads to more consistency in the quoting of prices.

Below is the chart of EUR/USD on the 5-minute timeframe. We can see that the prices move smoothly in spite of being in a small timeframe.

Below is the chart of a small-cap stock in the US. Here, we can see that the prices are not moving in a flow, and there are gaps between the prices. And this is solely due to the lack of liquidity in the market.

That’s about the liquidity of the Forex market. We hope you had a good read. Check your learnings by answering the below quiz.

[wp_quiz id=”42489″]
Categories
Crypto Guides

The Evolution & Properties Of Cryptocurrency!

Introduction

We could say that the type of currencies we use today is employed as a medium of exchange for goods and services. In the olden days, transactions used to happen in the barter system. Barter system implies that goods are exchanged for goods. With this system, it took time to trade products and services as it is challenging to find people to accept their goods for the goods they want. Hence came the era of coins in gold or some other metal with a denomination printed on it. As some standard is associated with it, the trading of goods and services has become easy. Then came the paper notes making it easy to carry large amounts of cash, which was not possible with coins. We are this point where these paper notes are known as currencies. Each country has its respective currency (The US Dollar, Japanese Yen, Indian Rupee, etc.)

Evolution Of Cryptocurrency

Even though the purpose of the money didn’t change much, the way we use it kept changing throughout history. Banks came into existence to ease out the financial transactions. They played a significant role in global trade in terms of transferring money across different countries, thus improving the economy of each country. Physically minted cash would be less than 10% of the entire currency in the world. Remaining exists in the form of virtual currency as electronic money in online accounts. Central banks in each country control these accounts. Since power is vested within these financial institutions, the entire banking process is centralized. Hence the necessity of an alternative currency has emerged. These are termed as cryptocurrencies, and the primary purpose of their invention is to create a decentralized currency system where the entire network is not controlled by anyone at all.

What Are Cryptocurrencies?

Cryptocurrencies are digital or virtual currencies where cryptographic techniques are used to generate the units of currency and monitor the transfer of funds without a central bank. Thus, making it a decentralized way of producing and using money.

Cryptocurrencies are generated by using a blockchain platform that uses distributed ledger technology. The first-ever cryptocurrency that has come into existence is The Bitcoin in 2009, though the white paper related to this concept was released in October of 2008. Thus, 2009 signals the beginning of the era of cryptocurrency. There has been no looking back since then.

Properties Of Cryptocurrency

The three fundamental features of cryptocurrencies are Trustlessness, Immutability, and Decentralization. Let us understand these properties using the example of Bitcoin.

Trustless

Though the word trustless creates confusion to the readers, it merely means there is no need not trust anyone or anything to send or accept a cryptocurrency. If we say an environment is trustless, that means there is no need for you to trust anyone in the network. The Bitcoin network is a trustless environment. There was no currency before Bitcoin that was not monitored by a central bank. Every node in the blockchain network has a copy of the ledger; thus, there is no need to trust any authority.

Immutability

Immutability means that it cannot be undone. It is highly improbable to rewrite the history of the transactions in Bitcoin blockchain. Since all the transactions are recorded in the blockchain, the cryptographic techniques make it highly impossible to change any transactions. If any fraudulent transactions happen in the case of our bank accounts, the banks have the authority to change the transaction. But in the case of cryptocurrency, it is not possible. Thus, removing the concept of centralization and trust from these digital currencies.

Decentralization

It is the keyword when it comes to cryptocurrencies. Decentralization offers different types of tolerances. Tolerance concerning the infrastructure, component failures, hacking, and collusions. In the Bitcoin network, the ledger where the transactions are recorded is distributed among every node in the network. Any component failures don’t cause any problem to the functioning of the network. Hacking the blockchain is extremely difficult and a costly process. When it comes to traditional banking, individual entities can collide with each other to make profits at the expense of loss to others. This plot is not possible in the case of a cryptocurrency network, thus offering tolerance to collusion. Apart from all of these, there are many more advantages of a decentralized system over a centralized banking network.

Bottom Line

Therefore, Cryptocurrencies offer plenty of opportunities in today’s digital world, which traditional currency couldn’t provide. We will be further discussing the purpose of cryptocurrency and more properties of cryptocurrency in our upcoming articles. Stay Tuned. Cheers!

Categories
Forex Market

What Should You Know About Forex Brokers?

Introduction

In the previous article, we have discussed an overview of the financial industry. Now we know that the entire Forex market is about buying and selling of currencies. The majority of these foreign exchange transactions are done by major financial institutions and global organizations. But where do the retail traders like you and I undertake Forex trading? We do it through independent companies called brokers. In this article, let’s understand what a Forex broker is and the different types of Forex brokers existing in the market.

What is a Forex broker?

In the Forex market, buyers and sellers can be thousands of miles apart. So there needs to be a mechanism that matches their interest. This is where a Forex broker comes into the picture. A Forex broker is a platform where the buyers and sellers get to buy and sell currencies. It acts as a middleman between a trader and the market. In simple words, to find a buyer or seller for a particular currency, the broker matches your order with the respective buyer or seller. These brokers are also known as ‘liquidity providers.’

Types of Forex brokers

Even though all brokers in the Forex industry provide the same basic service, there is a difference in their functionality and mechanism. The first thing to look for with every Forex broker is whether they have a ‘dealing desk’ or not. In brokerage firms, the dealing desk refers to a team of traders who manage the broker’s inventory and hedging operations. Nowadays, most of the dealing desks consist of hundreds of traders and analysts.

Brokers that work on dealing desk operate in a closed environment wherein they set their own price rates. They fill their client orders by matching the buy and sell orders of their clients. When a broker uses a dealing desk, they are called as Market Makers.

Brokers that don’t use a dealing desk get rates from the interbank market and process their client orders by linking them directly to institutions, hedge funds, mutual funds, and other brokers. When a broker does not use a dealing desk, they are either known as ECN (Electronic Communication broker) or an STP (Straight Through Processing) broker.

Market Makers

Market Makers (MM) are called ‘dealers’ in the interbank market. They charge a variable spread instead of commission, which is why most of the time, they are accused of manipulating the spread and prices of the currency pairs. Theoretically, the spread should widen or narrow during high liquidity conditions, but MM brokers offer a fixed spread and compete based on the spread.

Electronic Communications Network (ECN) Broker

ECN brokers make their profits from spreads they charge on buy and sell rates or from fixed trade commission. The transactions here are mostly interbank. Because the spreads in the interbank markets are dynamic, ECN brokers prefer charging commissions rather than fixed spreads. This is one of the easiest ways to trade, but this requires a much higher investment capital as clients in the interbank markets only trade large lots. Therefore, trading with ECN brokers requires a minimum account balance of $1000. In addition, there is no guarantee that you will find a buyer or seller in the interbank market at your quoted price. ECN brokers sometimes won’t be able to execute orders at that price, so they issue a re-quote or simply reject the order. These are some of the limitations of ECN brokers.

Straight Through Processing (STP) brokers

Like ECN brokers, STP brokers, too, don’t have a dealing desk. But they use some of the practices of Market Maker brokers to provide flexibility to their clients. They display rates similar to the interbank market rates, and their first priority is to process trades directly in the interbank market, like an ECN broker. If the counterparty is not found, they start acting like a Market maker and match the order with their own client. The initial capital required to trade with this type of broker is relatively lesser compared to ECN brokers.

These are the different types of brokers in the market. So when you are choosing a broker, make sure to select the one that suits your trading style and capital available to trade.

Trading Platforms 

The ‘Market Makers’ provide trading platforms like Act Trader and MetaTrader since their orders are executed at the dealing desk. However, non-dealing desk type of brokers uses direct access trading platforms. They display prices directly from different liquidity providers. The platforms which are best suited for this requirement include Currenex Viking software and Level II software. The trading platform should be chosen in such a way that it suits your trading objectives. We hope this article helped you in deciding that. Let us know if you have any questions in the comments below. Cheers!

Categories
Forex Course

4 – Understanding The Mechanism In Buying And Selling Of Currency Pairs

Introduction

The mechanism of the forex market is quite different when compared with other markets like stocks and commodities. In the stock market, we essentially consider a company’s stock to trade. But in the foreign exchange market, we cannot trade a single currency. Instead, we must trade them in pairs.

In the previous lessons, we understood the meaning of base and quote currencies and also the right way to read the symbols. In this lesson, let’s explain how exactly this buying and selling happens in the Forex market.

The working principle

Before getting into the topic, let us understand a few common terms to grip the concept much better.

Long – It is a basic term in trading, which refers to the ‘buying of security.

Short Selling – This term refers to the ‘borrowing’ of security from the broker and selling it at the current market price. You can assume this to be the right opposite of long. Note that Shorting security and selling security are two different terms.

For example, let’s say you went long on a security, and now you wish to close it. To close it, you will have to ‘sell’ it. Here, you are ‘selling’ and not ‘shorting’ the security.

Now, with this on our back, let us get into the working of buying and selling currency pairs.

Going Long on a Currency Pair

When you go long on a currency pair, you actually buy the base currency, and short sell the quote currency. For example, if you go long 100,000 units on EUR/USD, you are buying 100,000 Euros and short selling 100,000 US Dollars.

Short Selling a Currency Pair

Short selling in the forex market is quite different from that of the stock market. In the forex market, when you short sell a currency pair, you will be selling the base currency and buying the quote currency. Hence, shorting in forex is the same as placing a regular sell order.

However, the main motive remains that the prices must decline from the point you executed the short position to generate a profit. For example, if you short 10,000 units of USD/CAD, you are actually selling 10,000 US Dollars and buying the same number of Canadian Dollars. Hence, here, you’re not borrowing a certain amount of currency to go short.

What next?

With the concept of the long and short sell, let us understand how to make a profit from it.

To profit from a long trade, you need the currency pair prices to increase.

To profit from a short trade, you need the currency pair prices to decline.

This also implies that, in a long trade, an increase in the base currency prices will put you in profit, and in a short trade, a decrease in the base currency prices will give you profits.

Example

Consider the current market price of USD/CHF to be 0.9850. Let’s say you went long on this currency pair. The buy/sell mechanism here is simple – you bought the USD (the base currency) and simultaneously short sold the CHF (the quote currency). Hence, to make a profit from this, you need currency pair prices to increase, which in turn means that you need the value of the base currency (USD) to increase or the value of the CHF to decrease because you’ve bought the USD.

This is how the buying and selling of currency pairs work internally. However, since all of this is managed by the broker, all you need to know is if the prices should rise or fall according to the position you took.

In the next article, we will be discussing the sheer size and liquidity of the Forex market along with the perks involved. For now, check if you can get the below questions right.

[wp_quiz id=”42315″]
Categories
Forex Course

3 – Reading & Understanding The Currency Pairs

Introduction 

From the previous lesson, we know that global currencies are traded in the Forex market. These currencies are exchanged in pairs. We also understood what Major, Minor, and Exotic pairs are. In this lesson, let’s discuss more characteristics of these currency pairs.

Out of the three types of currency pairs, the most traded type are Majors. These major pairs contribute more than 85% of the total Forex trading volume. Prices in these pairs move in tighter spreads, but they are a bit volatile during market opening hours. Major pairs are those who have USD in them. Some of the major pairs are EUR/USD, USD/JPY, GBP/USD, and USD/CHF. The other vital pairings which do not include the US dollar are known as ‘cross currencies.’ Some of these are GBP/EUR, EUR/CHF, EUR/JPY, etc.

Reading a Currency Pair

Since we are talking about currency pairs and the Forex market, it is essential to learn how to read them. Every currency has a three-letter symbol defined by the International Organization for Standardization(ISO), which is straight forward. Below is the terminology for some of the major currencies.

  • British Pound for GBP
  • US dollar for USD
  • Japanese Yen for JPY
  • Swiss Franc for CHF
  • Euro for EUR

To understand the reading of a currency pair, you need to know the meaning of base and quote currencies. The first currency in a Forex pair is called base currency, and the second one is called quote currency. As we know, trading the Forex market involves selling one currency to buy the other. For instance, we sell the base currency to buy the quote currency. Let’s say you are trading USD/CAD. USD is your base currency, and CAD is your quote currency. Here, when we are executing a sell trade on this pair, we are primarily selling USD to buy CAD. And vice-versa if you are placing a buy trade.

How much one unit of the base currency is worth against the quote currency defines the price of a pair. In the above example, if USD/CAD is trading at 1.32267, that means one US dollar is worth 1.32267 Canadian dollars.

Liquidity of Major Pairs

Liquidity in these pairs is the highest when compared to other pairs. The larger the import/export value between two nations, the more liquid the currency pair of these countries will become. EUR/USD is the most liquid pair in the world. Major currency pairs should not be confused as the best currency pairs to trade. Trading a particular currency pair depends more on strategy and market sessions. When we say ‘major,’ we mean the most actively-traded Forex pair. The six most actively-traded Forex pairs are:

  • EUR/USD
  • USD/JPY
  • GBP/USD
  • USD/CAD
  • USD/CHF
  • AUD/USD

One of the reasons behind these currencies being traded so extensively is the political and economic stability associated with these currencies. Big investors feel it is safe to park their money in such economies.

What Should You Trade?

If a currency pair has high liquidity, the volatility of that pair decreases. Currency pairs that are linked with the market openings should be our first choice. For example, it is recommended to trade the US dollar during New York open or trading the Australian dollar during Asia opening, as there will be good volatility during this time. Also, consider economic news releases, technical chart analysis, and other events while choosing the currency pair to trade. For people who have just begun their Forex trading journey, it is recommended to start trading major currency pairs before experimenting with minors and exotics. Now try answering the below questions.

[wp_quiz id=”41992″]
Categories
Forex Market

An Overview Of The Forex Trading Industry

Introduction

Some of the most relevant markets include the Stock market, Futures market, Options market, and Foreign Exchange market. All these markets provide vast trading opportunities, and out of these, Foreign Exchange AKA FOREX is one of the most popular ones. Forex is nothing but the exchange and trade of different country’s currencies. The first Forex trading market was established in Amsterdam nearly five centuries ago, and this explains the rich history of this market.

The Forex market is the largest yet most accessible market in the world. Largest because the daily trading volume of the Forex market is above $5 trillion. To put that in perspective, the average daily trading volume of the NYSE (largest stock market in the world) is just above $20 billion. By this, we can understand the enormous size of this market. Out of this $5 trillion, retail trader transactions contribute 5% to 6%, i.e., about $400 billion. The rest of the transaction volume is from large institutions and businesses.

We also mentioned accessibility because traders have thousands of retail brokers around the globe to choose from. They can start trading currencies in this market with investments starting from just $100. Forex trading is open 24 hours a day and five days a week. It doesn’t operate on weekends. On weekdays, the market doesn’t get closed at the end of each business day, like how the stock market does. Rather the trading shifts from one financial center to others. Some of the major financial centers include London, Sydney, New York, and Tokyo.

What affects the Forex market?

One of the critical factors that most of the experienced traders pay attention to is the macro-economic trend. The forex market reacts to macroeconomic data more than the stock or commodity market. In a stock market, we have companies that are affected by micro-dynamics, which are specific to that company. But that’s not the case in the Forex market. This market is affected and moderated by GDP, unemployment rates, and inflation. The currency could react positively or negatively depending on the data, but after reacting, the trend will be maintained for a long time. The significant pairs to watch during such news releases are EUR/USD, USD/JPY, GBP/USD, and USD/CHF. The rate hikes from the U.S. Federal Reserve is also closely watched by traders around the world.

The rise of algorithmic trading

Banks and financial institutions are adopting algorithmic trading systems powered by technological advancement. Technology is changing traders’ approach towards the market. There is a boom in engineered computer programs that offer new ways of creating orders with faster trade execution. The automated systems have improved speed and precision. This technology is expected to eliminate trading bias and human errors that increase the risk in a trade. Algorithmic trading improves trend analysis that greatly helps beginners in reducing losses. Due to this, traders are getting more time to analyze markets and trends.

Future of Forex market

The Forex is continuously growing. Trading currencies is still not a mainstream profession in many of the third world countries. There are still many people who aren’t aware of the fantastic opportunities this industry has to offer. One of the important goals of the brokerage firms is to get more and more people involved in pursuing trading as a serious profession.

  • Market volatility will rise as newer strategies are being released and used by traders.
  • Strict regulation in the forex market will also attract conservative traders. However, some traders search for unregulated brokers since they provide inexpensive trading services.
  • Paid systems and strategies will continue to grow among wealthy investors.
  • Trading Forex is getting easier and extremely accessible with the advent of smartphone trading applications.

Bottom line

The Forex industry has changed significantly over the years. Many efforts are being made to create a legitimate trading environment as the industry has become more dynamic and ever-changing. Major European regulators are taking serious steps to tighten control of the Forex market. Besides, they are also introducing new rules to forbid high leverage trading to protect investor’s funds.

A known fact about Forex trading is that most traders fail. It is estimated that 96% of the people end up losing. To be in the succeeding 4%, one should have a disciplined approach to the way they trade. Some of the practices include starting with low capital, managing risk, controlling emotions, and accepting failures. If you follow these rules, you are on track to becoming a successful trader.

Also, education plays an essential role for someone to succeed in their Forex trading journey. We at Forex Academy designed a course just for our readers. By taking up this free course, one can learn everything about Forex trading even if they have zero experience. You can find all of our course articles here.

Got any questions? Let us know in the comments below.

Categories
Forex Basic Strategies Forex Swing Trading

How To Trade The Infamous Turtle Soup Strategy?

In this article, we shall be covering the Turtle soup strategy by fading the Donchian channel, and Connor’s RSI strategy.

What is the Donchian Channel indicator?

The Donchian channel is an indicator that considers the high and low for N number of periods. For this particular Turtle Soup strategy, we will be setting the value of N=20, which accounts for the most recent 20 days.

This indicator works based on the highs and lows made by the market. The channel makes a stair-stepping pattern for every high or low made in a period of 20 days.

Below is a chart that shows the Donchian indicator applied to it.

From the above chart, we can clearly see that the top and bottom lines (blue lines) are moving in the form of a stair-stepping pattern representing the highs and lows over the past 20 days. Precisely, the black arrows represent the highs and lows in a look back of 20 days.

Trading the Turtle Soup Strategy

The Turtle Soup is a strategy developed by a trader and author Linda Bradford-Raschke. She published this strategy in one of her books named “Street Smarts: High Probability Short-Term Trading Strategies.” Talking about history, this strategy was taught to a set of novice traders (called the Turtles) by Richard Dennis and William Eckhardt in the 1980s. Also, this strategy is in reference to a well-known strategy called ‘Turtle Trading.’ Over the years, Linda Bradford-Raschke inverted the logic and reasoning behind this strategy and came up with a short-term trading method using this strategy.

Strategy 1: Adding confirmation to Donchian Channel breakout

This is the typical Turtle strategy.

The Turtle strategy using the Donchian channel is simple. When the market breaks above the resistance line, we can prepare to go long. Similarly, when the market goes below the support line, we can go short.

Here are some of the tips and tricks for using this indicator.

  • When the market breaks above/below the lines, make sure that the price is holding above/below it.
  • The candle that breaks the line must be quite strong.

Trading Example

Consider the below figure. Reading from the left, we can see that the market was holding at the upper line of the channel. Later, a huge green candle broke above the channel. Many would hit a buy at this moment, but we wait for a confirmation. When another candle shows a bullish sentiment as well, we can hit the buy at the point shown on the chart.

According to the original Turtle trading strategy, a stop loss of ‘two volatile units is kept,’ which is equal to n-period ATR x 2.

However, to keep it simple, you can keep the stop loss a few pips below the candle, which broke the channel.

Let’s do the converse

In the above example, we saw the typical way of trading the Turtle strategy. In this set of examples, we shall reverse the logic. That is, we will look to go long when the price breaks below the channel and short when the price breaks above the channel. Let’s consider a few examples for the same.

Buy strategy

Let’s say the market makes a 20 day low and is visible on the Donchian channel. Later, the price comes down to that low and even tries to break below it. Once the price shoots right back up to the line, we anticipate on the buy.

Rules:

  • The new 20 day low must be at least four days apart from the previous 20 day low. So, you cannot compare the low of yesterday and the low of today as the difference is just one day apart.
  • Entry must be 5-10 pips above the previous 20 day low.
  • Stop loss must be placed 1-2 pips below the low of today.
  • Aim for a take profit of 1R.

Sell strategy

The sell strategy is just the opposite of the strategy discussed for a buy. When a 20 day high is challenged for the second time having a gap of at least four days from the previous low, we can look to go short.

Rules:

  • The 20 day high must be at least four days in the past.
  • Entry must be placed 5-10 pips below the 20 day low.
  • Stop loss must be placed 1-2 pip of today’s low.
  • Aim for a take profit of 1R.

Trading examples

Buy example

Below is the chart of the EUR/USD on the Daily timeframe. Starting from the left, we can see that the market came down and made a 20 day low (indicated by the black dotted line). Now that we have the first low, we wait for the price to down to that low in more than four candles (days). And when the price spikes below the prior low and comes back up, we can hit the buy at the encircled region.

As far as the stop loss and take profit is concerned, we can keep a stop loss 2-4 pips below the low of the present candle and aim for a good 1:1 RR on this trade.

Sell example

In the below chart, the market made a 20 day high up to the black dotted line. Later, the price goes above the previous 20 days high yet again. Here, the price holds above the line and then drops below the next candle. So, once it’s below by 5-10 pips from the previous 20 days high, we can go short. And the stop loss and take profit are self-explanatory.

Conclusion

With no disrespect to the turtle trading strategy, we can conclude that this strategy can be used in both ways. This strategy is backtested and proven by a number of experienced traders. Try this strategy in your trading activities and let us know if you have any questions in the comments below. Happy Trading!

Categories
Forex Course

2 – Preface To The Forex Market

Introduction

Forex AKA Foreign exchange is the largest market in the world where all the global currencies are traded. It can also be considered as a place where individuals, companies, and banks convert one currency into another. The entire Forex market is decentralized and is maintained by the banks across the globe. On average, the daily trading volume of the whole Forex market is more than $5 trillion. This explains the sheer size and liquidity of this market. Forex market is an essential part of the global economy and is active 24/5 (From Monday to Friday)

The Purpose

Typically, the exchange of goods and services happens for money, and this money is nothing but currency. The respective country’s governments determine the value of that currency. Hence the value of one country’s currency is never equal to that of another. This is the reason why we need foreign exchange to exchange one country’s currency to others. Forex market is essential for any of the global imports/exports to happen, for any employer who needs to pay salaries to their overseas employees, for a tourist who is traveling abroad, etc.

Forex trading

It refers to the buying and selling of currencies that belong to different countries. In Forex trading, the buying and selling of currencies happen at the same time. That is, if a trader is trading EURUSD pair, he/she is essentially selling the USD he has in order to buy Euros. Traders make a profit when they sell a currency at a higher price than the cost they paid to buy that particular currency. This entire process was complicated even a decade ago. But now, with the advent of technology, anyone can start trading by using a lot of online trading systems.

Currency Pairs

As discussed above, the buying and selling of currencies happen in pairs. There are three types of Forex currency pairs. They are Majors, Minors, and Exotics.

Major currency pairs are those where the USD is involved. These are the most frequently traded pairs in the market, and they make up to ~85% of the Forex transactions that happen in a day.

Examples: EUR/USD, USD/JPY, GBP/USD etc.

Minor currency pairs are those that don’t contain USD. They are also known as cross pairs. Euro, Pound, and Yen are the most popular currencies that make up the minor currency pairs.

Examples: EUR/CHF, AUD/JPY, GBP/CAD etc.

Exotic pairs are the ones where one is a major currency, and the other is a small or emerging currency.

Examples: USD/PLN, GBP/MXN, EUR/CZK etc.

Types of Forex markets

Spot market – The physical exchange of the currency pair takes place at the point of trade, i.e., as soon as the price is fixed between buyer and seller. The transaction is settled on the spot or at least within a short period of time.

Forward market – Here, a contract is made between the buyer and seller, where they agree upon a price to exchange the currency pair. This contract will be settled at a date in the future or within a range of future dates.

Futures market – Even in this type of market, a contract is fixed between the buyer and seller. A price is set on a future date delivery. The difference between Forward and Futures market is that in the latter, the contract is legally bonded between the parties.

That’s about the introduction to the Forex market. We hope you had a good read. In the next article, we will talk about some important Forex terms and phrases. Now, let’s see if you can get the below questions right.

[wp_quiz id=”41271″]
Categories
Forex Course

Introduction To The ‘Ultimate Forex Course’ By The Forex Academy!

At Forex Academy, we give utmost importance to education. To be successful, you need to learn before you Earn. So for that same purpose, we have designed a proprietory course helped by industry experts. This extensive course will cover almost everything one needs to know about the Forex market. All relevant aspects of the trading business will be discussed here, starting right from the fundaments to the advanced trading concepts. We will be publishing one article per day so that it will be a continuous learning process. And guess what? The curse is entirely free for our readers.

Introduction To The Course

In this one-of-a-kind course, we will explain everything you need to know about Forex trading. The Forex market has evolved rapidly in recent times. It is not the same that you would have seen or heard a decade ago. The fundamentals are changing, psychology is changing, and complexity has increased. Technology not available in the 90s has now become robust and is being used extensively by traders and banks. As retail traders, we should prepare as best as possible to meet these global changes.

We have created this course, keeping in mind the rapid changes happening in the forex market. You need to use a structural method of learning, which is what we have done. Education shouldn’t be in bits and pieces, this will only create confusion, and you cannot gain anything from that knowledge. You will gain an insight into fundamental and technical expertise and how you can use them together to make the best trades. We have compiled this information from the best sources. Most importantly, the course contents have been written based on the personal experience of the writers. Forex.Academy is the right place to start for any person looking to start his trading career.

Why should you take up this course?

If you want to achieve your investment goals, this course is for you. Trading is not an easy game. It requires a lot of hard work and dedication. This journey begins with learning, and learning starts here. This course is a complete package for all the aspiring traders. Also, experienced traders who are willing to expand their knowledge must try this course. The articles are more reader-friendly, where topics are explained in simple language. The most complex strategies are described in the easiest way possible. Without having the right knowledge, it is impossible to succeed in trading.

Structure of the course

The course is divided into 37 chapters which comprise of 350+ articles, where a wide range of topics are covered. The chronological order of topics is in such a manner that every chapter is linked to the next. We have made sure that it does not lead to confusion at any point. You will find information on fundamentals, technical analysis, and price action. Market psychology is one such topic, which has been written with a lot of attention. And you too, should follow these principles to gain control over your mind.

Keep track of your learning with the quizzes

At the end of each article, we have included a quiz that will test your understanding of the topic. To be confident about what you have read, try to answer all of them correctly. If you are unable to answer, that means you need to reread the article. Rereading the article will clear all your doubts and make you an expert. Once you got all the answers right, you are ready to go ahead to the next section.

What will you learn by the end of this course?

By the time you reach the end of the course, you will be halfway through your trading journey. The only thing left for you to do is to practice the trading strategies discussed along the course. You will have all the knowledge you need to be a successful trader. See you on the course.

All the best! Happy Learning!