Categories
Forex Basic Strategies

Trading The Most Profitable Candlestick Pattern With Stochastic Indicator

Introduction

Throughout the years, many professional traders and chartists spent thousands of hours in front of their screens and have invented hundreds of candlestick patterns that show in the market. Some of these patterns work very well, and some failed miserably. A lot of traders believe that pattern trading doesn’t work. But it is just a myth. Pattern trading does work if we use it in conjunction with other credible trading tools.

Most of the novice traders make the mistake of treating A candlestick pattern as a trading signal. They need to understand that the patterns alone do not hold enough power to reverse the trend of the market. Most of the candlestick patterns are defined by using the last three to four candlesticks alone. Also, most importantly, they ignore the price action context.

This is the reason why we always urge our readers to combines candlestick patterns with other trading tools like credible indicators or oscillators. In this article, we will be sharing one of the most profitable trading strategies that we have ever come across. It involves a candlestick pattern and a technical indicator.

Engulfing Pattern + Stochastic Indicator

After extensive research and backtesting, we found that the Engulfing Pattern is the most profitable Pattern when confirmed and traded with the Stochastic Indicator. Before going right into the strategy, let’s talk about the Stochastic Indicator and Engulfing Pattern in the interest of novice traders who have never heard of these things before.

Stochastic Indicator

George Lane developed the Stochastic Indicator in the Late 1950s. It is one of the most prominent indicators in the industry, and it has been identifying credible signals consistently in all the types of markets from the past 60+ years. The Stochastic is an oscillator, and it changes its direction even before the price action. It measures the relationship between the underlying asset’s closing price and its price range over a specific period of time. Just like other indicators, stochastic doesn’t follow the volume and price. Instead, it follows the momentum and speed of the price to identify the overbought and oversold areas.

Engulfing Pattern

Engulfing is one of the most prominent candlestick patterns in the market. This Pattern frequently appears in the Forex market than the stock or futures market. There are two types of Engulfing Patterns in the market – Bullish Engulfing Pattern & Bearish Engulfing Pattern. Engulfing is either a bullish or bearish reversal pattern, and it prints at the end of any prevailing trend.

Bullish and Bearish Engulfing Patterns

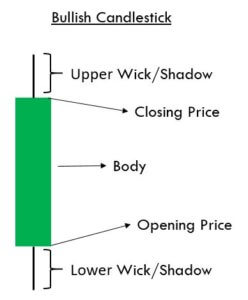
The Bullish Engulfing Pattern always appears in a downtrend. It is a three candle pattern. The first candle is Red; the color of the second candle doesn’t matter. Most of the time, the second candle is a Doji candle. The third candle is super important as it must be Green in color for the pattern confirmation. Also, it must close above the first Red candle.

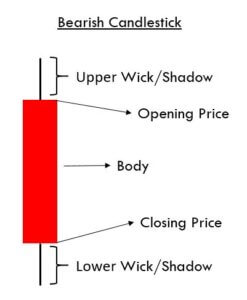
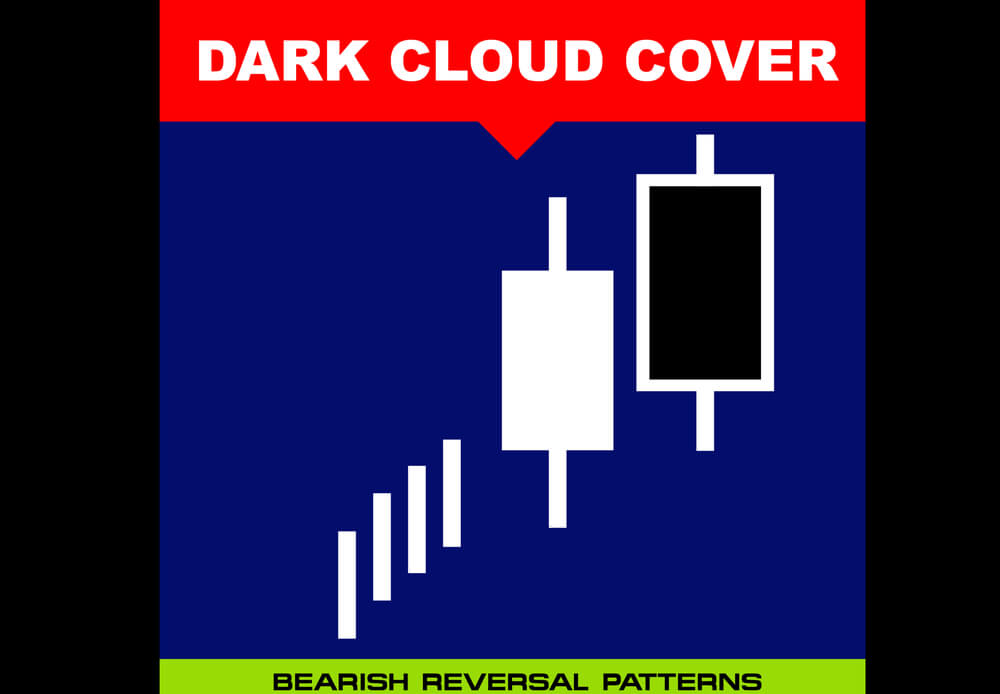
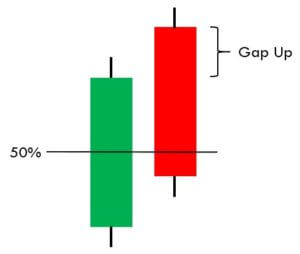
Conversely, the Bearish Engulfing Pattern appears in an uptrend, and it indicates the bearish reversal. The first candle is Green in color, and that suggests the uptrend is still ongoing. The second candle is Doji, and the color doesn’t matter much. The third one is the decision making candle, which must be Red in color. This indicates the buyers not having enough power to lead the market.

Trading Strategy

Buy Example

This strategy works very well in all the timeframes. So irrespective of you being an intraday trader, swing trader, or an investor, you can still use this strategy. If you are a 60-minute trader, only trade with the current timeframe trend. Adding additional timeframes to this strategy often creates confusion, and as a result, it leads to wrong decision making. The strategy is as follows:

  • The very first step is to find a downtrend in any underlying security.
  • With a bullish view, look for a Bullish Engulfing Pattern.
  • Then apply the Stochastic Indicator on to the charts
  • To take a trade, the Stochastic must be in the oversold area. If the Stochastic is at the overbought area and you see a Bullish Engulfing Pattern, do not take the trade.

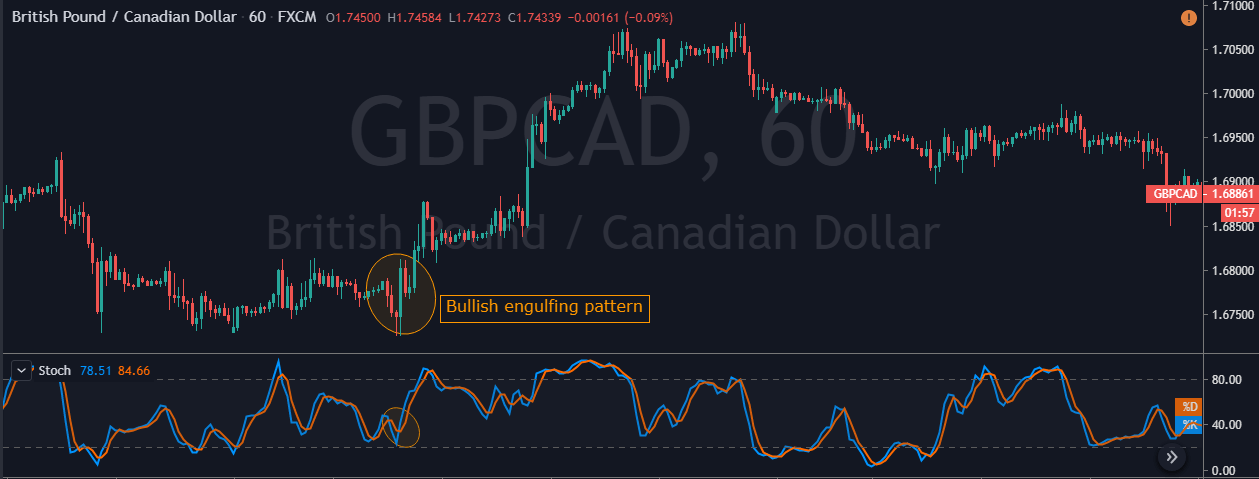
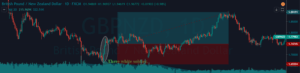
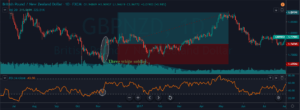
In the below GBP/CAD Forex chart the bottom panel shows the Stochastic Indicator. We can see the market was in an overall downtrend. At the end of the downtrend, we can notice the market printing the Bullish Engulfing Pattern. We can also see the crossover of the stochastic indicator at the same time.

This shows that the sellers are exhausted and buyers gaining control in this pair. If at all you are trade the Engulfing patterns alone, make sure to wait for two to three confirmation candles after the Pattern to enter the trade. Here, in our case, there is no need to wait for the next two-three candles as Stochastic confirms the Bullish Engulfing Pattern’s signal. Also, if we would have placed the Take Profit accurately, the winning pips in this trade would be huge. Hence we call this the most profitable candlestick pattern.

Sell Example

  • Firstly, check if the market is in an uptrend.
  • With a bearish view, look for the Bearish Engulfing Pattern.
  • The third step is that the Stochastic must be in the overbought area.
  • If the Stochastic is at the oversold area and market prints a Bearish Engulfing pattern do not take the trade.

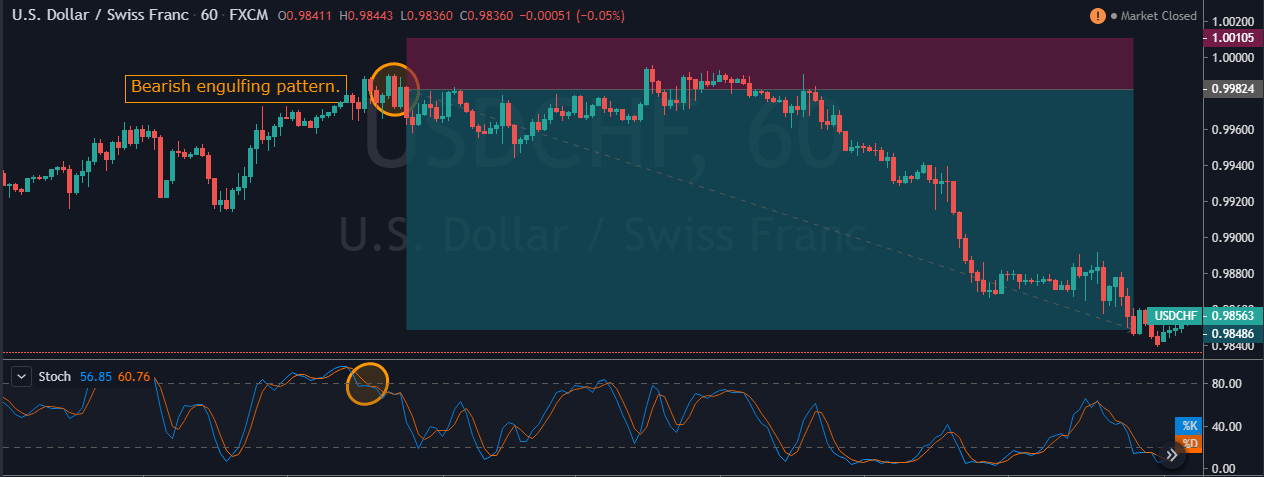
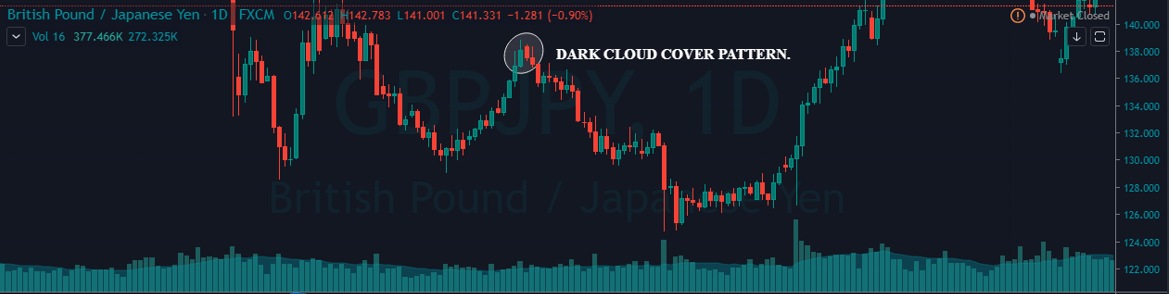
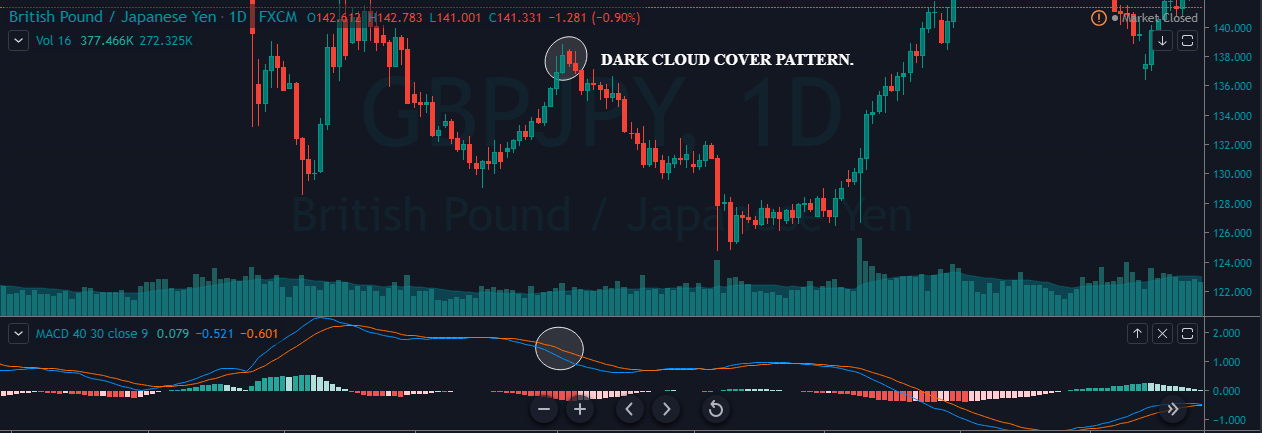
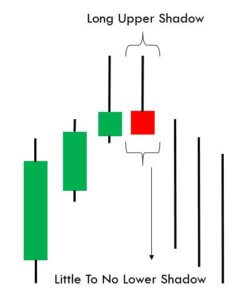
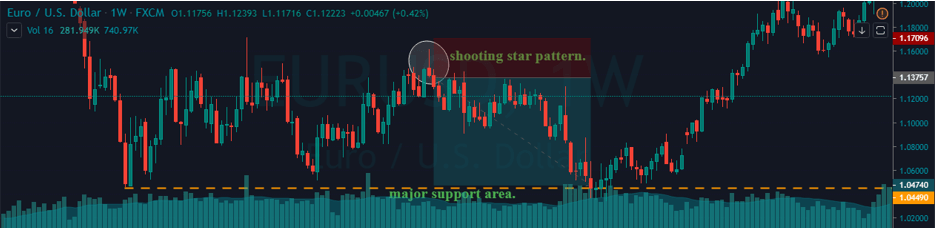
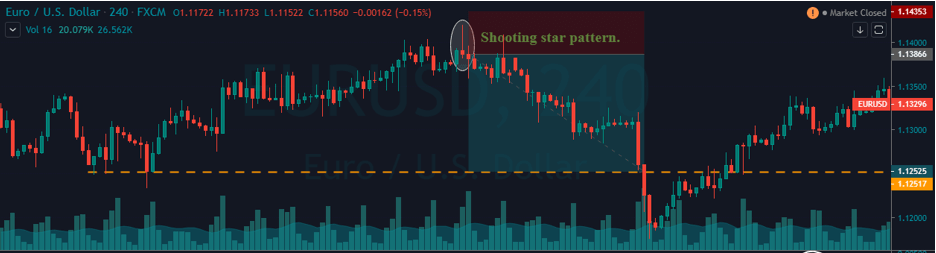
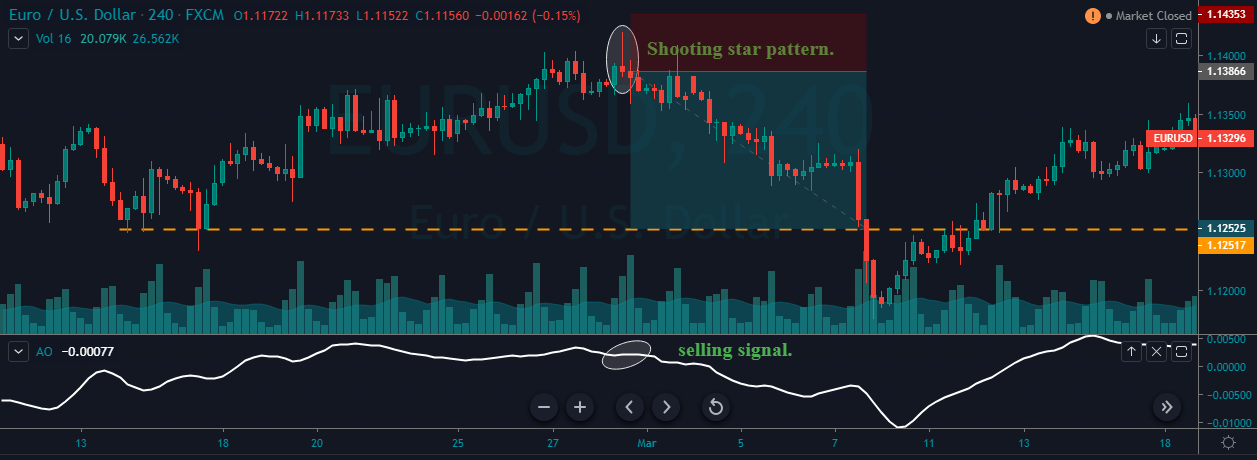
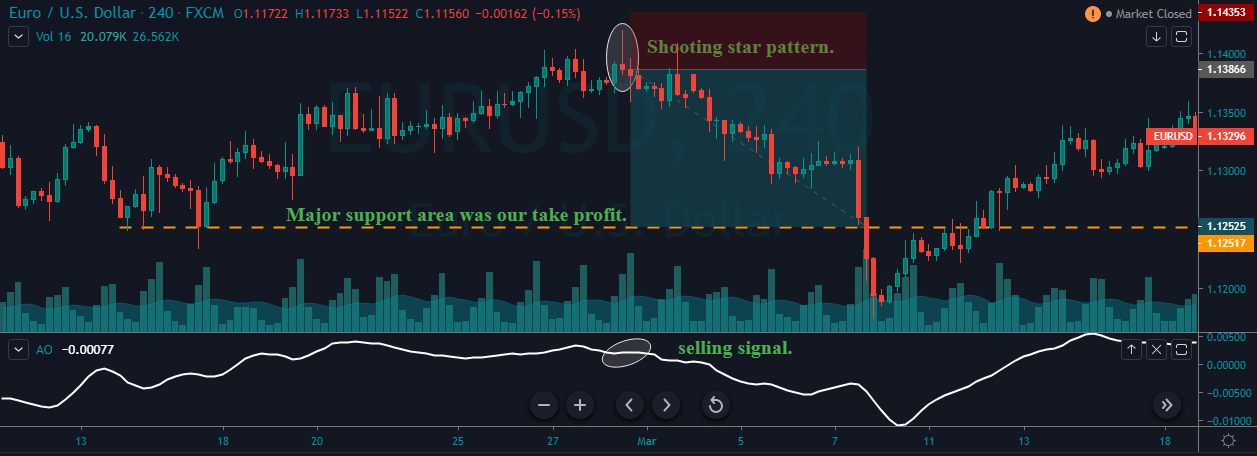
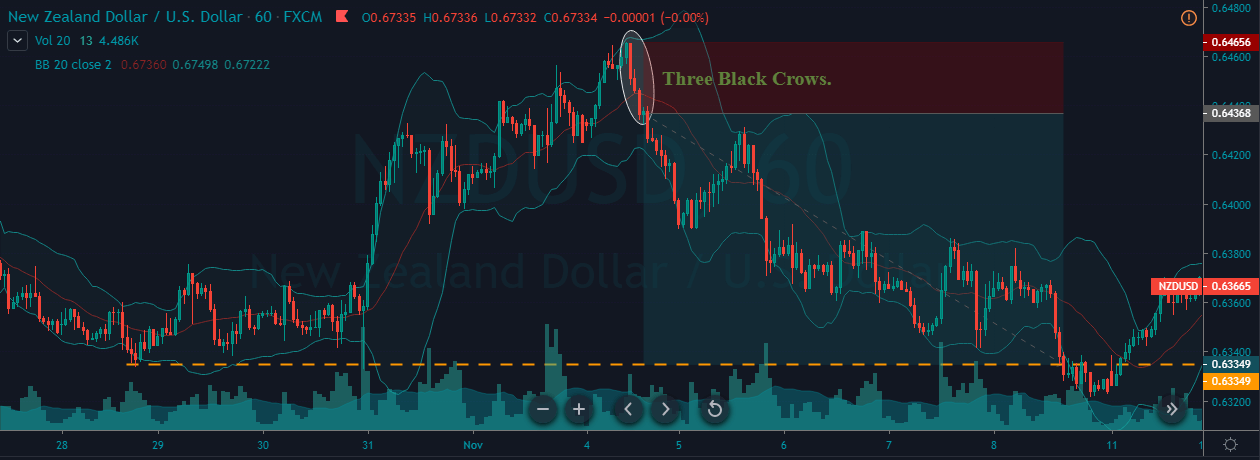
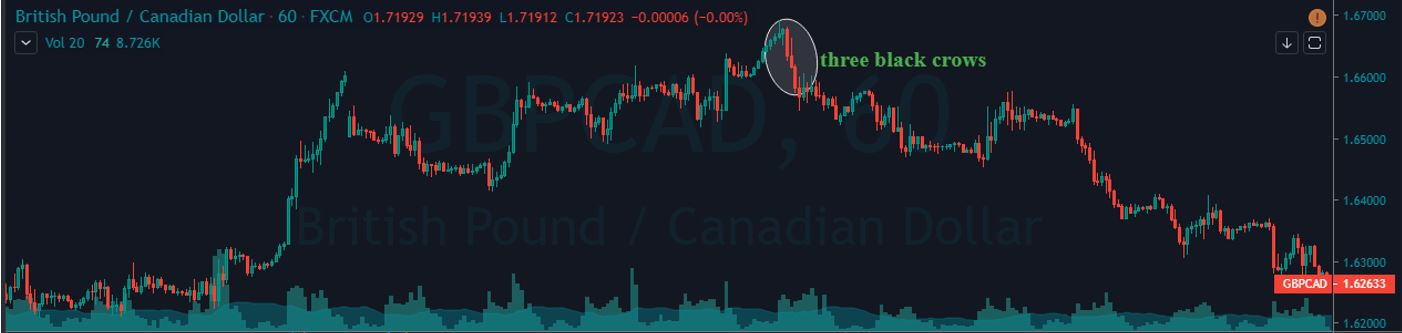
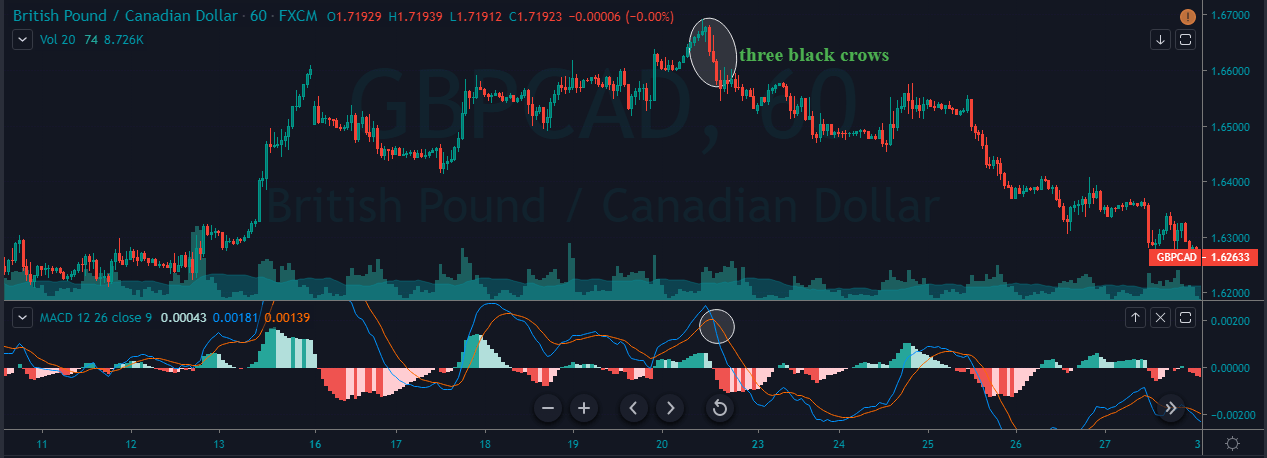
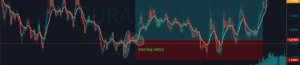
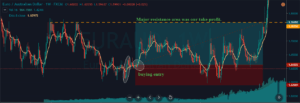
In the below USD/CHF Forex pair, the overall market was in an uptrend. When the market turned sideways, it has printed the Bearish Engulfing Pattern. We can also see the Stochastic Indicator in the overbought area. Hence this is a clear indication of Sell trade in this pair. After the signal, price action turned sideways for a longer period. Here, a lot of amateur traders exit their positions if the price takes too long to respond.

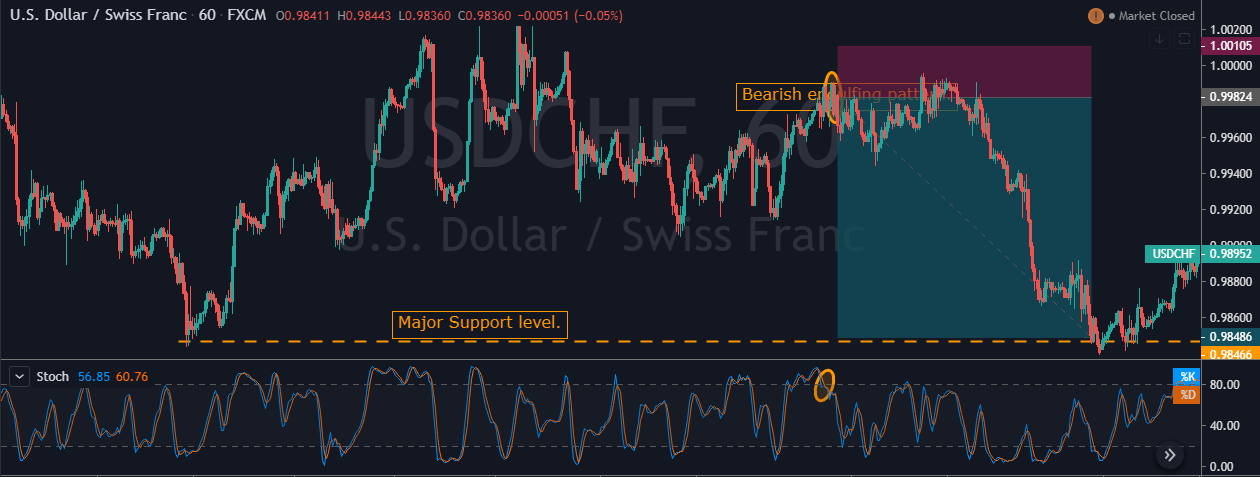
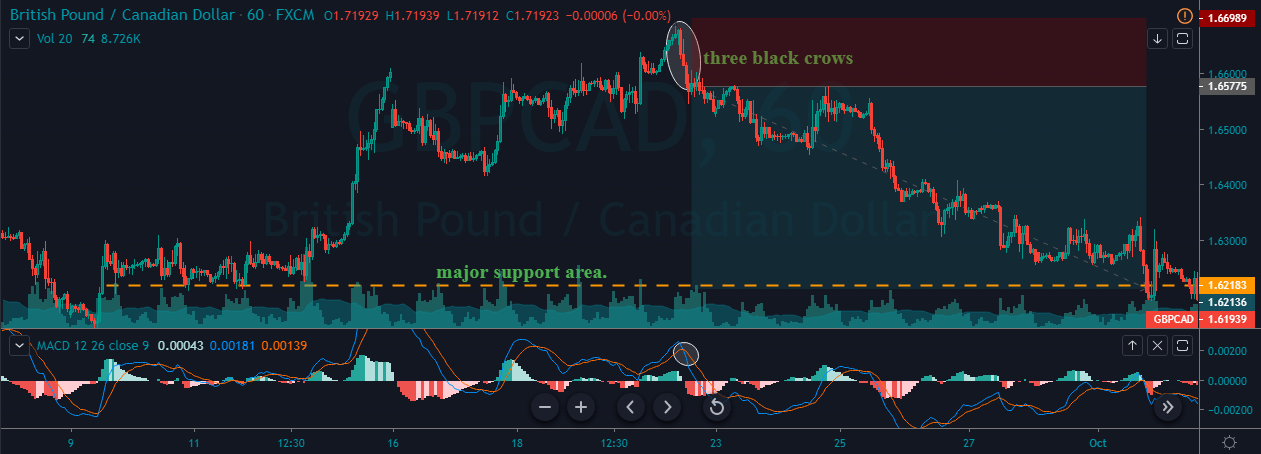
But we suggest you have faith and only exit your trades when it hits the stop loss. In our case, we can see the price action holding for sometimes, and when it rolls over, it gave stronger moves. In the below image, we can see that after holding sideways, price action dropped very hard, and we booked full positions at the major support area.

Bottom line

Engulfing Pattern is quite popular, and one of the most profitable patterns that exist in the industry. It often provides good risk-reward ratio trades. When we master the combination of Engulfing Patterns and the Stochastic Indicator, we can easily take our trading to a whole next level. Combining these two technical tools is a sound approach, as they quickly help us in filtering low probability trades. This strategy works well in both ranging market conditions and trending/dying market conditions.

We hope you find this information useful. Test this strategy in a demo account before applying it to the live markets. Cheers!

Categories
Forex Course

50 – Basic Anatomy Of A Candlestick Chart

Introduction

In the previous article, we have discussed the history, introduction, advantages, and disadvantages of using candlestick charts. Now, in this lesson, we will discuss how to read a typical candlestick chart.

Every candlestick has a central portion which is referred to as the body of the candlestick. It shows the distance between the opening price and the closing price of the security that is being traded. The faint line between the top of the body and the high of the trading period is the upper shadow. Likewise, the thin line between the low of the body and the low of the trading period is known as the lower shadow.

The chart below is made up of lines going from top to bottom. These lines are known as candles. This vertical axis of this chart shows the price, whereas the horizontal axis shows the time.

(Chart Taken From Trading View)

Each of the candles in the above chart gives us four pieces of information.

Candlesticks always refer to the information for a specific unit of time. For example, in a daily chart, each candle represents one single trading day. Every single candle is comprised of the open, close, high, and low for that given trading period. The horizontal axis of the above chart can be used to know which day corresponds to which candlestick. Almost every candle has a wick (also known as shadow) that goes outside the body of the candle. They represent the highest and lowest price of a security during that period.


The color of the candle is the essential aspect of any candle. It determines if the opening price of a security was higher or lower than the closing price of a security. If the candle is Red, it is known as a bearish candle. Always remember that the opening price is higher than the closing price in a bearish candle. Contrarily, if the candle is Green in color, it is known as a bullish candle, and that means that the opening price is lower than the closing price.

Market Emotions & Candlesticks

The names given to candlestick patterns are a colorful way to describe the emotional sentiment of the market. When we hear words like ‘dark-cloud cover’ or ‘hanging-man,’ they easily indicate the unhealthy state of the market. We are not saying they provide proper trading signals, but they clearly indicate the negative market state.

Without even knowing the technicalities of these patterns, we get an idea of where the market is heading to just by hearing their names. For instance, consider the names like ‘morning star’ & ‘evening star’ candlestick patterns. The morning star essentially implies the bullish state of the market as the appearance of the morning star is just before the sunrise. Likewise, the evening star indicates a bearish signal because it comes out just before the sunset.

The other emotional price point that should be noted is the closing of any candle. If you recall the concept of Margin calls from brokers, they are based on the close of the candle alone. Thus we can expect emotional involvement when the market closes.

That’s about the anatomy of candlesticks. In the upcoming articles, we will be discussing many of such amazing candlestick patterns which are sure going to be very interesting.

[wp_quiz id=”59661″]
Categories
Forex Assets

Fundamentals Of CAD/CHF Forex Currency Pair

Introduction

CAD/CHF is a currency pair where two currencies, namely, the Canadian dollar and the Swiss franc, are involved. It is a cross-currency pair. Here, CAD is called the based currency, and CHF is called the quote currency.

Understanding CAD/CHF

The current market price of CADCHF tells the value of CHF equivalent to one CAD. It is represented as 1 CAD per X CHF. For example, if the value of CADCHF in the market is 0.7372, then one must pay 0.7372 Swiss francs to buy one Canadian dollar.

Spread

In simple terms, the spread is the difference between the bid price and the ask price set by the brokers. It is not a fixed value and differs from time to time and broker to broker. It also varies based on the type of execution model.

ECN: 1 | STP: 2

Fees

The fee is the commission that is levied by the broker on each trade a trader takes. This, too, like the spread, differs from broker to broker and the type of their execution model. Fee on ECN accounts is 6-10 pips, while it is nil on STP accounts.

Slippage

Slippage is the difference between the trader’s executed price and the price he actually received from the broker. There is always this difference due to the volatility of the market and the broker’s trade execution speed. Note that slippage only happens on market orders.

Trading Range in CAD/CHF

Apart from analyzing the direction of the market, one must predetermine their risk and reward based on the volatility and the timeframe. Knowing how much a trader will gain or lose in a given time frame is a vital trade management tool. And below is a table through which one can determine their profit/loss that can be made in a specified timeframe. For example, the average pip movement on the 1H timeframe is 6.8. So, a trader can expect to be in a profit of $68.34 or in a loss of the same amount.

Procedure to assess Pip Ranges

  1. Add the ATR indicator to your chart
  2. Set the period to 1
  3. Add a 200-period SMA to this indicator
  4. Shrink the chart so you can assess a large time period
  5. Select your desired timeframe
  6. Measure the floor level and set this value as the min
  7. Measure the level of the 200-period SMA and set this as the average
  8. Measure the peak levels and set this as Max.

CAD/CHF Cost as a Percent of the Trading Range

An application to the above volatility table is to find the cost differences on trades by considering the volatility and the total cost on a trade. Below is the table that illustrates the variation in cost on a trade, in terms of percentage. The comprehension of it is discussed in the subsequent topic.

ECN Model Account

Spread = 1 | Slippage = 2 |Trading fee = 1

Total cost = Slippage + Spread + Trading Fee = 2 + 1 + 1 = 4

STP Model Account

Spread = 2 | Slippage = 2 | Trading fee = 0

Total cost = Slippage + Spread + Trading Fee = 2 + 2 + 0 = 2

The Ideal way to trade the CAD/CHF

The higher the magnitude of the percentage, the higher is the cost of the trade.

The values in the table are least in the min column and highest in the max column. This simply means that the costs are high when the volatility of the market is low and vice versa.

In the average column, the values are not as low as in the max column, and not as high as in the max column. The volatility here is moderate too. Hence, this becomes our ideal time of the day to trade in the market.

To sum it up, one must trade during those times of the day when the volatility is more or less near the average values. This will ensure decent volatility as well as minimal costs.

There is another simple technique to reduce costs on trade. When trades are executed using limit order instead of market orders, the slippage becomes nil. So, this brings down the total cost of the trade by a significant value.

Categories
Forex Course

49. Quick History & Introduction To Japanese Candlesticks

What are Candlestick Charts?

A candlestick chart is simply a way of depicting the price moment’s information. Since these chats are very famous, they are available on almost every trading platform. Candlestick charts were first developed by a Japanese rice trader Sokyu Honma in the late 17th century. He is known as the father of candlesticks. Yes, it has been more than 250 years since this chart has been devised and yet they are so relevant even today.

Sokyu Honma – Father of Candlesticks

(Photo Credits – Alchetron)

Japanese are huge technical traders. They use a combination of candlestick techniques & western charts to analyze the market. The primary advantage of a candlestick chart is that it identifies the underlying psychology of traders in the market. This feature differentiates candlesticks from the other chart types we know today.

Have you come across terminologies like ‘hanging-man,’ ‘dark-cloud,’ and ‘evening-star’ but not sure what they are? Good. In the first part of this course lessons, we will be discussing everything about candlesticks and its patterns. We will also discuss how to use these charts & patterns to make profitable trades, as it will open a new way of analysis for you and show how Japanese candlesticks can enhance your trading performance.

Why do most of the traders use candlestick charts? 

There is a great interest in candlesticks by top traders. There are many reasons for that, and few of them are listed below:

🕯️ Candlestick charts are flexible. This is because they can be used as standalone or in combination with other technical indicators. These charts provide an extra dimension to the analysis.

🕯️ This technical approach is an age-old tradition of analysis, which has evolved from centuries of trial and error.

🕯️ Japanese are quite visual on the terms used to describe the patterns. A term like ‘hanging-man’ will spark interest among traders. There are hundreds of such names. Once a trader gets an understanding of what that pattern is, they will not be able to trade without using them.

🕯️ Another important reason for using the candlestick chart is that it can be paired along with the bar charts for people who see bar charts alone.

🕯️ All the usual technical analysis tools can be easily used with candlestick chartings, such as moving averages, trend lines, Elliot waves, retracements, and more. These charts provide a unique way of analysis, which is not provided by any other charting tool.

Limitations of using the Candlestick charts

🕯️ As with all other charting methods, candlestick pattern depends on the interpretation of the trader. This could be one of their limitations. As a trader gain experience, they discover which candlestick pattern suits them the best.

🕯️ Every candlestick has a close. Therefore, traders will have to wait for the close to get a valid trading signal. However, a trader might try and anticipate what the close would be a few minutes before the actual close.

🕯️ The opening price is vital in candlestick. Traders with no access to live market data might not be able to get the opening price of a security.

That’s about the introduction to Candlestick charts, its pros & cons. In the next article, we will learn the anatomy of a single candlestick chart so that you can read the chart better. Make sure to take the quiz below before moving on. Cheers!

[wp_quiz id=”59568″]
Categories
Forex Assets

What Should Know About The AUD/JPY Currency Pair?

Introduction

AUDJPY is the abbreviation for the Australian dollar and the Japanese yen. It commonly referred to as “Aussie yen.” It is one of the cross-currency pairs in the forex market. AUD, being on the left, is termed as the base currency and JPY as the quote currency.

Understanding AUD/JPY

The market price of AUDJPY corresponds to the value of JPY that needs to be paid to buy one AUD. It is quoted as 1 AUD per X JPY. For example, if the value of AUDJPY is 74.571, then these many units of the yen are to be produced to purchase one Australian dollar.

AUD/JPY Specification

Spread

Spread is the medium through which brokers generate their revenue. They set different prices for buying a currency and selling a currency. The difference amount becomes their profit margin. The spread usually changes from time to time and varies on the type of execution model.

ECN: 0.7 | STP: 1.6

Fees

Apart from spreads, one needs to pay a charge for every execution a trader makes. It is essentially the commission levied by the broker on each trade. As a matter of fact, there is no fee on STP accounts. But, on ECN accounts, there is a fee of few pips.

Slippage

Going by the definition, slippage is the difference between the price executed by the trader and the price he actually received. It could be in favor of the trader or against him. It all depends on the broker’s execution speed and the change in the volatility of the market.

Trading Range in AUD/JPY

A trading range is a tabular representation of the minimum, average, and the maximum pip movement in a currency pair on different timeframes. These values help in determining the profit that can be made or loss one must bear in a given time frame. And this can be found out by simply finding the product between the pip movement and the value per pip ($9.15).

Procedure to assess Pip Ranges

  1. Add the ATR indicator to your chart
  2. Set the period to 1
  3. Add a 200-period SMA to this indicator
  4. Shrink the chart so you can determine a large time period
  5. Select your desired timeframe
  6. Measure the floor level and set this value as the min
  7. Measure the level of the 200-period SMA and set this as the average
  8. Measure the peak levels and set this as Max.

AUD/JPY Cost as a Percent of the Trading Range

Cost as a percent of the trading range is an illustration of the cost variation by considering the total cost and the volatility of the market in different timeframes. These values are expressed in a ratio that is converted to percentages. And the magnitude of these percentages helps in determining the cost variation in each trade.

ECN Model Account

Spread = 0.7 | Slippage = 2 |Trading fee = 1

Total cost = Slippage + Spread + Trading Fee = 2 + 0.7 + 1 = 3.7

STP Model Account

Spread = 1.6 | Slippage = 2 | Trading fee = 0

Total cost = Slippage + Spread + Trading Fee = 2 + 1.6 + 0 = 3.6

The Ideal way to trade the AUD/JPY

Though Forex is a 24/7 market, it is not ideal to enter any time in the market. There are certain times when you must enter the market, which can help reduce costs significantly. Let us determine that using the above tables.

Note that the higher the magnitude of the percentage, the higher is the cost of the trade. From the table, it can be ascertained that the values are high in the minimum column, implying that the costs are high when the volatility of the market is low. Similarly, the costs are low when the volatility is high. However, it is not ideal to trade during these times. To ensure optimum volatility and affordable cost, one must trade during those times when the volatility is around the average range.

Furthermore, there is another way through which you can reduce your costs. Trading using limit orders instead of the market orders brings down the total cost significantly, as the slippage becomes zero. The decline in the costs on the trade when slippage is made zero is shown below.

Categories
Forex Assets

Basics Of Trading The AUD/CHF Currency Pair & Analyzing The Trading Costs Involved

Introduction

AUDCHF is the abbreviation for the Australian dollar and the Swiss franc. It is a cross-currency pair in the market. AUD being on the left is the base currency, and CHF (on the right) is the quote currency. One can expect high volatility and liquidity during the Australian session.

Understanding AUD/CHF

The value of AUDCHF represents the amount of Swiss Francs required to buy one Australian dollar. It is quoted as 1 AUD per X CHF. For example, if the value of AUDCHF is 0.6885, then this number represents the CHF that is to be produced by the trader to buy one AUD.

AUD/CHF Specification

Spread

Spread is the difference between the bid price and the ask price of the market set by the brokers. It is not a fixed value. It differs from the account type as well as the broker.

ECN: 0.7 | STP: 1.7

Fees

Brokers charge a fee on every trade a trader takes. It could be per execution or finished trade (round trip). Also, it varies from the type of account model. Typically, fee on ECN type is 5-10 pips, and 0 on STP type.

Slippage

Slippage is the difference between the price demanded by the trader and the price he actually received from the broker. There is always a variation in this due to the broker’s execution speed and market volatility.

Trading Range in AUD/CHF

Wanting to know how much profit one can make in a given time? If so, then you may find the answer in the table illustrated below. This table is the representation of the min, average, and max volatility of the currency pair in different timeframes. And with these values in the table, one can determine the profit on a trade.

Procedure to assess Pip Ranges

  1. Add the ATR indicator to your chart
  2. Set the period to 1
  3. Add a 200-period SMA to this indicator
  4. Shrink the chart so you can determine a significant period
  5. Select your desired timeframe
  6. Measure the floor level and set this value as the min
  7. Measure the level of the 200-period SMA and set this as the average
  8. Measure the peak levels and set this as Max.

AUD/CHF Cost as a Percent of the Trading Range

The cost as a percent of the trading range is determined in the following table using different volatilities, assuming that the trading range can be seen as the potential profit on a given timeframe. The percentages are obtained by finding the ratio between the total cost of the trade and the range values. These values, thus, help in assessing the right moments in the day to trade the currency pair.

ECN Model Account

Spread = 0.7 | Slippage = 2 |Trading fee = 1

Total cost = Slippage + Spread + Trading Fee = 2 + 0.7 + 1 = 3.7

STP Model Account

Spread = 1.7 | Slippage = 2 | Trading fee = 0

Total cost = Slippage + Spread + Trading Fee = 2 + 1.7 + 0 = 3.7

The Ideal way to trade the AUD/CHF

Firstly, the higher the value of the percentage, the higher is the cost of the trade. It is pretty evident from the above tables that the costs are higher in the min column and keep decreasing in the subsequent columns. Meaning, as the volatility increases, the total cost of the trade reduces. But, it is not ideal to trade in either of the extremes. To have an affordable cost and optimal volatility, it is best to enter during those times of the day when the pip movement for the pair is more or less equal to the average values.

Furthermore, the total cost can easily be reduced by trading using limit order instead of market orders. This methodology would bring down the slippage to zero. Hence, significantly affecting the percentage values. And an example of the same is depicted below.

Categories
Forex Basic Strategies

Identifying Accurate Trading Signals Using The Dark Cloud Cover Candlestick Pattern

Introduction

Dark Cloud Cover is a bearish reversal candlestick pattern. It essentially shows the shift in momentum from the buyers to sellers. This pattern is formed by a bullish candle, which is then followed by a bearish candle. Traders can look for an entry on the next red candle. The Dark Cloud Cover pattern can only be used when it occurs in an uptrend. Because, if the price rises above the Dark Cloud Cover pattern, it becomes less significant to trade. It is essential to know that the bearish engulfing pattern and Dark Cloud Cover pattern are very similar in their appearance. If the second candle of the pattern closes below the previous candle, you have the bearish engulfing pattern; if not, it is a dark cloud pattern.

Criteria to identify the Dark Cloud Cover pattern 

  1. The market must be in an existing uptrend.
  2. The first candle must be bullish candle within that uptrend.
  3. A gap must be on the following day.
  4. The gap up candle must close into a bearish candle.

Dark Cloud Cover Pattern – Trading Strategies

DCC + MACD Indicator

As we always say, do not trade any pattern stand alone in the market. Pairing the pattern with other credible trading tools like indicators or oscillators will dramatically increase the odds of your trades. In this strategy, we have paired the Dark Cloud Cover pattern with the MACD indicator to filter out the low probability trades. MACD indicator stands for Moving Average Convergence and Divergence. It is one of the most popular indicators that has been in use since the late 1970s. It belongs to the oscillator family, and it is designed to measure the magnitude, direction, and rate of change in any underlying currency pair.

STEP 1 – First of all, find the Dark Cloud Cover pattern in an uptrend.

STEP 2 – Wait for a MACD Crossover

Once you have found the Dark Cloud Cover pattern, the next step is to take the sell trade when MACD gives crossover at the oversold area.

As you can see in the below daily chart of the GBPJPY forex pair, the price action turned sideways for some time. After that, it prints the Dark Cloud Cover pattern, and at the same time, we can see the MACD indicator giving a reversal at the overbought area. This is a potential sign for us to go short on this pair.  As mentioned earlier, do not confuse between the Dark Cloud Cover and Engulfing Pattern. In a Bearish engulfing pattern, the red candle completely takes over the preceding green candle, whereas, in the Dark Cloud Cover pattern, the red candle takes over only 50% of the previous green candle.

Step 3 – Take Profit and Stop loss

In this strategy, we have closed our full position at the major support area, and stop-loss was above the Dark Cloud Cover pattern. Price action holds below the support area, but it immediately came back, and prints a brand new higher high. We can also close our positions based on the MACD indicator. When the MACD indicator reversed at the oversold area, it’s a perfect sign to exit our position. Always remember the sure sign of market reversal is when the price action is at the significant support area and the MACD lines crossover at the oversold region.

DCC + Donchain Channel

In this strategy, we have paired the Dark Cloud Cover pattern with the Donchain Channel. Richard Donchain developed the Donchain channel indicator in 1936. He was a fund manager, writer, and also known as the father of trend trading. Once the Donchain channel indicator is plotted on to the price chart, it helps the traders to visualize the price of an asset and if it is relative to the upper and lower bounds of the indicator.

STEP 1 – Find out the Dark Cloud Cover pattern in an uptrend.
STEP 2 – Check if the price action respects the upper Donchain Channel

Once you find the Dark Cloud Cover pattern in an uptrend, the next step is to check if the price action respects the upper Donchain Channel.

The image below represents the EUR/AUD forex pair, and the price action was held at the major resistance area. Before printing the Dark Cloud Cover pattern, the price hits the upper bound of the Donchain channel twice. When price action hits the upper bound of the Donchain channel and if the market prints the Dark Cloud Cover pattern at the same time, it is a clear indication of sellers stepping into the market. After the completion of the pattern, we activate our trade, and for a profit-booking, we aim for the second target.

STEP 3 – Take Profit and Stop loss

In this example, we have two target areas. If you are a short term or intraday trader, then exit your position at first support area, and if you are a positional trader or a swing trader, then go for target two. When you activate your trade and if the market has two major support areas, always try to exit your position at target two, because the end goal of every trader is to make as much money as possible when the market gives them an opportunity & minimize the losses when the trade goes against them. The placement of stop-loss should always be above the Dark Cloud Cover pattern.

Bottom Line

The Dark Cloud Cover is quite a popular trading pattern in the industry, and it can easily be recognized on the price charts. This pattern is only useful or reliable to trade when it appears in an overall uptrend. This pattern identifies the shift in momentum from buyers to sellers. The test of the resistance line or trend line can be used as a confirmation tool to take sell trades. If you are using the Dark Cloud Cover pattern alone, always use it on the higher timeframe. Also, use more significant stop loss because none of the indicators or patterns are capable enough to indicate accurate signals all alone. On a lower timeframe, this pattern often provides some false signals. Still, by pairing it with other trading indicators, we can dramatically filter out the low probability signals.

We hope you find this article useful. Try trading this pattern with the indicators we have mentioned above to maximize your profits, as these combinations have been back-tested by experienced traders. Cheers!

Categories
Forex Assets

Understanding The AUD/CAD Forex Currency Pair

Introduction

AUDCAD is the abbreviation for the currency pair, the Australian dollar, and the Canadian dollar. It is a cross-currency pair. One can expect great volatility and liquidity in the market during the Australian session. AUD is the base currency, and CAD is the quote currency.

Understanding AUD/CAD

The value of AUDCAD is the number of Canadian dollars required to buy one Australian dollar. It is quoted as 1 AUD per X CAD. For example, if the value of this pair is 0.9013, then 0.9013 CAD is needed to purchase one AUD.

AUD/CAD Specification

Spread

Spread in trading is the difference between the bid price and the ask price set by the broker. This pip difference is how brokers generate revenue. The spread always varies from broker to broker and the type of account model.

ECN: 1 | STP: 1.9

Fees

Apart from spreads, brokers charge a few pips of fee or commission on each trade you take. This exists only ECN accounts, as a fee on STP accounts is nil.

Slippage

Due to the delay in the broker’s execution speed and volatility of the market, a trader doesn’t get the exact price he intended. This difference in prices is referred to as slippage. It typically varies from 0.5 pips to 5 pips.

Trading Range in AUD/CAD

The trading range is the representation of the minimum, average, and maximum volatility in the market in a given timeframe. This proves to be useful in determining the profit/loss that can be made in a specific amount of time. One can determine this simply by finding the product of the pip movement on the required timeframe and the pip value (mentioned in the specification table).

Procedure to assess Pip Ranges

  1. Add the ATR indicator to your chart
  2. Set the period to 1
  3. Add a 200-period SMA to this indicator
  4. Shrink the chart so you can assess a large time period
  5. Select your desired timeframe
  6. Measure the floor level and set this value as the min
  7. Measure the level of the 200-period SMA and set this as the average
  8. Measure the peak levels and set this as Max.

AUD/CAD Cost as a Percent of the Trading Range

The cost of trade is an essential point of consideration in trading. Cost is that factor that is not fixed and varies on different variables. For example, when the volatility changes, the costs change. The same is the case with timeframes as well. Below is a table that illustrates the variation in the costs on a trade for different timeframes and volatilities.

ECN Model Account

Spread = 1 | Slippage = 2 |Trading fee = 1

Total cost = Slippage + Spread + Trading Fee = 2 + 1 + 1 = 4

STP Model Account

Spread = 1.9 | Slippage = 2 | Trading fee = 0

Total cost = Slippage + Spread + Trading Fee = 2 + 1.9 + 0 = 3.9

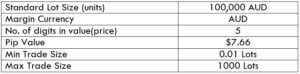
The Ideal way to trade the AUD/CAD

Comprehending the above tables is simple. The higher the magnitude of the costs, the higher is the total cost that has to be paid on a trade and vice versa. In the table, the percentages are on the higher side in the min column and lower in the max column. Hence, it can be concluded that the costs are higher when the volatility is low and vice versa. However, it isn’t ideal to trade in these situations. It is rather preferred to enter the market when the volatility is around the average values because the costs are affordable, and the volatility is as needed.

Moreover, it is recommended to design strategies such that limit orders are put to use. This shall completely eliminate the slippage on the trade. And with the elimination of slippage, the total cost would significantly reduce as well.

Categories
Forex Basic Strategies

Pairing The Shooting Star With Stochastic & Awesome Oscillators

Introduction

The Shooting Star is one of the most popular bearish candlestick patterns in the industry. This pattern appears in an uptrend most of the time, and it indicates bearish reversals in the price action of any underlying currency. So basically, when this pattern appears on the charts, it implies that the buyers are exhausted, and its sellers turn to lead the market. Once we have identified the Shooting Star pattern in an uptrend and confirm the trend reversal with any other credible indicator, we should look to open a short position.

This pattern has a unique structure as it consists of a small body and a high upper wick, as shown in the image below. This image accurately represents the trend reversal because we can clearly see the buyers losing momentum and sellers taking over the market.

Trading strategies with the Shooting Star pattern

Shooting Star + Stochastic Indicator

In this strategy, we have paired the Shooting Star pattern with the Stochastic Indicator to identify the trading opportunities. Just like RSI and MACD, the Stochastic Indicator also belongs to the oscillator group. It is developed in the 1950s, and it is still widely used by the traders. The Stochastic indicator oscillates between 0 & 100 levels. When the indicator goes below 20, it means that the currency pair is oversold. Similarly, when the indicator goes above the 100 level, it indicates that the currency pair is overbought.

STEP 1 – First of all, find the Shooting Star pattern in an uptrend.

STEP 2 – Check the Stochastic indicator

Once you find the Shooting Star pattern, the next step is to check the Stochastic Indicator. If the indicator is giving a reversal at the oversold area, it indicates the overbought market conditions.

The image below represents the EUR/USD weekly Forex chart. In this pair, price action was held at a significant resistance area, and it prints the Shooting Star pattern. Also, the Stochastic indicates the overbought conditions. These three clues clearly say that this pair is all set to change its direction. The Stochastic pattern on a higher timeframe has very higher chances to perform. So whenever you find this pattern, and if it supports the rules of this strategy, always trade big.

Step 3 – Stop-loss and Take Profit

A stop loss is specially designed to limit the loss of the trader. So before activating your trade, it is essential to decide where you are going to place the stop loss. In the example above, we put the stop loss just above the Shooting Star candle.

Shooting Star pattern indicates the reversal in price action. This means that we are catching the top of the trend. As the end goal of every trader is to maximize their profits and minimize losses, always try to hold the positions for more extended targets.

In the example, we have closed our position at a higher timeframe support area. We can use the higher timeframe support or look for the Stochastic Indicator to reach the oversold area. Another way to close the position is when the market reaches the major support area while the Stochastic is in the oversold area.

As we can see in the image below, we closed our full position at a significant support area. You can use the Stochastic or any other trading tool to exit your position, but we always suggest to use the considerable support/resistance area to book profits.

Shooting Star Pattern + Awesome Oscillator

In this strategy, we have paired the Shooting Star pattern with the Awesome Oscillator to identify the trading opportunities. The Awesome Oscillator is a boundless indicator. When the Awesome Oscillator reverses below the zero-level, it indicates the buying pressure. When it reverses above the zero-level, it means sellers are ready to lead the market. Furthermore, some traders use this indicator to confirm the strength of the trend. When the indicator goes above zero-level, it means the buying trend is quite strong, and when it goes below the zero-level, it shows the sellers dominating the market.

Step 1 – First of all, find the Shooting Star pattern in an uptrend.

Step 2 – Look for the Awesome oscillator reversal

Once we find the Shooting Star pattern, the next step is to take a sell-entry when the Awesome Oscillator reverses at overbought market conditions.

The image below is the EURUSD 240 chart. On this pair, at first, the buyers were quite weak, and they started holding at the resistance area. Furthermore, in that small range, price action turned sideways, and it printed the Shooting Star pattern. The Awesome Oscillator even reversed at the overbought conditions. Both of the trading tools are indicating the exhaustion of the buyers. And sellers are ready to take over the market.

Step 3 – Take Profit and Stop loss

Every trader has different expectations from the market, some like to trade short term trends, and some like to trade longer-term moves. If you are an intraday trader, then we suggest you close your position when the Awesome Oscillator reverses at the oversold area. But, if you are a swing trader or investor, wait for the opposite pattern (Hammer Pattern) to appear to close all of your positions. We can even use the higher timeframe support/resistance area to close our positions.

We advise you to place the stop-loss order above the Shooting Star pattern. As you can see in the image below, we booked full profits at the major support area. After that, the price action dropped a bit more but reversed immediately to follow the buy direction. It is important not to ignore the higher timeframe support/resistance areas.

The psychology behind the Shooting Star Pattern

At first, we see the buyers enjoying the uptrend as the price of the currency keeps printing brand new higher high. As this euphoric moment begins to set in, the sellers start to sell their positions at higher prices. Now the buyers get panicked, and even they start to sell their positions. Now that the buyers and sellers are both selling their positions, panic is created in the market, which leads to a sharp reversal in price action. Thus a long wicked small body candle appears on the trading charts.

Keep in mind that the Shooting Star pattern is more reliable when it is formed after the three consecutive bullish candles. It creates strong bullish pressure on the price chart, and in such cases, the upper wick of Shooting Star is even longer. It indicates that the price is about to reverse with even more strength.

Bottom line

The Shooting Star is a single candle pattern, and it is the most popular trend reversal pattern in the industry. There is a strong psychological pattern that exists beyond the Shooting Star pattern. When the market is in an uptrend, and when buyers gain exponential strength, most of the traders book the profit, and as a result, the bullish trend loses its strength. This results in sellers sending the price down. Most of the time, the Shooting Star pattern provides the 3:1 risk-reward ratio trades.

We hope you find this article informative. Please let us know if you have any questions regarding the same in the comments below. Cheers!

Categories
Forex Course Forex Daily Topic

Introduction To Forex Course 3.0

Hola Readers! We have successfully completed the first two courses and received an amazing response for both of them. We can’t thank you enough for that. Also, we hope these first two courses have helped you in understanding the most fundamentals basics of the Forex market. It is very important to know these basics in order to succeed in the Forex market. We have made a quick navigation guide for both the courses just for you to access the articles easily.

You can find them here the guides for – Course 1.0 | Course 2.0

With all these basics in mind, we will be moving on to our new course, which is a bit different than the other two courses. We are saying this because the first two courses are more inclined towards information and theory. But Course 3.0 is all about Technical Analysis. Hence most part of it deals with the practical applications that are involved rather than just theory. The quizzes and everything remain as is, but a lot more effort from your side is required to ace the knowledge that we are going to provide in the lessons.

Having said that, Technical Analysis has the most logical approach to the prediction of price movement than the Fundamental & Sentimental Analysis. There are a lot of components within the technical analysis, and some of them include Price-Action trading, technical tools such as Indicators & Oscillators, Volume based trading, etc. In this course, we will be going through all of them in detail.

Topics that will be covered in this course 

Everything About Candlesticks

Support & Resistance Levels

Moving Averages

Popular Indicators & Oscillators

Fibonacci Trading

In each of the topics, there will be about 7 – 10 article lessons where complete information is provided related to the topics. Quizzes will be available for each of the articles like before.

We are proud to present this course to you as it is prepared by some of the top technical traders with great expertise in this field. Aren’t you excited? We wish you all the best in studying and learning the concepts with at most interest. Cheers!

Categories
Crypto Guides

Use Cases Of Blockchain Technology – Part 2 (Food & Diamond Industries)

In our previous guide, we have discussed some of the real-life applications of Blockchain technology. Some of the critical use cases of this technology that we have discussed in the Part-1 article include Asset Tokenization, Supply Chain Management, Energy Market & Healthcare. In this guide, let’s talk Food Safety & Diamond Industry, where the blockchain technology is being used extensively to solve more significant problems.

🥗 Food Safety 

Do you know where your food is coming from? Any idea on where it is being produced or who produced it? Have you seen some of those viral videos where artificial cabbages are made out of some chemicals in China? Or many scams in third world countries where various food items such as cooking oil, eggs, milk, etc. are mixed with dangerous chemicals to extend the storage capacity of perishable items? Yes. All of these are true. Food companies commit some of the biggest sins on this planet.

Hence it is essential to know what kind of food you eat and how pure it is. The supply chain of food items is always complicated and opaque. There is no transparency regarding where the food is produced, packed, re-packed, etc. So there are high chances of fraud happening with the tracking technology we have as of today. But with blockchain tech, users can verify the history of the food items very quickly.

Various other details such as batch numbers, location of production, storage temperatures, where the item is packed, its expiry dates can easily be recorded as well. Since the entire blockchain is transparent, anyone who has access to the respective blockchain can gain access to all those details. If executed correctly, the efficiency of the food supply chain can easily be improved. IBM Food Trust is one such blockchain that deals with most of the problems we discussed above.

💎 Diamond Industry

We all know how precious the diamonds are. They are incredibly scarce, and that makes them one of the most luxurious jewelry items. But the Diamond industry is currently facing a lot of problems such as insurance fraud, smuggled diamonds, etc. Diamond companies are following different complex procedures to make sure quality control is in place. Also, insurance companies are taking various measures to make sure the fraud doesn’t happen. However, these measures and procedures consume a lot of time and money. But what if we say there is one simple solution to all these problems?

Yes, the solution is Blockchain technology. Using this tech, provenance tracking can be done for the diamonds at every stage of its production, like from where they are mined to the retail stores. Typically, a serial number is given to the diamonds, which capture close to 40 properties of it. This serial number is embedded on the diamond while cutting & polishing it. All of these parameters related to a particular diamond can be stored in a blockchain. There’s a company known as EverLedger, who does exactly this. Essentially they convert the physical asset into a digital asset by taking all of its information for provenance tracking. As of today, they are tracking over 2 million diamonds, and by these services, users are sure that they have made the right purchase.

Some of the biggest problems in the world like terrorism can be tackled if companies like EverLedger prevail in the market. Blood diamonds are one of the largest ways of funding terrorist groups around the globe. Illegal mining of diamonds can completely be eliminated with the help of blockchain technology.

These are just two of the many industries where blockchain is being used for improving the existing conditions. Some of the other major industries include Real-Estate, Intellectual Property, e-governance, etc. We hope you enjoyed reading this article. Cheers!

Categories
Forex Basic Strategies

How To Trade The ‘Three Black Crows’ Pattern Like A Professional Forex Trader

Introduction

Three Black Crows is a bearish candlestick pattern that consists of three consecutive red candles. This is a visual pattern and can be identified easily on the price action charts. The Three Black Crows pattern essentially indicates a shift in control from bulls to bears. In the book known as ‘Candlestick Trading Technique,’ Steve Nison says that this pattern is one of the most useful ones for longer-term trades.

In an uptrend, this pattern consists of three consecutive bear candles that have large bodies of roughly the same size. The Three Crows pattern confirms the strength of the sellers.

Each candle should be open and close lower than the previous candle.

Each candle should mark a successive decline in price action and should not have long shadows or wicks. Using this trading pattern in conjunction with other technical indicators will enhance the probability of winning the trade.

Trading Strategies With Three Black Crows Pattern

TBC Pattern + Bollinger Bands

In this strategy, we have paired the Three Black Crows pattern with the Bollinger Bands to identify accurate trading signals. The Bollinger Bands indicator is developed by the technical trader John Bollinger. It consists of a centerline and two bands above and below the price chart. The bands of the indicator contract and expand according to the different market conditions. In a volatile market, the bands of the indicator expand and in a dying market condition the bands’ contract.

Step 1 – First of all, find the Three Black Crows Pattern in an uptrend.

Step 2 – Take a sell-entry when the Three Black Crows pattern hit the upper band of the Bollinger Bands Indicator.

In the above chart of the NZD/USD forex chart, we can see that the pair was in an overall uptrend. Around the 4th of November, price action prints Three Black Crows, which is an initial clue to go short. Furthermore, price action also respects the Bollinger upper band, which is a sign to go short on this pair.

Step 3 – Stop-loss & Take Profit

Placing accurate Stop loss is one of the most critical aspects of successful trading. Some of the novice traders never use stop loss, and it is the biggest mistake they do. We always suggest the traders use the stop-loss order in every trade they take. If you have the fear that your trade might hit the stop loss, then use a deeper stop loss and expect only 1R trades. If you are an aggressive trader, then stop loss above the Bollinger bands is the safest idea.

The basic idea most of the traders have is to exit their positions when price action hits the lower band of the Bollinger band indicator. If you follow this strategy, there will be fewer chances of you making money. Because price action moves in cycles, and prices often hit the upper and lower bands. We suggest you always use the higher timeframe major support area for booking your profits. You can also close your position when the market prints the Three White Soldiers pattern, which is quite the opposite of the Three Black Crows pattern.

In the above example, we have closed our full position when the market reached a previous major support area. Most of the time, price action always reacts from a significant support area. In our case, when we closed our position (yellow dotted line), price action immediately changed its direction.

TBC Pattern + MACD Indicator

In this strategy, let’s learn how to trade the Three Black Crows pattern by combining it with the MACD indicator to identify reliable trading signals. MACD is a trend following indicator, and it stands for Moving Average Convergence and Divergence. This indicator consists of a histogram, moving averages, and a centerline. Traders use the MACD moving average crossovers to identify the trading signals. When the moving averages of the indicator go above the zero-line, it indicates a buy signal. Likewise, when it goes below the zero-line, it indicates the sell signal.

Step 1 – First of all, find the Three Black Crows Pattern in an uptrend.

Step 2 – The strategy is this – when market prints the Three Black Crows pattern, see if there is a crossover happening on the MACD indicator at the overbought area. If there is a crossover, it is a clear sign to go short in any underlying currency pair and vice-versa to go long.

In the image below, GBP/CAD was in an overall uptrend. When price action prints the Three Black Crows pattern, it indicates the ongoing trend reversal in the near future. Furthermore, when crossover happened on MACD, it’s a clear signal that the GBP/CAD is ready to start a downtrend afresh. After our entry, price held for a bit at the support area and dropped to print a brand new lower low.

Step 3 – Stop-loss & Take Profit

Put the stop loss above the first candle of the Three Black Crows pattern and close your whole position when price action reached a significant support area.

As you can see in the image below, we closed our full position at the major support area. Overall it was not a smooth ride, but our position didn’t go into loss even for a single time. Traders can also close their positions according to market situations, or according to their trading style.

Bottom Line

Three Black Crows pattern is one of the most famous and popular trading patterns out there. This pattern can be used to identify the trend reversals in an upward market. Whenever you find a Three Black Crows pattern on the price chart, we suggest you sit up straight and understand if this pattern has the potential to reverse the market or not. It is always advisable to pair this pattern with other trading tools to confirm the indication. Traders can also use this pattern to enter or exit a trade. Some traders use this pattern with the combination of other trading tools in order to close their full position. The end goal is to use this pattern to identify trading opportunities and trend reversals more accurately. Cheers!

Categories
Forex Assets

AUD/NZD – Everything About This Forex Currency Pair

Introduction

AUD/NZD is derived from the full-form of the currency pair, the Australian dollar, and the New Zealand dollar. It comes under the classification of cross currency pairs. In this pair, AUD is the base currency, and NZD is the quote currency.

Understanding AUD/NZD

The value of AUD/NZD depicts the value of NZD that is equivalent to AUD. It is simply quoted as 1 AUD per X NZD. For example, if the current value of this pair is 1.0405, then these many New Zealand dollars are needed to purchase one Australian dollar.

AUD/NZD Specification

Spread

Spreads are a typical way through which brokers make money. The pip difference between the bid price and the ask price is their profit margin, which is referred to as the spread. It varies from the type of account model.

ECN: 0.9 | STP: 1.8

Fees

The fee is basically the commission on a trade levied by the broker on each trade. Again, it varies from the type of account model.

Fee on STP = 0

Fee on ECN = 6 to 10 pips (starts from as low as one pip)

Slippage

The slippage is the difference between the broker’s executed price and the trader’s execution price. There is this variation as the order is executed using market execution. There are two reasons for slippage to take place.

  • Broker’s execution speed
  • Market’s volatility

Trading Range in AUD/NZD

Assessing the profit/risk is a great add-on to one’s trading analysis. With this, the trader can know how long he must before his trade performs. And below is the table that enables the analysis of it.

Procedure to assess Pip Ranges

  1. Add the ATR indicator to your chart
  2. Set the period to 1
  3. Add a 200-period SMA to this indicator
  4. Shrink the chart so you can assess a large time period
  5. Select your desired timeframe
  6. Measure the floor level and set this value as the min
  7. Measure the level of the 200-period SMA and set this as the average
  8. Measure the peak levels and set this as Max.

AUD/NZD Cost as a Percent of the Trading Range

This is one great application of the above table. By combining these values with the total cost of trade, one can determine variations in the costs by varying the parameters like volatility and timeframe.

ECN Model Account

Spread = 0.9 | Slippage = 2 |Trading fee = 1

Total cost = Slippage + Spread + Trading Fee = 2 + 0.9 + 1 = 3.9

STP Model Account

Spread = 1.8 | Slippage = 2 | Trading fee = 0

Total cost = Slippage + Spread + Trading Fee = 2 + 1.8 + 0 = 3.8

The Ideal way to trade the AUD/NZD

Before getting into finding the best way to trade this pair, let us comprehend what the above table has got to say.

The higher the magnitude of the percentages, the higher is the cost on the trade for that particular volatility and timeframe. The min column represents low volatility, and the max column represents high volatility.

It can clearly be ascertained from the table that the percentages are comparatively higher on the min column and lower on the max column. This means that the costs are high when volatility is low and vice versa.

But, it is not ideal to trade in neither of the two situations mentioned below.

When the volatility is high -> because of the risk involved
When the volatility is low -> because the costs are high

Now, to maintain a balance between all the parameters, it is best to trade when the pip movement is around the average values.

Furthermore, another simple way to reduce cost is by trading using a pending/limit order instead of market orders, as it will nullify the slippage on the trade. And this, in turn, will reduce the total cost of the trade as well.

Categories
Forex Assets

What Should You Know Before Trading The NZD/JPY Currency Pair

Introduction

NZDJPY, or the NZD/JPY or the New Zealand dollar against the Japanese yen, is a cross-currency pair in the Forex market. The left currency (NZD) represents the base currency, and the one the right (JPY) represents the quote currency.

Understanding NZD/JPY

The market value of NZDJPY is a value of JPY that is required to buy one NZD. It is quoted as 1 NZD per X JPY. For example, if the CMP (current market price) of NZDJPY is 72.657, then it takes 72.657 yen to buy one New Zealand dollar.

NZD/JPY Specification

Spread

Spread is the difference between the bid price and the ask price controlled by the broker. It varies across brokers and their type of execution.

ECN: 0.8 | STP: 1.7

Fees

On every trade a trader takes, there are few pips of fee on it. And this is only on ECN accounts because the fee on STP accounts is nil.

Slippage

Slippage, which happens on market orders, is the difference between the price asked by the client and the price he actually received. There are two primary reasons for it, namely, the broker’s execution speed and the change in volatility of the market.

Trading Range in NZD/JPY

The average, minimum, and maximum pip movement is determined in the trading range table. This comprehensive table helps traders assess the profit they can generate and loss they can incur in a given timeframe. Moreover, this table is helpful in analyzing the cost variation in a trade, which shall be discussed in the next section.

Procedure to assess Pip Ranges

  1. Add the ATR indicator to your chart
  2. Set the period to 1
  3. Add a 200-period SMA to this indicator
  4. Shrink the chart so you can assess a large time period
  5. Select your desired timeframe
  6. Measure the floor level and set this value as the min
  7. Measure the level of the 200-period SMA and set this as the average
  8. Measure the peak levels and set this as Max.

NZD/JPY Cost as a Percent of the Trading Range

The cost of a trade is not the same throughout the trading day. It varies based on the volatility of the market. Hence, it is necessary to know during what times the cost is high and what times it is low. This could be found out from the table illustrated below.

ECN Model Account 

Spread = 0.8 | Slippage = 2 |Trading fee = 1

Total cost = Slippage + Spread + Trading Fee = 2 + 0.8 + 1 = 3.8

STP Model Account

Spread = 1.7 | Slippage = 2 | Trading fee = 0

Total cost = Slippage + Spread + Trading Fee = 2 + 1.7 + 0 = 3.7

The Ideal way to trade the NZD/JPY

The magnitude of the cost percentage is directly proportional to the cost of a trade. So, the higher the value of the percentage, the higher is the cost of a trade. From the table, it can be observed that the cost is highest in the min column compared to the other two columns. This means that the costs are highest when the volatility of the market is low and vice versa, irrespective of the timeframe you’re trading. It is neither ideal to trade when the volatility of the market is high, nor when the costs are high. The average column is on the one we focus on. Trading when the volatility is at the average value is when you can expect moderate volatility and decent costs.

Also, you may reduce your costs by trading using limit or pending orders instead of market orders. This will bring the slippage to ground zero. This, in turn, will reduce the total cost of the trade as well. An example of the same is illustrated below.

Spread = 1.7 | Slippage = 0 | Trading fee = 0

Total cost = Slippage + Spread + Trading Fee = 0 + 1.7 + 0 = 1.7

Hence, it is seen that the costs have reduced by around 50% of the previous value.

Categories
Forex Assets

Understanding The Basics Of NZD/CHF Forex Pair

Introduction

NZDCHF is a cross-currency pair in the Forex market. It is an abbreviation for the New Zealand dollar and the Swiss franc. Here, NZD is the base currency, and CHF is the quote currency.

Understanding NZD/CHF

The value of NZDCHF simply represents the units of CHF equivalent to one unit of NZD. It is quoted as 1 NZD per X CHF. For example, in the market, if the price of NZDCHF is 0.64535, then it requires those many units of CHF to buy one NZD.

NZD/CHF Specification

Spread

The bid price and ask price in the market is typically not the same. The difference between these two prices is referred to as the spread. And this difference amount is used by the broker. It varies from the type of account model.

ECN: 1.1 | STP: 1.9

Fees

The fee is basically the commission that has to be paid on each trade you take. It varies from broker to broker and their execution type. Typically, there is no fee on STP accounts, but a few pips on ECN accounts.

Slippage

Another type of fee traders have to bear is the slippage. It is the difference between the trader’s requested price and the broker’s executed price. Slippage always is changing due to the ups and downs in market volatility and the broker’s execution speed.

Trading Range in NZD/CHF

Many novice traders randomly take trades without determining the amount they’re going to risk. The trading range is that representation, which indirectly illustrates the risk and profit area in a trade, in a given time frame. For example, if the average pip movement on NZDCAD on the 4H timeframe is 20 pips, then the trader will be risking $205.4 in an hour on an average.

Procedure to assess Pip Ranges

  1. Add the ATR indicator to your chart
  2. Set the period to 1
  3. Add a 200-period SMA to this indicator
  4. Shrink the chart so you can assess a large time period
  5. Select your desired timeframe
  6. Measure the floor level and set this value as the min
  7. Measure the level of the 200-period SMA and set this as the average
  8. Measure the peak levels and set this as Max.

NZD/CHF Cost as a Percent of the Trading Range

Apart from knowing the profit/loss that can be made from a trade in a given time, it is also necessary to know the cost variation in different volatilities and timeframes. Below is a table representing the cost as a percentage that is obtained by considering the volatility, timeframe, and the total cost on a trade.

ECN Model Account 

Spread = 1.1 | Slippage = 2 |Trading fee = 1

Total cost = Slippage + Spread + Trading Fee = 2 + 1.1 + 1 = 4.1

STP Model Account

Spread = 1.9 | Slippage = 2 | Trading fee = 0

Total cost = Slippage + Spread + Trading Fee = 2 + 1.9 + 0 = 3.9

The Ideal way to trade the NZD/CHF

Trading on any timeframe and during any volatility is not an efficient way of trading. There are specific times in the market when you must enter/exit. This can be determined from the above two tables. Firstly, the higher the magnitude of the percentage, the higher is the cost of a trade for that particular timeframe and volatility. It can be ascertained from the table that the costs are low for high volatilities and high for low volatilities. And neither of the two states is ideal to trade. To keep your cost affordable and volatility moderate, it is ideal to trade when the volatility is nearby the average values.

Furthermore, it is recommended to have strategies that enable the use of limit orders. Because trading with limit orders will completely cut off the slippage on the trade Nullifying it, the total cost will significantly reduce, which, in turn, will reduce the cost percentage as well. For example, it was observed that cost percentages were reduced by about 50% when the slippage was removed.

Categories
Forex Basic Strategies

Trading The ‘Three White Soldiers’ Candlestick Pattern (With RSI & EMA)

Introduction

The Three White Soldiers is a bullish candlestick pattern. This pattern is highly reliable and quite potent when it is found at a significant support area in a downtrend, which indicates sharp price reversals from a bear market to a bull market.

  1. Three White Soldiers pattern consists of three consecutive bullish candles; typically, this pattern should be traded when found at the end of a downtrend.
  2. Each candle should open and close higher than the previous candle.
  3. The candles must have small or no wicks. Because that indicates, the buyers managed to close the price of the currency pair at the high of a candle. If the third candle is smaller than the preceding two candles, it indicates that the buyers do not have much strength, and the market can easily print a new lower low.

Candles get printed on every trading chart in all the timeframe. But only the candlestick patterns in the right context of the market will be rewarded. The Three White Soldiers pattern that we are going to discuss is one of the most credible and reliable patterns we have come across. Trading legend Gregory L. Morris, in his book ‘Candlestick Charting Explained,’ said that the Three White Soldiers is extremely rewarding if traded correctly and it should never be ignored.

Trading Strategies

Three White Soldiers + RSI indicator

In this strategy, we have paired the Three White Soldiers pattern with the RSI indicator to identify good trading signals. RSI is a well-known oscillator, and it stands for the Relative Strength Index. The RSI indicator has a reading from 0 to 100. When the indicator line goes above the 70, it indicates the overbought conditions. When the indicator lines go below the 30 levels, it means the market is in an oversold condition.

Step 1 – First of all, find the Three White Soldiers pattern in a downtrend.

Step 2 – When market prints the Three White Soldiers, our next step is to check the RSI indicator. If the RSI indicator is at the oversold area and gives a sharp reversal, it means that both of the trading tools support the buying entry in any underlying currency pair.

In the example below, GBPNZD was in an overall downtrend. At first, market prints the Three White Soldiers pattern, and the RSI was at the oversold area. This condition indicates a potential trend reversal. We can see that the pattern candles are quite strong, and the RSI indicator also supported our strategy. This aspect creates an illusion for novice traders to take the trade immediately. However, it is not a good way to enter the trade. We suggest you always wait for 2-3 candles to confirm the stability of the pattern.

Step 3 – Step Loss & Take Profit

In this example, we have put the stop loss just below the low of the first candle of three green candles. When two leading trading tools indicate the same signal, always use smaller stops so that you can maximize your profits.

For this strategy, there are several ways to book the profit. We can close our position at a significant resistance area or when the RSI indicator reaches the overbought area. If your plan is to ride the longer moves, we suggest you closing your position when the market prints the Three Black Crows patterns. This pattern is the complete opposite of the Three White Soldiers pattern.

The example below belongs to the daily chart. Keep in mind that stronger the support/resistance area on the higher timeframe, more chances the market has to respect that area. In our example, the last time price respects the resistance line, so we decided to close our full position at a resistance area. Overall it was 1500+ pip move on the daily chart. These kinds of higher timeframe trades are suitable only for big investors.

Three White Soldiers + EMA

In this strategy, we have paired the Three White Soldiers pattern with the EMA to filter out the bad trading signals. EMA stands for Exponential Moving Average. The EMA is used to highlight the current trend and to spot the trend reversals. Trading signals can also be generated when the EMAs are read correctly. Generally, when the EMA goes above the price action, it indicates a sell signal, and when it goes below the price action, it indicates a buying signal.

Step 1 – Of course, the first step here is to identify the Three White Soldiers pattern on the charts.

Step 2 – When market prints, the Three White Soldiers, and EMA go below the price action, it indicates the buying signal.

In the below EURAUD weekly Forex chart, when the market prints the Three White Soldiers pattern, EMA was also below the price action. This indicates a potential price reversal of this currency pair. Even when both the pattern and EMA indicates the signal, we decided to wait for 3 to 4 candles to confirm the strength of the pattern. We can see that the market holds there for a couple of candles, which is a clear cut sign to go long on this pair.

Initially, the market goes higher for some candles, but it didn’t reach our major target. Our position goes into the loss a couple of times. Do not panic and lose trust in your strategy because the price didn’t hit the stop loss yet. Trading is a game of patience and only close your position when the market hit the stop loss or take profit. In this case, waiting patiently led to fruitful results as our trade hits the take profit.

Step 3 – Stop Loss & Take Profit

In the above chart, we have placed the stop loss above the exponential moving average because it works as a dynamic support/resistance to price action. We closed our full position when EMA goes above the price action.

Conclusion

Most of the times, Three White Soldiers pattern appears at the end of a downtrend. Sometimes it also prints after a lengthy consolidation phase. Although it is not a strong bullish sign if you want to trade the consolidation phase, always pair this pattern with other technical tools to filter out the negative signals. The volume is the most critical thing to enhance the reliability of the pattern when the market is in a consolidation phase.

Categories
Forex Assets

What Should You Know Before Trading The NZD/CAD Currency Pair

Introduction

NZDCAD is the abbreviation for the currency pair New Zealand dollar against the Canadian dollar. It is referred to as a cross-currency pair. Here, NZD is the base currency, and CAD is the quote currency. In this article, we shall be going over everything you need to know about this currency. Firstly, let’s get started by understanding what the value of NZDCAD depicts.

Understanding NZD/CAD

Comprehending the value of a currency pair is simple. The value of NZDCAD determines the Canadian dollars that must be paid to buy one New Zealand dollar. It quoted as 1 NZD per X CAD. For example, if the current value of NZDCAD is 0.86595, then 0.86595 CAD is required to purchase one NZD.

NZD/CAD Specification

Spread

Spread is the primary way through which brokers make revenue. They have a different price for buying and selling. The difference between these prices is called the spread. It varies from broker to broker and their execution type.

ECN: 1 | STP: 1.8

Fees

For every execution, there is a fee levied by the broker. This fee is also referred to as the commission on a trade. It is nil on STP accounts. And on ECN accounts, it is usually within 6 to 10 pips.

Slippage

Slippage is the variation in the price executed by you and the price you actually received. It happens on market orders. Slippage depends on two factors:

  • The volatility of the market
  • Broker’s execution speed

Trading Range in NZD/CAD

The trading range is a tabular representation of the pip movement in a currency pair in various timeframes. These values help in assessing the risk-on trade as it determines the minimum, average, and maximum profit that can be made on a trade.

Procedure to assess Pip Ranges

  1. Add the ATR indicator to your chart
  2. Set the period to 1
  3. Add a 200-period SMA to this indicator
  4. Shrink the chart so you can assess a large time period
  5. Select your desired timeframe
  6. Measure the floor level and set this value as the min
  7. Measure the level of the 200-period SMA and set this as the average
  8. Measure the peak levels and set this as Max.

NZD/CAD Cost as a Percent of the Trading Range

Cost a percentage of the trading range is an excellent application of the above table. By manipulating the values with the total cost, the variations in costs in different at different volatilities and timeframes can be calculated. For this, the ratio between the total cost and pip movement is found out and represented in percentage.

ECN Model Account 

Spread = 1 | Slippage = 2 |Trading fee = 1

Total cost = Slippage + Spread + Trading Fee = 2 + 1 + 1 = 4

STP Model Account

Spread = 1.8 | Slippage = 2 | Trading fee = 0

Total cost = Slippage + Spread + Trading Fee = 2 + 1.8 + 0 = 3.8

Comprehending the above tables

There are two variables here, namely, timeframe and volatility. By varying these two, the variation in the total cost is examined. Note that the higher the percentage, the higher is the cost on a trade and vice versa. From this, we can make out that the prices are high when the volatility is low. And prices are low when volatility is high. Also, as the timeframe widens, the cost decreases.

The Ideal way to trade the NZD/CAD

It is not ideal to trade when the volatility is high, as it is risky. It is also not the best choice to trade when the volatility is low, as the costs are high. So, to keep a balance between both volatility and cost, it is ideal to trade when the pip movement of the pair is around the average values.

Talking about timeframes, trading the 4H or the Daily would be great, as the cost is bearable, and the trade wouldn’t take too long to perform as well.

Another simple hack to reduce cost is by trading using limit/pending orders instead of market orders. This will significantly reduce costs on a trade because the slippage on the trade becomes 0. It is observed that the cost reduces by about 50% of the original value. Below is a table representing the cost percentage when the slippage is made zero.

Categories
Forex Assets

Information About The GBP/JPY Forex Currency Pair

Introduction

The Great Britain pound versus the Japanese yen is a cross-currency pair in the forex market. It is a widely traded pair with great liquidity and volatility. In this currency pair, GBP is the base currency, and JPY is the quote currency.

Understanding GBP/JPY

The market price of GBPJPY shows the units of yens required to purchase one pound. It is quoted as 1 GBP per X JPY. For example, if the value of GBPJPY is 143.82, then 143.82 yen are to be produced by the trader to buy one pound.

GBP/JPY Specification

Spread

Spread is the difference between the bid price and the ask price set by the broker. These prices vary from broker to broker and type of account model as well. The approximate spread on ECN and SPT accounts is mentioned as follows.

ECN: 0.7 | STP: 1.6

Fees

There is a fixed round-trip fee on every trade a trader takes. On ECN accounts, the spread is around 6 to 10 pips. And on STP accounts, there is no fee as such. However, though there is no fee on STP accounts, the total fee is still compensated with the high spread on it.

Slippage

Slippage is another parameter that adds up to the total fee. It is the difference between price executed by the trader and price he actually received from the broker. This happens solely due to the change in volatility of the market and the broker’s execution speed.

Trading Range in GBP/JPY

The trading range is a pip depiction tool that determines the minimum, average, and maximum pip movement in a different timeframe. This volatility table is pretty useful in analyzing the amount of risk that is involved in a trade. For example, if the max pip movement on the 4H is 60 pips, then a trader can get an idea that he can gain/lose a max of $552.6 in a time frame of 4 hours.

Procedure to assess Pip Ranges

  1. Add the ATR indicator to your chart
  2. Set the period to 1
  3. Add a 200-period SMA to this indicator
  4. Shrink the chart so you can assess a large time period
  5. Select your desired timeframe
  6. Measure the floor level and set this value as the min
  7. Measure the level of the 200-period SMA and set this as the average
  8. Measure the peak levels and set this as Max.

GBP/JPY Cost as a Percent of the Trading Range

The cost as a percent of the trading range is again the volatility but combined with total cost on a trade. It is a tabular representation of the cost of trading in varying timeframes and volatilities. The percentages are obtained simply by finding the ratio between the total cost and volatility.

ECN Model Account

Spread = 0.7 | Slippage = 2 |Trading fee = 1

Total cost = Slippage + Spread + Trading Fee = 2 + 0.7 + 1 = 3.7

STP Model Account

Spread = 1.6 | Slippage = 2 | Trading fee = 0

Total cost = Slippage + Spread + Trading Fee = 2 + 1.6 + 0 = 3.6

The Ideal way to trade the GBP/JPY

The magnitude of the percentages basically determines how high or how low the costs are for each trade. If the percentage is high, the costs are high. If they are low, the costs are low. The very first observation that can be made is that the costs are high in the min column comparative to the average column and maximum column. Hence, the costs are high for low volatile markets, and low for high volatile markets. But, it is not ideal to trade in either of these markets. The best time to get into the pair is when the volatility is around the average values. As far as the timeframes are concerned, the cost decreases as the width of the timeframe increases.

Placing limit orders is another way to minimize your cost significantly. Because this will not take slippage into consideration for calculating the total costs. Thus, the total cost reduces greatly. An example of the same is illustrated below.

Hence, we can see that the percentages have reduced by around 50% or so.

Categories
Forex Course Guides

Forex Course 2.0 – Complete Guide

Hello there,

We hope you guys are following the course well. We have done with Course 2.0, and we quickly want to sum up the concepts we have discussed in this course. Also, this article will act as a guide for you in finding any particular articles or for a quick overall revision. Basically, this is a quick navigation guide of Forex Course 2.0.

We have started this course by understanding one of the most important parts of the Forex Industry – Brokers. We also learned the different types of brokers, tips to pick the right broker, and whom to stay away from. We have also understood the different types of analysis that are used by retail traders like us to forecast the price of a currency in the Forex Market. Below is the link for each of the lessons we have published.

Brief History and Introduction to The Forex Brokers – Link

Types 0f Brokers in the Foreign Exchange Market – Link 

Two Types of ‘No Dealing Desk’ Brokers – Link

Understanding the Concept of Spreads in Forex – Link

Two Different Types Of Spreads In The Forex Market – Link

Picking A Genuine Forex Broker 101 – Link

How to stay away from the Forex Bucket Shops – Link

Steps Involved In Opening A Forex Trading Account – Link

Analyzing The Forex Market – Fundamental Analysis – Link

Analyzing the Forex Market – Technical Analysis – Link

Analyzing the Forex Market – Sentimental Analysis – Link

Which is the best way to analyze the market? – Link

So with that, we have ended our course 2.0. The upcoming course 3.0 is the most valuable course we will be providing at Forex Academy. The entire course is going to deal with the Technical Analysis right from the fundamentals. This course is designed by the top price action traders in the industry, and we are super excited to start rolling out this course for our readers. Are you excited too? Stay tuned!

We hope you find this comprehensive guide useful. Let us know if you have any questions regarding Course 2.0 in the comments below. Cheers!

Categories
Forex Assets

Everything You Should Know About GBP/NZD Forex Pair

Introduction

GBPNZD is the abbreviation for the Great Britain pound against the New Zealand dollar. Here, the pound is the base currency, while the New Zealand dollar is the quote currency. Though it is not a major currency, it has considerable volatility and liquidity.

Understanding GBP/NZD

The value of GBPNZD represents the value of NZD equivalent to one pound. It is quoted as 1 GBP per X NZD. For example, if the value of GBPNZD is at 1.9677, then to buy one pound, the trader has to pay 1.9677 NZ dollars for it.

GBP/NZD Specification

Spread

Spread is the medium through which brokers generate revenue. They set two different prices for buying and selling a currency pair. The difference between the prices is their profit. This difference is referred to as the spread. The prices usually vary from type of account model.

ECN: 1.2 | STP: 2.1

Fees

The fee is basically the commission on each trade a trader must pay. Typically, there is no fee on STP accounts, but a small fee on ECN accounts. The fee is usually between 6 and 10 pips.

Slippage

Slippage takes place when positions are opened/closed using market orders. The trader wishes to pay a specific price, but in reality, he receives a different price. And the difference between these two prices is called slippage.

Trading Range in GBP/NZD

The trading range is the depiction of the pip movement of a currency pair on different timeframes. With it, one can analyze how many dollars they can win/lose in a given timeframe. For example, if the average pip movement on the 1H timeframe is 30 pips, then you will either be in a profit of $198.6 or a loss of $198.6 in an hour. Knowing this, a trader can plan their lot sizes accordingly.

Procedure to assess Pip Ranges

  1. Add the ATR indicator to your chart
  2. Set the period to 1
  3. Add a 200-period SMA to this indicator
  4. Shrink the chart so you can assess a large time period
  5. Select your desired timeframe
  6. Measure the floor level and set this value as the min
  7. Measure the level of the 200-period SMA and set this as the average
  8. Measure the peak levels and set this as Max.

GBP/NZD Cost as a Percent of the Trading Range

Having knowledge of the cost of the trade is necessary. Note that the cost varies based on the volatility and the timeframe traded. So, it becomes vital to know when the right moments to enter the market are. Below are two tables illustrating the total costs as a percentage for varying timeframes and volatility.

ECN Model Account

Spread = 1.2 | Slippage = 2 |Trading fee = 1

Total cost = Slippage + Spread + Trading Fee = 2 + 1.2 + 1 = 4.2

STP Model Account

Spread = 2.1 | Slippage = 2 | Trading fee = 0

Total cost = Slippage + Spread + Trading Fee = 2 + 2.1 + 0 = 4.1

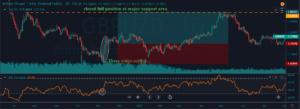
The Ideal way to trade the GBP/NZD
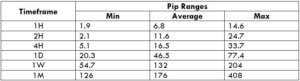
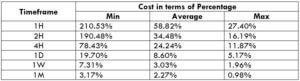
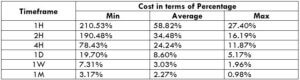
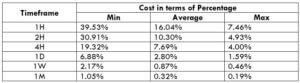
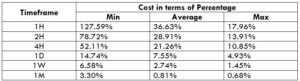
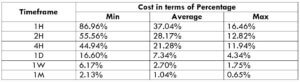
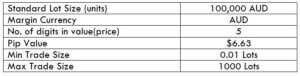
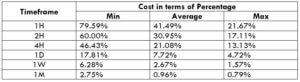
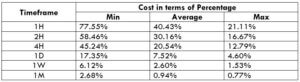
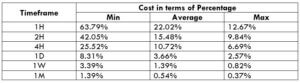
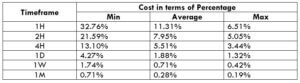
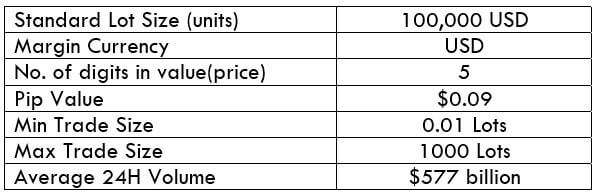
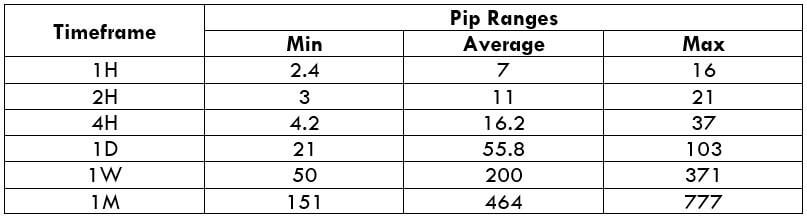
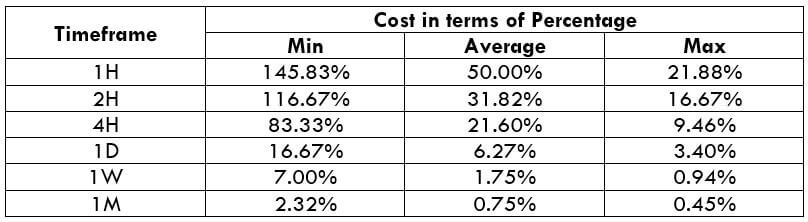
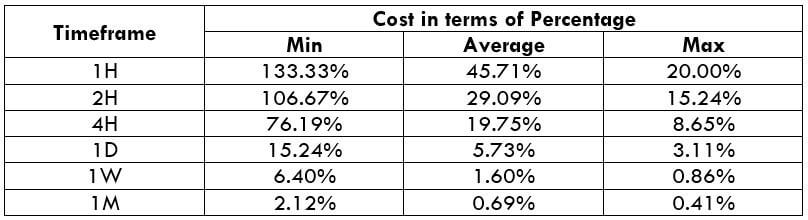
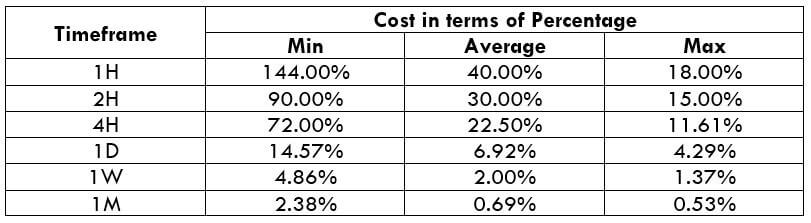
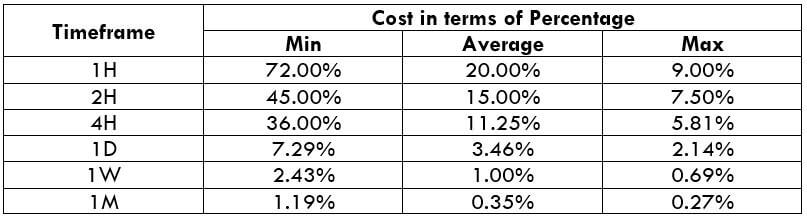
The above tables show that the costs are high in the min column and low in the max column. The higher the value of the percentage, the high is the cost. So, this means that the costs are high for low volatility markets and vice versa. It is neither ideal to trade during low volatility nor during high volatility. To have an equilibrium between the costs and the volatility, it is best to enter the market when the volatility is around the average mark.

Slippage is a parameter for calculating the total cost. It has a great weight in the total cost. However, there is a way to minimize and nullify it. This can be simply be done by trading using limit orders instead of market orders.

Categories
Forex Assets

Exploring The Basics Of GBP/CAD Forex Pair

Introduction

GBPCAD pronounced as ‘pound cad” is minor/cross currency pair in forex. GBP refers to Great Britain Pound, and CAD refers to the Canadian Dollar. Since GBP is on the left, it becomes base currency, and CAD on the right becomes the quote currency.

Understanding GBP/CAD

The current market price has of GBPCAD is not similar to the prices in the stock market. The value of GBPCAD represents the value of CAD equivalent to one GBP. It is simply quoted as 1 GBP per X CAD. For example, if the value of GBPCAD is 1.7192, then 1.7192 Canadian dollars are required to purchase one pound.

GBP/CAD Specification

Spread

Spread is the difference between the bid price and the ask price in the market. These values are controlled by the brokers. So, it differs from broker to broker as well as the type of account.

ECN: 0.8 | STP: 1.9

Fees

There is a small levied by the broker on every trade a trader takes. There are a few pips of fee on ECN accounts, while the fee is nil on STP accounts. The fee is usually between 6 to 10 pips.

Slippage

Slippage is the difference between the trader’s demanded price and the real executed price. Slippage happens when orders are executed by the market price. It happens solely due to the volatility of the market and the broker’s execution speed.

Trading Range in GBP/CAD

A trading range is the representation of the pip movement of GBPCAD in different timeframes. These values are helpful in getting a rough idea of the profit/loss that can be made from the trade in a given timeframe. For example, if the min pip movement on the 1H timeframe is 3 pips, then a trader can expect to gain/lose at least $22.38 when one standard lot is traded.

Procedure to assess Pip Ranges

  1. Add the ATR indicator to your chart
  2. Set the period to 1
  3. Add a 200-period SMA to this indicator
  4. Shrink the chart so you can assess a large time period
  5. Select your desired timeframe
  6. Measure the floor level and set this value as the min
  7. Measure the level of the 200-period SMA and set this as the average
  8. Measure the peak levels and set this as Max.

GBP/CAD Cost as a Percent of the Trading Range

Now that we know how much profit/loss can be made within a given time frame let us also calculate the cost on each trade by considering the volatility and timeframe. For this, the ratio between the total cost and volatility calculated and expressed in percentages. The magnitude of these percentages will then be used to determine the timeframe with marginal costs.

ECN Model Account 

Spread = 0.8 | Slippage = 2 |Trading fee = 1

Total cost = Slippage + Spread + Trading Fee = 2 + 0.8 + 1 = 3.8

STP Model Account

Spread = 1.9 | Slippage = 2 | Trading fee = 0

Total cost = Slippage + Spread + Trading Fee = 2 + 1.9 + 0 = 3.9

The Ideal way to trade the GBP/CAD

From the above two tables, it can be ascertained that the percentages largest on the min column, moderate on the average column, and least on the max column. The higher the value of percentages, the higher is the cost of the trade. So with this, we can conclude that the costs are high during low volatility, and low during high volatility. Similarly, the costs are high on lower timeframes and considerably low on higher timeframes. Hence, to keep volatility and cost at a balance, it ideal to trade when the pip movement in the market is around the average values.

Market orders bring in an additional cost in the trade. To eliminate this, one can trade using limit orders. This will set the slippage value to 0, and eventually, reduce the total cost on the trade by a significant amount. An example supporting the statement is illustrated below.

Total cost = Spread + trading fee + slippage = 0.8 +1 + 0 = 1.8

Categories
Forex Assets

Fundamentals Of Trading The GBP/AUD Currency Pair

Introduction

GBPAUD is an abbreviation for the Great Britain pound and the Australian dollar. This cross currency pair is widely traded with high volume in the forex market. In this pair, GBP is the base currency, and AUD is the quote currency.

Understanding GBP/AUD

The value of GBPAUD in the market is the value of AUD equivalent to one pound.GBPAUD is quoted as 1 GBP per X AUD. For example, if the value of GBPAUD is 1.8505, then these many Australian dollars are to be given to receive one pound.

GBP/AUD Specification

Spread

The prices for buying and selling a currency pair are different. To buy, one must refer to the ask price; and to sell, one must refer to the bid price. The difference between the bid price and the ask price is called the spread. The spread varies from the type of account model.

ECN: 0.7 | STP: 1.7

Fees

Apart from the spread, brokers levy fee on every round-trip trade. This fee is fixed in for every trade. However, it varies from broker to broker. Usually, there is no fee on STP accounts. On ECN accounts, there is a fee of a few pips.

Slippage

Slippage is the difference between the price when the trader entered the market order and the price he was actually given. Most of the time, there is a variation in the prices. This difference could be in favor of or against the trader. There are two factors responsible for it. One, the volatility of the market, and two, broker’s execution speed.

Trading Range in GBP/AUD

The trading range of currency pairs simply depicts the volatility of the pair in a different timeframe. In other terms, the trading range represents the minimum, average, and maximum pip movement in different timeframes. These values are helpful in assessing one’s risk, as well as making trades much cost-effective.

Procedure to assess Pip Ranges

  1. Add the ATR indicator to your chart
  2. Set the period to 1
  3. Add a 200-period SMA to this indicator
  4. Shrink the chart so you can determine a large time period
  5. Select your desired timeframe
  6. Measure the floor level and set this value as the min
  7. Measure the level of the 200-period SMA and set this as the average
  8. Measure the peak levels and set this as Max.

GBP/AUD Cost as a Percent of the Trading Range

Cost as a percent of the trading range is a very supportive tool in analyzing the cost of a trade, in different timeframes, and at different volatilities. This is done by finding the ratio of the total cost and volatility values and then expressing it as a percentage. The comprehension of the below tables shall be discussed in the subsequent topic.

ECN Model Account 

Spread = 0.7 | Slippage = 2 |Trading fee = 1

Total cost = Slippage + Spread + Trading Fee = 2 + 0.7 + 1 = 3.7

STP Model Account

Spread = 1.7 | Slippage = 2 | Trading fee = 0

Total cost = Slippage + Spread + Trading Fee = 2 + 1.6 + 0 = 3.7

The Ideal way to trade the GBP/AUD

Note that the higher the magnitude of the percentage, the higher is the cost of the trade. From the table shown above, we can observe that the values are highest on the min column and lowest on the max column. This means that the costs are higher when the volatility of the market is low and vice versa. Reading it horizontally, the cost gets lower as the timeframe widens. Hence, the ideal to trade when the pip movement of the currency pair is near the average values. This will ensure decent volatility by keeping the costs minimal.

Another effective way to reduce the total cost is by trading using limit orders, not market orders. Doing so, the slippage on the trade will shrink to zero. The following table shows the costs of the GBP/USD with no sleppage, for the same market conditions as on the preceding tables.

Total cost = Spread + trading fee + slippage = 0.7 +1 + 0 = 1.7

Hence, from the above table, it can be inferred that the cost percentages have a significant value.

Categories
Forex Course

47. Which is the best way to analyze the market?

Introduction

Now with the knowledge of three type analysis, let us determine the best type of analysis suitable for you.

Before that, let’s brush up through the previous lessons.

✨ Fundamental Analysis – This is a technique to analyze the market by considering the factors which affect the supply and demand of security (currency). Some of the fundamental indicators include interest rates, inflation, GDP, money supply, manufacturing PMI, etc.

✨ Technical Analysis – It is the analysis of the market by understanding the historical price movements of the currency. In other words, it is the study of price movements using technical tools like candlestick patterns and indicators.

✨ Sentimental Analysis – This type of analysis involves understanding the real essence of trading. Here, we get into the shoes of the bug players and determine if they’re buying or selling.

Out of these three, which do you think can help you find success in trading? Well, as a matter of fact, once can succeed in trading only if they have the knowledge of all these three types of analysis. Let us understand with an example of the hurdles that can come your way if you focus only on one type of analysis.

Let’s say a trader named Tim trade only on technical analysis, and he found a good buying opportunity on EUR/USD. But, after he hits the buy, he sees the market falling straight down 100 pips against him due to some news he wasn’t unaware of. This situation brings in emotions in him by which he ends up closing the trade. However, later in the day, he observes that the market ends up going in the direction he predicted.

Here, though his analysis was right, the obstacles like news and emotions took over the technical analysis and put him in a loss. Hence, from this, we can conclude that technical analysis, fundamental analysis, and sentimental analysis are interdependent on each other.

How to structure your analysis?

Above, we have discussed how crucial and dependent all three types of analysis are. However, there are traders in the industry who have expertise only in a kind of analysis but still manage to grow their accounts significantly. Below are some of the tips on how one must structure their analysis, considering they specialize in technical analysis.

  • Before you begin to analyze the market, determine if there is any upcoming news on the currency, you’re looking to trade. And it is recommended to stay away from the currency pairs which have fundamental news coming in.
  • Once you determine the currency pair you’re going to trade, you can begin your technical analysis on that pair.
  • And most importantly, before you place the trade, you must have a complete plan on all the situations that can possibly occur when you’re in the trade, including position sizing, stop-loss levels, and profit-taking levels.  Because, once you enter the trade, emotions take over technical analysis which can make you take incorrect trading decisions.

Therefore, following these three simple steps can drastically bring a change in the way you analyze the markets. Cheers.

[wp_quiz id=”57535″]
Categories
Forex Assets

What Should You Know Before Trading The GBP/CHF Currency Pair?

Introduction

GBPCHF is the abbreviation for the Great Britain pound and the Swiss franc. Since USD is not involved in this pair, it is called a minor currency pair. However, there is an excellent liquidity and volatility in this pair. In this pair, GBP is the base currency, and CHF is the quote currency. GBPCHF is often referred to as “pound Swiss franc.”

Understanding GBP/CHF

The value of GBPCHF determines the Swiss francs required to purchase one pound. It is quoted as 1 GBP per X CHF. For example, if the value of GBPCHF is 1.2740, then one needs to pay 1.2740 Swiss francs to buy a pound.

GBP/CHF Specification

Spread

Spread is the difference between the bid price and the ask price in the market. The bid price is the price used for shorting, and the bid price is the price used for buying a currency pair. These prices differ from broker to broker as well as the account type.

ECN: 0.8 | STP: 1.6

Fees

For every trade a trader takes, there is a fee associated with it. This fee is basically the commission charged by the broker. This fee varies from broker to broker. Note that there is no fee on STP accounts, and on ECN accounts, the fee is around 6 to10 pips.

Slippage

Slippage in trading is the difference between the price requested by the trader and the price given by the broker. Due to variation in volatility and the broker’s execution speed, it is not quite possible to get the exact intended price. Slippage happens only on market orders.

Trading Range in GBP/CHF

Knowing the number of pips the currency pair moved in a given timeframe is a good add-on to a trader’s analysis. This will help them get an idea of the profit/loss that can be made in a specified amount of time. For example, if the average pip movement on the 1D timeframe is 50 pips, then a trader can expect to gain or lose $517.5 (50 pips x 10.35 value per pip).

Procedure to assess Pip Ranges

  1. Add the ATR indicator to your chart
  2. Set the period to 1
  3. Add a 200-period SMA to this indicator
  4. Shrink the chart so you can determine an extensive period
  5. Select your desired timeframe
  6. Measure the floor level and set this value as the min
  7. Measure the level of the 200-period SMA and set this as the average
  8. Measure the peak levels and set this as Max.

GBP/CHF Cost as a Percent of the Trading Range

The cost as a percent of the trading range depicts the magnitude of the variation in the cost in different timeframes for different variable volatility. The percentages are useful in determining the ideal time to enter into this currency pair with marginal costs. Below are the tables representing the cost percentages for minimum, average, and maximum volatility.

ECN Model Account 

Spread = 0.8 | Slippage = 2 |Trading fee = 1

Total cost = Slippage + Spread + Trading Fee = 2 + 0.8 + 1 = 3.8

STP Model Account

Spread = 1.6 | Slippage = 2 | Trading fee = 0

Total cost = Slippage + Spread + Trading Fee = 2 + 1.6 + 0 = 3.6

The Ideal way to trade the GBP/CHF

The lower the percentage, the lower are cost on the trade. In the table, we can infer that the costs are on the lower side in the max column. This implies that the cost of the trade is less when the volatility of the market is low and vice versa. Now, when it comes to the best time to trade this pair, it is ideal to pick at times when the volatility is decent, and the costs are affordable. For example, a 1D trader may trade during those times when the volatility is around 100 pips.

Moreover, the total cost of the trade can be reduced by entering and exiting trades using limit/pending orders. This way, the slippage on the trade will be fully cut off. The impact on the cost percentage when slippage is made 0 is shown below.

Total cost = Spread + trading fee + slippage = 0.8 +1 + 0 = 1.8

From the above table, it is evident that the costs have reduced by over 50% or so. Hence, it is preferable to trade using limit orders rather than market orders.

Categories
Crypto Guides

Some Of The Top Use Cases of Blockchain In Real Life – Part 1

Introduction

Blockchain is a new revolutionary technology. Its features have guided technologists to look at the technology efficiently and innovatively. Before getting right into the use cases of blockchain, let’s see some of the primary technical features of this technology.

The technical features include,

  • The use of distributed ledger technology
  • Security through cryptography
  • Ability to have smart contracts logic embedded into it

With these features, there are several compelling uses cases of blockchain that we believe will reduce inefficiency and unlock more valuable areas in the existing industries. Here are some of the most compelling use cases of this technology.

💰 Asset Tokenization

Without any doubt, the most compelling use cases of blockchain are the application in financial services and asset tokenization in finance in particular. Using blockchain technology, illiquid assets can easily be converted into its tokenized form and can be efficiently fractionalized. It can even be traded and settled on-chain. In this way, it does not have to go through the lengthy process of clearing and settlement processes. TOkenization will also unlock liquidity for small business owners, entrepreneurs, and real estate owners.

Alphapoint, Polymath, Harbor, Smart Valor are working on a platform for asset tokenization.

🚚 Supply Chain Management

Supply chain management is another great use case of blockchain technology. Transparency in the supply chain is one of the biggest problems firms tend to face. But, one of the features of blockchain eliminates this issue. Blockchain allows anyone in the network to access the database and act as a single source of truth referred to as consensus. From a consumer’s point of view, blockchain can help find the genuineness of products that are claimed to be.

Vechain and Origin Trail are examples that are currently working in this domain.

Energy Market

A few large corporations control the energy market in any given geography. To decentralize the market, blockchain technology can be of great use. If electricity is traded like any other commodity, prices in the commodity market would be affected by forces like demand and supply as well, instead of being a fixed regulated price.

Power Ledger and Grid+ are examples of peer to peer energy trading.

🚑 Healthcare

In the present state of healthcare technology, patient data is held across different institutions in legacy silos in several different formats and standards, making sharing of information ill-suited for the modern world. Although the healthcare industry has improved a lot over the years, blockchain technology can make the situation better. This generation requires data to be available to the users instantly. And Blockchain can get this into play. Blockchain technology can record patient information on a distributed ledger, which allows different institutions to access data as a single source of truth. Also, with blockchain, the access to patient’s health records is more secure as it is encrypted.

Medicalchain is an example of a healthcare data exchange platform.

These are only some of the most compelling use cases for blockchain technology. In our upcoming article, we will be discussing the applications of this groundbreaking tech in different other industries. So, stay tuned!

Categories
Forex Course

46. Analyzing the Forex Market: Sentimental Analysis

Introduction

Have you come across the saying that 95% of the traders lose money in Forex, and only a handful of 5% succeed? As a matter of fact, this statement is entirely true. Though trading in the Forex market is no different from doing business in the real market, most of the Forex traders find it challenging to succeed in trading. This is because, in the real world business, there is hardly any relation between business and emotions, whereas, the Forex market is closely related to human psychology.

Many traders trade based only on fundamental analysis or technical analysis and ignore the existence of the sentiment involved in trading. This is the reason we have the concept of 95% and 5%.

Why is there sentiment entailed in trading?

To answer this particular question, we’ll have to understand the core basics of trading.

Firstly, what is trading? Trading, according to the textbooks, is the process of buying and selling of products. Or in simple terms, it is the process where a seller sells his products to a buyer, or a buyer buys products from a seller.

Now, the point one must note here is that to buy or sell a product, both parties (buyer and seller) are obligatory. Without a buyer, the existence of a seller is useless, and without a seller, the presence of a buyer is pointless.

And this above concept is the answer to the above question. Let us understand how.

There is an end number of traders trading the Forex market. The logic for buying and selling is the same as the real-world market. That is, a trade cannot be completed without the presence of both parties. For example, if you want to buy a currency pair, then you mandatorily need a seller to sell it to you. And if there are no sellers in the market to sell it at your desired price, then your buy order will remain pending (incomplete).

Broadly speaking, traders can be segregated into two types. The first set of traders includes large banks, hedge funds, mutual funds, and big-time investors who move the market. And the second set comprises small retail traders who do not have the capability (enough capital) to drive the market.

How do big players always win?

Big players are the ones who always win in the market. And they make this possible by bringing in emotions in trading. Let us understand this with an example.

Let’s say a currency pair is in an uptrend from a month. At this point in time, what do you think the whole world is thinking? As obvious as it gets, most retail traders are looking at it as a buy. Now, since everyone (big players and retail traders) are looking to buy, there is no seller to sell it to them. This situation, in turn, creates loads of pending orders in the market. So, the masterminds (big players) start to become the sellers in the market to the retail buyers. And this continuous selling by the big players causes the market to drop pretty drastically.

Seeing this drastic fall in the market, all retail traders who were buying get stopped out, and the rest begin to look it as a sell. And once the retail traders start to sell, the big players buy it from these sellers (retail traders). Hence, from this, the market again starts to head north. This is how big players bring in emotion in the minds of the public, manipulate them in the market.

Finally, we can conclude by saying psychology plays a major rule when it comes to trading in the Forex market. And the sentimental analysis is all about learning more about psychological trading. So in our further lessons, we will be discussing a lot more on these topics.

[wp_quiz id=”57167″]
Categories
Forex Assets

Understanding The EUR/JPY Asset Class

Introduction

The Euro area’s euro against the Japanese yen, in short, is termed as EURJPY. This pair, too, like the EURCHF, EURNZD, EURCAD, EURGBP, etc. is a minor or cross currency pair. It is one of the most traded currency pairs in the forex market. Here, the EUR is the base currency, and JPY is the quote currency. The value of this pair is quoted in terms of the quote currency.

Understanding EUR/JPY

This currency pair is precisely quoted as 1 EUR per X JPY. In simple terms, the value determines the units of the quote currency (JPY) required to buy one unit of the base currency (EUR). For example, if the market value of EURJPY is 121.00, it basically means that these many yen are required to purchase one euro.

EUR/JPY Specification

Spread

Spread is the difference between the bid price and the ask price set by the broker. This value is not constant and varies from broker to broker. It also varies on the type of account model.

Spread on ECN model: 0.6

Spread on STP model: 1.5

Fees

Spread is not the only way through which brokers generate their revenue. They charge some fee (commission) on each trade as well. Fees again vary from broker to broker and account model. Typically, there is no fee on an STP account. However, there are a few pips or fees on an ECN account as their spread is lesser than an STP account.

Slippage

Slippage is the difference between the trader’s asked price and the actual price given to him. Two factors majorly affect slippage on a trade; one, the volatility of the market, and two, broker’s execution speed. The slippage is usually within 0.5 to 5 pips. For major currencies, the slippage is much lower.

Trading Range in EUR/JPY

The trading range is the illustration of the minimum, average, and the maximum number of the pips the currency pair has moved in a given time frame. These values help assess the profit/loss potential of a trade. For instance, if the max volatility on the 1H is 10 pips, then one can expect to win or lose a maximum of $92 (10 pip x 9.20 value per pip) in an hour or two.

Procedure to assess Pip Ranges

  1. Add the ATR indicator to your chart
  2. Set the period to 1
  3. Add a 200-period SMA to this indicator
  4. Shrink the chart so you can determine an extensive period
  5. Select your desired timeframe
  6. Measure the floor level and set this value as the min
  7. Measure the level of the 200-period SMA and set this as the average
  8. Measure the peak levels and set this as Max.

EUR/JPY Cost as a Percent of the Trading Range

In addition to assessing the profit/loss in a timeframe ahead of time, we can use these values in determining the cost variation in different timeframes and volatility as well. The cost as a percent of the trading range tells the min, average, max costs by considering the timeframes and volatility as its variables.

ECN Model Account 

Spread = 0.6 | Slippage = 2 | Trading fee = 1

Total cost = Slippage + Spread + Trading Fee = 2 + 0.6 + 1 = 3.6

STP Model Account

Spread = 1.5 | Slippage = 2 | Trading fee = 0

Total cost = Slippage + Spread + Trading Fee = 2 + 1.5 + 0 = 3.5

The Ideal way to trade the EUR/JPY

Above are the costs of each trade in terms of percentages. Note that they do not represent the actual cost on trade in terms of dollars, but are magnitude values which can be used for comparing with other values. The higher the magnitude of the percentage, the higher is the cost on the trade for that particular timeframe and volatility. From the tables, it can be ascertained that the values are highest on the min column and lowest on the max column. This, in turn, implies that the costs are higher when the volatility is low and vice versa. Talking about the timeframe, the costs are high on the lower timeframes and low on the higher timeframes. So, a day trader may preferably trade on the 2H/4H when the volatility is around the average values. And long-term traders may trade the 1W/1M whatsoever be the volatility of the market.

Furthermore, a trader may reduce their costs by entering and exiting trades using limit order instead of market orders. This will completely erase the slippage on the trade. An example of the same is given below.

Total cost = Spread + trading fee = 0.6 +1 = 1.6

Categories
Forex Assets

Everything About EUR/CAD Currency Pair

Introduction

EURCAD is the abbreviation for the currency pair Euro area’s euro and the Canadian dollar. This is a cross-currency pair, as it does not involve the US dollar. In EURCAD, EUR is the base currency, and CAD is the quote currency. The price of this pair basically tells the value of CAD w.r.t EUR.

Understanding EUR/CAD

The current market price of EURCAD determines the required Canadian dollars to purchase one euro. It is quoted as 1 EUR per X CAD. For example, if the CMP of EURCAD is 1.4700, it is as good as saying that 1.4700 CAD is needed to buy one EUR.

EUR/CAD Specification

Spread

The algebraic difference between the bid price and the ask price set by the broker is known as the spread. Spread varies from time to time and broker to broker. The approximate spread value on an ECN account is 0.8, and on an STP account is 1.8.

Fees

For every position that a trader opens, there is some fee associated with it. And it depends on the type of account model. It is seen that there is no fee on STP accounts and a few pips on ECN accounts.

Slippage

Slippage is terminology in trading, which, by definition, is the difference between the trader’s wished price and the real executed price. That is, the trader does not get the exact price he had intended for. There is some variation due to the volatility of the market and the broker’s execution speed. It usually varies from 0.5 to 5 pips on these minor currency pairs. The slippage is typically lesser on major currency pairs.

Trading Range in EUR/CAD

The trading range is an illustration of the minimum, average, and maximum pip movement in EURCAD. It determines the volatility of the market. The volatility of the market is a vital piece of information in trading, as one can assess the time that can be taken on each trade. And by applying more variables to it, one can determine the cost varies on the trade as well.

Procedure to assess Pip Ranges

  1. Add the ATR indicator to your chart
  2. Set the period to 1
  3. Add a 200-period SMA to this indicator
  4. Shrink the chart so you can assess a large time period
  5. Select your desired timeframe
  6. Measure the floor level and set this value as the min
  7. Measure the level of the 200-period SMA and set this as the average
  8. Measure the peak levels and set this as Max.

EUR/CAD Cost as a Percent of the Trading Range

Cost as a percent of the trading range is a simple yet very effective application of the above volatility table. There is a cost on every trade you take. The total cost of a trade is the sum of slippage, spread, and trading fee. This total cost is divided by the volatility values and is expressed in terms of a percentage. And the percentage values are used to figure out the best times of the day to enter and exit a trade with marginal cost.

ECN Model Account 

Spread = 0.8 | Slippage = 2 | Trading fee = 1

Total cost = Slippage + Spread + Trading Fee = 2 + 0.8 + 1 = 3.8

STP Model Account

Spread = 1.8 | Slippage = 2 | Trading fee = 0

Total cost = Slippage + Spread + Trading Fee = 2 + 1.8 + 0 = 3.8

The Ideal way to trade the EUR/GBP

To determine the ideal way of trading the EURCAD, let us first comprehend what the percentage means.

High percentage => High cost

Low percentage => Low cost

Min column => Low volatility

Max column => High volatility

From the table, we can infer that the percentages are high in the min column and low for the max column. So,

Min column => High percentage

Thus, Low volatility => High cost

Max column => Low percentage

Thus, High volatility => Low cost

It is not ideal during low volatility as costs are high. Also, trading during high volatility is not a good idea as it is quite risky. Hence, to have a balance between both volatility and cost, it is ideal to trade when the pip movement on the currency pair is at the average values.

Another simple hack to reduce the costs is to trade using limit orders instead of market orders. Doing so, the slippage will be automatically cut off from the trade, and the total cost will significantly reduce.

Categories
Forex Course

45. Analyzing the Forex Market – Technical Analysis

A way to analyze the markets other than fundamental analysis is technical analysis. In this lesson, we shall exactly understand what technical analysis is, and also the different techniques to analyze the market using technical analysis.

What Is Technical Analysis?

In simple terms, technical analysis can be defined as the study of price movements.

Unlike fundamental analysis, where people study the factors which affect the supply and demand of the market, technical analysis involves the study of the historical price movements and the present market condition.

Why should Technical Analysis be used?

Let us answer this question by bringing up an analogy.

The first thing one must understand about the market is that the forex market business is no different from a real-life business.

For instance, let’s say there’s a car dealer and they have been selling one particular car for six months by varying the prices every month. And an illustration of the sales report is given below.

Now, from the above table, can you predict what could be priced in the near future? If yes, then you can consider yourself as a technical analyst, as this is what technical analysts do.

Consider the above table. We can see that initially, the car was priced at $20,000, and 9,000 units of the car were sold. Next month, the owner price reduced by $1,000, and the sales increased by 1,000 units. Seeing this demand in the car, the owner increases the price to $25,000. But, this time the sales drop down to 1,000 units. So, the car owner reduces the price back to $19,000. And he observes that the sales increase from 1,000 to 10,000. Later, he again raises the price to $26,000.

Now, by analyzing the past price movements, we can predict with a high probability that the price will reduce yet again, as the previous time the price came to $25,000, the price dropped drastically. Thus, looking at the price of the car in June, we can see that the price did fall to $15,000.

Therefore, the above example, in a nutshell, is referred to as Technical Analysis.

Switching back to the Forex market, the analysis is done similarly. The only difference being the Forex market involves the trading of currency pairs, and the real market consists of the buying and selling of products.

Hence, from this, we can conclude that a market moves as per the historical price movements. The above example is just to give you a gist of how technical analysis work. There are many more complex ways to accurately predict the market using technical analysis. Price Action traders do their technical analysis using different types of charts (like candlesticks, bars, lines, area, etc.), timeframes, and indicators.

Hence, this brings us to the end of this lesson. In the lessons coming forward, we shall be discussing tons of stuff related to technical analysis. So, stay tuned.

[wp_quiz id=”56618″]
Categories
Forex Assets

Asset Analysis – EUR/NZD Forex Currency Pair

Introduction

EURNZD is the abbreviation for the Euro area’s euro and the New Zealand dollar. It is classified under the minor/cross currency pairs. In EURNZD, EUR is the base currency pair, and NZD is the quote currency. As a matter of fact, in all currency pairs with euro in it, EUR is the base currency.

Understanding EUR/NZD

The value of this pair defines the New Zealand dollars required to purchase one euro. It is quoted as 1 EUR per X NZD. For example, if the value of value in the market is 1.6650, it implies that to buy one euro, the trader has to pay 1.6650 New Zealand dollars for it.

EUR/NZD Specification

Spread

Spread is a very popular term in the forex industry. This is the way through which the broker makes revenue. Spread is simply the difference between the bid price and the ask price. It differs from the type of account model. The spread on ECN and STP is given below.

ECN: 0.9 | STP: 1.7

Fees

For every position that a trader opens, there is some fee associated with it. And it depends on the type of account model. It is seen that there is no fee on STP accounts and a few pips on ECN accounts.

Slippage

Slippage is the difference between the price the trader had demanded and the actual price the trade was executed. Slippage happens when trades are taken using market orders. Slippage has a significant load on the total cost of the trade. More on this shall be discussed towards the end of this article.

Trading Range in EUR/NZD

A part of the analysis in trading is knowing the volatility of the market. Volatiltiy will give an close idea on the number of pips the currency pair will move in a given timeframe. The trading range depicts the minimum, average, and maximum pip movement in a specified time frame. Below are the values for EUNZD.

Procedure to assess Pip Ranges

  1. Add the ATR indicator to your chart
  2. Set the period to 1
  3. Add a 200-period SMA to this indicator
  4. Shrink the chart so you can assess a large time period
  5. Select your desired timeframe
  6. Measure the floor level and set this value as the min
  7. Measure the level of the 200-period SMA and set this as the average
  8. Measure the peak levels and set this as Max.

EUR/NZD Cost as a Percent of the Trading Range

Cost as a percent of the trading range represents the cost percentage that a trader is bearable for each trade they take. The percentage is obtained by finding the ratio between the total cost and volatility. With these percentage values, we come into the conclusion of the best time to enter and exit the market with minimal costs.

ECN Model Account 

Spread = 0.9 | Slippage = 2 | Trading fee = 1

Total cost = Slippage + Spread + Trading Fee = 2 + 0.9 + 1 = 3.9

STP Model Account

Spread = 1.7 | Slippage = 2 | Trading fee = 0

Total cost = Slippage + Spread + Trading Fee = 2 + 1.7 + 0 = 3.7

The Ideal way to trade the EUR/NZD

By analyzing the percentages obtained above, we can find ways to reduce risk and cost on every trade of EURNZD. Firstly, the percentage tells the cost variation for different volatilities in different timeframes. The values are large in the first (Min) column. Meaning, the costs are high in the min column. Also, since this column represents low volatility, it implies that costs are high when the volatility is low and vice versa. In the average column, the costs are neither too high nor too low. And the volatility is under balance as well. Hence, this turns out to be the ideal time to trade in the market.

Moreover, another feasible technique to reduce cost is by placing limit orders. By the use of limit orders, a trader will eradicate the existence of slippage on the trade, and, in turn, reduce the total cost on the trade considerably. An example of the same is given below.

Comparing this table with the previous table, it is evident that the percentages have almost halved. Hence, entering and exiting trades using limit orders can prove to be very advantageous to reduce costs on trade.

Categories
Forex Course

44. Analyzing The Forex Market – Fundamental Analysis

Introduction

We’ve now come to one of the most exciting topics in this course, which is analyzing the Forex market. Now that we know the history and the working of the Forex market, we’re all set to predict the future of the market. Several types of analyses are used by traders across the world to analyze the  Forex market. However, these analyses can broadly be classified into three types.

In this lesson, and the lessons coming forward, we shall be discussing all these three types of analyses.

Types of Forex market analysis

The three types of forex market analysis are:

  1. Fundamental analysis
  2. Technical analysis
  3. Sentimental analysis

Now, you must be wondering which one of them is best for analyzing the markets. Well, if you look at the most successful professional traders in the industry, they analyze the market by considering all the types. In this lesson, let’s understand the most essential Fundamental Analysis.

Fundamental Analysis

Fundamental analysis, as the name pretty much suggests, is the way of analyzing the market by studying the economic, social, and political forces in the country. These factors are considered because they affect the supply and demand of an asset.

The whole idea of trading using fundamental analysis is by considering the factors that affect the supply and demand of a currency. These factors are technically referred to as fundamental or economic indicators.

The concept behind this type of analysis is straightforward. If a country’s currency or economic outlook is good, then there is a high probability that the currency will show strength in the future and vice-versa.

What are the major economic indicators?

Below are some of the economic indicators which have the power to shift the economic situation of a country.

Interest rates

One of the most popular and important economic indicators are interest rates. There are several types of interest rates, but we will be focusing on the basic form of the interest rates set by the central banks. Central banks are the creators of money. This money is borrowed by private banks. And the percentage (interest) or the principle the private banks pay to central banks for borrowing the money is called a nominal or a base interest rate.

If the central banks wish to boost the economy, they decrease the interest rates. This then stimulates borrowing by both private banks and other individuals. And this, in turn, increases consumption, production, and the overall economy. Lowering the interest rates can be a good way to inflate the economy but can be a poor strategy too. Because in the long term, low-interest rates can over-inflate the economy with cash and create an unbalance in the money supply.

So, to avoid this, central banks increase interest rates. And this increase results in less money in the hands of private banks, businesses, and individuals to play around with.

Inflation

Inflation, as the name pretty much says, is fluctuation in the cost of goods over time. Inflation, too, is a vital indicator for economists and investors to forecast the future economy. Inflation will have a good effect on the economy if done uniformly. But, too much inflation can bring the balance of supply and demand on the tip in favor of the supply. And this eventually will bring down the value of the currency.

Apart from these two, there are many other macroeconomic indicators that traders consider to do their fundamental analysis. Some of them include GDP, PPI, CPI, Unemployment Rate, Government Debt, etc. Indicators like these help the investors & traders in analyzing the market and predicting its future.

This completes the lesson on fundamental analysis. In the next lesson, let us understand the insights about technical analysis. Don’t forget to take the quiz below before moving ahead!

[wp_quiz id=”56601″]
Categories
Forex Assets

Understanding The EUR/AUD Forex Currency Pair

Introduction

EURAUD is a minor/cross currency pair traded in the forex market. EURAUD is the abbreviation for the euro area’s euro and the Australian dollar. The left currency, EUR is the base currency and the one on the right, AUD is the quote currency. The price of EURAUD basically tells the value of the Australian dollar.

Understanding EUR/AUD

The exchange rate of EURAUD shows the Australian dollars required to purchase one euro. It is quoted as 1EUR per X AUD. For example, if the value of EURAUD is 1.5995, it means that these many units of AUD are to be possessed by the trader to buy one unit of EUR.

EUR/AUD Specification

Spread

Spread is the way through which brokers make money. It is merely the difference between the bid price and the ask price set by the broker. These prices are often different from broker to broker. The spread differs based on the volatility of the market as well. The approximate spread on an ECN account and an STP account is given below.

ECN: 0.9 | STP: 1.7

Fees

For every trade a trader takes, there is some fee associated with it. And this fee is charged only by ECN type brokers. Typically, there is no fee on STP type brokers. The fee range is usually between 6 pips and 10 pips.

Slippage

A trader can place trades using either market order or using a limit order. In the case of market orders, the trader doesn’t get the exact price at which he executed the trade. The real price he received is different. This difference in the price is referred to as slippage.

Trading Range in EUR/AUD

As a professional trader, it is vital to know how many pips the currency pair moves in each timeframe. It gives the trader an idea of how long he must wait for his trade to perform. Traders can also assess their profit/loss in a given time frame. For example, if a trader takes a trade by analyzing the 1H timeframe, and the min market volatility is three pips, then he can expect to win or lose at least $20.91 (3 pips x $6.97 value per pip).

Procedure to assess Pip Ranges

  1. Add the ATR indicator to your chart
  2. Set the period to 1
  3. Add a 200-period SMA to this indicator
  4. Shrink the chart so you can assess a large time period
  5. Select your desired timeframe
  6. Measure the floor level and set this value as the min
  7. Measure the level of the 200-period SMA and set this as the average
  8. Measure the peak levels and set this as Max.

EUR/AUD Cost as a Percent of the Trading Range

Apart from knowing the potential profit/loss from the volatility of the market in different timeframes, one can also determine the cost variation by considering the volatility and the timeframe. For this, the ratio between total cost and volatility is taken into account. It is then expressed in terms of percentage. The magnitude of the percentage determines the cost of each trade.

ECN Model Account

Spread = 0.9 | Slippage = 2 | Trading fee = 1

Total cost = Slippage + Spread + Trading Fee = 2 + 0.9 + 1 = 3.9

STP Model Account

Spread = 1.6 | Slippage = 2 | Trading fee = 0

Total cost = Slippage + Spread + Trading Fee = 2 + 1.7 + 0 = 3.7

The Ideal way to trade the EUR/AUD

Now that we’ve got the values from the above table, here is our ideal way to trade the EUR/AUD.

The higher the magnitude of the percentages, the higher is the cost of the trade on that particular timeframe. Comprehending this to the above table, it is seen that the percentages are highest and lowest on the min and max columns, respectively. This, in turn, implies that the costs are high when the volatility of the market is feeble. And the costs are low when the volatility is high. So, it is ideal to trade on any timeframe, given the volatility of the market is above average volatility. This will ensure the fairly high volatility with affordable costs.

Furthermore, the costs can be made much lower by placing limit orders instead of market orders because this will reduce the slippage on the trade to zero. As an example, the cost percentage table is given by ignoring the slippage value.

Thus, comparing the two tables, it is evident that the costs have reduced by 50%.

Categories
Forex Assets

What Should You Know About The EUR/CHF Forex Pair?

Introduction

EURCHF is the abbreviation for the Euro area’s euro and the Swiss franc. This currency pair is a minor/cross currency pair. Here, EUR is the base currency, and CHF is the quote currency. Trading the EURCHF is commonly called trading the ‘swissie.’

Understanding EUR/CHF

The value of EURCHF determines the number of units of Swiss francs required to purchase one euro. It is quoted as 1 euro per X francs. For example, if the value of 1.3000, it means that one must pay 1.3000 francs to buy one euro.

EUR/CHF Specification

Spread

Spreads are the way by which brokers make their money. There is a separate price to buy a currency pair and a separate price to sell it. To buy, one must refer to the ask price, and to sell, one must refer to the bid price of the currency pair. The difference between these two prices is known as the spread. This spread usually differs from account type. The average spread on ECN and STP model account are as follows:

ECN: 0.9 | STP: 1.6

Fees

The fee is nothing but the commission charged by the broker on a single trade. The fee also varies base on account type.

Fee on STP account: NIL

Fee on ECN account: 1 pip

Note: The fee depends from broker to broker. Here, we have taken the average value by referring to some brokers.

Slippage

Slippage in trading is the difference between the trader’s desired price and the real executed price by the broker. The slippage value depends on two factors:

  • Broker’s execution speed
  • Currency pair’s volatility

Trading Range in EUR/CHF

The trading range in EURCHF is the representation of the minimum, average, and maximum pip movement in different timeframes. These values can be used to assess one’s approximate profit or loss in a given time frame. For example, if the volatility on the 1H timeframe is five pips, then one can expect to be in a profit or loss of $50.25 (5 pips x $10.05 value per pip) in an hour or two.

Procedure to assess Pip Ranges

  1. Add the ATR indicator to your chart
  2. Set the period to 1
  3. Add a 200-period SMA to this indicator
  4. Shrink the chart so you can assess a large time period
  5. Select your desired timeframe
  6. Measure the floor level and set this value as the min
  7. Measure the level of the 200-period SMA and set this as the average
  8. Measure the peak levels and set this as Max.

EUR/CHF Cost as a Percent of the Trading Range

Apart from assessing your profit and loss, one can find the best time of the day to enter and exit a trade. For this, another table is inserted that represents costs in terms of percentage. And the magnitude of these percentages determines the range of costs on each trade.

ECN Model Account

Spread = 0.9 | Slippage = 2 | Trading fee = 1

Total cost = Slippage + Spread + Trading Fee = 2 + 0.9 + 1 = 3.9

STP Model Account

Spread = 1.6 | Slippage = 2 | Trading fee = 0

Total cost = Slippage + Spread + Trading Fee = 2 + 1.6 + 0 = 3.6

Comprehending ‘Cost as a percentage of trading range’

Note that the mentioned percentages are a unitless quantity, and we consider only the magnitude of it. If the percentage value is high, then the costs are high. If they’re low, the costs are low too. Relating it to volatility, if the volatility is high, the costs are low and vice versa.

The Ideal way to trade the EUR/CHF

Now that we’ve comprehended what the cost percentages mean, let us determine the best times to trade the EURCHF currency pair. The minimum column of the table has the highest percentages, while the max column has the lowest percentages for each timeframe. It is neither ideal to trade when the volatility is high & costs are low nor when the volatility is low, and the costs are high. The only option left is the average column. The average column consists of the median values for both volatility and costs. Hence, this becomes the most suitable time to enter into this currency pair for trading.

Limit orders and their benefits

Traders usually enter and exit trades using market orders. This is the sole reason for slippage to take place. This has a significant weight on the cost of the trade. However, placing a limit order instead will nullify the slippage on the trade.

The difference in the ‘costs as a percentage of trading range’ when the slippage is made nil is illustrated below.

Categories
Crypto Guides

Architecture and Operation of Blockchain Technology

Introduction

We can obtain the definition of Blockchain by dissecting it into its two words: block and chain. Hence, Blockchain is a chain of blocks having some information in it. Using a blockchain is a way of time-stamping digital documents so that it’s not possible to backdate or tamper them. This secure technology can be used for the transfer of various items such as digital currency, property, contracts, etc. And the primary feature of any blockchain is its decentralized nature. There is no central authority or banks to control the transactions.

Blockchain Architecture and Operation

The architecture and functioning of blockchain go hand in hand. As already mentioned, blockchain is a chain of blocks containing some valuable information. The type of blockchain depends on the data that is present inside a block. For example, a block in a Bitcoin blockchain contains information on who is sending how many bitcoins to whom. Another essential piece in the blockchain is the hash.

Understanding Hash

In simple terms, the hash is the fingerprint of a block. It is unique to each block and is mainly used for the identification of a block. If the content in the block changes, the hash of block changes as well. So, a block has three components:

  1. Data (Sender, Receiver & Amount)
  2. Hash
  3. Hash of the previous block

In technical terms, blockchain is designed using the principles of a linked list. Blocks containing a hash of the previous blocks is what makes blockchain so secure.

Proof of Work

Hashes are an excellent way to avoid tampering of data. But, computers today are fast enough to calculate hundreds of thousands of hashes per second. This makes it pretty convenient for a hacker to tamper a block, and recalculate all the hashes of other blocks and the blockchain valid.

To avoid the occurrence of this situation, Bitcoin blockchains use the concept of Proof-of-Work. This concept is a computational problem that takes efforts to solve. In the case of Bitcoin, it typically takes 10 minutes to calculate the required proof-of-work and add a block to the blockchain. So, this makes it extremely time consuming and challenging for hackers to tamper a block.

Distributed P2P Network

Blockchain is known for its distributed peer to peer network. Anyone is allowed to enter the network. When someone enters the network, he will get a full copy of the network.

When a new block is created, it is broadcasted to all the nodes in the network. Each node verifies this block and makes sure it hasn’t tampered. After verification, each node adds this block to its blockchain. Later, all the nodes create a consensus. They agree about the legitimacy of the blocks and accept or reject it. If the block is verified successfully by consensus, it is added to the main blockchain. This is when the block gets its first confirmation. And when around four confirmations are received, the transaction is said to be completed successfully.

Summary

  1. There are four steps involved in the working of a blockchain.
  2. Some person makes a cryptocurrency transaction.
  3. The transaction is broadcasted to a distributed P2P network.
  4. The nodes in the network validate the transaction with the help of some algorithms.
  5. Once the transaction is verified, the new block is added to the existing blockchain.

This is how the blockchain technology works. Let us know if you have any questions below. Cheers.

Categories
Crypto Guides

Understanding The Fundamentals Of Blockchain

Introduction

We have understood the basics of DLT in the previous guide. In this article, let’s see one of the most popular applications of DLT, which is known as the blockchain. Many say that the blockchain technology is the new internet. By allowing information to be distributed not copied and tampered, blockchain did create the backbone of a new type of internet. Initially, blockchain found its application only in digital currencies, but today’s tech has now found other potential uses for the technology.

Blockchain, a distributed ledger, is a time-stamped series of immutable records of data that is controlled by different nodes in the network and not owned by any single entity. The records are stored in blocks that are secured and bound to each other by cryptographic principles.

The blockchain technology is completely decentralized. There is no central regulatory body on the blockchain network. The ledger on the blockchain is shared and immutable. The information in it is open to anyone to access. Hence, the blockchain is transparent in nature, and everyone involved in the network is accountable for their actions.

How does the Blockchain function?

In a blockchain, information is passed from one source to another in a fully automated and secure manner. When a party makes a transaction via blockchain, the peers in the network create a block for this transaction, which is secured using cryptography. This block is verified by several nodes (computers) distributed across the network. Once the block is successfully verified, it is added to the chain. Each block in the chain has a unique record with a unique history. Falsifying a single record means to falsify millions of instances in the chain. This is virtually impossible.

Features that hold Blockchain Strong

There are three properties of blockchain technology, which have helped it gain widespread applause.

  • Decentralization
  • Transparency
  • Immutability

📌 Decentralization

Before the appearance of Bitcoin, the public was used to only the centralized systems. And the idea of centralized systems was simple. There is a centralized entity that stores user’s information. To get this information, the user must interact solely with this entity. The main drawback of centralized systems is the absence of transparency.

Imagine if the centralized system was taken out. Everyone in the network can now view the data. It simply eliminates the existence of a third party. The data now can be shared one to one without any intermediary. This will eradicate the costs to be paid to the intermediaries as well. And this system is referred to as a decentralized network, making it a great property of the blockchain.

📌 Transparency

Transparency is another property that makes blockchain much appealing. Some say that blockchain is transparent, while some say it is private. Though it may sound counter-productive, blockchain is both transparent and private. When a transaction is made between two parties, one cannot see ‘who’ has sent it to ‘whom.’ Instead, we will be able to see something called the hash of a transaction. And this will be visible to everyone. Hence, this brings both transparency and privacy in the blockchain.

📌 Immutability

The blocks in the blockchain are immutable. It is impossible to tamper with. Technically speaking, blockchain is a linked list whose structure contains data and a hash pointer to the next block, hence creating a chain. This chain makes blockchain immutable.

For instance, let’s say a hacker hacks block 3 in the chain and tries to change the data. But, a slight change in the block will affect the other blocks drastically. That is, a change in block 3 will change the hash stored in block 2. This continues up to block 1. This will change the entire blockchain, which is impossible. Hence, making blockchain immutable.

Above are just the primary properties of the blockchain. There are other beneficial properties too, which is the reason blockchain has still sustained and is developing at a rapid pace.

Categories
Forex Course

43. Steps Involved In Opening A Forex Trading Account

Introduction

Now that we have enough knowledge about the Forex market, it is time to open a real Forex trading account with a broker. Note that, before opening a real trading account, it is highly recommended to open a demo account first, because this will give us an idea on how the Forex market and the brokers actually work.

Once we decide on the broker with whom we wish to open an account, the process of opening the account is pretty simple and straightforward. Typically, it doesn’t take more than five minutes to create a Forex trading account.

Step by Step procedure to open a Forex Trading Account

  1. Selecting the Account Type
  2. Registration
  3. Activation of the account

1️⃣ Selecting the Account Type

The first step to open a trading account is to choose the type of account we wish to trade-in. That is, we will be given a choice to open a trading account between a personal account and a business account. Back then, traders had to choose whether they wanted to open a standard, mini, or a micros account. But now, such a choice does not exist as brokers allow traders to trade custom lots.

Apart from Personal and Business accounts, some brokers offer ‘managed accounts’ as well. A managed account is a type of trading account where the broker places trades on behalf of their clients, that is, on behalf of the traders like you and me.

Also, Forex brokers these days have customized trading accounts in order to cater to traders with different trading experiences. For instance, Student or Classic account for amateur traders and Professional or VIP account for experienced traders.

2️⃣ Registration

This is the typical paperwork which is done by all the firms. The entire process is digitalized, of course. To register with a broker, one will have to submit a form that might vary from broker to broker. And this form is usually filled on their web page at the time of registering an account with the broker.

List of requirements to register with a Forex broker are:

  • Name
  • Address
  • Email
  • Phone number
  • Birth of date
  • County of citizenship
  • Social security number or Tax ID
  • Employment status

Apart from this, traders are answerable to a few financial questions such as Annual Income, Net worth, Trading experience & Trading motive.

Important: Before completing the registration process with the broker, make sure to know the costs related to all kinds of transactions (bank wire transfer, depositions, withdrawal, etc.), as this could sum to a significant amount of a trader’s account capital.

3️⃣ Activation of the Account

Once the registration process is successful, a trader will receive an update (by email or on the broker’s web portal), which will provide the instructions to fully complete the account activation process. This step is basically for verification. One must produce at least two IDs to get their account activated. One for the proof of residence and the other for the proof of identity.

After all these steps are fulfilled, the trader will receive the final email from the broker with the corresponding username and password. It will also provide the trader with instructions on how to add funds to their account. This completes the account verification & activation process.

Once we log in and fund our accounts, we can start trading the Forex market.

[wp_quiz id=”56318″]
Categories
Forex Course

42. How to stay away from the Forex Bucket Shops

Introduction

With a significant increase in the demand for retail traders to trade in the Forex market, tons of forex brokers have established their businesses to profit from their clients. This might seem like an advantage for traders as they have a variety of options to choose a broker. However, this is not the case.

In the world of forex brokers, there exist both genuine and fraudulent brokers. And these fraudulent brokers are referred to as bucket shops. These brokers have a frequent practice of misquoting and requoting and slippage, which favors only them.

Back in the day, as there was no internet, it was not possible for traders to know the actual price of the currency or security every moment. So, the clients used to place trades via phone. But, there were brokers who used to put the clients’ phone orders on slips and drop them into a bucket instead of officially executing them. Later, these orders were unofficially executed against the bucket shop operates, known as bucketeers.

These bucketeers usually did not disclose the real price of the currency, which was being traded in the market. They used to tell their clients that the price didn’t move in their favor, even if it actually did. But with the introduction of the internet and the improvement in the regulation of forex brokers, these scams have considerably reduced.

However, unfortunately, there still are these brokers out in the market. So, we’re here help to protect you from these scams. Things one must always keep a track of when trading with a broker are as follows:

✨ Constantly compare the price movement

Many traders trade based only on the prices mentioned by the brokers on their trading platform, which is quite dangerous. Currently, on the internet, there are many web portals that show the price feeds every tick. Hence, one must always keep track of the price feeds from several third-parties to confirm if the prices shown by the broker are real or not.

✨ Have a Trading Journal

Developing the habit of keeping a detailed journal of all the trades and transactions is extremely vital for a professional trader. Because if a trader feels that the broker has cheated them, they will need evidence to prove the genuineness in the filed case. And the simplest way to keep track of it is by taking a screenshot of every transaction they make. This can act as an excellent backup when they are cheated by a broker.

✨ Filing a legal action

Sometimes the disputes between the clients and brokers are not settled completely. So, this is when a trader must take legal action. If any conflict is unsettled, Forex traders can approach either the Commodity Futures Trading Commission (CFTC) or the National Futures Associations (NFA).

The CFTC has something called Reparation programs that provide an unbiased forum to handle and resolve customer’s complaints. You can click here to access the program.

Hence, by considering all these factors, one can stay away from being trapped by the fraudulent brokers in the industry.

[wp_quiz id=”56298″]
Categories
Forex Assets

What Should You Know About EUR/GBP Forex Pair Before Trading

Introduction

EURGBP is the abbreviation for the currency pair Euro area’s euro against the Great Britain pound. This pair, unlike the EURUSD, USDCAD, GBPUSD, USDCHF, etc. is not a major currency pair. This pair is classified under the minor currency pairs and the cross-currency pairs. In EURGBP, EUR is the base currency, and GBP is the quote currency.

Understanding EUR/GBP

The current market price of EURGBP depicts the required number of pounds to purchase one euro. For example, if the value of EURGBP is 0.8527, then one needs to pay 0.8527 pounds to buy one euro.

EUR/GBP Specification

Spread

Spread in trading is the difference between the bid price and the ask price. The spread is not the same on all brokers but depends on the type of account. It also varies depending on the volatility of the market. An average spread on an ECN account and an STP account is shown below.

Spread on ECN: 0.8 | Spread on STP: 1.5

Fees

On trade a trader takes, there is some fee associated with it. Fees, again, depends on the type of account. There is no fee on STP accounts, but few pips on ECN accounts.

Slippage

When a trader executes a using the market order, they don’t really get the price they had intended. There is a small pip difference between the two prices. And this difference between the prices is referred to as slippage. The slippage is usually within 0.5 to 5 pips.

Trading Range in EUR/GBP

Understanding the volatility of the market is essential before opening or closing a position. It shows how much profit or loss a trader will be on a particular timeframe. For example, if the volatility is on the 4H is 10 pips, the trader can expect to gain or lose $1269 (10 pips x 12.69 value per pip) in a matter of about 4 hours.

The table below illustrates the minimum, average, and maximum pip movement on the 1H, 2H, 4H, 1D, 1W, and 1M timeframe.

EUR/GBP PIP RANGES

Procedure to assess Pip Ranges

  1. Add the ATR indicator to your chart
  2. Set the period to 1
  3. Add a 200-period SMA to this indicator
  4. Shrink the chart so you can assess a large time period
  5. Select your desired timeframe
  6. Measure the floor level and set this value as the min
  7. Measure the level of the 200-period SMA and set this as the average
  8. Measure the peak levels and set this as Max.

EUR/GBP Cost as a Percent of the Trading Range

An application of the volatility would be the determining of cost on each trade. As in, the ratio between the volatility and the total cost on each trade is calculated and is expressed in terms of percentage. The percentage depicts the cost for a particular timeframe and volatility. The comprehension of it shall be discussed in the subsequent section.

ECN Model Account

Spread = 0.8 | Slippage = 2 | Trading fee = 1

Total cost = Slippage + Spread + Trading Fee = 2 + 0.8 + 1 = 3.8

STP Model Account

Spread = 1.5 | Slippage = 2 | Trading fee = 0

Total cost = Slippage + Spread + Trading Fee = 2 + 1.5 + 0 = 3.5

The ideal way to trade the EUR/GBP

With the above two tables, let us figure out the ideal way to trade this currency pair. Note that the higher the percentage, the higher is the cost on a trade and vice versa. It is evident from the chart that the percentages are highest for the minimum column and lowest for the max column. In other words, the cost is high when the volatility of the market is low, and the cost is low when the volatility is high. So does this mean it is ideal to trade when the volatility is high? Well, that’s not the right approach to it, as trading in high volatility is risky. So, it is ideal to take trades during those times when the volatility is around the average range. Doing that will ensure marginal cost as well as decent cost. For example, a 4H trader must take trades during those occasions when the volatility is around 20 pips.

Note: One can apply the ATR indicator to determine the current volatility of the market.

Another feasible way to reduce costs is by canceling out the slippage cost. Cancel slippage costs can simply be done by placing limit orders. With limit orders, the slippage automatically becomes 0.

The difference in the cost percentage when the slippage goes to zero is illustrated as follows.

We hope you find this Asset Analytics informative. Let us know if you have any questions in the comments below. Cheers!

Categories
Crypto Guides

Distributed Ledger Technology (DLT) – The Back-end Of Decentralized Systems

Introduction

A distributed ledger or DLT is simply a database that exists across several locations or among various participants. But, in the case of centralized databases, it lives in a fixed location. A distributed ledger eliminates the need for a central authority or intermediary to validate or authenticate transactions. This property makes DLT a trending technology.

Technically speaking, DLT is a digital system for keeping track of transactions in which the transactions and its details are recorded in multiple places at the same time. Here, there is neither a central data storage system nor an administrating functionality. Each node in the distributed ledger processes and verifies each item and creates consensus on each item’s veracity. Also, transaction information is securely stored using cryptography that can be accessed using keys and cryptographic signatures.

Blockchain and DLT: Are they the same?

The most popular application of the distributed ledger is the Blockchain. However, blockchain and distributed ledgers are not the same. Blockchain is just a type of distributed ledger. Blockchain is basically a sequence of blocks, which is in a chain. But, distributed ledgers don’t really require a chain. Therefore, Blockchain is a bit different from the typically distributed ledger. So, note that all blockchains are distributed ledgers, but all distributed ledgers are not blockchains.

Benefits of Distributed ledger

  • The primary feature of DLT is itself a great advantage. A distributed ledger gives full control to the information and transaction to the users. This promotes absolute transparency.
  • Distributed ledgers such as Blockchain find great applications in financial transactions. They cut down operational inefficiencies, which ultimately reduces cost on transactions. Moreover, it provides greater security due to its decentralized nature.
  • DLT offers means to securely and efficiently create a tamper-proof log of activities. Be it international fund transfer or shareholders records, its security and efficiency are unmatchable.

Types of Distributed ledgers

Blockchain hit the headlines when Bitcoin, the first cryptocurrency, surged in the market. Several interesting developments were made in the past decade. However, due to systematic inefficiencies and scaling issues, developers were in search of new solutions outside the blockchain. This search led to the development of Holochain, Hashgraph, and Directed Acyclic Graph.

With the arrival of these solutions, which significantly differ from the blockchain technology, has brought discussions regarding which is the best. Below is a brief comparison of these different types of DLTs.

The use cases of DLT are tremendous. Here, we shall take into account the use cases across the industrial, financial, and consumer sectors.

  • Using Smart Contracts to streamline Industrial processes
  • Immutable ledgers enable more secure financial transactions
  • Blockchain Authentication for identity theft prevention

While the distributed ledger has great advantages, which can considerably affect the present technology, it is in a growing stage and is still being explored to bring the best out of it. However, the decentralized future has at least begun for real.

Categories
Forex Economic Indicators

What Is Gross Domestic Product (GDP) & How Is It Useful For The Forex Traders?

Introduction

Gross Domestic Product, also known as GDP, is one of the main Microeconomic Indicator in Forex. It is the total amount of money spent on final goods and services. GDP is expressed in percentage terms and is calculated across different time periods. The time period is usually from one quarter to another.

It is a standard measure for the value added to the country’s economy through the production of goods and services during a specific time period. GDP is published by the International Monetary Fund (IMF), and information on the same can be found on their official website.

What does GDP measure?

Just as explained in the beginning, GDP measures the health of an economy. If the GDP of a country is high, it means it is receiving capital flows from central banks and institutions, which is a big positive for that country. However, if the GDP numbers are declining quarter on quarter, it means the economic growth of the country is shrinking. When GDP falls, unemployment in the country rises, and output in production drops.

GDP is important because it gives a birds-eye view of how the economy is doing. It is a sign of people getting more jobs, getting better pay, and businesses feeling confident about investing more.

Calculation of GDP

The GDP of a country can be calculated by using the below-mentioned formula

GDP = C + I + G + (X-M)

Where C is the spending made by consumers

I is the investment by businesses

G is the government spending

(X-M) is the net exports

How do Forex traders use GDP?

GDP is an indicator that is used by both technical and fundamental traders. It is one of the most critical drivers of the economy and is closely monitored by all. GDP is important because it can affect how the financial markets can behave, both positively and negatively. Strong GDP growth translates into higher corporate earnings, which directly appreciates the currency value. Conversely, falling GDP means the economy is weakening, which is negative for the currency and, therefore, stock prices. According to economists, a recession is said to occur when there are two consecutive quarters of negative GDP growth.

One should not forget that GDP is a lagging indicator, meaning it shows what the economy did in the past. It does not predict the state of the economy in the near future. Hence, if the GDP data of a country is not good, traders view this as an opportunity to buy the currency and make a profit in the long term.

Summary

Understanding the Gross Domestic Product and its growth rate is essential for investors and traders as it affects the decision-making process of policymakers of the country. When the GDP growth rate is high, the central banks raise interest rates and encourage investment. High-interest rate is said to attract foreign investors and financial institutions. With the improvement in research and quality of data, statisticians and governments are trying to find measures to strengthen GDP and make it a comprehensive indicator of national income.

Categories
Forex Course

41. Picking A Genuine Forex Broker 101

Introduction

Choosing the right broker is a vital point to consider, as all your transactions such as deposition, withdrawal, opening a position happen in this corner. In the present world, the competition between the retail brokers is so high that it can take a lot of hard work to determine the right broker of your choice.

So, in this lesson, we will discuss some of the most critical criteria you consider before opening an account with a broker.

📍 Security

Security can be considered as the most important criterion to choose a broker. Since traders will be playing around with their money here, it is necessary to make sure that the broker is genuine and trustworthy.

Checking the credibility of the broker is pretty simple, as there are regulatory agencies that disclose the trustworthiness of a broker. So, if a broker is registered with any of these agencies, we can consider the broker to be genuine and secure.

For your reference, some of the regulatory agencies are given below.

  • National Futures Association and Commodity Futures Trading Commission, in the US
  • Prudential Regulation Authority and Financial Conduct Authority, in the UK
  • Swiss Federal Banking Commission, in Switzerland
  • Australian Securities and Investment Commission in Australia
  • Investment Information Regulatory Organization of Canada, in Canada
  • Financial Conduct Authority, in the UK
  • Cyprus Securities and Exchange Commission, in Cyprus

📍 Types of Fee levied

Many brokers claim that they do not charge any fee other than the spread. However, some brokers do charge different types of fees from the clients, such as brokerage fees, commission fees, daily rollover interest, etc. Therefore, one must verify with the broker on what all charges are imposed by them.

📍 Margin trading

This is no doubt the best feature provided by the forex brokers. Margin trading is the facility provided by the brokers where a trader can open larger positions with a lesser amount. Different brokers provide different margins. So, one must choose their broker by considering the margin provision and also by keeping the risk factor in mind.

📍 Deposit and Withdrawal

It is essential to choose brokers who provide a user-friendly, swift, and fast feature to process the deposits and withdraws. One should check the withdrawal policies of the broker before signing up with them. Because this is where most of the brokers have their hidden costs or undisclosed withdrawal limits.

📍 Trade execution

The trading software must be such that the orders are filled at the best available prices. This is an important factor for scalpers to consider, as every micro pip has significance.

📍 Trading platform

The trading platform also plays a vital role while choosing a broker. For a novice trader, if the UI of the trading platform is not user-friendly, it can become quite challenging for them to place and manage trades. Also, the presence of trading tools and indicators is necessary for professional traders. Hence, one should make sure that the broker meets all your requirements and specifications.

Therefore, considering the above points can definitely help you fetch a good broker for you to trade the forex market.

[wp_quiz id=”55229″]
Categories
Forex Assets

Understanding The Fundamentals Of USD/JPY Forex Pair

Introduction

USDJPY is the abbreviation for the currency pair US dollar against the Japanese yen. This currency pair is very liquid and volatile. It is classified as a major currency pair. Here, USD is the base currency, and JPY is the quote currency. The currency pair shows how many JPY are required to purchase one US dollar.

Understanding USD/JPY

The exchange rate of USDJPY represents the units of JPY equivalent to one US dollar. For example, if the value of USDJPY is 109.550, then these many Japanese yen are required to buy one US dollar.

USD/JPY Specification

Spread

Spread is simply the difference between the bid price and the ask price. It depends on the account type. The average spread for ECN and STP account is shown below.

Spread on ECN: 0.5

Spread on STP: 1.2

Fees

The fee is basically the commission charged by the broker on each trade. Typically, the fee on STP accounts is nil, and there is some fee on the ECN account. There is no fixed fee on the ECN account and varies from broker to broker.

Slippage

Slippage is the difference between the price needed by the trader and the real price the trader was executed. Slippage happens when orders are executed as market orders. The slippage is usually within the range of 0.5 to 5 pips.

Trading Range in USD/JPY

The trading range is the representation of the minimum, average, and maximum volatility on a particular timeframe. It shows the range of pips the currency pair moved on a given timeframe. These values prove to be helpful in assessing a trader’s risk and controlling their cost on a trade.

USD/JPY PIP RANGES

Procedure to assess Pip Ranges

  1. Add the ATR indicator to your chart
  2. Set the period to 1
  3. Add a 200-period SMA to this indicator
  4. Shrink the chart so you can assess a large time period
  5. Select your desired timeframe
  6. Measure the floor level and set this value as the min
  7. Measure the level of the 200-period SMA and set this as the average
  8. Measure the peak levels and set this as Max.

USD/JPY Cost as a Percent of the Trading Range

Just knowing how many pips the currency pair moved is pointless. To bring it some value, it is clubbed with the total cost to understand how the cost varies based on the volatility of the market. It shows cost and volatility are dependent on each other.

The relation between Cost and Volatility

Cost and volatility are inversely proportional to each other. When the volatility of the market is low, the costs are high; and when the volatility is high, the cost is low. More on this is discussed in the subsequent section.

ECN Model Account

Spread = 0.5 | Slippage = 2 | Trading fee = 1

Total cost = Slippage + Spread + Trading Fee = 2 + 0.5 + 1 = 3.5

STP Model Account

Spread = 1.2 | Slippage = 2 | Trading fee = 0

Total cost = Slippage + Spread + Trading Fee = 2 + 1.2 + 0 = 3.2

The Ideal way to trade the USD/JPY

The above two tables are formed by finding the ratio between the total cost and the volatility. It is then expressed in terms of a percentage. Comprehending the values is simple. It is based on the relation between cost and volatility. If the percentage value is high, then the cost is high for that particular volatility and timeframe. It can be inferred that the min column has the highest values compared to the average and max column. This simply means that the costs are high when the volatility of the market is low. Hence, it is recommended to open/close positions when the volatility is at or above the average mark.

Furthermore, apart from volatility, the cost is heavily affected by the slippage. As mentioned, this happens due to market order executions. Hence, to reduce your cost by up to 50% on each trade, it is recommended to trade using limit orders and not market orders.

Categories
Crypto Guides

Knowing The Risks Involved While Using & Investing In Cryptocurrency

Introduction

Bitcoin, being the world’s largest virtual currency in terms of market cap, is aiming to give the financial space a new look. Also, blockchain technology, which is digital, distributed, and decentralized, has been powering transactions without the existence of intermediaries. With these features, it is believed to be a game-changer for the financial industry in the near future. However, apart from its primary features, it is essential to have a light on the risks involved in them.

Potential Risks Involved In Using Cryptos

Yet, cryptos have been the evolved way to look at currencies; there are ever-growing risks and concerns. Here are some reasons which show that using and investing in cryptocurrencies might not be a smart step.

Unavailability of traditional fundamental metrics

Cryptocurrencies lack the existence of fundamental metrics, which is useful for assigning value to an asset. In a stock, investors can get info about balance sheets, income statements, earnings reports, and many other fundamental factors to analyze a stock. However, with cryptocurrencies, there are no fundamental metrics that can be used by investors. Apart from processing speed and average daily transactions, the investors virtually get nothing about the power of digital currencies needed to analyze cryptocurrencies.

The SEC shall be of no help

A December 2017 statement from SEC chairman notes that decentralized trading can occur outside the confines of the US borders. And, as the transactions are considered to be anonymous, recovering the invested coins may not be possible.

Volatility

Though the cryptocurrencies have been in the market for quite a long time, the price fluctuation is still an issue. This could be due to the fact that people do not yet tend to trust these intangible funds. Moreover, even though a single entity doesn’t govern it, any major world news can the price of the cryptocurrency.

Lack of acceptance

While Bitcoin is welcomed in many countries, there are a few countries that still do not accept them due to its volatility and decentralized nature. Some nations have put a complete ban on it, and some have tried to cut off support from banking systems for its trading and use. Some countries that said ‘No’ to cryptocurrency are

🇨🇳 China

Bitcoin is officially banned in China. All financial institutions are prohibited from transacting with Bitcoin. The crypto exchanges in China are put to ban as well.

☭ Russia

Bitcoin is unregulated in Russia; however, its use as payments for goods and services is illegal.

🇻🇳 Vietnam

Vietnam’s government and its state banks claim that Bitcoin is not a legitimate payment method.

Thefts and Scams

Though cryptocurrency is intangible, there are possibilities of thefts and scams through hacking. Hackers have sophisticated tools that infiltrate cryptocurrency wallets and trading platforms to intercept transactions and send money to their wallets. Some of the Bitcoin scams with examples include,

Fake Bitcoin exchanges: BitKRK from South Korea
Ponzi schemes: Bernie Madoff
Fake cryptocurrencies: My Big Coin

Final Words

It is no doubt that cryptocurrencies have eased out the way of transactions. One can transfer coins to anyone, anywhere, and anytime anonymously of its decentralized nature. Having that said, the volatility, lack of acceptance, and thefts and scams can be viewed as a disadvantage and as a factor of risk.

Categories
Forex Course

40. Two Different Types Of Spreads In The Forex Market

In the last lesson, we clearly talked about what Spread in forex is and also how it is calculated. In this lesson, we will dig up a little more on the concept of spreads and understand its types.

In Forex, the spread is of two types:

  • Fixed spread
  • Variable/Floating spread

Fixed spreads are typically offered by Dealing Desk brokers, whereas, Variable spreads are offered by No Dealing Desk brokers. Let’s understand both in detail.

Fixed Spreads in Forex

As the name pretty much suggests, Fixed spreads remain the same regardless of the condition of the market. Be it a volatile or non-volatile market, the spread always stays the same.

As mentioned, these spreads are usually offered by Market Makers type of brokers.

Dealing Desk brokers buy a large number of positions from their liquidity providers and then offer these positions to traders (clients). Since the brokers will own these positions, they can control and display the prices to their clients with a fixed spread.

Why choose Fixed Spreads?

  • Fixed spreads do not require a large capital to trade. So, fixed spread brokers offer an alternative for traders who don’t have much cash to begin with.
  • “Fixed” spread itself is an advantage. Fixed spreads make it easy to calculate the transaction costs. And since spreads always remain constant, you will exactly know how much amount you will be paying to the broker for each trade.

Variable Spreads in Forex

Again, as the name suggests, Variable spreads are the spreads that are constantly changing, just like the exchange rates. That is, as and when the bid and ask price changes, the difference between the two changes. This, therefore, changes the spread as well.

This type of spread is offered by Non-Dealing Desk brokers. These brokers obtain the prices from multiple liquidity providers and directly pass on these prices to the traders without the involvement of a dealing desk. This means that NDD brokers do not have control over the spreads. It all depends on the market’s supply and demand and its overall volatility.

As a typical tendency of the market, when there is an economic event, the spreads widen. And same is the case when the market volatility drops.

Advantages of Variable spreads

  • Variable spreads diminish the experience of requotes, where requote is the difference in the price you hit the buy/sell and the price when your order reached the broker. However, this doesn’t mean that you won’t experience slippage.
  • Variable spreads provide transparent pricing, as you will be getting the prices from multiple liquidity providers, which in turn means better prices due to high competition.

If you’re wondering which type of spread you must choose? Well, it completely depends on the type of trader you are. For example, traders with small accounts who trade occasionally can go with a broker that offers fixed spread, whereas, a trader who wants fast execution and also wants to avoid requotes, can look for brokers offering variable spreads.

[wp_quiz id=”54986″]
Categories
Forex Assets

USD/CHF Currency Pair – Everything You Should Know!

Introduction

USD/CHF is the abbreviation for the US dollar and the Swiss franc. This pair is a major currency pair. USD is the base currency, while CHF is the quote currency. The pair as a whole tells how many units of the quote currency is needed to purchase one unit of the base currency. Trading USDCHF is as good as saying, trading the ‘Swissie.’

Understanding USD/CHF

The exchange value of USDCHF represents the number of Swiss francs required to buy one US dollar. For example, if the value of USDCHF is 0.9820, to purchase one USD, the trader must pay 0.9820 Swiss francs.

USD/CHF Specification

Spread

Spread in trading is the difference between the bid price and the ask price offered by the broker. It is measured in terms of pips and varies on the type of account and type of broker.

Spread on ECN: 0.8

Spread on STP: 1.6

Fees

There is a small fee or commission charged by the broker for every trade a trader takes. This depends on both types of accounts and broker. For our analysis, we have kept the fee fixed at one pip.

Slippage

Due to volatility in the market, a trader does not usually get the price that he demanded. The actual price differs from the demanded price. This difference is referred to as slippage. For example, if a trader executes a trade at 0.9890, the real price received would be 0.9892. This difference of two pips is known as slippage.

Trading Range in USD/CHF

The trading range is a tabular representation of the minimum, average, and maximum pip movement on a particular timeframe. Having knowledge about this is necessary because it helps in managing risk as well as determining the right times of the day to enter and exit a trade with minimal costs.

Below is a table that depicts the minimum, average, and maximum volatility (pip movement) on different timeframes.

USD/CHF PIP RANGES

Procedure to assess Pip Ranges

  1. Add the ATR indicator to your chart
  2. Set the period to 1
  3. Add a 200-period SMA to this indicator
  4. Shrink the chart so you can assess a large time period
  5. Select your desired timeframe
  6. Measure the floor level and set this value as the min
  7. Measure the level of the 200-period SMA and set this as the average
  8. Measure the peak levels and set this as Max.

USD/CHF Cost as a Percent of the Trading Range

The number of pips the currency pair move in each timeframe is shown in the above table. Now, we apply these values to find the cost percentage when the volatility is minimum, average, and max. This cost percentage will then help us filter out the most optimal time of the day to take trades.

The comprehension of the cost percentage is simple. If the percentage is high, then the cost is high for that particular timeframe and range. If the percentage is low, then the cost is relatively low for that timeframe and range.

Note that, the total cost on a single trade is calculated by adding up the spread, slippage, and trading fee.

ECN Model Account

Spread = 0.8 | Slippage = 2 | Trading fee = 1

Total cost = Slippage + Spread + Trading Fee = 2 + 0.8 + 1 = 3.8

STP Model Account

Spread = 1.6 | Slippage = 2 | Trading fee = 0

Total cost = Slippage + Spread + Trading Fee = 2 + 1.6 + 0 = 3.6

The Ideal way to trade the USD/CAD

Entering and exiting trades during any time of the day might not be the smartest move. There are particular times of the day a trader must manage their trade to reduce both risk and cost on the trade. This can be made possible by comprehending the above two tables.

The percentages are highest in the min column. Meaning, the cost is pretty high when the volatility of the market is low. For example, on the 1H timeframe, when the volatility is 2.5 pips, the cost percentage is 152%. This means that one must bear high costs if they open or close trades when the volatility is around 2.5 pips. So, ideally, it is recommended to trade when the market volatility is above the average mark.

Apart from that, it is much better if one trades using the limit orders rather than market orders, as it nullifies the slippage on the trade. In doing so, the costs of each trade will reduce by about 50%.

Categories
Forex Assets

What Should You Know About USD/CAD Forex Pair?

Introduction

USDCAD is the short form for the US dollar against the Canadian dollar. USDCAD, just like the EURUSD, GBPUSD, AUDUSD, etc. is a major currency pair. In this pair, the US dollar is the base currency, and the Canadian dollar is the quote currency. Trading this currency pair is known as trading the “loonie” because it is the name for the Canadian one-dollar coin.

Understanding USD/CAD

The exchange price of USD/CAD is basically the value of 1 USD in terms of CAD. It is quoted as 1 US dollar per X* Canadian dollars. For example, if the value of USDCAD is 1.3300, it means that it takes 1.3300 Canadian dollars to buy one US dollar.

*X is the current market price of USDCAD

USD/CAD Specification

Spread

The difference between the bid price and the ask price mentioned by the broker is the spread. Typically, this differs from the type of account.

Spread on ECN: 0.7

Spread on STP: 1.2

Fees

There is a fee (commission) on every trade a trader takes. This again depends on the type of account registered by the user. There is no fee on the STP account, but a few pips on an ECN account.

Note: We are considering fees in terms of pips, not currency units.

Slippage

Sometimes a trader is executed at a different price from what he had intended. This variation in price is known as slippage. Slippage takes place when orders are executed as a market type, and it depends on the volatility of the currency pair and also the execution speed of the broker.

Trading Range in USD/CAD

Trading analysis is not all about predicting when the prices will rise and fall. Sometimes, even though a trader knows the prices are going to rise/fall, it might not be ideal to jump on the trade without the knowledge of volatility of the market. Volatility range plays a major role in managing the total cost of a trade. Hence, it is vital to know the minimum, average, and maximum pip movement in each timeframe to assess the trading costs.

Below is a table that depicts the minimum, average, and maximum volatility (pip movement) on different timeframes.

USD/CAD PIP RANGES

Procedure to assess Pip Ranges

  1. Add the ATR indicator to your chart
  2. Set the period to 1
  3. Add a 200-period SMA to this indicator
  4. Shrink the chart so you can assess a large time period
  5. Select your desired timeframe
  6. Measure the floor level and set this value as the min
  7. Measure the level of the 200-period SMA and set this as the average
  8. Measure the peak levels and set this as Max.

USD/CAD Cost as a Percent of the Trading Range

With the min, average, and max pip movement, the cost range is calculated in terms of percentage. This percentage has no unit and determines if the width of the cost. That is, if the percentage is high, the cost is high for the trade, and if the percentage is low, the cost is low too.

Below are two tables representing the range of cost for an ECN account and an STP account.

ECN Model Account

Spread = 0.7 | Slippage = 2 | Trading fee = 1

Total cost = Slippage + Spread + Trading Fee = 2 + 0.7 + 1 = 3.7

STP Model Account

Spread = 1.2 | Slippage = 2 | Trading fee = 0

Total cost = Slippage + Spread + Trading Fee = 2 + 1.2 + 0 = 3.2

The Ideal way to trade the USD/CAD

As mentioned earlier, the higher the percentage, the higher is the cost for a trade. Applying this idea to the above tables, it can clearly be inferred that the percentages are high on the minimum column. This means that the costs are high when the volatility of the currency pair is very feeble.

Similarly, the costs are considerably low when the volatility is quite high. However, this does not mean that trading during high volatility is the ideal way. This is because the volatility is quite risky to trade volatile markets. Therefore, one must trade during those times of day when the market volatility is around the mentioned average. The costs are decent enough, and the risk is maintained just fine.

Another point of consideration is that costs are reduced significantly when the slippage is made nil. This can be made possible by entering and exiting a trade by placing a pending/limit order instead of executing them by market.

Below is the same cost percentage table after making the slippage value to 0.

Now it is evident from the above table that slippage eats up a significant amount of cost on each trade. Hence, limit orders are the way to go.

Categories
Forex Course

39. Understanding the Concept of Spreads in Forex

Introduction

Ever wondered how brokers make money from their clients? Well, it is through a simple concept of Spreads.

In the previous course, we discussed the terminologies such as pip, pip value, bid price, ask price, etc. In this lesson, we shall be extending our discussion and touch base on ‘Spreads’ in Forex.

What is Spread in Forex?

The difference between the ask price and the bid price is called the spread.

The “bid” is the price displayed by the broker at which one can Sell a currency pair. Similarly, the “ask” is the price offered by the broker at which one can Buy a currency pair. In both, “bid” and “ask,” Buying and Selling happen on the base currency.

So, the difference between these two prices yields some pips. And these pips become the profit of the brokers. This is how brokers make money without any commission.

In Forex, clients need not pay any additional fee to make a trade, as all the charges are built into the buy and sell prices itself. So, people must not get carried away by brokers who claim that they charge “Zero commission,” because traders will indirectly be paying commission in the form of spread.

How is spread calculated?

In the forex market, the spread is typically measured in pips, which is the smallest unit of price movement in a currency pair.

For example, let us say the current price of EUR/USD is 1.1500 / 1.1504. Here, the left quoted price is called the bid price, and the right quoted price is called the ask price.

Now, to calculate the spread, we just find the difference between the two prices.

So, Spread = ask price – bid price = 1.1504 – 1.1500 = 0.0004

Hence, the spread for this currency pair is 4 pips.

Note: Always subtract the lower price with the higher price.

Moving forward, let us say a trader wants to buy one mini lot of EUR/USD at this price. So, to do the buy, he/she will be paying the ask price (1.1504). And, to close the trade, he/she will be given the bid price (1.1500).

Assuming that they bought and closed (sold) immediately, they would be in a loss of 4 pips. Now, to obtain the loss in terms of cost, we need to multiply the cost of one pip by the number of lots they are trading.

Assuming that the value per pip is $1 for every mini lot, the total cost would sum up to $4. Total cost = 4 pips * 1 mini lot * $1 (per mini lot) = $4

Similarly, if they were trading eight mini lots, the total transaction cost would turn out to be $32. Total cost = 4 pips * 8 mini lots * $1 (per mini lot) = $32

Hence, this brings us to the end of this lesson. And in the next lesson, we shall elaborate more on this topic by understanding the types of spreads in forex.

[wp_quiz id=”54428″]
Categories
Crypto Guides

These Industries Have the Most Acceptance Of Cryptocurrencies

Introduction

It ain’t a surprise anymore that the cryptocurrency market is taking over several industries. Yes, it did have ups and downs but has still managed to grow at an exponential rate. In recent years, more and more people are opting to use cryptos as an alternative for fiat currencies. In the present date, there are just under 5000 cryptocurrencies listed on CoinMarketCap.

This decentralized currency has been disrupting quite a number of businesses. As they are decentralized, there are many uses of it in many fields. In the article, we have listed out some of the real-life examples of industries that are already implementing cryptocurrencies in their businesses.

Where and how are cryptocurrencies being used?

✈️ Travel Industry

The traveling industry has been using Bitcoin for quite a lot of time. There are companies that have been accepting payments in the form of Bitcoins. A great example of this would be Cheapair.com, a travel booking company, which has been accepting payments in the form of Bitcoins for booking flight tickets, hotels, car rentals and cruises since 2013. This is a great feature enabled by Cheapair.com, as it is hassle-free for customers to book tickets from anywhere in the world.

🏠 Real Estate

Ever thought one could buy houses with cryptocurrency as a mode of payment? Well, this is true. ‘Propy.com‘ is the world’s first international blockchain-based payment real estate that accepts Bitcoin as payment for buying properties. ‘Mycoinrealty.com‘ is another real estate firm which has the facility to purchase homes using Bitcoins. A few real-life examples for the same would be the purchase of a villa in Indonesia worth 1000 BTC in 2014, a home in Vegas amounting to 157,000 BTC, and 3 acres of land in Paradise Bay.

🕸️ Social Media

Back then, social media was the place where one could share their thoughts and feelings. But now, things have changed; as in, the social media space has grown to the extent that one can earn from these websites. There is a social media website that has been helping people in the career circle. ‘Vanywhere‘ is one such social media website that implements blockchain in its technology. This is a gig economy platform that uses the blockchain network to connect users with some specialized skills to those users who are in need of those particular skills. The transactions here are performed through cryptocurrencies.

🎮 Gaming Industry

Cryptocurrencies are spread over the gaming space as well. Cryptocurrencies in the gaming industry are not just a concept but is a real-life application. There are online gaming platforms that transact using cryptocurrency. A great example would be the ORB project. This is a game that enables players to cash their in-game assets into other assets, including cryptocurrency. This cryptocurrency can then be exchanged for fiat currencies if needed.

Bottom Line

These are only a few of the many industries where cryptos have maximum acceptance. From the above real-life examples, it is evident that cryptocurrency is a factor for the evolution of several industries in the market. Be it social or economic, it is playing a pretty decent role in revolutionizing the world. The expectation of blockchain & cryptocurrency is quite high. And it is no doubt that this technology is going to disrupt many other industries in the years to come. Cheers.

Categories
Crypto Guides

Do Cryptocurrencies Have The Potential To Be An Alternative Financial System?

Introduction

Bitcoin, the first cryptocurrency, bought a notion of decentralization in the market. Initially, it had a slow start, but later as the public began to understand the working of decentralized markets & the interest towards cryptos has increased. Its been ten years since Bitcoin’s inception, and currently, close to five thousand cryptocurrencies are existing in the market. The total market capitalization of all the cryptocurrencies combined is close to $195 Billion as of Dec 2019. The 24-hour transaction volume is around $78 Billion.

This kind of volume is enormous, but it can nowhere be compared to the gazillion amounts transaction volume that takes place in the Forex market. So it is safe to say there is a lot more that cryptos have to do to compete with the current financial system directly. But that doesn’t mean they don’t have the potential to do so. Hence, in this article, let’s discuss the pros of the decentralized financial system of cryptos and the cons of centralized current financial systems.

A bright future ahead?

Cryptocurrencies have features which prove to the extent that they do have room for being replaced with fiat currencies. The most crucial point of consideration is that cryptos cannot be quite easy as the fiat currencies, thanks to their decentralized and unregulated status. The technology that makes this possible is the blockchain network.

Moreover, cryptocurrencies could support the concept of universal basic income much better than the fiat currencies. In fact, some programs have already set an example by using cryptocurrencies as a means of distributing a universal basic income. Furthermore, cryptocurrencies could remove the existence of intermediaries in everyday transactions. This would eventually cut costs for businesses and help out the consumers.

Advantages Of Decentralized Financial Systems

✔️ Fraud prevention

Cryptocurrencies are powered by blockchain, which is an open-source ledger. Every single is recorded and recorded and verified through a consensus algorithm, so it is almost impossible to tamper with any transactions. This indeed is an enormous benefit of the decentralized financial system.

✔️ Shielded from government meddling

Decentralized financial systems, such as the cryptocurrencies, are not controlled by the government, central bank, or any other government body. This is a great advantage because when government meddles with currencies, it creates inflations or hyperinflation by devaluing, debasing, or printing too much currency in a short period of time.

✔️ Faster transactions

Decentralized-based cryptocurrency transactions are often much, much faster than the bank transactions. For bank wire transfers, the transaction time is around two days. But, in the case of cryptocurrencies transfers, it takes not more than a few minutes.

Disadvantages Of Centralized Financial System

❌ Regulations & Transaction Cost

There are limitations placed on how much of funds one can withdraw in a day & in a month. For instance, in the US, $2000 is the maximum withdrawal limit, and in some banks, it is less than $500. But when it comes to cryptos, it doesn’t matter. One can transfer any amount of funds without having to worry about the limits. Also, when it comes to the transaction cost, crypto transactions are way too cheaper than the typical bank fee.

❌ Payment Delays & Human Errors

Bank wire transfers typically take 1-5 days for the transactions to get processed. It also depends on various factors like the place from where you are sending money to. This is because each of the countries will have their own banks and hence different regulations. But cryptocurrencies do not have geographical boundaries like this. Transactions get executed almost immediately irrespective of where you live. Also, there is a possibility of the occurrence of minute errors as there is human involvement. But in the case of cryptos, users just have to copy-paste the corresponding address to perform their transactions. By doing this, there is very little chance of the occurrence of human errors.

Final Conclusion

The answer to the question ‘Do Cryptocurrencies Have The Potential To Be An Alternative Financial System?’ is NO as of today. But they do have the potential to be so. As of today, central banks are extremely powerful, and they can not be replaced with the current technology. One thing that we are sure about is that the cryptos have made an impact, and they have grabbed the attention of most of the central banks. We have also seen some of the central banks adopting blockchain technology to issue their own coins. So the most plausible prediction is that cryptocurrencies may play an active, supportive role in making the traditional banking processes extra cheaper, more transparent, and faster.

Categories
Forex Assets

Knowing The Fundamentals Of NZD/USD Currency Pair

Introduction

New Zealand dollar versus the US dollar, in short, is referred to as NZD/USD or NZDUSD. This currency pair is classified as a major currency pair. In NZDUSD, NZD is the base currency, and USD is the quote currency. Trading the NZDUSD is as good as saying, trading the New Zealand dollar, as NZD is the base currency.

Understanding NZD/USD

The value (currency market price) of NZDUSD represents units of USD equivalent to 1 NZD. In layman terms, it is the number of US dollars required to purchase one New Zealand dollar. For example, if the value of NZDUSD is 0.6867, then 0.6867 USD is required to buy one NZD.

NZD/USD Specification

Spread 

The algebraic difference between the bid price and the ask price is called the spread. It depends on the type of execution model provided by the broker.

Spread on ECN: 1

Spread on STP: 1.9

Fees

Similar to spreads, fees also depend on the type of execution model. Usually, there is no fee on the STP model, but there is a small fee on the ECN model. In our analysis, we shall fix the fee to 1 pip.

Slippage

Slippage is the difference between the price asked by the trader for execution and the actual price the trader was executed. Slippage occurs on market orders. It is dependent on the volatility of the market as well as the broker’s execution speed. Slippage has a decent weight on the cost of each trade. More about it shall be discussed in the coming sections.

Trading Range in NZD/USD

The volatility of a currency pair plays a vital role in trading. It is a variable that differs from timeframe to timeframe. Understanding the range (min, avg, max) is essential for a trader, as it is helpful for reducing the cost of each trade.

The volatility gives the measure of how many pips the pair has moved on a particular timeframe. This, in turn, gives the approximate profit or loss on each timeframe. For example, if the volatility of NZDUSD on the 1H timeframe is 10 pips, then one can expect to gain or lose $100 (10 pips x $10 [pip value]) within an hour or two.

Below is a table that depicts the minimum, average, and maximum volatility (pip movement) on different timeframes.

AUD/USD PIP RANGES 

Procedure to assess Pip Ranges

  1. Add the ATR indicator to your chart
  2. Set the period to 1
  3. Add a 200-period SMA to this indicator
  4. Shrink the chart so you can assess a large time period
  5. Select your desired timeframe
  6. Measure the floor level and set this value as the min
  7. Measure the level of the 200-period SMA and set this as the average
  8. Measure the peak levels and set this as Max.

NZD/USD Cost as a Percent of the Trading Range

With the volatility values obtained in the above table, the total cost of each trade is calculated on each timeframe. These values are represented in terms of a percentage. And these percentages will determine during what values of volatility it is ideal to trade with low costs.

The total cost is calculated by adding up the spread, slippage, and trading fee. As a default, we shall keep the slippage at 2 and the trading fee for the ECN model at 1.

ECN Model Account

Spread = 1 | Slippage = 2 | Trading fee = 1

Total cost = Slippage + Spread + Trading Fee = 2 + 1 + 1 = 4

STP Model Account

Spread = 1.9 | Slippage = 2 | Trading fee = 0

Total cost = Slippage + Spread + Trading Fee = 2 + 1.9 + 0 = 3.9

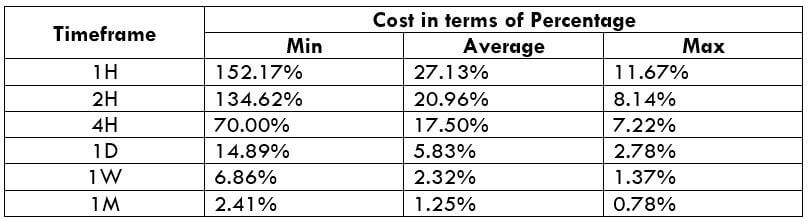
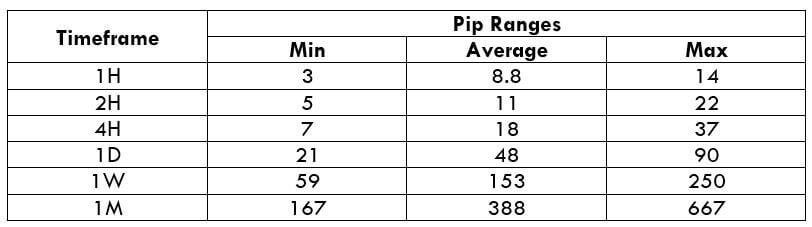
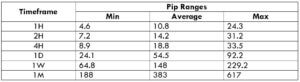
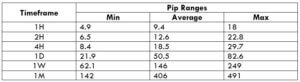
The Ideal Timeframe to Trade NZD/USD

The very first observation that can be made from the above two tables is that the total costs in both the model types are more or less the same. So trading on any one of the two accounts is a fine choice.

From the minimum, average, and maximum column, it can be ascertained that percentages (costs) are the highest on the minimum column of all the timeframes. In simpler terms, when the volatility of the currency pair is very low, the costs are usually on the higher side. Conversely, when the volatility is high, the costs are pretty low. Hence, it is ideal to trade during those times of the day when the volatility of the pair is at or above average. For example, a day trader can trade the 1H timeframe when the volatility of the currency pair is above 8.8 pips. This will hence assure that the costs are pretty low.

Another way to reduce the costs is by nullifying the slippage. This can be done by placing a limit order instead of executing them by a market order. This shall reduce the total costs by a significant percentage. An example of the same is given below.

Total cost = Slippage + Spread + Trading fee = 0 + 1 + 1 = 2

From the above table with nil slippage, it is evident that the costs have reduced by about 50%. Hence, to sum it up, to optimize the cost, it is ideal to trade when the volatility is above average and also enter & exit trades using limit orders rather than market orders.