Categories
Forex Course

38. Two Types of ‘No Dealing Desk’ Brokers

Introduction

In the previous lesson, we have discussed the two major classifications of forex brokers – Dealing Desk and No Dealing Desk. In this lesson, we will dig a little deeper and understand the types of No Dealing Desk brokers.

No Dealing Desk brokers can be classified into two types:

  • ECN brokers
  • STP brokers

What is an ECN broker?

An ECN broker is a forex broker expert that uses electronic communication networks to provide clients with direct access to other participants in the exchange market. Also, since these brokers consolidate prices from several other market participants, they usually offer their clients tighter bid/ask spreads. However, this tight spread is compensated by a small fixed commission charged by the brokers.

ECN brokers are NDD brokers, who do not pass the clients’ orders to market movers. Instead, they find participants in a trade electronically and then pass the orders to liquidity providers.

Understanding ECNs

As the name suggests, ECNs provide a network for buyers and sellers to participate and execute trades in the market electronically. These brokers make this possible by providing access to information on the orders being entered by the participants, and by facilitating the execution of these orders.

This network is designed to match the Buy and Sell orders currently traded in the exchange. And when the price requested by the client is not available, it provides the highest bid and lowest ask in the market.

What is an STP broker?

STP brokers, or Straight Through Processing brokers, are the ones who pass the clients’ orders directly to their liquidity providers. As discussed, the liquidity providers include banks, hedge funds, investment banks, etc. In this system, no intermediary or such will be involved in the execution of the order. Hence, the unavailability of the Dealing Desk makes the broker’s electronic trading platform Straight Through Processing (STP).

Moreover, with the absence of an intermediary (Dealing Desk), the brokers will be able to process orders of the clients much faster and without any delays.

Looking it the other way, STP brokers benefit from having many liquidity providers, because an increase in the number of liquidity providers increases the chances of the orders being filled for their clients.

Additionally, each time a client places a trade through an STP platform, the STP broker will make a profit. As STP brokers do not take the opposite of the clients’ trade, they add a minimal extra spread when quoting a bid/ask rate. And this small markup to the spread is passed to the clients via its electronic platform.

This completes the lesson on different types of No Dealing Desk brokers. Take the quiz below to know if you have got the concepts right.

[wp_quiz id=”54414″]
Categories
Forex Assets

What Should You Know About AUD/USD Forex Pair

Firstly, the abbreviation of the AUDUSD currency pair is the Australian dollar and the US dollar. AUDUSD is a major currency pair. It is considered a major pair because it is AUD is paired with the US dollar, and also, this is one of the pairs where a huge volume of trading takes place. In AUDUSD, AUD is the base currency, and USD is the quote currency.

Understanding AUD/USD

The exchange value of AUDUSD represents the units of USD equivalent to one unit of AUD. In technical terms, it is the value of AUD against USD. For example, if the current market price of AUDUSD is 0.6960, then it means that it takes 0.6960 US dollars to buy 1 Australian dollar. Trading the AUDUSD currency pair is basically trading the Aussie (Australian dollar).

AUD/USD Specification

Spread

Spread is the difference between the bid price and the ask price. The spread usually varies based on account type. The spread on an ECN account and an STP account is as follows:

ECN: 0.7 | STP: 1.4

Fee

There is charged by brokers for every trade a trader takes. However, this depends on the type of forex account. Typically there is a fee in ECN accounts and zero-fee in STP accounts. Also, there is no exact value of fee on a single trade, as it differs from broker to broker.

Slippage

Slippage is the difference between the trader’s requested price and the real executed price. Slippage happens when the volatility of the market is quite high. It happens for market orders. Slippage can be in favor of the trader or against him. If entering and closing of the trade is done by market execution, then slippage happens twice. The slippage is usually between 0.5 and 3 pips. However, it depends on the broker’s execution speed as well.

Trading Range in AUD/USD

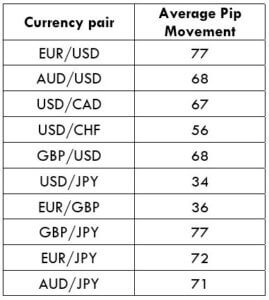
There are several timeframes to trade this currency pair. A day trader may pick the 1H, 4H, or the 1D timeframe, while a positional trader may opt for the weekly or the monthly. Apart from analyzing these timeframes, it is also necessary to know the volatility range in each of the timeframes. Knowing the pip movement range in each timeframe, one can assess their risk involved in each trade.

Below is the table, which represents the minimum, average, and maximum pip movement in each timeframe.

Note: The below values are an approximation from the Average True Range (ATR) indicator.

AUD/USD PIP RANGES 

Procedure to assess Pip Ranges

  1. Add the ATR indicator to your chart
  2. Set the period to 1
  3. Add a 200-period SMA to this indicator
  4. Shrink the chart so you can assess a large time period
  5. Select your desired timeframe
  6. Measure the floor level and set this value as the min
  7. Measure the level of the 200-period SMA and set this as the average
  8. Measure the peak levels and set this as Max.
GBP/USD Cost as a Percent of the Trading Range

This is where the above values are put into play. By considering the volatility range in each timeframe, the cost (fee) for a single trade is measured in terms of a percentage for every mentioned timeframe. The basic idea to this is that the higher the percentage value, the higher is the cost of the trade.

The cost is calculated by considering three variables, namely, slippage, spread, and trading fee. And the sum of these values gives the total cost of each trade.

As mentioned earlier, the cost varies from the type of trading account. So, there will be variation in cost percentages as well.

ECN Model Account

Spread = 0.7 | Slippage = 2 | Trading fee = 1

Total fee = Spread + Slippage + Trading fee = 0.7 + 2 + 1

Total cost = 3.7 (pips)

STP Model Account

Spread = 1.4 | Slippage = 2 | Trading fee = 0

Total cost = Slippage + Spread + Trading Fee = 2 + 1.4 + 0

Total cost = 3.4

The Ideal Timeframe to Trade GBP/USD

The first observation that can be made from the above percentage values is that the minimum column has the highest percentages compared to other columns. This means that the cost is pretty high when the volatility of the market is too low irrespective of the timeframe. Contrarily, the costs are significantly less when the volatility of the market is high (max column). However, it is quite risky to trade when the market volatility is high though the fee is less. So, it is ideal during those times of the day when the market volatility is above average.

Note that volatility is not only one which decides on which is the best timeframe and time of the day to trade. The slippage value equally plays an important role, as well. For instance, if the slippage is made nil and the percentages are calculated, it is seen that the ranges drop down considerably. Hence, it is recommended to enter and exit trades using limit orders and not market orders.

Categories
Crypto Guides

Beginners Guide to Cryptocurrency Mining

Introduction

There is a significant difference in how cryptocurrencies and fiat currencies are generated and issued to the ecosystem. Fiat currencies are created and printed by the government bodies in response to orders by the state authority. At the same time, cryptocurrencies are issued to the public by going through the blockchain network according to a preset algorithm. There are different schemes assigned for mining, such as the Proof of Work, Proof of Stake, Proof of Authority, etc. These are referred to as consensus algorithms. The in-depth working of these processes is complicated. So, we shall stick on the basic working of it.

Definition

Cryptocurrency mining is the procedure to bring up new coins into the current flowing supply, by verifying the coins through a system. The ones that mine these coins are called miners.

Procedure to Mine Cryptocurrency

  • When a transaction is performed over the blockchain network, i.e., when a user sends coins to another address, the transaction information is recorded and put onto a block.
  • This block must be encrypted and made secure. This is where the miners come in.
  • To encrypt a blockchain, miners solve a complicated cryptographic puzzle to find the appropriate cryptographic hash for the code. For this, miners typically make use of large rigs of application-specific hardware to increase their chances of being the first one to verify and secure the block.
  • Once the block is successfully secured, it is then added to the blockchain, where other nodes on the blockchain network verify it. This verification process is known as consensus.
  • When the block successfully clears through the nodes in the network, the block is officially said to be verified and secured. And for securing a block, the miner is rewarded new-created coins. Hence, the complete above procedure of work is called Proof of Work.

Reward system in Cryptocurrency mining

Mining is a complicated process. Each day, miners commit a thousand watts of electricity towards mining cryptocurrencies. People mine coins though it is an expensive process because they receive a good number of Bitcoins for it, which has value in various markets.

As mentioned above, the reward is released to the miners when they successfully solve a block in the blockchain. The compensation received is pretty decent; in fact, it compensates a thousand watts of electricity. Having that said, the reward cannot be very high, as it could cause an oversupply in the market and depreciate the value of the currency.

Supply and Demand of a Cryptocurrency

Buying and selling cryptocurrencies is different from buying and selling of stocks, bonds, etc. Also, unlike investing in traditional currencies, cryptocurrencies are not issued by the central banks. Therefore, the monetary policy, inflation rates, and other economic factors do not apply to the cryptocurrencies. They are influenced majorly by factors such as the supply of the coins and the demand for it, the number of competing coins, and also the exchanges it trades on.

The supply of cryptocurrencies is impacted by the cryptocurrency protocol, which permits the creation of a new coin (same type) at a fixed rate. A number of coins are introduced into the market when miners verify the blocks of transactions. And the rate at which these new coins are introduced is designed such that it slows down over time. This is done to create a scenario in which the demand for coins increases faster than the supply, which hence causes the prices to shoot up.

Hence we can say that mining & miners have a crucial role in maintaining the supply & demand of any cryptocurrency!

Categories
Forex Assets

Everything You Should Know To Trade The GBP/USD Forex Pair

Introduction

Currency pairs are classified as major, minor, exotic, etc. Major currencies pairs are those pairs that involve the US dollar as one of the currencies. These currencies typically have high liquidity and volatility. GBPUSD is one such example. It is the currency pair where Great Britain Pound is traded against the US dollar.

In this article, we shall be covering all the basic fundamentals which are essential to know before trading this pair. And before getting into the specifications of this pair, let us first understand what actually the price of GBPUSD signifies.

In GBPUSD, GBP is the base currency, and USD is the quote currency. The value (price) of the pair determines the units of USD required to purchase one unit of GBP. For example, if the current value of GBPUSD is 1.3100, then the trader must possess the US $1.3100 to buy 1 Pound.

GBP/USD Specification

Spread

Spread is simply the difference between the bid price and the ask price. The spread depends on the type of account.

Spread on ECN: 0.7

Spread on STP: 1.3

Fees

Again, the fee depends on the type of account. Typically, there is no fee charged by STP accounts. There is a trading fee on ECN account, which depends from broker to broker.

Slippage

Forex is very liquid and volatile. Hence, this causes slippage. Slippage is the difference between the price requested by the trader and the actual price the trader received. And this depends on the broker’s execution speed and volatility of the market. The slippage in major currency pairs is usually within 0.5 and 5 pips.

Trading Range in GBPUSD

As a trader, it is vital to know the number of pips a currency pair moves in a period of time. This is basically the volatility in the currency pair. And volatility is one of the factors which are helpful in risk management.

The volatility is measured in terms of percentage or pips. For example, if the volatility on the 1H timeframe of GBPUSD is 15 pips, then one can expect to gain or lose $150 (15 pip x $10 per pip) within a time period of few fours.

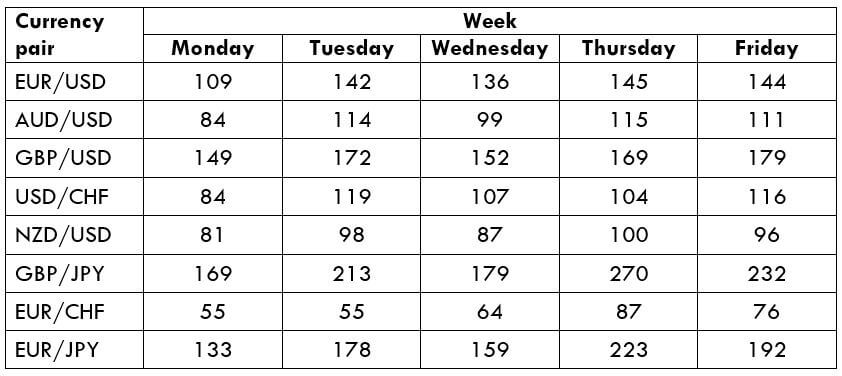
Below is a table that depicts the minimum, average, and maximum volatility (pip movement) on different timeframes.

EUR/USD PIP RANGES

Procedure to assess Pip Ranges

  1. Add the ATR indicator to your chart
  2. Set the period to 1
  3. Add a 200-period SMA to this indicator
  4. Shrink the chart so you can assess a large time period
  5. Select your desired timeframe
  6. Measure the floor level and set this value as the min
  7. Measure the level of the 200-period SMA and set this as the average
  8. Measure the peak levels and set this as Max.

(originally posted in our article here)

GBPUSD Cost as a Percent of the Trading Range

A Forex broker usually levies three type of charges for each trade. They are:

  • Slippage
  • Spread
  • Trading Fee

The sum of all the three costs will generate the total trading cost for one trade.

Total cost = Slippage + Spread + Trading Fee

Note: All costs are in terms of pips.

To bring up an application to the above volatility table, we bind these values with the total cost and find the cost variations (in terms of percentages) on different timeframes. And these percentages prove to be helpful in choosing the right timeframe with minimal costs.

ECN Model Account

Spread = 0.7 | Slippage = 2 | Trading fee = 1

Total cost = Slippage + Spread + Trading Fee = 2 + 0.7 + 1

Total cost = 3.7

STP Model Account

Spread = 1.3 | Slippage = 2 | Trading fee = 0

Total cost = Slippage + Spread + Trading Fee = 2 + 1.3 + 0

Total cost = 3.3

The Ideal Timeframe to Trade GBPUSD

Above are tables that illustrate the cost ranges in terms of percentage. Let us now comprehend the tables and figure out the ideal timeframe to trade this currency pair. From the above table, it is evident that the cost is highest (74% and 66%) in the 1H timeframe when the volatility is low. Hence, it is not ideal to pick the 1H timeframe when the volatility is around 5 pips (minimum).

On the flip side of things, the cost percentages are minimal on the 1M timeframe. Traders with a long term perspective on the market can invest with minimum costs.

Intraday traders, on the other hand, can pick the 1H, 2H, 4H, or the 1D timeframe when the volatility of the market is above average.

Another point to consider is that slippage eats up the costs significantly. So, it is recommended to plan strategies that involve placing of limit orders and not market orders.

As proof, below is a table that clearly shows the reduction in the cost percentages when the slippage is made NIL.

Total cost = Slippage + Spread + Trading fee = 0 + 0.7 + 1

Total cost = 1.7

Comparing these values to the table with slippage=2, it can be ascertained that the cost percentage has reduced by a considerable amount. Hence, all in all, it is ideal to trade by placing limit orders rather than executing at the market price.

Categories
Forex Course

37. Types Of Brokers in the Foreign Exchange Market

Introduction

If you can recall, we have discussed a bit about Forex brokers in course 1.0. Here is the link for that article. There we have discussed the brief history and introduction to brokers. We recommend you to have a quick look at that article to get a better understanding of Forex brokers. In this article, let’s discuss the two different types of brokers.

Forex brokers can be mainly be classified into two types:

  • Dealing Desks (DD)
  • No Dealing Desks (NDD)

What is a Dealing Desk broker?

Dealing Desk brokers are the Forex brokers who make money through spreads. Also, they are the ones who provide liquidity to the clients. Hence, these brokers are also referred to as Market Makers. The specialty of these brokers is that they can literally make the market for their clients. This is because they usually take the other side of the clients’ trade. So does this mean that brokers take every price the client requests? Well, that’s not the case. They set both sell or buy quote, which is offered to the clients.

While trading with Dealing Desk brokers, the clients cannot see the real interbank market rates. However, as there is always stiff competition between brokers, the rates provided by the Dealing Desk brokers are close or sometimes the same as the interbank rates. Hence, the exchange rates are not a matter of concern.

Working of Dealing Desk brokers

Comprehending the working of Dealing Desk brokers is quite simple. Let’s say that a trader wants to buy one standard lot (100,000 units) of USD/CAD with a Dealing Desk broker. Once the request for a buy is sent to the brokers, the following are the scenarios that take place.

Firstly, to fill the order, the broker will try to match the order with their other clients who are willing to sell at that price. If they do not find any sell order, they route the trade to its liquidity providers, a sizeable entity who is always on the go to buy or sell a financial asset.

However, still, if there are no matching orders, they end up taking the opposite of the trader’s trade.

What is a No Dealing Desk broker?

As the name pretty much suggests, these are the set of brokers who do pass their clients’ orders through a Dealing Desk. Meaning, they do not take the opposite trade of their clients. To put it in simple words, No Dealing Desk brokers act like bridge builders. They simply link two different trading parties.

Since these brokers connect the clients directly through the Interbank Market (Banks, Hedge Funds, Mutual Funds, etc.) they usually charge some commission from the clients, or they slightly increase the spreads.

This completes the lesson on types of brokers. And in the next lesson, we shall do a comparison between these two brokers to give you an idea of which broker one must choose. Don’t forget to take the quiz below before you go.

[wp_quiz id=”53810″]
Categories
Crypto Guides

These Are The Top Cryptocurrency Wallets In The Market (2019)

In our previous articles, we have discussed what a cryptocurrency wallet is and its different types. We also understood their purpose and ranked the various kinds of wallets in terms of security. Quick recap – Hot wallets are the ones that have an internet connection, and cold wallets are the ones that are not connected to the internet. Desktop, Mobile, and Web Wallets are the example of hot wallets; whereas, Hardware and Paper wallets are the well known cold wallets. When it comes to convenience, hot wallets have the upper hand, and in terms of security, cold wallets take the front seat.

In this article, let’s understand the top cryptocurrency wallets that are present in the market as of today. Please note that the order of these wallets is not ranked numerically. We found all of the below wallets to be reliable in terms of price, security, and accessibility. You can choose the ones that fit your purpose and budget.

Top Hot Wallets

Image result for exodus wallet logo png

Exodus is an online cryptocurrency wallet that has both Desktop & Mobile versions. It is a multi-currency wallet as users can store the private keys of different cryptocurrencies in this wallet. The user interface is excellent, with easy navigation. The user experience is brilliant, as a lot of data related to a user’s portfolio is pictographically represented with pie charts. The best part of this wallet is its security. User’s private keys are stored in their local hardware alone. Hence, they have total control over their cryptos. Available versions – Windows, Mac, Linux, Android & IOS.

Download Exodus Wallet here

As the name partially suggests, the USP of this wallet is the number of cryptocurrencies it supports. Users can store most of the top available cryptos in the market in their Infinito mobile wallet. There is no desktop version of this wallet. The transaction processing speed is high when compared to the competitors, and the security is excellent, with regular gateway updates to the blockchain. The private keys of the clients are not stored in their servers hence enhancing the security. Available Versions – Android & IOS.

Download Infinito Wallet here

Related image

Jaxx is one of the new-age cryptocurrency wallets with its availability in both Desktop & Mobile versions. There is also a chrome extension where users can see their balance and perform transactions. Jaxx supports more than 70 cryptocurrencies, and the clients control the private keys. Hence there is no worry of your wallet getting hacked while using this wallet. The only drawback is the user interface. It is a bit fuzzy, which might look complicated for novice crypto traders and investors. Available Versions –  Windows, Mac, Linux, Chrome Extension, Android, Windows Web Store & IOS.

Download Jaxx Wallet here

Top Cold Wallets

Image result for trezor wallet logo png

If you are an investor and want to store large amounts of cryptos, Trezor Model T is the hardware wallet that serves your purpose. More than 500 cryptos can be stored in this wallet with tons of security features. Users can connect this device to their computers by entering a secured pin. However, one should be careful while entering their pin because the wallet gets locked out for a certain amount of time, even if they enter the pin incorrectly once. This wallet comes with a seed recovery card using which clients get to backup their coins. With this feature, users will never have to face the risk of losing their coins permanently.

Price€48.76 for Trezor One & €149 for Trezor Model T

Buy Trezor Wallet here

Related image

Ledger Nano is one of the pioneers of hard wallet service providers. They have sold more than a million hardware wallets, and that explains their domination in the market. This wallet is easy to use and has loads of security features as well. Some of them include Two-Factor Authentication, a secured pin to confirm the transactions, etc. With its preparatory operation system Bolos, this wallet can be connected to the desktops which run on Windows, Mac, and Linux.

Price€59 for Ledger Nano S & €119 for Ledger Nano X

Buy Ledger Wallet here

That’s about the top crypto wallets in the market. Please do your own research before choosing any wallet. Look out for options where there is a mix of security and accessibility for smoother usage. Cheers!

Categories
Forex Basic Strategies Forex Trading Strategies

How To Trade The Engulfing Candlestick Pattern Using Support/Resistance

Introduction

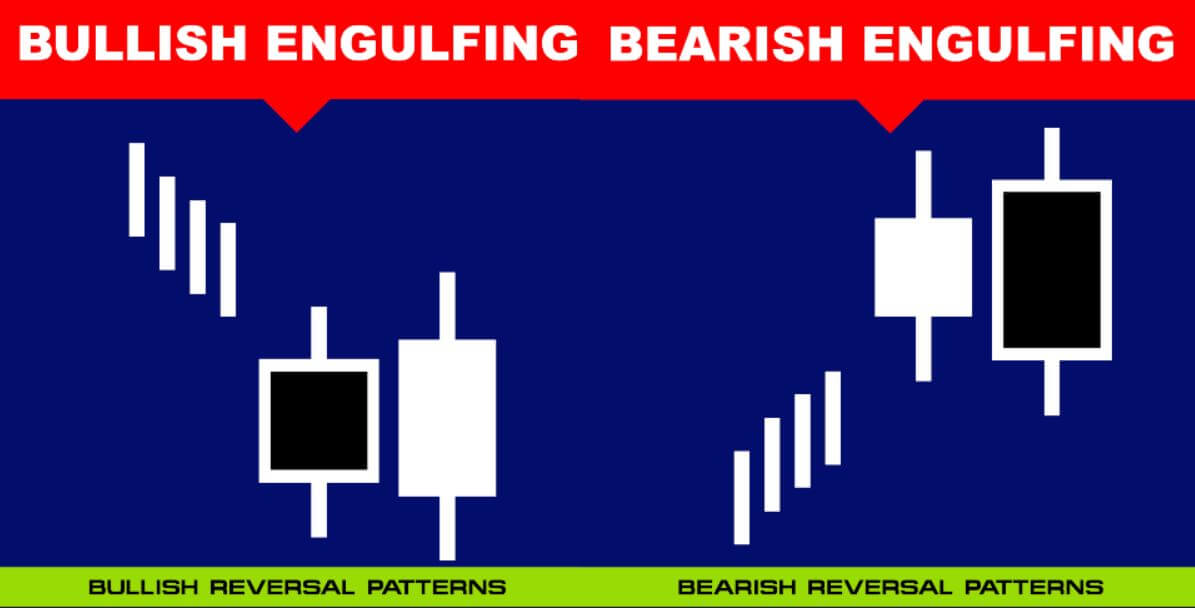
Engulfing is one of those candlestick patterns in the forex market that provides a useful way for traders to anticipate a possible reversal in the trend. There are two types of engulfing patterns – Bullish Engulfing and Bearish Engulfing. The engulfing candle’s bearish or bullishness is wholly based on its position in relation to the existing trend of an underlying asset.

Understanding The Types

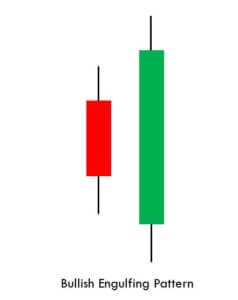
A bullish engulfing pattern can appear anywhere in the trend. But it holds more significance if it appears in a downtrend. This pattern indicates the surge in buying pressure as it shows that more buyers are entering the market, driving the price action further up. This pattern consists of a bearish red candle and the second bullish candle completely engulfs the body of the previous red candle.

Interpretation – Always look for the bullish engulfing pattern in a clear downtrend. For entering a trade, traders must combine this pattern with support resistance levels or with any reliable technical indicator for additional confirmation of the trend reversal.

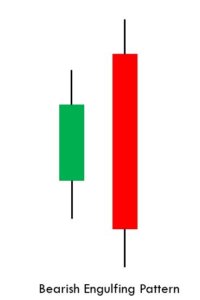
Bearish engulfing pattern is just the opposite of the bullish engulfing pattern. Instead of appearing at the bottom of the trend, this pattern appears at the top of the trend. We can say that more accurate and reliable signals can be generated when this pattern appears at the top of an uptrend. The bearish engulfing pattern consists of two candles. The first one being the green candle. This one is, next, engulfed by the subsequent red candle. The pattern triggers a reversal in an existing trend. It indicates the buyers are no longer able to push the price higher, and the bears took control of the market.

Interpretation – Always look for the bearish engulfing pattern in a clear uptrend. The second red candle must engulf the green candle ultimately, showing that bears are piling into the market aggressively. For entering a trade, traders must look for additional confirmation, such as support resistance levels or by using any reliable technical indicator.

Pairing the Engulfing pattern with Support/Resistance

Every trader has a unique way of trading the market. Some traders like to go with the trend while some traders only trade counter-trend moves. In this strategy, we have paired the engulfing pattern with support & resistance to show you how to trade the reversals correctly.

Confirm the downtrend first on your trading timeframe 

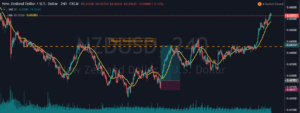
The first step of this trading strategy is to confirm the trend of any underlying asset. Let’s trade the bullish engulfing pattern. So as discussed, we should be finding the downtrend on the price chart. As you can see in the below NZD/USD currency pair was in an overall downtrend.

Find out the Bullish Engulfing pattern on your trading timeframe

The key to successful trading is to follow all the rules of the trading strategy. The engulfing pattern can be seen all over the price chart, but obviously, we can’t trade all of these patterns. We should be trading only those engulfing patterns that appear in the major support area.

In the below image, the NZD/USD was in an overall downtrend, and price action respects the major support area. Market prints the engulfing pattern at the support zone, which indicates that the buyers are more likely to lead the price.

Entry, Take Profit & Stop loss

Enter the trade right after you see the bullish engulfing pattern at the S&R area. Take-profit targets depend on your trading style. If you are a swing trader or full-time trader, hold your positions for more extended targets. If you are an intraday trader, close your position at the nearest resistance area.

You can also book partial profits at a significant resistance area and close your full position when the market prints the bearish engulfing pattern. In this strategy, we took the buy at a significant support zone, so it’s a healthy practice to put stop loss just below the support area.

Look at the below image; you can see that price action goes above the significant resistance area. But we made sure to close our positions at the resistance area as we don’t want our money to be blocked in a single trade for a long time. Overall it was good 4R trade.

Bottom Line

There are so many different ways to take trades to use the engulfing pattern. Statistically, the engulfing pattern works better when traded at the bottom or top of the trend. So make sure to check their location before placing the trades. One other possible way to trade am Engulfing Pattern is when it is combined with Moving Averages. But even that way, make sure to trade the engulfing pattern at the significant support and resistance areas. Some traders use reliable indicators like MACD to confirm the trend reversals by using the overbought and oversold levels. That’s about the Engulfing pattern strategy. Make sure to find these patterns and trade them in your upcoming trading activities. Let us know if you have any questions in the comments below. Cheers!

Categories
Forex Basic Strategies Forex Trading Strategies

Trading The Morning Star Candlestick Pattern Like A Pro!

Introduction

Morning star is a bottom reversal pattern, and it primarily consists of three candlesticks that indicate the bullish sign. This pattern warns the weakness in an ongoing downtrend that, in turn, suggests the start of an uptrend. Traders observe the formation of a Morning Star pattern on the price chart, and then they can confirm it with other technical tools.

The Three Candlesticks Of Morning Star Pattern

  • Large Bearish Candle
  • Small Bullish or Bearish Candle
  • Large Bullish Candle

The most fundamental thing to remember is that the market should be in a downtrend to trade the Morning Star pattern. To confirm the downtrend, mark the lower lows and lower highs.

Large Bearish Candle is the first part of the Morning star reversal pattern. The bearish candle indicates the bears are in complete control, which means the continuation of the selling pressure. At this point in the market, we should only be looking for the sell trades as there is no sign of reversal yet.

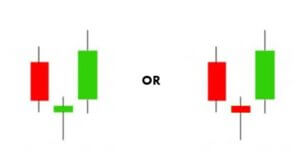
Small Bullish/Bearish Candle is the second candle that begins with a bearish gap down. This candle indicates that the sellers fail to push the price lower, despite trying really hard. The price action ends up forming a quite small bullish/bearish or Doji candle. If this candle is a small bullish candle, it’s an early sign of trend reversal.

Large Bullish Candle is the third candle that holds the most significance because the real buying pressure is revealed in this candle. If this candle begins with a buying gap, and if buyers can push the prices higher by closing the candle even above the first red candle, it is a definite indication of a trend reversal.

Trading strategy – Morning Star Candlestick Pattern

As we know by now, the Morning star is a reversal pattern. It mainly indicates the bulls taking over the trend while the bears lose the grip. Most of the beginners tend to trade the Morning Star pattern stand-alone. But we do not recommend this as it is not reliable enough. Always pair this pattern with some other credible indicators, support resistance levels, or trend lines to make profitable trades.

Morning Star Pattern + Volume

In this strategy, we have paired the Morning Star pattern with the volume. The volume plays a significant role in pattern formations. If the first red candle shows a low volume, it is a good sign for us. Then, if the second candle is green and the volume rises, it indicates the buying pressure. Lastly, the long green candle’s volume must be high. The high volume on the last candle shows the confirmation of the upcoming buy trend. If the third bullish candle has low volume, then try avoiding that Morning Star Pattern because the volume is not indicating the bullish reversal. If you observe the third candle closing with high volume, take up the buying position and ride the uptrend until there are any indications of a trend reversal.

Confirm the downtrend on the trading timeframe

Confirmation is very important because, if there is no downtrend, there’s no point in trading the Morning Star pattern. You can confirm the downtrend on a higher timeframe or on your trading timeframe. As you can see in the below image, the overall trend of the CAD/CHF Forex pair was down.

Find out the Morning star pattern on your trading timeframe

As you can see in the below CAD/CHF chart, the market prints the Morning Star pattern by following all the rules of our strategy. The first red candle was with low volume, and the second one was a small red candle. Hence there is no indication to go long in this pair yet. The very next was a long green candle with high volume. This is a strong indication of a trend reversal.

Entry, Take Profit and Stop Loss

We should be entering the trade when the next green candle closes. There are so many different ways to book profit. We can close the position at any resistance area or supply-demand zone. In this trade, we hold our positions because we took the trade from the beginning of a new trend. You can also close your positions when the price goes near the higher timeframe’s significant resistance level.

Pairing this pattern with volume makes it more reliable to trade. So it is a good idea to place the stop loss just below the second candle. In the above picture, you can see that we have put the stop loss just below the second candle, and we have also booked the profit at the higher timeframe’s major resistance area.

Reliability of Morning Star Pattern

This pattern is very easy to identify on the price chart if you are an intermediate trader. Even novice traders can easily spot it on the chart with little practice. Morning Star pattern often gives us well-defined entries and good risk-reward ratios. The only limitation of this pattern is that, if the sellers are strong enough, the prices could go further down despite the formation of the Morning Star Pattern. Hence it is always recommended to combine this pattern with some other trading tools rather than trading it stand-alone.

We hope you find this article informative. Try trading this pattern when you see a perfect downtrend next time. Let us know how the results have been in the comments below. Cheers!

Categories
Forex Course Forex Course Guides

Forex Course 1.0 – Complete Guide

Hello Readers!

If you have been following us lately, you must have known that providing quality trading education is the number one motto for us at Forex Academy. With this being our principal mission, we have rolled out an in-house course that covers every single thing about Forex Trading. We want to primarily thank you all for the amazing response we have got on the first part of that course. This will only motivate us to provide more quality content.

This piece of article will help you in finding any particular concepts or for a quick overall revision. Basically this is a quick navigation guide of Forex Course 1.0.

  1. Introduction To The Forex Market – Link
  2. Currency Pairs – Link
  3. Mechanism Of Buying And Selling – Link
  4. Liquidity of The Forex Market – Link
  5. Different Ways Of Trading – Link
  6. How Does Profit & Loss Take Place – Link
  7. Right Currency Pair To Buy & Sell – Link
  8. The Concept Of ‘Pip’ – Link
  9. Lots & Its Different Types – Link
  10. Various Order Types – Link
  11. First Step In Your Trading Journey – Link
  12. General Myths About Forex – Link
  13. Different Trading Sessions – Link
  14. Tokyo Session – Link
  15. London Session – Link
  16. New York Session – Link
  17. Best Time To Trade The Forex Market – Link
  18. Forex market’s hierarchy – Link
  19. Forex Market Movers – Link
  20. Perks Of Trading Forex – Link
  21. Stock Market & The Forex Market – Link
  22. Margin Trading Fundamentals – Link
  23. Balance & Rollover – Link
  24. Unrealized P/L and Realized P/L – Link
  25. Margin Requirement & Required Margin – Link
  26. Used Margin and Equity – Link
  27. Free Margin – Link
  28. Margin Level – Link
  29. Margin Call & Margin Call Level – Link
  30. Stop Out Level In Margin Trading – Link
  31. Refresher – Margin Trading – Link
  32. Leverage & Margin – Link

We hope you find this comprehensive guide useful. Let us know if you have any questions regarding Course 1.0 in the comments below. Cheers!

Categories
Candlestick patterns Forex Basic Strategies Forex Trading Strategies

Pairing The Hanging Man Candlestick Pattern With MACD Indicator

Introduction

The Hanging Man is a visual candlestick pattern which is used by traders and chartists in all type of markets. The term ‘Hanging Man’ refers to the shape of the candlestick. Visually the hanging man looks like a ‘T,’ and it appears in an uptrend. The formation of this candlestick is an indication that the uptrend is losing its strength. Meaning, sellers started showing interest, and the current trend of an asset is going to get reversed. Anyone can easily predict from the name of this pattern that it is viewed as a bearish sign.

The Hanging Man candle composes of a small body and a long lower shadow with little or no upper shadow. The vital point to remember is that the hanging man pattern is a warning of the upcoming price change, so do not take it as a signal to go short. Also, trading solely based on one pattern is risky. To confirm the sign given by the Hanging Man pattern, traders must pair it with support resistance or any other trading indicator.

This pattern is not confirmed unless the price falls shortly after the Hanging Man. If the next candle closes above the high of the Hanging Man, this pattern is not valid. After the pattern, if the very next candlestick falls, then it’s a clear indication of the reversal. Now, if you see a Hanging Man candlestick and the above-discussed rules apply, you can go ahead and take the trade. But since it is crucial to have an extra confirmation, let’s pair this pattern with a technical indicator.

Pairing the Hanging Man Pattern With MACD Indicator

In this strategy, we have paired the Hanging Man pattern with the MACD indicator so that we can filter out the low probability trades. MACD stands for Moving Average Convergence and Divergence, and it is one of the most popular indicators in the market. It is essentially an oscillator that is used for trading ranges, trend pullbacks, etc. Also, this indicator identifies the overbought and oversold market conditions. In this strategy, we are using the default setting of the MACD indicator to identify the trades.

Step 1 – Confirm the uptrend first on your trading timeframe

We can’t use the Hanging Man pattern to take the buy trades. Since it is a reversal pattern, it only signals the selling trades. So first of all, find out the uptrend in any currency pair. One more primary thing to remember when trading this pattern is this – After finding a clear uptrend, if you see the market printing the Hanging Man, then try not to trade that pair. Because, in a strong trend, it’s not easy for a single candle to change the direction of the entire trend. But if you find this pattern when the uptrend is a bit choppy, it has higher chances to perform. As we can see in the image below, the uptrend in USD/CHF was not strong enough.

Step 2 - Find out the Hanging Man pattern on your trading timeframe

Some traders use two or three timeframes to trade patterns. But that’s not the right way of pattern trading. If you are an intraday trader, use only lower timeframes to identify the pattern. So the next step here is to find out the Hanging Man in this chart. Also, apply the MACD indicator. For us to go short, the MACD indicator must be in the overbought area.

As you can see in the image below, the USD/CHF Forex pair prints a Hanging Man pattern. This is the first clue for us that the buyers aren’t able to push the market higher. Soon after the crossover happened on the MACD indicator, we can say that this forex pair is in the overbought condition. So now, two forces are aligned, and they are indicating us to go short. Within a few hours, the pair rolls over, and it prints brand new lower low.

Step 3 – Entry, Take Profit & Stop Loss

We go short as soon as we see the Hanging Man candlesticks and MACD indicator at the overbought area, we can go short. In this pair, buyers were quite weak, and this is an indication for us to place deeper targets. As we suggest in every strategy, often close your position at significant support/resistance area, or when the market starts to print the opposite pattern. In this pair, we closed our full trade at 0.9844. Overall it was 7R trade, and we made nearly 140+ pips.

Placing the stop loss depends on what kind of trader you are. Some advanced traders use their intuition to close their positions, while some use logical ways such as checking the power of the opposite party. In this trade, we know that the buyers are not strong enough, so there is no need to use the spacious stop loss.

Difference Between Hanging Man and Hammer Patterns

The Hanging Man and Hammer both look the same terms of size and shape. Both of these patterns have long, lower shadows and small bodies. But the Hanging Man forms in an uptrend, and it is a bearish reversal pattern. Whereas the Hammer forms in a downtrend, and it is a bullish reversal pattern. These two patterns appear in both short and long term trends. Do not use these patterns alone to trade the market. Always use them in conjunction with some other reliable indicators or any other trading tool.

Bottom Line

Most of the professional traders never see this pattern alone as a predictor of a potential trend reversal. Because there will be times when the price action continues to move upward even after the appearance of the Hanging Man. Hence technical indicator support is required to confirm the reversal of the trend. Make sure to stick to the rules of the pattern so that you can use it to your advantage. This pattern forms in all the timeframes, but we suggest you master it on a single timeframe first. Cheers!

Categories
Forex Course

Introduction – Forex Academy’s Forex Course 2.0

In the previous course, we started off by understanding what Forex Market is actually about and went on until the concepts related to margin trading. Thank you for the fantastic response to the Course 1.0. Now, its time to step up our learning a bit and move to the next level.

In this course, we shall be discussing two of the most important topics. They are

Forex Brokers

Types of Analysis

Forex Brokers

If we see back in the ’90s, it was pretty difficult to participate in the retail Forex market due to its high transaction costs. Also, there were many restrictions put up by the government to the people who wanted to participate in the Forex market. However, as time passed, the CFTC (Commodities Futures Trade Commission), a U.S. regulatory agency, decided to bring an end to these complications. So, they passed a couple of bills – the ‘Commodity Exchange Act’ and the ‘Commodity Futures Modernization Act,’ which opened doors for online Forex brokers to ease the process for retail traders.

Then, with the introduction to the world wide web, it became extremely easy for small retail traders to open a forex trading account. Moreover, with an exceptional demand, thousands of Forex brokers came up to benefit from the booming Forex industry as well.

Coming to the present day, we learned about the Margin trading facility provided by the brokers. Now it is time to understand the different types of Brokers in the foreign exchange market. Hence, in this course, we shall go over everything you need to know about Forex Brokers.

Types of Analysis

In the second installment of the course, we will understand a very vital topic, which is on Types of Market analysis. Broadly speaking, there are three ways to analyze the market.

✔︎ Technical Analysis – This analysis is the study of price movement using trading tools like charts and indicators.

✔︎ Fundamental Analysis – It is the analysis of currency by considering its social, political, and economic factors.

✔︎ Sentiment Analysis – Are you under the impression that Forex market analysis is all about numbers and math? That is true to a great extent. But, on top of all those complex numbers, Forex has a close relation with human psychology too. In this type of analysis, traders understand the sentiment of other traders and try predicting the future of the market.

In this course, we will present all the types of analyses mentioned above. By the end of this course, you will also be able to understand how to combine all of these analyses and make your trades more holistic. The format will be similar to that of Course 1.0. A concept will be explained clearly in less than 500 words, and at the end of the course, you can check your learnings by taking a quick 4 – 5 question quiz.

We will start Course 2.0 by understanding the types of Brokers existing in the Forex Market. Are you excited to learn more? Stay tuned for the most amazing, simple, and informative content. Cheers!

Categories
Forex Course

33. Understanding Leverage & Its Relationship With Margin

Leverage

There is a close relationship between the Leverage and Margin. That is, both go hand in hand. In simple terms, the margin is used to create leverage. The meaning of leverage is similar to the margin. It is a facility provided by brokers, which allows a trader to take larger positions by investing a lesser amount than required.

Margin is expressed in percentage, while Leverage is expressed as a ratio

Leverage is the ratio between the capital a trader has in their account to the amount of capital he/she can trade. And this ratio is expressed in the form “X:1,” where X is the amount of leverage.

Expressing Margin in terms of Leverage

If a trader wishes to purchase one mini lot of a currency, they don’t need $1,000 in their account balance. Instead, they will need only a small percentage of the position size. And this percentage is referred to as Margin Requirement.

This same percentage in terms of a ratio is termed as Leverage.

For example, let’s say John wants to buy 100,000 units of USD/CAD. If the Margin Requirement is 1%, John will require only $1,000 to take this trade. That is, the Leverage for this trade would be 100:1.

Calculating the Leverage

Leverage is calculated using the below formula

Leverage = 1 / Margin Requirement

Considering the above the example,

Leverage = 1 / 0.01

Leverage = 100

Hence, the leverage will be 100:1.

Similarly, if the Margin Requirement is 2%, the Leverage will be 50:1.

Conversely, using Leverage, we can obtain the Margin Requirement as well.

Margin Requirement = 1 / Leverage 

For example, if the Leverage is 500:1, the Margin Requirement  = 1 / 500 = 0.002

Hence, the Margin Requirement when Leverage is 500:1 will be 0.002 or 0.2%.

Mostly, Margin and Leverage have an inverse relationship.

Forex Margin and Stock Margin

Forex margin and Stock (Securities) margin are two completely different terms, though both are from the same trading industry.

In the Stock market, the margin is the amount a trader borrows from their broker to purchase a stock. Basically, it is like borrowing funds as a loan from their broker.

Whereas in the Forex market, the meaning of margin is different. Here, as we know, it is the amount of money a trader will have to keep aside with the broker as a deposit to open a margin position.

Hence, to sum it up, we can consider margin either as a loan provided by the brokers or as collateral collected by the respective brokerage firm.

[wp_quiz id=”52027″]
Categories
Forex Basic Strategies Forex Trading Strategies

Trading False Breakouts Like a Professional Forex Trader

Introduction

Often there are times in the market when the price breaks a certain significant level, and most of the novice traders immediately jump into the market. But, suddenly, the price reverts quickly, stopping out these traders or putting them in a losing position. Most of the experienced traders would have exited their positions when they realized they are trapped by the big whales like industry or institutional traders.

But beginner traders often become the victims of these false breakouts, and it affects their psychology as well. They will start doubting their trading strategies, and the fear element will surpass their confidence. Instead of falling into the negative state of mind, traders should learn how to use these false breakouts to their advantage so that they can profit from it. In this article, let’s discuss how to trade the false breakouts properly.

Most of the traders often consider false breakouts as a negative thing in the market. The general perception is that, by trading the false breakouts, they are taking the unnecessary risk, or it is not the correct way to trade. Some traders also believe that simple breakouts are more comfortable to trade. It is true, but simple breakouts won’t provide a great risk-reward, and also, it is not a consistent way to trade the market. On the other hand, successful & experienced traders see the false breakout logically and consider it as an opportunity to make some quick profits.

There are a lot of ways to trade false breakouts. Some traders trade them in conjunction with indicators, and some use it with trend lines and support resistance. In this strategy, we will show you the most appropriate way of trading false breakouts.

Trading the false breakout by using the major S&R levels

False breakouts occur in all types of markets, such as Forex, Stocks, Futures, and Options. They also occur in all kinds of market conditions. But the critical thing to remember is that every false break out is not worthy enough to trade. Always consider trading the false breakouts by following the trend of the market. That is, if the trend is up, look for the buy-side false breakout and in a downtrend, look for sell-side false breakouts.

Step 1 – Find the trend of the higher timeframe

This step is simple yet crucial because we need to confirm the trend of the market. Keep in mind that most of the lower timeframes always follow the direction of the higher timeframe. To explain this strategy, we are examining the uptrend of the GBP/USD forex pair.

Step 2 – Look for the significant S&R in the lower timeframe

Most of the false breakouts occur near the support and resistance level. The reason brokers and market movers use these levels is to manipulate the market as is these areas act as a significant supply-demand zone. This makes it easier for the bigger players to fill more orders.

Step 3 – Look for the false breakouts at the S&R level

As we know by now, most of the false breakouts happen at major support resistance area. A trader can set the alarm on the price chart to see when the price action is at a major level. When the price breaks these levels, wait for the false breakout to trade the market.

In the below image, GBP/USD was in an uptrend. On 15 Min chart during the pullback phase, prices started holding at the support area. On 29th Nov, look at the first circle where the price action prints the false breakout. But there is no way to trade that breakout. Because after that, the price action dipped below the support area, which is a sign of a false breakout. So it is an indication to go long on the GBP/USD forex pair.

Step 4 – Entry, Stop loss and Take profit

A trader should be entering the market when the price action holds at the significant support resistance area as it confirms that the levels are active to hold the prices. \

Take profit placement depends on your trading style. If you are an intraday trader, we suggest you close your position at a recent high. If you are a swing trader, look for another false breakout to load more positions. You can also use the recent high or any support resistance area of the higher timeframe to close all of your positions.

Most of the false breakouts are sure shot trades in the market. Place the stop loss just below the recent low, or at the closing of the most recent candle. If you are a conservative trader, then put stop loss bit spacious to your entry point.

In the below image, we have placed the stop loss just below the closing of the recent candle, and we have captured the 4R trade in the market.

Bottom line

It is essential to learn the logic and psychology behind any false breakout. Most of the time, the risk is small in these types of trades, and it is important not to be greedy while placing more extended targets. If there is no momentum in the market, close your positions, and if the trend is healthy to go for longer moves. You can still trade the regular breakouts, but throw relatively less money when compared to the false breakout trades. Also, make sure to practice trading false breakouts in a demo account until you master it. We hope you liked this article. Cheers!

Categories
Crypto Guides

Comprehending Hot/Cold Wallets & Personal/Hosted Wallets

Introduction

In the previous crypto guides, we have understood what a cryptocurrency wallet is, and its essential purpose. We have also understood the types of crypto wallets and ranked them in terms of security. In this article, let’s see how they are classified.

Quick Recap

As we know, storing cryptocurrencies essentially means storing the corresponding ‘Private Key’ of the crypto coin. Anyone with that key can have control over the respective cryptos. So it is vital to store the private keys in a safe and secure place. Cryptocurrency wallets serve this purpose. There are many types of wallets, and all these types are classified into Hot Wallets & Cold Wallets.

🔴 Hot Wallets

Wallets that are directly connected to the internet are known as Hot wallets. This means the private keys of a coin are stored in a computer, smartphone, or tablet with an internet connection. This kind of wallet is user-friendly and pretty seamless to use as your private keys can be easily accessible to authorize a transaction.

Having said that, hot wallets are not that secure as they are vulnerable to computer hacks. With the advent of technology, there are many hackers out there who can steal private keys despite being stored securely.

🔵 Cold Wallets

In this storage, the private keys are saved on an electronic device not connected to the internet. Even if the key is noted down on a piece of paper and stored it securely, it can be considered as cold storage. It is less convenient to use cold wallets as it is difficult to access your private keys. But these wallets are way too safer the hot wallets.

Which type of wallet is best for me?

Well, it depends on the volume and frequency of the transactions you make. Hot storage is recommended for those users who transact cryptos regularly. Even then, make sure not to store a huge amount of cryptos in hot storage. For typical investors, who are planning to hold their large sum of cryptos for long, they should consider cold storage as it is way too secure.

Personal vs. Hosted Wallets

There are different credible wallet service providers in the market. These providers will take the responsibility of storing your cryptocurrencies. Again, there are personal wallet service providers and hosted wallet service providers. The personal wallet providers are those companies that provide software to store private keys. They do not handle the private keys of their users in any way.

But hosted wallet service providers store the private keys of their users in secured servers. It is always recommended to use a personal wallet over a hosted wallet if you are handling a significant amount of cryptos. Having said that, hosted wallets are way too convenient as transactions can be processed swiftly here due to the ready availability of private keys.

It is essential to take a lot of precautions while storing your cryptos. Let us know if you have any questions in the comments below. Cheers.

Categories
Forex Course

34. Refresher – Margin Trading & All The Topics Involved

Introduction

We have discussed all the terminologies and concepts related to Margin Trading in the previous articles. In this article, let’s get a quick recap of all these terms with the help of examples.

Let’s go through the steps involved in margin trading with the help of these terms. This exercise will help you in understanding how all of these terms are interrelated.

Let’s say Tom wants to margin trade GBP/USD currency pair. Below is the step-by-step procedure that he should follow.

Step 1: Balance

To start taking positions in his margin account, Tom must first deposit some amount. So, let’s say he has deposited $1,000 in his margin account. Once this amount gets deposited, Tom’s Balance will be $1,000.

Step 2: Required Margin

After depositing, if Tom wishes to go long on GBP/USD, he must know the Required Margin to open a position. Assuming the price of GBP/USD is 1.3150, and he wants to open 10,000 units, the Required Margin, if the Margin Requirement is 2%, is,

Required Margin = Notional Value x Margin Requirement

In terms of USD, Notional value = 10,000 pounds x $1.3150 = $13,150

Hence, the Required Margin will be,

Required Margin = $13,150 x 0.02 (2%) = $263

Step 3: Used Margin

As we know, when there is only one position open, the Used Margin will be equal to the Required Margin. So, here, the Used Margin of Tom’s margin account will be $263.

Step 4: Equity

Initially, let us say that Tom’s trade is in breakeven (no profit no loss). The Equity for this can be obtained using the below formula,

Equity = Balance + Floating P/L

= $1,000 + $0

Hence, Equity = $1,000

Step 5: Free Margin

From Equity and Used Margin, we can calculate the Free Margin as well. It is the simple difference between the two.

Free Margin = Equity – Used Margin

= $1,000 – $263

Thus, the Free Margin turns out to be $737.

So, this is the amount Tom has left to take new positions.

Step 6: Margin Level

Taking another step forward, we can calculate the Margin Level as,

Margin Level = (Equity / Used Margin) x 100%

= ($1,000 / $263) x 100% = 380%

Hence, the Margin Level is 380%. This is an important term for brokers as they use it to determine Tom’s eligibility to take new positions. Because both the Margin Call Level and Stop Out Level fixed by the brokers will be considering the Margin Level of Tom’s Margin Account.

The values that will be changed after the price changes are Notional value, Used Margin, Floating P/L, Equity, Free Margin & Margin Level.

Now, let’s say the price of the GBP/USD dropped to 1.1000. Let us calculate the changes in the values.

Notional value

Notional value = 10,000 pounds x $1.1000

Notional value = $11,000

Used Margin

Used Margin = Notional value x Margin Requirement

= $11,000 x 0.02 = $220.

Floating P/L

(Entry Price = 1.1800)

Assuming the pip value to be $1, the Floating P/L for a movement of 800 pips will be,

Floating (Unrealized) P/L = (Current price – Entry price) x pip value

= (1.1000 – 1.1800) x 10,000 x $1

= -0.08 x 10,000 x $1

From the above calculation, the Floating P/L will be = (– $800)

Equity

Similarly, Equity will change to

Equity = Balance + Floating P/L

= $1,000 + (-$800)

Hence, the Equity will be $200.

Free Margin

Free Margin = Equity – Used Margin

= $200 – $220 = (–$20)

Margin Level

Margin Level = (Equity / Used Margin) x 100%

= ($200 / $220) x 100%

Hence, we obtain the Margin Level to be 90%.

Now, if you recall the previous two lessons, at this point, Margin Call will be initiated by the broker. And a further fall could lead to Stop Out as well.

In case if the Margin Call Level is the same as the Stop Out Level, then Tom’s Used Margin will be released, and the Floating Loss will be realized. Also, Tom’s Balance will be updated accordingly. We hope it all makes sense now. Check your learning by taking the quiz below.

[wp_quiz id=”51961″]
Categories
Forex Course

32. Understanding Stop Out Level In Margin Trading

Introduction

In the last lesson, we saw how Margin Level was found to be useful for giving meaning to Margin Call Level. Similar to the previous lesson, in this lesson, we shall be discussing another term that involves the dependency of the Margin Level. This lesson will be dealing with the understanding of what Stop Out Level is and also the implications and consequences of it.

Stop Out Level, and Margin Call Level have almost got the same meaning. There is only a thin line difference between these two. Hence, understanding the Margin Call Level is critical to comprehend Stop Out Level.

What is Stop Out Level?

Stop Out Level is a level that is set by the brokers, which triggers them to take action when the Margin Level falls below this specified level (Stop Out Level). That is, when the Margin Level breaks below the Stop Out Level, the broker forcibly closes some of the trader’s position, usually without their consent. The positions are liquidated because of the unavailability of the margin in the account.

Before the broker closes the positions, the trader is first intimated that their Margin Level has significantly reduced and is at risk. This intimation is called Margin Call. If the Margin Level falls much more than the Margin Call Level and goes below the Stop Out Level, the positions are liquidated. And this process of liquidation is called Stop Out.

The complete flow to Stop Out

If we were to dig deeper, the dependency of Stop Out level drops down to the basic concepts like Balance, Margin, Floating P/L, etc.

For instance, when a trader takes a position, the above terms come into action. If the trade is in profit, the floating P/L increases, and there are no worries about the margin call and stop out as the margin level would be considerably higher than the margin call level and the stop out level. But, if the trade is running in the negative, eyes must be on the margin call level as well as stop out level. Let’s get this point clearer, with an example.

Let’s say a trader has deposited $1000 into his account and has used $200 for taking few positions. Consider the Stop Out Level to be at 20%.

If the trades are running in a loss of$970. The equity for this is calculated as:

Equity = balance + floating P/L = $1,000 + (-$970) = $30

Similarly, the margin level will be,

Margin level = (Equity/used margin) x 100% = ($30 / $200) x 100% = 15%

Now, since the margin level has gone below the stop out level, the positions are scratched off. So, the trader will have booked a loss of $970. And the newly updated balance will be $30.

This brings us to the end of this lesson on Stop Out Level. Also, this completes all the terminologies that are involved in Margin Trading. Take the quiz below and stay tuned to learn a different lesson tomorrow. Cheers!

[wp_quiz id=”51331″]
Categories
Forex Course

31. The Concept Of Margin Call & Margin Call Level

Introduction

By now, you would have known that risk management is the most crucial factor of consideration while trading in a margin account. The trader is not solely responsible for their risk, but brokers, too, have some features that directly or indirectly try reducing the risk of the traders. In the previous lesson, we understood what margin level was. And in this lesson, we shall be putting more meaning to it by introducing another term which is correlated with margin level. The margin term, which will be discussed in this lesson is ‘Margin Call Level.’ So, without any further talks, let’s get our feet wet with this topic.

Margin Call Level

Margin Call Level, as the name suggests, is a specific level in Margin Level when the broker warns the trader that their positions are at risk. It is a threshold level when the broker alerts the trader that some of their trades can be forced to close.

As mentioned, the Margin Call Level is closely related to Margin Level. Hence, Margin Call Level is expressed in terms of percentage.

Example

Let’s say the Margin Call Level set by the broker is 100%. So, if an account’s Margin Level falls below 100%, then it is said that the account has hit the Margin Call Level.

Margin Call

Margin Call and Margin Call Level is pretty much the same thing. Margin Call is simply a different version of the Margin Call Level. If Margin Call Level is a specific ‘level’ set by the broker, Margin Call is a ‘call’ or ‘notification’ given by the broker. So, when an account’s Margin Level falls below the Margin Call Level, the account holder will receive a call or notification from the broker notifying the same.

This above explanation was the simple exterior working of Margin Call. If we were to see the internal working of it, one would receive a Margin Call when the Equity value becomes less than the Used Margin. That is when the floating loss becomes larger than the Used Margin.

Now, let’s get this concept cemented by considering an example.

Assume that a trader has deposited $1,000 in his account. Also, he went short on EURUSD for 10,000. The required margin for this trade was $300. Considering this to be the only running trade, the Used Margin will be $300 (same as the Required Margin).

Let’s say the trade is performing well, and the current unrealized P/L is $100. The Equity at this point of time will be,

Equity = Account Balance + Floating P/L = $1,000 + $100 = $1,100

Now, since the trade is running in profit, the Margin Level will obviously be above the Margin Call Level.

Later, let’s say the trade is going into the negative to -$700. The Equity now will turn out to be $300 ($1,000 – $700).

With these values, let’s find out the Margin Level.

Margin Level = (Equity / Used Margin) x 100% = ($300 / $300) x 100% = 100%

Assuming that the Margin Call Level set by the broker is 100%, the trader will now receive a Margin Call as the current Margin Level is at 100%.

Now, wondering what will happen if the Margin Level falls significantly below the Margin Call Level? The answer to this shall be discussed in the next lesson. Make sure to take the quiz below before you go.

[wp_quiz id=”51027″]
Categories
Forex Course

30. What Is Margin Level and How Is It Calculated?

Introduction

The margin concepts such as Used margin and Equity have proved to be essential to understand other margin terms. In this lesson, the concept of Margin level too revolves around the terms Used margin and Equity. Without further discussion, let’s get right into the understanding of the Margin level.

Margin Level

Margi level is the percentage ratio of Equity and Used margin. It is a term whose value is expressed in percentage. Also, the meaning of it is closely related to the Free margin.

The margin level determines if the trader can take new positions or not. It is a comparative factor as it is compared with a level set by the brokers. For easy comprehension, note that higher the margin level, higher is the possibility for the trader to take new positions and vice versa. Knowing the margin level is vital because this value has a relation with a Margin call and Stop out level as well.

Calculating Margin Level

The margin level is the ratio of Equity and Used margin expressed in terms of percentage.

Margin level = (Equity / Used Margin) x 100%

Understanding Margin Level

Similar to the Free margin, the Margin level will have no value when there are no positions open. This is simply because there is no margin used. However, when positions are open, the margin level has a non-zero value, which is dependent on the used margin and equity.

As mentioned earlier, the margin level determines if a trader is eligible to take new positions. And this is determined by the level set by the brokers. If the margin level falls below the level set by the brokers, the trader becomes ineligible to take a new position. Usually, the limit set by the brokers is 100%.

Example

Let’s say a trader has deposited $1,000 to their account and has gone long 10,000 units on USD/CAD. Below are the parameters that are to be calculated to determine the margin level:

  • Required margin
  • Used margin
  • Equity
Required Margin

If the margin requirement for this trade is 2%, the required margin will be,

Required margin = Notional value x Margin requirement = $10,000 x 2% = $200

Used Margin

Since there is only one position running, the value of the used margin will be equal to the value of the required margin, i.e., $200

Equity

Assuming the trade is running in a profit of $50, the equity is calculated as follows:

Equity = Account balance + Floating P/L = $1,000 + $50 = $1,050

Now that all the parameters are known, let’s go ahead and calculate the Margin level.

Margin Level

Margin level = (Equity / Used Margin) x 100% = ($1,050 / $200) x 100% = 525%

Now, since the value of the margin level is above 100%, the trader is still eligible to take new positions. This brings us to the end of this lesson on the Margin level. Don’t forget to take the below quiz.

[wp_quiz id=”50755″]
Categories
Forex Market Forex Risk Management

These Are Some Of The Best Position Sizing Techniques You Should Know!

Introduction

In our previous article, we addressed the concept of position sizing, drawdown, and techniques. Now we extend this discussion and look at other crucial aspects of position sizing, which are very important. In this article, let’s determine how one can position themselves in the forex market based on three different models. Each of these has its own merits that impose some sort of position sizing discipline in traders.

The three core position sizing techniques in terms of risk are:

  • Fixed lot per amount
  • Percentage margin
  • Degree of volatility

These models can be applied to all the asset classes and are time frame independent.

We suggest you stick to one model to estimate the position size or at most two position sizing techniques. Following every given method will increase complexity, and that is not good for a trader.

Fixed Lot Per Amount

This is a fairly simple model. It requires a trader to simply state how many lots he is willing to trade for a given amount of capital. For example, let us assume a trader is having $2000 in his trading account, and he trades only the major currency pairs like  EUR/USD, GBP/USD, GBP/JPY, USD/JPY, etc.

The trader simply needs to make a thumb rule that he/she will not trade more than one standard lot of futures (of major currency pairs) per $2000 at any given point.

The lot size can also be determined based on their risk appetite and money management principles. This technique of ‘fixed risk’ is based more on the discipline than strategy.

Percentage Margin

This position sizing technique is more structured than the ‘Fixed lot per amount’ technique, especially for intraday traders. It requires a trader to position themself based on the margin. Here, a trader essentially fixes an ‘X’ percentage of their capital as margin amount to any particular trade. Let’s see how this works with the help of an example.

Assume a trader named Tim has a trading capital of $5000; with this, he decides not to expose more than 20% as margin amount on a particular trade. This translates to a capital of $1000 per trade.

Now, if Tim gets an opportunity in another currency pair, he would be forced to let go of this margin as it would double to 40% (20% + 20%). This new opportunity will be out of his trading universe until and unless he increases his trading capital. Hence, one should not randomly increase the margin to accommodate opportunities.

The percentage margin ensures a trader pays roughly the same margin to all positions irrespective of the forex pair and volatility. Otherwise, they would end up in risky bets and therefore altering the entire risk profile of their account.

Degree Of Volatility

The degree of volatility accounts for the volatility of the underlying asset. To measure volatility, we make use of the ATR indicator, as suggested by Van Tharp. This position sizing technique defines the maximum amount of volatility exposure one can assume for the given trading capital.

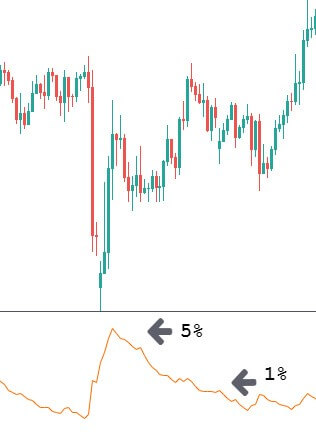
Below we have plotted the ATR indicator on to the USD/JPY forex chart.

The 14-day ATR has a peak and then a decline, which shows a decrease in volatility. As you know that high volatility conditions are the best times to trade (less slippage, high liquidity, etc.), you can risk up to 5% of your trading capital on the trade while one should not risk more than 1% when the ATR is at the lowest point. Do not forget the risks involved while trading highly volatile markets. Only use this position sizing technique when you completely trust your trading strategy.

Conclusion

A trader should not risk too much on any trade, especially if their trading capital is small. Remember, your odds of making a profit are high when you manage your position size and risk the right amount on each of the trade you take.

Beginners should trade thin to get experience with open positions, so they can assess the stress of a loss and gradually increase the position size as he is comfortable with the strategy results and performance. As a matter of fact, this is also the right way to proceed when trading live a new strategy, be it a beginner or an experienced trader.

Cheers!

Categories
Crypto Guides

What Is Adaptive Scaling In Cryptocurrency & How Is It Achieved?

Introduction

One of the most important motives behind the invention of cryptocurrencies is that they should have the ability to be an alternative financial system. That is, we, the users, should be able to use them just like how the fiat currencies are being used today, but with many more features and ease. While this thought is very ambitious, the journey has already begun with Bitcoin. The total market capitalization of all the cryptocurrencies combined is around $200 BN as of Dec 2019. 66.4% of this comes from Bitcoin alone.

No matter how many cryptocurrencies have come, the craze for Bitcoin didn’t decrease. As this craze was not anticipated during the inception of Bitcoin, the network had to endure scaling issues, i.e., the number of transactions processed per second. New age cryptos are handling scaling issues by incorporating advanced consensus algorithms. But the Bitcoin network wants to stick to the POW as 18 million Bitcoins are already mined out of the permissible 21 million.

Hence it is essential to make some changes to the Bitcoin network to increase its scalability. In this article, let’s see a couple of techniques that have been incorporated in the Bitcoin network to tackle this issue.

SegWit

SegWit stands for the segregation of witnesses. It is a protocol upgrade that changes the way data is stored in the blockchain network. SegWit was first implemented in Litecoin in May 2017, and later, very shortly, it is also implemented in the Bitcoin network by August 2017. Although the primary intention of this protocol is to fix a bug, the side benefit has taken much more significant importance. When the Bitcoin network started, each block size was limited to only 1 MB. As a result, only seven transactions were processed per second, which limits the potential of Bitcoin in the day to day transactions.

The signatures alone occupy 70% of this 1 MB data in the block. Hence it was proposed to eliminate the signature in the block and increase the number of transactions. By doing this, the number of transactions processed per second is increased while keeping the block size constant. This upgrade also enabled technologists to develop a second layer on the Bitcoin network, which allows smart contract functionality. It is named as the lightning network; let’s understand this concept in detail.

Lightning Network

Lightning network is essentially a system of smart contracts built as a second layer on top of the Bitcoin network. This network allows people to send/receive payments instantaneously with way lower transaction fees by keeping them off the main network.

Working

First and foremost, a payment channel must be set up using a multi-signature wallet. All the involved parties can access this wallet with their respective Private keys. The wallet address is then saved in the public blockchain network. The corresponding parties can make Bitcoin deposits to this wallet.

Once this is done, the parties involved can conduct an unlimited number of transactions without ever touching the main blockchain network. Every time the parties involved conduct a transaction, the balance sheet gets updated with the amounts each party holding.

Though the block size of the Bitcoin network has been increased to further cope up with the scaling issues, these were the two most favorable measures taken at the time when needed to make Bitcoin desirable for day to day transactions. We hope you understood the concept of adaptive scaling in a blockchain network. Stay tuned for more interesting crypto content. Cheers!

Categories
Forex Course

29. Other Important Margin Trading Terminologies – Free Margin

Introduction

In the previous lesson, the concept of used margin and equity was discussed. Apart from having their importance, these terms prove to be significant to understand other terms as well. And in this lesson, we will be dealing with a term that has a close relation with used margin and equity.

Just to brush things up, the used margin is basically the total amount of money that is used up by the broker for all the positions. In other words, it is simply the sum of the required margin for all the trades. And equity, on the other hand, is the sum of the account balance and the unrealized P/L. Now that these definitions are clear let’s understand what free margin is.

Free Margin

Free margin is the difference between the Equity and the Used margin. That is, Free margin is the amount that is available for the trader to take new positions. It is basically the complemented version of the Used Margin. Used margin is the margin that is locked by the broker for taking positions, while free margin is the margin that can be utilized to open new positions. Free margin is also referred to as available margin, usable margin, and usable maintenance margin.

Calculation of Free Margin

As already mentioned, the Free margin is calculated by finding the difference between Equity and Used margin.

Free Margin = Equity – Used Margin

In the previous lesson, it was discussed that equity changes continuously when any positions are open. Now, since Equity is one of the factors that determine the Free margin, the free margin also keeps constantly changing when positions are running.

So, when a trade is performing well, the floating P/L increases, which in turn increases the Equity as well as the Free margin. And conversely, the Free margin decreases when the floating P/L decreases.

Now that the formula is clear let’s understand it better with some examples.

Let’s say a trader has deposited $1,000 to their account and currently has no positions open yet. So, the account balance at this point would be $1,000. The Equity will be the same as the account balance as the floating P/L is $0. Since no trades are open, there is no margin used. From this, the free margin is calculated as:

Free Margin = Equity + Used Margin = $1,000 + $0 = $1,000

Thus, it can be concluded that Balance, Equity, and Free margin is the same when no positions are open.

Now, let’s say the trader went short 10,000 units on EUR/USD. Consider the required margin to be $150. Also, assume that the trade is running in a profit of $30.

Equity= Account balance + Floating P/L = $1,000 + $30 = $1,030

The used margin will be equal to $150 (required margin) as there is only one position open.

Free margin = Equity – Used margin = $1,030 – $150 = $880

We hope you understood what Free margin refers to in a margin account. In the coming lessons, we will be discussing the Margin level, Margin call level, and Stop out level. Check your learnings by taking up the below quiz.

[wp_quiz id=”50694″]
Categories
Forex Market

Finding The Optimal Risk % In Forex Trading

Introduction

Calculating risk is one of the most important parts of Money Mangement. Many novice traders or traders with limited experience won’t be aware of the amount of risk they can tolerate. In this article, we shall focus on determining the appropriate risk % that fits your trading style. The goal of risk management is to gain control over three things:

  • Emotions
  • Leverage
  • Sustenance

Furthermore, by limiting the loss per trade, a trader can ensure that his/her trading capital is not wiped out in one single trade. Having this discipline systematically reduces the loss per trade and provides an opportunity for the trader to re-look at the situation.

Calculating the risk

One can determine the risk based on the following factors:

Win rate

Win rate refers to how often a trader takes profitable trades relative to the trades that result in a loss. Win rate is determined by using the risk-to-reward ratio (RRR) and is calculated by the following formula.

Win rate = 1/(1+RRR)

The above-given formula is also referred to as the Minimum win rate. If any trader is trading with an RRR of 1, then his/her minimum win rate will be 50%. So out of 100 trades, we require a minimum of 50 trades to end as winners to compensate for the losing trades.

This will help a trader in deciding their maximum risk based on the win rate. This formula can also determine if a trade can be taken or not. For example, if someone has a win rate of 25%, he/she will not be able to take trades that have a risk-to-reward ratio of less than 3.

Nature of the market

Depending on the market situation, the risk can vary substantially. In a trending market, like the one in the below chart, risk should be reduced as much as possible by using a stop-loss order. We are recommending this idea as you would most probably be trend trading, and there is no point in risking more than the usual (can be lesser).

Trending Market

In a market that is trapped in a range (below image), the risk is always higher. This means anyone who trades the consolidation market is essentially increasing their risk. This would mean increasing the stop-loss, thereby reducing the risk-to-reward ratio (RRR) of the trade.

Ranging Market

Maintaining a risk of 1% constantly, regardless of the market conditions, will help the traders to sustain the loses and stay in the game even after a series of losing trades. This is a conservative method that reaps fewer rewards, but the risk is certain.

Conclusion

The aim is to achieve some level of consistency in trading by allowing yourself and your trading strategy to fight the evil forces of the market. We would say in all circumstances, a max risk of 1% appears to be the winner if you are a conservative trader. When the risk increases, it is said to impact not only the capital of the trading account but also the psychology of a trader. Hence it is better to keep risk at a bare minimum in times of uncertainty.

Categories
Forex Market

Understanding Drawdown & Its Relation With Position Size

Introduction

Do you know that there is a safe way to choose the maximum lot size when you trade? That too while keeping your account safe from blowing when a losing streak of trades occur? To constantly stay in the game and be able to recover from losses requires patience, clarity, and, more importantly – optimal Position sizing. The position size in simple words is how much a trader invests in each trade. There are different models deployed to reach the optimal position sizing depending on the objective of the trade. Before that, let’s first understand what drawdown is and how it is related to position sizing.

What is the maximum drawdown?

The maximum drawdown is the biggest drop in the accumulated profit chart and, consequently, that of the trading capital. Imagine a situation where a trader had 200 pips in profit after a number of trades, and on the following days’ profit dropped to 136 pips before he can make new accumulated high.

So, the drawdown here was 200-136 = 64 pips

When this drawdown increases, it reaches a level (negative drawdown), after which it becomes impossible to trade (due to loss of trading capital). Maximum drawdown is the loss that the trader can take in order to survive in the market and be able to continue trading.

How is drawdown related to position sizing?

Taking the above example, let us assume that the trading capital was $500 and the trader trades with a lot size of 0.01. The drawdown he experienced was 64 pips, which is $6.4 (1 Pip = $0.1). So the amount of money he/she risking in this trade is 6.4/500 x 100 = 1.28% of the account size.

Now let us see how this drawdown increases with a change in position size.

How much drawdown can I handle so that it doesn’t affect the mental state and my trading style?

As you can see below, the drawdown % increase as the lot size increases and the account gets into an unsustainable state (Especially when the Trading Capital is $500). Hence you need to calculate risk based on your risk tolerance drawdown.

The right way to look at drawdown and position size

Typically, the drawdown occurs after a series of consecutive losses. The very first thing a trader needs to do is to analyze and figure out the number of losing trader he/she can endure. Depending on that, the maximum risk percentage should be defined. So essentially, this percentage is the maximum amount of trading capital a trader affords to lose. If the losses cross this percentage, his/her account get unsustainable.

For instance, I can bear a maximum drawdown of 20%. So I should be willing to design a strategy and chose my trading size in such a way that it is very unlikely for me to reach the 20% drawdown. Let’s denote the number of losing streaks as N. I should make sure that my strategy has a winning percentage of at least 50% or more with high RRRs. Let’s assume the maximum number of losing streaks I can afford is 10 (i.e. N=10).

Dividing the maximum drawdown (20%) with N (10) gives 2%. This means that I cannot risk more than 2% of my trading capital on a trade to sustain in the market. If I have more than one open trading position, I should be distributing the risk among all of the open positions. So here, if I have 2 open positions, I shouldn’t be risking more than 1% in each of the trades. This is one of the best ways to look at drawdown and position size.

Different approaches to position sizing

Defined Percentage Risk

In this position sizing strategy, we risk a fixed percentage of the trading capital (e.g., 1%) for each trade. This is followed by most of the traders across the world and it is pretty simple to use as well. Essentially, the trader is required to put the stop-loss more accurately and not randomly to prevent the stop-loss hunt. This might sound pretty easy but it needs a lot of discipline to overcome the greed and not raise the position size when you see a clear profitable trading signal.

The Kelly Criterion Model

John Kelly described this criterion pretty long ago, which computes the optimal position size for a series of trades.

Kelly Percentage = W – [(1-W) / R)

Where, W – Winning probability and R – Profit/Loss ratio

When a trader keeps a record of all their trades, they can calculate their winning probability and profit/loss ratio. Then, they can use them in the above equation to calculate the optimal position size.

Conclusion

You now know the importance of position size and its relation to drawdown. By using this, leverage can also be used appropriately to avoid blowing-up your account because of the drawdown. By doing this, you can maximize your earnings and reduce drawdown to an acceptable value.

Our suggestion for you is to use a trading strategy for a long time. If a strategy hasn’t been tried many times, the big drawdown might not have appeared yet. The bigger the history of using the strategy, the more confidence you will get to increase the lot size. Cheers!

Categories
Forex Course

28. What Should You Know About Used Margin and Equity

Introduction

In the previous lesson, three terms related to margin was discussed. There is another term called used margin, which comes under the same roof of the margin requirement and required margin. And in the lesson, this term shall be discussed in detail. Apart from that, this lesson shall touch base on the concept of Equity in margin trading.

Before diving directly into the topic, let’s first brush up the previously discussed terms as they form the base for this lesson. To Start off with the Required Margin, it is basically the units of currency that is needed to open a position. Note that this is not the actual amount of the position size but the amount after applying the Margin Requirement to the required margin.

Used Margin

The Used margin is the term that is very similar to the required margin. In fact, the used margin is the required margin. However, there is a thin line difference between the two.

The Used margin is the amount that is blocked by the broker when positions are open on a trader’s account. This definition might seem the same as that of the required margin. The difference is that the required margin talks about one single trade, while the used margin considers the sum of the required margin of all the trades. This is the amount that is ‘used’ by the broker when the trade is open and cannot be utilized for taking new positions. However, once the positions are closed, this used margin is unblocked and returned to the account balance.

Example

Let’s say a trader has $1,000 in his account and wishes to open trades on EUR/USD and USD/CHF.

Let’s assume he is willing to go short 10,000 units on USD/CHF and long 1,000 units on EUR/USD. Let’s keep the margin requirement for USD/CHF and EUR/USD to 2%, respectively. Before going into the calculation of the used margin, the required margin is calculated as follows:

USD/CHF

Required margin = Notional Value x Margin Requirement = $10,000 x 0.02 = $200

EUR/USD

Required margin = Notional Value x Margin requirement = $1,000 x 0.02 = $20

Therefore, when positions on both trades are opened, the used margin turns out to be $220*.

*Used margin = $200 + $20 = $220

Equity

Equity is a variable term that represents the current value of the account balance. Equity constantly changes when traders have their positions running. This proves to be an important term because it determines how many more positions can be taken on this account.

Calculation of Equity

The calculation of Equity is simple. It is the algebraic sum of the account balance and the unrealized P/L. When there are no positions open, the Equity will be the same as the account balance as the unrealized P/L is 0. And when there are any running positions, the Equity will be determined by both account balance and unrealized P/L.

Equity = Account Balance + Floating P/L

From this, it can be inferred that, when trades are running in the positive, the Equity rises, and when they’re in the negative, the Equity drops.

Thus, this completes the lesson on Used Margin and Equity. In the next lesson, some advanced term on margin shall be introduced. Don’t forget to take the below quiz before you move on.

[wp_quiz id=”50341″]
Categories
Forex Basic Strategies

Trading With The Bollinger Band %B Indicator

Introduction

If you have experience trading with the Bollinger Bands indicator, you will find it easy to trade with the Bollinger Band %B indicator. The only difference is that, in this indicator, you can identify the relationship between the price and the bands with at most clarity.

What is the Bollinger Band %B indicator?

It is basically a technical indicator that quantifies the price of an asset with respect to the upper and lower limits of Bollinger Bands. We have derived 6 relations between the price and the indicator.

  • The %B is at zero when the currency pair is at the lower band.
  • % B will be at 100 when the currency pair is at the upper band.
  • The indicator is above 100 when the price of the currency pair above the upper band.
  • It is below zero when the price goes below the lower band.
  • The %B is above 50 when the price goes above the middle band.
  • And it is below 50 when the price goes below the middle band.

The Bollinger band %B uses the 20-day simple moving average (SMA) as the default parameter, just like the Bollinger Bands. This indicator is available on most of the trading platforms and terminals.

Bollinger Band %B formula

%B = (Price – Lower Band) / (Upper Band – Lower band)

Things to know

Before understanding the strategy, it is necessary to know a few things about the indicator as these concepts will be used in every step of the strategy. Below is the chart of a forex pair with the Bollinger Band %B indicator plotted to it.

  • The upper dashed line represents the 100% level of the %B indicator also known as the upper band.
  • The lower dashed line represents the 0% level also known as the lower band of the indicator.
  • The area in between the two dashed lines is known as the middle band.

These bands help us in identifying different trading opportunities. Hence, one needs to know about it before knowing the strategy.

The Strategy

Step 1: Identify the major trend

To identify the overall trend of the market, the trader needs to shrink the chart and determine the trend.

An uptrend is defined as a series of higher highs and higher lows, while a downtrend is defined as a series of lower lows and lower highs. In this strategy, we have taken the example of a downtrend, as shown in the figure. One can also see lower lows and lower highs in the above chart.

Let us see how the strategy works.

Step 2: Find the price where %B is above 100 or below 0 in the currency pair.

In this step, we are looking for the price where the indicator is above the upper band or below the lower band. This extreme price action is said to continue for long after taking a suitable entry.

A sell setup is formed when the indicator crosses below the lower band, and a buy setup is formed when the indicator crosses above the upper band. This strategy is almost reverse of other strategies (as oversold indicates buying in other strategies).

The above chart shows the crossing of the indicator below the lower band, which is apt for a sell trade. Just because the price is below the dashed line, we cannot take an entry immediately.

The next step is to find a pullback and then make an entry. We will then see how and where to take profits.

Step 3: Take an entry only at a suitable pullback.

By suitable pullback, we mean the opposite color candles should not be swift candles and should not make higher highs. If this happens, the current trend can be weak and may not sustain. The %B indicator can also assist us with the same, as the indicator should move slowly after crossing the lower band. If the indicator reacts and moves fast, it means the pullback is strong and could also result in a reversal. Finally, an entry can be taken after the close of at least two pullback candles.

The below figure explains the above paragraph clearly.

Step 4: Determining how to take profit

In this strategy, we follow a rule-based system for making profits which are again based on our indicator. A trader needs to cover his position after the indicator crosses the lower band once again and goes above the dashed line. This style of taking profit is different than in other strategies where it is based on a fixed percentage. This way of taking profits ensures that a trader is trading based on rules and guidelines which is a disciplined approach.

The below figure explains how profit is taken and the position is covered.

When the indicator goes above the 0% (lower band) level after crossing below, it means profit can be taken now and the trade can be closed.

Step 5: Place a protective stop

Stop-loss is a mandatory and essential part of risk management, hence it needs to determined before entering a trade. For this strategy, stop-loss is placed above the high of the pullback which makes it an optimal place. The stop-loss, in this case, is very small which increases the risk to reward ratio (RR) considerably.

Here is exactly where it is recommended to put the stop loss.

The final trade setup would look something like this 👇

This results in a minimum of 2:1 RRR.

Final words

This is one of the easiest strategies which can be learned by new and experienced traders. It makes use of simple Bollinger bands added with a %B indicator. This indicator can also be combined with several other technical indicators and trading systems, but this alone, too, has a very good level of accuracy.  Now, we have to follow the money management principles to take the best trades and make huge profits from the same strategy. For this, you can also refer to our money management article series, which talks on various risk management topics. Cheers!

Categories
Forex Basic Strategies

Trading Price Channels Like A Professional Forex Trader

Introduction

One of the most important characteristics of price in the Forex market is that it moves in the form of channels 20-25% of the time. So it is crucial to learn how to trade the market when it is in this state. The price channel strategy that we are going to discuss is intuitive and most straightforward. In this article, we will see how to implement this strategy and take profitable trades while reducing risk at the same time. Let’s get right into it.

What is the price channel pattern?

Before exploring the strategy, we need to know what a price channel means and the different types of channels. The price channel represents two trend lines drawn above (channel resistance) and below (channel support) the price. The price moves within these two trend lines.

The width of the channel should be big enough if you want to trade inside it. In this case, a simple trade would be to buy at channel support and sell at the channel resistance level.
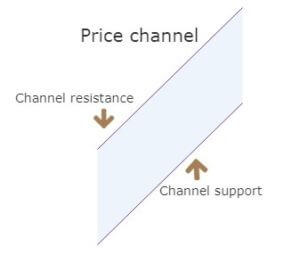
However, the most significant opportunity is to trade the channel breakout.

We can distinguish the channel into two types:

  • Upward price channel
  • Downward price channel

An upward price channel occurs when price makes higher highs and higher lows. More the number of touches the price makes to channel’s support and resistance, stronger is the channel.
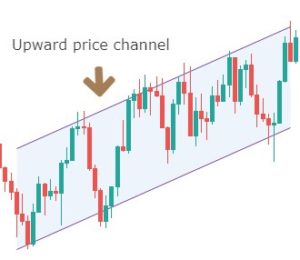
A downward price channel occurs when the price makes a series of lower lows and lower highs. The trend line should be able to connect to these points; only then we can call it a channel.
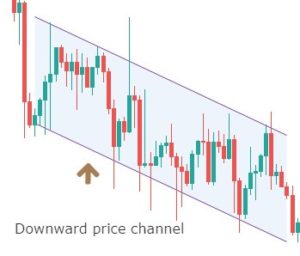
This represents the consolidation or ranging zone. Here the market bounces on and off between the two support and resistance lines.

If you understand the psychology and reason behind the formation of a price channel, it can save you a lot of losing trades. The reason why channel breakout is so significant is that many traders trade inside the channel. They place their stop loss above or below the price channel pattern.

As more and more traders start placing their stops, they will eventually be targeted by smart money. One needs to remember that a price channel won’t last forever. Breakout in any form is inevitable.

So, now, let’s see what the price channel strategy is and how to trade it effectively. This strategy is independent of technical indicators and does not make use of it (except for taking profits). Hence, there is no prior knowledge of technical indicators is required.

Price channel strategy

Recognize the early signs of a price channel breakout, as this will help you make better decisions. This strategy is based on such breakout signs, so knowing about them in advance is an advantage.

Here are the various steps involved in the strategy. We will be taking the example of a sell trade.

Step 1: Draw an upward channel

The upward channel should be constructed in such a way that it should connect at least two higher highs and higher lows. You can also make use of the price channel tool, which is provided by most trading platforms to connect the highs and lows.
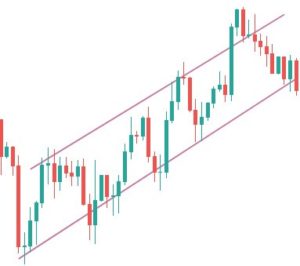
Before the breakout, we need to make sure of an important rule, which brings us to the next step.

Step 2: For an upward channel, look for a false breakout above the channel resistance.  

In the case of an upward channel, the first warning would be the price failing at the resistance and giving a false indication that the price has broken above resistance.
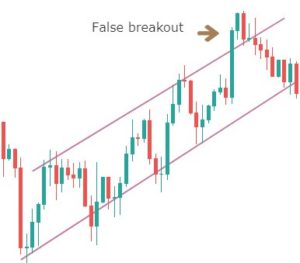
Only this strategy makes use of this powerful price reading technique. It is in this unique style that we have developed this strategy. The failed attempt at the top is a sign of ‘stop-loss hunt’ by large players, which is confirmed when the price comes back to the channel support.

Note – The more times a ‘swing high‘ tries to get violated and fails, the stronger will be the breakdown.

Step 3: Wait for the breakdown and confirmation

A mistake that most traders do is that they don’t wait for a confirmation signal after the breakdown happens. For this strategy, the confirmation is to wait for the breakdown candle to close below the channel support. Before this, wait for the breakdown and then look for confirmation.
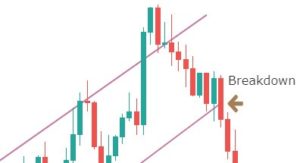
The closing of the candle should be like one in the below figure.
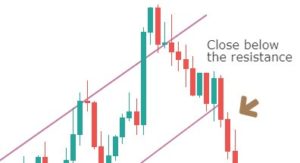
So, don’t just sell after the support is broken. Instead, see that the breakdown candle closes below the price channel. This is an effortless way to avoid false breakdown signals.

Note – If the breakdown candle is decisive, it’s good, but not mandatory.

Then what is the exact point of entry? This brings us to the fourth step of the strategy.

Step 4: Sell right at the closing candle

The entry technique of the strategy is quite simple. A sell order can be executed at the breakdown candle closing price.
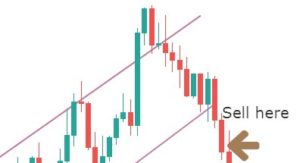
Now you can be confident in taking the trade, as you have done everything right until now. The next logical thing to do is to determine where to take profits and place the protective stops.

Step 5: Take 50% profit at consolidation near EMA and rest 50% after price crosses above the EMA. The stop loss has to be placed above the channel support.           

We will be taking profits based on EMA plotted on our chart. Our first potential take profit zone is when the price starts to consolidate near the EMA and touches the line multiple times, as this means that the trend might be coming to an end.

The second potential take profit zone is when the price crosses above the EMA, signaling a reversal of the current trend.
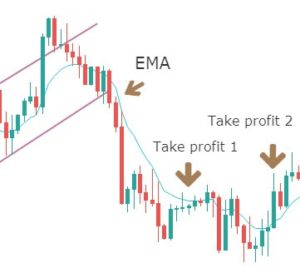
Next, we need to establish our stop-loss.

The stop-loss is placed right above the price channel support, which was broken. Stop-loss can also be extended up to price channel resistance to give more room for the price.
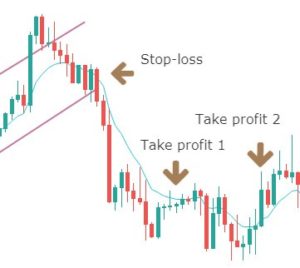
Finally, the trade would look something like in the below figure. This trade will result in a risk to reward ratio of 1:1 minimum. However, if you are patient enough to wait for the trend to continue, the RRR can be increased.
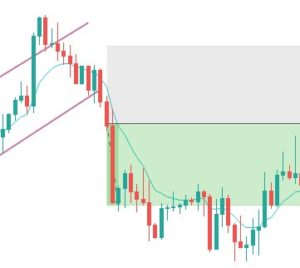
Note – The above trade is an example of a sell trade. The same rules apply for a ‘buy trade,’ but in reverse, as this time, you will be using a downward price channel.

Bottom Line

The price channel strategy can be used in any kind of market. It can also be incorporated into your current strategy to bring a new dimension to price action trading. If you are good at spotting price patterns and money management, this strategy can make huge profits. Happy Trading!

Categories
Forex Market

Advantages & Risks Involved With Volatility Trading In The Forex Market

Introduction

The forex market offers a lot of trading opportunities, but still, many traders find it difficult to make profits consistently. Emotions combined with undue risk and money management are often the main obstacles that new traders face.

In this article, we will discuss the hourly volatility in the forex market and the trading risks involved during these hours. Some traders trade the market based on its volatility. Few traders enjoy volatile markets, while others prefer trading in non-volatile conditions. So let’s get right into the topic.

The volatility of a major currency pair

Hourly volatility is relevant to short term forex traders but is not a significant factor for long term investors. The global trading sessions affect volatility within the 24 hours. A forex pair is typically most volatile when a major trading session opens, or two market sessions overlap with one another. For example, EUR/USD is the most volatile and active when London or New York is open because these markets are associated with the Euro and USD, respectively. The below figure depicts the volatility of EUR/USD in a day.

The average volatility of EUR/USD currency pair on a single day

The bar chart shown above represents the volatility of EUR/USD in a day. It depicts nothing but a candle with lower wick, body, and upper wick. One can see that during the Asia session, the price is not volatile. Whereas during the New York session, the price makes large movements shown by larger wick and body of the bar chart. Even without looking at candlestick charts on the trading platform, these bar charts are sufficient to decide at what time to trade during the day, which is much easier than analyzing candlestick charts.

Low volatile hours – Asia Session and Time b/w NY close & Asia Open  

Traders have a misperception that “More risk equals more return.” There is no doubt that highly volatile pairs deliver impressive returns, but research and data have found that lower-volatility sessions generate risk-adjusted returns over time. This is the reason why traders include the ‘Low volatility factor’ in their portfolio.

Risk of trading in low volatile hours

In times of low volatility, there is increased slippage, which means a trader will hardly get the price they desire for. This would mean eating up of their profits, or even sometimes a complete drain of profits (when trading on a lower time frame). In this way, a trader will not be trading according to the rules of money management. Hence, to manage risk, there is a right way to trade during such times. Some of them are discussed below.

Why is it important?

There are several reasons why trading in lower volatility conditions has the potential to create a lot of money over the long term.

Leverage aversion– In money management theory, we had mentioned earlier that the more leverage a trader use, the more is the risk. In times of lower volatility, traders are restricted from using the leverage from their trading account. As a result, they buy and sell currency pairs that are less risky with good profit potential.

The lottery ticket– Many traders treat the forex market as a “lottery” where they buy and sell currency pairs like they are purchasing lottery tickets. This, in turn, raises the bid of high-risk pairs, which leads to the type of lottery effect and increases volatility. Here, we need to find pairs that are under no one’s attention and buy them (which will be least volatile).

High volatile hours – London & New York Sessions

Many traders live on volatility in the forex market, as volatility is what creates profitable trading opportunities.

Risk of trading in high volatile hours

High volatility hours also has its own disadvantages. During such times, one can see their stop-losses getting triggered frequently. This happens due to the tricks played by more significant players like stop-loss hunting. Another risk is the high leverage provided by forex brokers. So to manage these risks, high volatile hours should be traded in a certain way. Some of them are listed below.

Trend trading– One key opportunity in a volatile market is that trending currency pairs may see the rate of their trend increase. When we are trading with the trend, our risk drastically reduces, which is good for money management.

Short-term strategies– In volatile markets, strategies work the best by booking profits automatically than manually. In this way, we will be eliminating emotions in trading as everything will be done by the system, which is crucial for risk management. Strategies also make use of indicators like RSI and Bollinger bands, which help in identifying overbought and oversold zones.

Bottom line

Every trading session and hour has its own advantages and risks, which a trader needs to evaluate, based on his/her risk appetite. The right time to trade depends on the personality of the trader and style of trading. Volatility on an hourly basis is more complex than how much a forex pair moves each day on an average basis. We see volatility varies drastically across different hours of the day and days of the week. We need to monitor and adapt to these changes. Cheers!

Categories
Forex Course

27. Understanding Margin Amount, Margin Requirement, and Required Margin

Introduction

In the previous two lessons, the basic terms in a margin account were discussed. And this lesson shall talk about the concept of Margin in detail. Precisely, this chapter of the course will deal with Margin, Margin Requirement, and Required Margin, as these three terms are very crucial when it comes to handling a margin account.

Margin, Margin Requirement, and Required Margin are closely related to each other.    Margin, the used term in margin trading, is the amount one needs to possess to open a position. And Margin Requirement and Required Margin are terms which mean the same but differ in notation. Now, let’s dive right into the topic and understand each one of the terms in detail.

Margin Amount

It is the amount that is used up or blocked by the broker to open and maintain a position in the forex. An important point to be noted here is that capital blocked is usually not the same as the lot size traded. Hence, the Margin Amount can be related to deposit or collateral that is payable to be the broker. However, this amount differs based on the number of lots traded.

The margin amount is blocked from the account balance when a trade is opened and is freed to the account balance when the trade is closed.

Margin Requirement

Margin Requirement describes what percentage of the position size is required to open a position. For example, if the Margin Requirement for a trade is 3%, then 3% of the position size is to be produced by the trader to open the position. So, when brokers mention that Margin in terms of percentage, then they are referring to Margin Requirement.

Required Margin

Required Margin is simply the Margin Requirement expressed in terms of units of currency. For example, if the margin requirement is 1% to take a position worth $10,000, then the Required Margin for the same will be $100.

Calculation of Required Margin

Since Required Margin is closely related to the Margin Requirement, the Required Margin is the product of Margin Requirement and the Notional Value.

Required Margin = Margin Requirement x Notional Value

Summary

Let’s sum up all the terms by taking an example. Let’s say a trader has $1,000 in his trading account. This amount can be read as a balance, as well. Let’s say he wishes to go long 10,000 units on EURUSD. Also, let’s assume that 2% of the position size value is required to open a trade.

The Notional value, Margin Requirement, Required Margin can be calculated as follows:

Assuming an account dominated in the USD, the Notional value turns out to be $10,000. Similarly, the Margin Requirement will be 2%, and the Required Margin will be $200*.

*(Required Margin = $10,000 x 2%)

When the trade is placed, $200 is blocked by the broker as “margin.” And once the position is closed, the complete margin amount (deposit) will be added back to your account balance, given that the trader did not make a loss.

This brings us to the end of this lesson. Let’s see if you can get all the below questions right!

[wp_quiz id=”49837″]
Categories
Forex Risk Management

Basics of Risk To Reward Ratio In Forex Trading

Introduction

The Risk to Reward Ratio is one of the most critical aspects of risk management in Forex trading. Traders with a clear understanding of what RRR is can improve his/her chances of making more profits. In this article, let’s discuss the fundamentals of Risk to Reward ratio with examples and also the ways through which it can be increased while taking your trades.

What is the Risk to Reward Ratio?

Before getting right into the topic, let’s define the meaning of ‘Risk’ here. Risk is the amount of money that a trader is willing to lose in a trade. If you have read our previous money management articles, we mentioned that a trader should not be risking more than 2-3% of their trading capital in each trade. It means when they find a trade setup, they should choose their position size in such a way that if the market hits their stop-loss, they lose a maximum of 2-3% of their trading capital.

Now, the Risk to Reward Ratio is simply the ratio between the size of your stop-loss to the size of your target profit. Let’s say your stop-loss is five pips away from your entry price and your target profit is ten pips away from the entry. In this case, your risk to reward ratio is 1:2 (5 Pips/ 10 Pips).

The larger the profit against the stop loss, the smaller the risk to reward ratio. Which means your risk is a lot smaller than your reward.

What is the recommended risk to reward ratio in the forex market?

Typically, a minimum of 1:1 or 1:2 RRR is recommended for novice traders. There are super conservative traders where they look for a minimum RRR of 1:5.

The risk to reward in every trade cannot be fixed as it varies depending on the market condition. For example, 1:3 or 1:5 RR ratio is achievable when the market is trending, and you enter the market at the right time. Whereas when the market is not very volatile, we should be happy with a risk to reward ratio of 1:1.

How to increase the risk to reward (RR) ratio?

🏳️ Raising target and putting stop-loss to breakeven

A trader can think of raising the target if the market moves to the initial take-profit quickly. This is because when the market moves so fast, it has the potential to move further, thereby increasing the profits.

🏳️ Finding trade setups from the larger time frame

Another way to increase the risk to reward (RR) ratio is by taking the strong trade setups from the higher time frames like daily, weekly, and monthly. We need to wait for such strong trade setups to form. Once formed, the price will move for hundreds of pips, and so we can have wide targets.

Final words

Higher the RRR, the better it is, and of course, higher RRRs are more challenging to achieve. So, do not forget to keep the expectations real and the risks appropriate. You do not have to avoid perfect trades just because the RRR is not as high as 1:5. Make sure to do proper risk management before placing a trade. Never trade with a risk to reward ratio that is too less and try to maximize it as much as possible. Cheers!

Categories
Forex Course

26. Margin Terminologies – Unrealized P/L and Realized P/L

Introduction

In the previous lesson, the concept of balance was discussed. And in this lesson, two more terms shall be opened up, namely, unrealized P/L and realized P/L. First up, P/L is an abbreviation for Profit/Loss. Many assume that there is only one type of P/L, but this is not true. Not just in forex, in other markets as well, there exists both unrealized and realized P/L. Now, let’s begin with understanding each term with the help of examples.

Unrealized P/L

Unrealized P/L, as the name clearly suggests, is the profit or loss running in a trade that is not closed. The profit/loss in unrealized P/L constantly changes as the prices keep changing. Hence, this type of P/L is also referred to as Floating P/L.

The Unrealized P/L is calculated as follows:

Unrealized P/L = Position size x (CMP – Entry price)  [Long]

Unrealized P/L = Position size x (Entry price – CMP)  [Short]

(CMP – Currency Market Price)

This above formula gives the value in terms of pips. The value in terms of currency can be calculated by multiplying it with the pip value of the currency pair.

Example Unrealized P/L or Floating P/L

Let’s assume a trader bought 10,000 units of EURUSD at 1.4100. After a while, the price rises to 1.5000. If the trade is still running, the floating P/L can be determined, as shown.

Since this is a long trade, the following formula is applied.

Unrealized P/L = Position size x (CMP – Entry price)

= 10,000 x (1.6100 – 1.5000)

= 10,000 x (0.11)

Unrealized P/L = 1,100 pips

Hence, the trade is currently running at a profit of 1,100 pips.

Now, if the pip value for a mini lot for EURUSD is $1, the profit sums up to $1,100 (1,100 x $1).

Now, bringing the concept of balance into the picture, the balance for unrealized P/L will not get affected though the trade is in profit or loss. However, once the trade is closed, the balance does get updated.

Realized P/L

Realized P/L is the profit or loss in a trade when it closed. Realized P/L is more significant than the unrealized P/L because this is the one that brings a change to the account balance.

The realized P/L can be calculated using the below formula:

Realized P/L = Position size x (Closing price – Entry price)  [Long]

Realized P/L = Position size x (Entry price – Closing price)  [Short]

Example – Realized P/L

Let’s say a trader went long on EURUSD with 10,000 units at 1.1000. The price drops down to 1.0000. Since the current market price is lower than the entry price, it can be ascertained that the trade is running in a loss, i.e., the unrealized P/L would be negative. Later, the price jumps up to 1.2000. At this point, the trader closes the trade. Since the trade is now closed, the realized P/L can be calculated as follows.

Realized P/L = Position size x (Closing price – Entry price)

= 10,000 x (1.2000 – 1.1000)

Realized P/L = 1,000 pips

In terms of currency value, the realized P/L will be $1,000 (1,000 pips x $1). And this time, the balance will be updated as well.

Hence, this begins us to the end of this lesson. In the next lesson, another important margin terminology shall be discussed. Before you go, make sure to take the below quiz to know if you have got the concepts right.

[wp_quiz id=”49571″]
Categories
Forex Basic Strategies Forex Fibonacci

Perfecting The Fibonacci Retracements Trading Strategy

Introduction

The Fibonacci tool was developed by Leonardo Pisano, who was born in 1175 AD in Italy. Pisano was one of the greatest mathematicians of the middle ages. He brought the current decimal system to the western world ( learned from Arab merchants on his trips to African lands). Before that, mathematicians were struggling with the awkward roman numerical system. That advancement was the basis for modern mathematics and calculus.

He also developed a series of numbers using which he created Fibonacci ratios describing the proportions. Traders have been using these ratios for many years, and market participants are still using it in their daily trading activities.

In today’s article, we will be sharing a simple Fibonacci Retracement Trading Strategy that uses Fibonacci extensions along with trend lines to find accurate trades. There are multiple ways of using the Fibonacci tool, but one of the best ways to trade with Fibonacci is by using trend lines.

With this Fibonacci trading strategy, a trader will find everything they need to know about the Fibonacci retracement tool. This tool can also be combined with other technical indicators to give confirmation signals for entries and exits. It also finds its use in different trading strategies.

Below is a picture of the different ratios that Leonardo created. We will get into details of these lines as we start explaining the strategy.

Strategy Prerequisites

Most of the charting software usually comes with these ratios, but a trader needs to know how to plot them on the chart. Many traders use this tool irrespective of the trading strategy, as they feel it is a powerful tool. The first thing we need to know is where to apply these fibs. They are placed on the swing high/swing low.

  • A swing high is a point where there are at least two lower highs to its right
  • A swing low is a point where there are at least two higher lows to its right

If you are uncertain of what the above definitions meant, have a look at the below chart.

Here’s how it would look after plotting Fibonacci retracement on the chart.

In an uptrend, it is drawn by dragging the Fibonacci level from the swing high all the way to swing low. In case of a downtrend, start with the swing high and drag the cursor down to the swing low. Let’s go ahead and find out how this strategy works.

The Strategy

This strategy can be used in any market, like stocks, options, futures, and of course, Forex as well. It works on all the time frames, as well. Since the Fibonacci tool is trend-following, we will be taking advantage of the retracements in the trend and profit from it. Traders look at Fibonacci levels as areas of support and resistance, which is why these levels could be a difference-maker to a trader’s success.

Below are the detailed steps involved in trading with this strategy

Step 1 – Find the long term (4H or daily time frame) trend of a currency pair

This is a very simple step but crucial, as well. Because we need to make sure if the market is either in an uptrend or a downtrend. For explanation purposes, we will be examining an uptrend. We will be looking for a retracement in the trend and take an entry based on our rules.

Step 2 – Draw a line connecting the higher lows. This line becomes our trendline.

The trend line acts as support and resistance levels for us. In this example, we will be using it as support.

Step 3 – Draw the Fibonacci from Swing low to Swing high

Use the Fibonacci retracement tool of your trading software and place it on swing low. Extend this line up to the swing high. Since it is an uptrend, we started with a 100% level at the swing low and ended with 0% at the swing high.

Step 4 – Wait for the price to hit the trend line between 38.2% and 61.8% Fibonacci levels.

In the below-given figure, we can see that the price is touching the trend line at two points (1 and 2). There is a significant difference between the two points. At point 1, the price touches the trend line between 78.6% and 100%, whereas, at point 2, the price touches the trend line between 38.2% and 61.8%.

The region between 38.2% and 61.8% is known as the Fibonacci Golden Ratio, which is critical to us. A trader should be buying only when the price retraces to the golden ratio, retracements to other levels should not be considered. Therefore, point 2 is where we will be looking for buying opportunities.

Step 5 – Entry and Stop-loss

Enter the market after price closes either above the 38.2% or 50% level. We need to wait until this happens, as the price may not move back up. However, it should not take long as the trend should continue upwards after hitting the support line.

For placing the stop loss, look at previous support or resistance from where the price broke out and put it below that. In this example, stop loss can be placed 50% and 61.8% Fibonacci level because if it breaks the 50% level, the uptrend would have become invalidated. The trade would look something like this.

Final words

The Fibonacci retracement tool is a prevalent tool used by many technical traders. It determines the support and resistance levels using a simple mathematical formula. Do not always rely only on Fibonacci ratios, as no indicator works perfectly alone. Use additional tools like technical analysis or other credible indicators to confirm the authenticity and accuracy of the generated trading signals. One more important point that shouldn’t be forgotten is not to use Fibonacci on very short-term charts as the market is volatile. Applying Fibonacci on longer time frames yield better results.

We hope you find this strategy informative. Try this strategy in daily trading activities and let us know if they helped you to trade better. Cheers!

Categories
Forex Course

25. Margin Terminologies – Balance & Rollover

In the previous lesson, we have understood the fundamentals of margin/leverage trading. In this lesson and the following few lessons, we shall be discussing different terms related to margin and margin account. And in this lesson, we will primarily talk about balance and also a brief description of the concept of rollover in Forex.

What is Balance?

Balance is the most basic term used in any type of account. Be it a regular savings account, a Demat account, or a margin account. The meaning of balance remains the same in the margin account as well, just like other account types.

Balance in a margin trading account is the amount of capital deposited by the user to his/her trading account. For example, if a trader deposits $1,000 to their margin trading account, then their balance would be equal to $1,000. This is the amount used for taking positions in the market. Apart from that, it is used up for other stuff as well, which will be discussed in the next sections of this article.

Another vital point to note here is that the balance amount is not affected when a trader enters a trade or when a position is open. The balance gets updated only after the trade is closed (rollover fee is an exception).

When does the balance gets affected?

The balance in a margin account is affected in the following ways:

  • When cash is deposited to the margin account.
  • When an open position is squared off (closed).
  • When open positions are kept overnight, so, though positions are open, funds will be debited from or credited to the margin account. And this fee is referred to as the rollover fee. 

What is Rollover in trading?

The concept of rollover is not a term that comes under a margin account. However, since this term is closely related to balance, it shall be discussed in this lesson.

As the name pretty much suggests, rollover is the process of shifting an open position from one trading day to another. This is a process that is done automatically by the brokers. As far as the internal working of rollover is concerned, the brokers close a position at the end of the trading day and simultaneously open a new position (at the closing price) the next trading day.

For this rollover to be done, brokers charge a fee called ‘swap.’ This is where the balance comes into the picture, as swap brings a change to the balance. Note that swap happens in both ways, i.e., it can be debited from as well as deposited to the user’s account balance. The interest rates of the currencies are the ones that determine if the swap is to be credited or debited. In simple words, If you are paid swap, the money will be credited to your account balance. Conversely, if you are charged swap, the money will be debited from your account balance.

This concludes the lesson on balance in a margin account. In the upcoming lesson, we shall be discussing two more terminologies related to Margin Trading. Don’t forget to take up the below quiz!

[wp_quiz id=”49483″]
Categories
Crypto Guides

A Simple Guide To Cryptocurrency Wallet & Its Different Types

What is a crypto wallet?

Crypto wallets are software programs that store a user’s public and private keys. These wallets interact with different blockchain networks to send and receive cryptocurrencies. Many have a misconception that crypto wallets literally store digital currencies, but that is not the case. Cryptocurrencies always reside in the native blockchain network, and their ownership is just signed off to others based on their public keys to the address of the crypto wallet. If the owner of the crypto wants to spend the money, they spend the currency using their private key in the wallet. So when we say, the cryptos are stored in the crypto wallet, essentially, we are storing the corresponding public and private keys in them.

Types of crypto wallets

There are different types of crypto wallets, and they are differentiated based on how they can be accessed. The fundamental classification is online and offline wallets. Online wallets are those wallets that can be accessed by connecting them to the internet. Contrarily, offline wallets are those that can never be connected to the internet. Let’s understand each of the types below.

Online Wallets   

Desktop Wallets 

These wallets are installable software packs for operating systems like Windows, MAC, and Linux. Any crypto company which is serious about their outreach would start a desktop wallet on day one of their ICO. Since these are accessible only from the installed device, they are considered to be secure, but there is always a risk of virus attacks on a user’s device. Hence it is advisable to always keep up with the security patches of the device to safeguard cryptos. These wallets stand in third place in terms of security.

Exodus, Bitcoin Core, Electrum are few examples of desktop wallets.

Mobile Wallets

Mobile wallets for different cryptos are the most used digital wallets because of the ease and agility they provide. Most of the mobile wallets available in the market support both Android and IOS. The least famous ones at least support the Android version. One needs to seriously consider the security provided by the application while choosing a mobile wallet. These wallets occupy fourth place when it comes to safety.

Mycelium, Coinomi are examples of mobile wallets.

Web Wallets

These wallets run on the cloud and are accessible through any device which has browser access. These are very convenient but also prone to theft, thus needs multiple layers of security. There are hosted and non-hosted wallets when it comes to online wallets, and it is always recommended to use non-hosted wallets. These wallets occupy fifth, which is the last place in the wallet types available, thus making them the least secure.

MyEther Wallet and Coinbase are examples of online wallets.

Offline Wallets

Hardware Wallets

As the name suggests, these wallets are hardware devices that store public addresses and private keys. It is a USB kind of equipment that can be connected to any computing device, and they come with their native apps. These are the most secure as these are not connected to the internet all the time, making them resistant to hacking. Most hardware wallets allow us to store more than 22 cryptocurrencies.

Ledger Nano S, Ledger Nano X, and Trezor are some of the best examples of hardware wallets available in the market.

Paper Wallets

In paper wallets, one must print the public address and private keys of the user on a paper and store them securely. Not all the cryptos offer paper wallets, but most of the famous cryptos do. These are the second safest option after hardware wallets as these are offline as well.

Security is not the only thing one must consider while choosing a wallet. Because convenience also plays a critical role. It is often advisable to select hardware wallets if a crypto trader wants to store huge quantities of crypto for a long term use. Online or mobile wallets can be used to store smaller amounts of cryptos for short term usage.

Categories
Forex Course

24. Fundamentals Of Margin Trading

Introduction

Margin, which allows for Leverage trading, is one of the crucial reasons why most of the traders prefer trading Forex. It is an aggressive form of trading where traders take more risk while expecting an additional reward. Here, traders increase their bet by borrowing funds usually from their brokers. Thereby leverage trading allows a trader to trade with more funds than they actually have in their account. Leverage trading exists in the stock market, as well. The internal working of margin in both the markets is not quite the same, but the overall concept is the same.

Leverages is typically represented in ratios or with an ”X” next to it. For instance, the notation of two times leverage would be 2:1 or 2x. There are several other terminologies such as balance, realized and unrealized P/L, used margin, equity, etc. which are involved in margin trading. And to trade in a margin account, having knowledge about these terms is vital. So, in this lesson, some basic concepts and working of the margin trading shall be discussed.

Margin Account

A margin account, also referred to as a leverage account, is a trading account offered by a forex broker, which lets their clients trade large quantities without investing the total required amount. In a margin account, the forex broker acts like a loan lender who lends cash to its customers for taking positions in the market.

How does margin trading work?

Let us assume that a trader has deposited some amount into his account. The broker sets a margin percentage for the client. This margin percentage typically is between 1-2%. In forex, it is not the case that this account balance is used for taking a position. But, it is used up by the brokers as security deposits. Here, if the broker sets a margin percentage to 1%, then 1% of the trade value is utilized by the broker as a security deposit. So, a trader takes a position worth $100,000, then only $1,000 is used up, and the broker lends the rest 99% of the amount. This is the basic working of a margin account. There are many other terms involved in it, which shall be discussed in the subsequent lessons.

Benefits and Shortcomings of Leverage Trading

Initially, margin trading might seem very beneficial. To an extent, this is true, but there are disadvantages to it as well. Below are some of the advantages and disadvantages of margin trading.

Advantages

🟢 Ability to multiply a trader’s trade size

With margin trading, minimal capital is no more an issue because one can take larger positions even with a smaller investment.

🟢 Significant short-term gains

As margin accounts allow traders to take bigger positions, one can grow their account balance exponentially, even in the short-term.

Disadvantages

🔴 High risk

The market has two directions. So, though a trader trades on a margin, it does not mean that the trade will perform in their forecasted direction. A trader can make high profits and can even lose a significant amount of money. Hence, trading with margin involves high risk. And it is not recommended for novice traders.

🔴 The requirement of the minimum account balance

Trading in a margin account requires the user to maintain the minimum balance specified by the broker. If a user fails to maintain the minimum balance, then the trader is forced to close their positions.

This concludes the introduction of margin trading. In the next lesson, the terminologies involved in margin trading shall be discussed.

[wp_quiz id=”49218″]
Categories
Crypto Guides

Understanding Public Keys & Private Keys and Their Working

Introduction

Blockchains use public and private key cryptography to perform transactions in a cryptocurrency network. Public keys are generally widely known and used for identification of the person while private keys are secret keys, which is known only to the person who owns it. Private keys must be kept as secret as they are used for authentication of a transaction.

The Difference

Both public and private keys are a part of the asymmetric encryption of cryptography. The fundamental difference between these two is that the former is used for data encryption and the latter for decryption. Simply said, the Public key converts the message to an unreadable format whereas the Private key decrypts that message and converts it back to the original message. Hence, once the message is encrypted, it can never be decrypted without the help of the private key.

Both private and public keys are large integer numbers represented with a combination of numbers and alphabets. Since we understood the concept of public and private keys now, let us see how they are used in the crypto networks.

How does Public and Private key Cryptography work?

We know that digital wallets are used for sending and receiving cryptocurrencies. Digital wallets are not traditional wallets that store money in a digital format, but they store only public and private keys of the owner of the wallet. Private keys are used to sign the transaction through which the cryptos are transferred digitally. This digital signature is used to confirm the transaction was indeed send by the user who claims to have done the transaction, and no one can alter the same once the transaction is issued.

If someone were to have your private key, they could easily send the money from your wallet to their wallet by verifying the private key. Hence private keys are to be kept a secret from others. This is why it is said if the private key is lost, you lose all your money unless you have a technique to regenerate the private key and transfer it to a replica of your wallet or a new one.

The public key is generated using the private key and some additional information using cryptographic algorithms. This public key is widely known to all the people so that the transactions can be done. One may question if the public key is generated from a private key, can’t we reverse engineer and generate the private key from the public key? The answer is NO. The generation of keys is only one way, but the reverse is not possible since we are using asymmetric cryptographic encryption techniques designed by the National Security Agency of the USA.

Thus, using a combination of public and private keys, one can send and receive the money in digital wallets. Using a public key, one can easily decrypt the digital signature of the user signed using the private key.

Bottom Line

This is how transferring of digital currencies generally works. To end it with a simple example, if Nick wants to send some money say in Bitcoins/Ethereum/Litecoin etc. using his hardware wallet ‘Ledger Nano S’ or any online wallet like Coinbase, what should he actually do? He accesses his private key from the wallet and digitally sign the transaction, and this transaction is sent to the blockchain network. This transaction is verified using the public key to validate if the transaction is indeed being done by the wallet that it is being said, and thus the transaction is successful.

We hope you got a clear idea of what Public and Private keys are. In the upcoming articles, let’s discuss what crypto wallets are and their types. Cheers!

Categories
Forex Course

23. A Brief Comparison Between The Stock Market & The Forex Market

Introduction

The Stock market and the Forex market are the most widely traded markets in the world. Many traders who enter the universe of trading are often in a dilemma on which market to trade on. Though both markets involve trading instruments, there are many differences between these two. In this lesson, we shall get insights on the different features of both markets and then come to a conclusion on which is the market has got the upper hand.

Market timings

The forex market is open for 24/5. This proves to be a considerable advantage, as traders can trade anytime during the trading hours according to their schedule. While this is not the case with the stock market because they’re open only for 7-9 hours in a day. So, the stock market timings can be helpful only to full-time traders.

Facility to buy and sell short

As already discussed in the previous lesson, there is no directional bias in the forex market. The process and working for buying and selling is the same. Hence, a trader can participate during any condition of the market.  In the case of the stock market, there are few restrictions on short selling a stock. Though the facility for short selling is available, the procedure is not as simple as buying a stock.

Leverage/Margin

Leverage is the facility provided by the brokers to take larger positions with smaller capital. Leverage is one of the reasons why small retail traders take part in the market. Now, comparing the leverage in the stock market with the forex market, the difference is quite significant. In the stock market, maximum leverage for a day trader is up to 4:1 and for a positional trader, it is up to 2:1. Coming to the forex market, the leverage is commonly around 100:1. In fact, in some brokerages, it goes up to 500:1 as well. However, it cannot be concluded that it is better to choose the forex market over the stock market. This is because, as the leverage increases, the risk involved in the trade also increases.

Dividends

Dividends are basically perks given by companies if an investor invests in their company. Investing in a stock that provides dividends to their customers can be considered as a risk-free business. This is because, even if the stock underperforms in the market, you are usually assured of dividend income. But, in the forex market, there is no concept of dividends as such. Hence, this market is for the ones who are willing to take the risk.

Diversification

Many traders look for diversifying their portfolio. In the US stock market, there are around 2,800 stocks listed on the NYSE and 3,100 on the NASDAQ. And these stocks are put into different sectors. The sectors have their specific features and perform differently from other sectors. Hence, the stock market is an ideal market for the ones looking to diversify their investments.

Conclusion

In considerations of the above features of the stock market and the forex market, it is quite hard to stay biased. In the initial features, the forex market proves to be a better market, and when it comes to dividends and diversification, the stock market is the clear winner. Hence, from this, we can conclude, ‘the best market’ is a variable factor. It all depends on the type of trader a person is.

[wp_quiz id=”49036″]
Categories
Forex Basic Strategies

The Most Simple Scalping Strategy To Trade The Forex Market!

What is Scalping?

Scalping is one of the trading styles in the forex market, which is gaining popularity with the emergence of artificial intelligence and automated trading systems. Nowadays, there are a set of traders who enjoy scalping than day trading, swing trading, or position trading.

The main difference between scalping and other styles of trading is that in scalping, the trading time frame is very short and face-paced. The holding period does not last more than a few minutes, whereas ‘positional’ traders hold their trades from 1-Hour to few weeks. Scalpers find trading opportunities on very short timeframes such as the 1-Minute and 3-Minutes.

Impulsive traders are the ones who are most attracted to scalping, as they don’t want to wait for a trade to set up on the higher time frame. Sadly, new traders fall into this trap and start scalping the market, totally unaware of the risk it carries.

To scalp, a trader needs to be experienced. We recommend first being consistently profitable on the higher time frame or swing trading and then move on to scalping. Because this form of trading is extremely difficult as it requires a trader to make decisions in mere seconds or minutes.

5-Minute Scalping Strategy

In this section, we’ll cover a simple yet very effective scalping strategy on the 5-minute timeframe. The most suitable time to implement this strategy is during volatile market conditions. This means the best results are obtained during the New York-London session overlap (8:00 AM to 12:00 PM EST). During this time, trading costs are also relatively low, and liquidity is high, which is essential for the scalpers to take a trade.

We will be using two exponential moving averages in this strategy. Below are the indicators that one needs to apply to their charts.

  • 50-Period exponential moving average
  • 200-Period exponential moving average
  • Stochastic indicator

The Strategy

Let us look at the detailed steps involved in the 5-minute scalping strategy.

Step 1️⃣ – Identify the current trend

The two EMAs are used to indicate the trend in the 5-minute chart. To identify the larger trend, a trader will have to change the time frame to 15-minutes. Identifying the bigger trend is crucial to understand the overall direction of the market. The 50-period EMA is much faster than the 200-period EMA, which means it reacts to price changes more quickly.

If a faster (50-period) EMA crosses above the slower EMA (200-period), it means the prices are starting to rise, and the uptrend is more likely to be established. Similarly, a cross of faster EMA below the slower EMA indicates a drop in the price, and that also means a downtrend is about to form. Always make sure to take trades in the direction of the major trend.

Step 2️⃣ – Look for a pullback

Once we determine the current trend on the 5-minute chart based on EMA’s, it is time to wait for a pullback and stabilization of the price. This is one of the most important steps in this strategy as prices tend to make false moves after strong ups or downs. By waiting for the pullbacks, we can prevent ourselves from entering long or short positions too early.

Step 3️⃣ – Confirmation with the Stochastic Indicator

Finally, the Stochastic indicator gives the confirmation signal and helps us to take only highly-profitable trades. A reading above 80 indicates that the recent up move was strong, and a down move can be expected at any time. This is referred to as the overbought market condition. Whereas, a reading below 20 indicates that the recent down move was strong, and an up move is about to come. This market condition is referred to as the oversold market condition. After a pullback to the EMA’s, the Stochastic Indicator’s final confirmation gives us the perfect trade entry.

Let us understand this strategy better with the help of an example.

Chart-1

The above figure is a 5-minute chart of a currency pair, and the 200-period EMA is represented by the orange line while the 50-period EMA is represented by the pink line. The cross of the pink line above the orange line signals that the currency pair is entering into an uptrend on the 5-minute chart. As long as the faster EMA remains above the slower EMA, we’ll only look for buying opportunities. This step is to identify the direction and crossing of the two EMAs.

Chart-2

A trader shouldn’t be going ‘long’ as soon as they see the lines crossing. They should always wait for the pullback and only then take an entry. In ‘chart-2’, when we move further, we were getting the kind of pullback that we exactly need.

The next question is, at which point to buy?

Chart-3

The Stochastic plotted in the above chart helps in giving us the perfect entry points by getting into the oversold area. One can take a risk-free entry after all the indicators support the direction of the market.

Chart-4
Finally, the trade would look something like this (chart-4). The risk to reward ratio (RRR) of this trade is 2:5, which is very good. Also, make sure to place precise stop-loss and take profit orders, as shown above.

Final words

Scalping is a faced-paced way of trading that is preferred by a lot of traders these days. The main difference between scalping and other styles of trading is the timeframes involved in analyzing the market. This type of trading carries certain risks that are unavoidable, such as high trading costs and market noise, which can impact your profits. We hope you find this article informative. Let us know if you have any questions below. Cheers!

Categories
Crypto Guides

Consensus & Its Importance In Any Existing Cryptocurrency

Introduction

In most of our previous articles, we have discussed a lot of topics regarding cryptocurrencies. We now know the properties of cryptos, advantages, and their fundamental purpose. In this article, let’s discuss the concept of consensus and why it is essential for the existence of any cryptocurrency.

The consensus algorithm plays a vital role in validating the transactions of any crypto network. One of the crucial reasons for the success of cryptos is its ability to handle the problem of double-spending adequately. And this also an important reason for the failure of digital currencies before Bitcoin; they weren’t able to solve the problem of double-spending. So let’s see what this problem is about.

Double Spending

Double spending is a fraud where the same money is promised for two different transactions but is spent on making only one transaction in real. This is a significant problem for digital currencies because the entire system is decentralized, and there is no entity confirming the authenticity of the transactions. The cryptos after Bitcoin alleviate this problem by waiting for the confirmation of the payments. During this wait time (which is very minimal in general), the transactions are validated by the users present in the blockchain network using the ‘consensus’ algorithms.

The consensus here is nothing but a mutual agreement within all the partiers that are present in a cryptocurrency network. The majority of the validators must approve the transactions, and this is made possible by the consensus algorithm. Also, because of this protocol, a crypto network cannot be controlled by a single person or a group of people. Now, let’s look at two of the most important and equally reliable consensus mechanisms – Proof of Work & Proof of Stake.

Proof of Work (POW)

Proof of Work is used by Bitcoin blockchain. This consensus algorithm proposes a mathematical problem for the miners in the network. To solve this challenge, high power computing devices are used, and thereby a lot of electricity is consumed. The first one to solve the problem gets to validate the transactions and communicate the same to all the other miners in the network through gossip protocol. Then all the other miners verify the transactions and seal them in a block.

The crux here is this. To solve this challenge, the miner uses a considerable amount of power and hardware, which is a costly process. Hence, one would be honest enough to not validate faulty transactions as a lot of stake from the user side is already expended. This is how POW makes the miners be reliable and run the blockchain efficiently. They are rewarded with the in-house cryptos for doing this work. Though the POW consensus algorithm is the most efficient one out there, it is the costliest of all the consensus algorithms and not eco-friendly, which is the need of the hour.

Proof of Stake (POS)

In this consensus protocol, the participants who want to be the validators must stake some of the native cryptocurrency in a virtual safe for a specified period. The network randomly picks the validators based on certain methods. The two most used methods are ‘Randomized Block Selection’ and ‘Coin Age Selection.’ In Randomized block selection, the validator is chosen based on the highest stake and lowest hash value. While in the Coin Age Selection, the validators are picked based on the duration of the native currency staked in the virtual safe. Dash and Peer coin are examples of cryptos that use POS.

Why is POS more reliable than POW? 

POS algorithm uses considerably less energy compared to POW. Hence, the process is less expensive, and most importantly, it is eco-friendly. Also, the POS protocol fulfills the fundamental property of blockchain as it serves the purpose of complete decentralization. This is not the case in POW because currently, there are large mining pools who mine cryptos (Bitcoins, for example) and get the maximum reward. But that’s not possible in POS, making them truly decentralized.

Conclusion

Apart from these two, there are other major consensuses like Delegated Proof of Stake (DPOS), Proof of Burn (PoB), Proof of Elapsed Time (PoET), and Proof of Activity (PoA). These protocols are gaining momentum because of their efficiency and eco-friendly nature. However, a lot of research is still happening to develop more efficient and cost-effective consensuses. We hope you find this article worthful. Let us know if you have any questions in the comments below.

Categories
Forex Course

22. Perks Of Trading The Forex Market

Introduction

The foreign exchange market is, no doubt, the most popular market in the world. Though it is considered to be a very risky business, it can prove to be the best platform for trading and investing if things are done wisely. People often are in a dilemma to choose between the stock market, commodity market, and the forex market. Hence, it is important to know the benefits each market has to offer. So, in this lesson, we shall discuss some significant benefits the forex market has to offer.

Advantages of Trading Forex

Open 24/5

The forex market is traded throughout the day from Monday to Friday. And this got to be the biggest advantage for the part-time traders. Since there are quite a large number of people who are into 9-5 jobs, the forex market is an excellent option as one can trade anytime during the day. Hence, the forex market is the most flexible market when it comes to timings.

Great Liquidity

The forex market is the largest market in the world. It has a huge volume of orders coming in every single second. With high liquidity, trades are executed as soon as the order is placed. In fact, the forex market has the highest liquidity compared to any other market.

Margin Trading

In forex, the retail traders get the facility to trade with leverage. That is, with leverage trading, a trader can trade with quantities even if they do not possess the required amount. This is a great advantage as it paves the way for the small traders who are willing to participate in the market.

Nominal Commission and Transaction Costs

Another significant benefit to consider about the forex market is that the forex brokers don’t really charge any high fee, such as brokerage fees, exchange fees, or clearing fees. Having said that, they do charge commission, which is in the form of spreads. The bid/ask price, which is often referred to as the transaction cost, is typically around 1% when the market conditions are normal.

The Freedom on Lot Sizes

In forex, the brokers allow trading with as low as 0.001 lots. And traders can choose from 0.01 lots, 0.1 lots and 1 lot. Hence, there are variable lot sizes in this market. But, if you were to consider the futures market, the lot sizes are of one type and are determined by the exchanges.

Free Demo Trading

Demo trading is one of the best features the forex brokers have to offer. And the cherry to the cake is that demo trading accounts are free of cost. Demo trading can be very helpful to both novice and professional traders. Novice traders can use it to get the hang of placing orders and other features in the platform, while professional traders can use them to test the consistency of their strategies. Hence, we can consider demo trading to be a powerful risk-reducing tool.

Facility to Go long and Go Short

In the forex market, there is no directional bias. This is because currencies are traded in pairs. If a trader thinks the base currency would rise in value, they can go long, and if they think it will depreciate in value, they can go short. So, unlike the stock market, a trader need not borrow shares to sell short an instrument. Hence, traders can profit from both rising markets as well as falling markets without any complications.

Hence, these were some of the most significant features and advantages of the forex market. In the coming lesson, let us put up a comparison between different markets and see which market proves to be the best; for now, take the below quiz and see if you have understood this lesson correctly.

[wp_quiz id=”48839″]
Categories
Forex Basic Strategies

Learning The Art Of Fading In Trading

What is Fading?

Fading involves placing trades against the trend to profit from a reversal. Using the concept of fading, a trader will short sell, expecting the momentum to fade when the market is in an uptrend. Likewise, he/she will buy a currency pair with the expectation that the move will fade away and reverse when the market is in a downtrend.

The fading strategy involves three assumptions:

  • The price is either at the overbought or oversold condition.
  • Early buyers or sellers are getting ready to take profits.
  • Current position holders might be at risk.

Overbought and oversold conditions can be identified using technical indicators such as the Relative Strength Index (RSI). Momentum shows the signs of shifting of forces from bulls to bears or vice-versa. And as these signs develop, current holders of the asset start to rethink their positions.

These conditions get exaggerated after an earnings announcement or news release. This may lead to a knee-jerk reaction on the part of other traders to sell the currency pair. As a result, this reaction gets overextended, and a mean-reversion takes place.

Now let us see how does the strategy work and what are the necessary steps you need to take to profit from the strategy:

The Fading strategy

Step 1 – Identify market extremes from the daily time frame 

The first step is identifying overbought and oversold zones using technical indicators or chart patterns.

The popular indicators used for identifying the zones include:

The overbought and oversold conditions are indicated by reading above or below a certain level. For example, the market is said to be in an overbought condition if the RSI is above 70, and it is said to be in oversold condition if the RSI is below 30. This can help traders in identifying fading opportunities.

In the above chart, we can see how the RSI indicator was crossing the normal range when the market gets into the overbought zone. One can find trading opportunities just using the RSI indicator stand-alone. But to trade like how professionals trade, we need to use a lot more tools.

Traders may also use familiar chart patterns or analysis based on price action and watching the price continuously.

Step 2 – Look for signs of capitulation

The second step in the strategy is to look for early signs of capitulation or change in the short-term trend using momentum. This can be mostly done by using candlestick patterns or price action with a volume indicator. We suggest looking for price action signals.

Some other signs to watch for include:

  • When technical indicators start to fade or move away from their extreme overbought or oversold levels.
  • The volume of the significant trend starts decreasing, or the volume of the opposite trend starts increasing.
  • Bearish candlestick patterns appear (in case of an uptrend), or critical support and resistance are broken.

It’s essential to identify these signs early to maximize profit and avoid mistakes.

The signs mentioned above can be explained better with the help of some figures.

Image 1

In the above image, we clearly see that the market is in an uptrend and has been trending from a few days (as it is a daily chart). The volume of the significant trend is also high with the decreasing volume of the sellers, which is a good sign for bulls. But in the end, the volume starts to decrease. The RSI declines sharply after entering the overbought zone for a while.

Image 2

Immediately we see an increase in the volume of sellers with a drastic drop in the RSI indicator (Image 2). The signs are getting stronger for a reversal, and this trend can continue. All the traders who are holding the currency pair start exiting the market. This could be one of the most reliable signs for us to take appropriate action.

Image 3

Finally, we see a break in the ‘support’ by the bears with high volume. Now we have combined all the tools, and each of them is indicating a reversal. Hence, we should take a position in the opposite direction. This is precisely the kind of setup that you need to be looking for every time.

Image 4

In order to find the exact entry, we need to magnify the chart. For this, you need to go on a lower time frame to analyze and set your stop-loss or target based on that time frame. This is mandatory for getting precise entries. The above figure is the lower time frame chart of the explained example.

Note: Images 1, 2 & 3 belong to the daily timeframe, whereas Image 4 belongs to the 4H timeframe.

Step 3 – Enter the trade with a stop-loss and take-profit

The last step is to enter the market with a compulsory stop-loss and take profit to ensure risk management is in place. In this strategy, a stop-loss order can be placed above the price where the RSI enters the overbought/oversold zone. Avoid putting small stop-loss as you can prematurely get stopped out from the trade.

Profit can be booked when the volume of your trend starts to decrease. Now, the stop-loss and target would be placed, as shown in the above chart. This trade would result in a risk-to-reward ratio of a minimum of 1:5. Traders can also use a moving average or any other indicator to set a profit-taking price level. Limit orders are almost used by all traders to avoid any slippage or other issues, particularly in less liquid assets.

Bottom line

Fading strategies can be considered as risky as you are going against the trend. It is always a good idea to take a trade if the risk to reward ratio is favorable. These strategies are commonly used by short to medium term traders to capitalize on short term reversals. Even though it seems risky, it can be extremely profitable if appropriately used. This is because the market has reached a saturation state, and there has to be some balancing force. This is why fading strategies are also known as contrarian strategies. Because they work on the assumption that prices deviating far from the trend, tend to reverse and revert back. That’s about Art Of Fading. If you have any queries, let us know in the comments below. Cheers.

Categories
Forex Basic Strategies

Understanding The Volatility Breakout Strategy

Introduction

Breakout trading is one of the most common and popular strategies among traders across the world. In this article, we have added a powerful concept to this strategy, which is volatility. In a volatility breakout, we determine the movement of prices just before the breakout and also their reaction at important support and resistance levels. After analyzing the market, we will decide which breakout is safe to trade and which is not.

Volatility cycles

We have built the volatility breakout strategy in a very simple way. The principle of this strategy is that, when the market moves from one level to another (support to resistance or resistance to support) with strong momentum, the momentum is said to continue further. The other characteristic of the price is that it moves from periods of sideways movement (consolidation) and vertical movement (trend).

Price breaking out of a consolidation prompts us to believe that price will continue in that direction, which might last for one day, one week, or one month. The market after trending downwards gets choppy and reduces directional movement. Traders can use technical indicators like Bollinger Bands, which helps them to determine the strength of the breakout. Breakouts that happen with low volatility are ‘real’ breakouts; on the contrary, breakouts with high volatility can result in a false breakout. We shall look at each case in detail in the next sections of the article.


High volatility breakout

When we are talking about volatility, we mean the choppiness of the price, i.e., the back and forth movement of price. There are traders who like this kind of volatility, as they feel price moves very fast from one point to another. But this isn’t necessarily true in case of a breakout. If you don’t have the required strength in a breakout, you could be trouble.

In the above chart, we see that the price has been in a range for a long time. This means a breakout could happen anytime. Much later, the price tried to break above resistance and stayed there for quite a long time. The price is just chopping around without moving in any particular direction eminently. All these are indications that the breakout, if it happens, will not sustain. Hence, one needs to be extra cautious before going ‘long’ after the breakout.

There are many traders who are willing to take the risk and want to try their luck in such conditions. In that case, after you buy the forex pair, always keep a tight stop loss. The reason why we are suggesting a tight stop loss is that there are high chances for the trade will not work in your favor, and you should avoid making a big loss in that trade. The setup would look like something below.

If the trade works, it can give a decent profit with risk to reward of more than 1.5, which is really good. Again this strategy is only for aggressive traders.

Low volatility breakout    

When a breakout happens with a lot more strength, it is said to be a low volatility breakout. The price here does not face much of hurdle and crosses the barrier with ease.

As you can see in the above chart, the price does not halt at resistance, and the breaks out smoothly, which is exactly how a breakout should be. After that, you can see that the breakout happens successfully, and the price continues to move higher. When such type of volatility comes into notice, we will see a higher number of traders being a part of this rally because they are relatively risk-free trades. This strategy is recommended by us to all types of traders, irrespective of their risk appetite. The next question is where to take profit and put a protective stop.

Stop-loss can be placed below the higher low, which will be formed near the resistance, and profit should be booked at a price which will result in a risk to reward ratio of 1:2. Some money management rules should also be applied while booking profits. The setup would look something like this.

Measuring volatility

Since this strategy is mostly based on volatility, it is important to know how to measure volatility.

  • Bollinger bands are excellent volatility and trend indicators, but like all indicators, they are not perfect.
  • Average true range (ATR) measures the true range of the specified number of price bars, typically 14. ATR is a volatility measuring indicator and does not necessarily indicate a trend. We see a rise in ATR as the price moves from consolidation to a strong trend and a fall in ATR as market transitions from strong trend to choppiness.
  • ADX is also a prominent indicator that measures the strength of a trend based on highs and lows of the trend over a specified number of candles, again typically 14. When ADX rises, it indicates that the volatility has returned to the market, and you might want to use a strategy that fits that market condition.

Bottom line

The market does not always be in trending and consolidation phases, and we also have to learn to deal with different types of volatility. This is where most of the strategies can be used at their best, and using volatility indicators can help you trade more effectively. A breakout, when accompanied by the right amount of volatility, can be highly rewarding. Hence this is an important factor in any breakout trading system. Cheers!

Categories
Forex Course

21. Who Are The Forex Market Movers?

Introduction

In the previous lesson, we discussed how the forex market is structured. Now, it is time to take this topic a little deeper. In this article, let’s understand the Forex market movers. The participants of the market during the late 20th century were quite less. But, as time passed by, the number of participants grew exponentially. The big players got bigger, and the small retail traders found their way into the market. And at present, the forex market is no less than an ocean.

The participants of the Forex market

The Forex is approximately a $5 trillion market. This kind of liquidity comes from several types of traders. Some of them come with large pockets, some with medium-sized capital and the rest to make a quick buck. Now, let’s get an insight into all of these participants.

Central Banks

Central Banks play a crucial role in the Forex market. The interest rate policies of the Central Banks influence the exchange rates to a large extent. They are also responsible for Forex fixing. They take action in the Forex market to stabilize and pump in the competitiveness of that country’s economy. Moreover, they participate in the currency exchange to manage the country’s foreign exchange reserves.

Commercial Banks

Many assume that commercial banks come under the central banks’ category. However, this isn’t true. The commercial banks are the most active participants in the FX market. They’ve got the biggest pockets out there and trade with considerably large quantities of lots. Due to this, they partially determine the exchange rates of the currencies as well. About 100 to 200 banks around the world assumed to ‘make’ the market. The commercial banks facilitate the services to the retail clients for conducting foreign commerce and making an international investment. The commercial banks include large, medium, and small-sized banks, and as a whole, these banks are referred to as the interbank market.

Foreign Exchange Brokers

Forex brokers also have their significance in the market. They are agents who facilitate trading between two parties. Note that these brokers are just matchmakers and are not really involved in determining the exchange rates of currencies. Brokers constantly keep an eye on the exchange rates and try matching the price of buyers and sellers to execute a trade.

Multi-National Companies

The MNCs are major participants in the FX markets, who do not come from the banking side. These companies usually participate in the forward or the futures markets. Their participation comes from the cash flow between different countries. MNCs typically set up contracts to pay or receive a fixed amount of foreign currency in the future date.

Retailers

The exponentially growing market in the Forex is the retail market. The retailers include smaller speculators and investors. Speculators, unlike the participants mentioned above, are not in genuine need of foreign currencies. Their motive from the market is simple. They buy or sell with a hope that the price will move in their favor and can end up with a profit. They get their orders placed by brokers who act as an intermediary between buyers and sellers. The power of retailers to move the market is minimal because their contribution to the volume traded in Forex is less than 6% of the total Forex volume.

These are the different participants who make up the entire Forex market. In the upcoming lesson, we shall open up more about the Forex brokers. Don’t forget to take the below quiz to check your learnings.

[wp_quiz id=”48275″]
Categories
Forex Course

20. Brief History and Introduction to The Forex Brokers

Brief History

The economy of all the nations after the end of World War II was at stake. Not a single country saw a growth in its economy during this period. So, there had to be someone to fix this all up. Hence, the major Western banks stepped in to strengthen and stabilize the economy on a global scale. They established the well-known Bretton Woods System, which got Gold into focus, as it got paired with/against the US dollar and other currencies. This system did bring the economy to balance to some extent but slowly started becoming inefficient and outdated as the major countries began to expand at a good rate.

With this under consideration, the system was abolished and was replaced by a much efficient system for the valuation of currencies. Precisely, this system was called the free-floating type system, where currency exchange rates were determined by supply and demand factors. During the final decade of the 20th century, the internet came into existence. This brought drastic changes in the way how trading in the markets works. With the facility of internet, the banks came up with their own trading platforms, and these platforms enabled traders to keep a watch on the live quotes of the currencies and also provided smooth and swift execution of trades.

Taking this forward, as the market began to grow substantially, the so-called ‘retail brokers’ made their entry to the market. With these brokerages, traders with small capital could also participate in the market. Moreover, retail brokers even offered great leverage for trading, which attracted more traders to take part in the market.

Retail Forex Brokers

Retail forex brokers are intermediaries who facilitate transactions between buyers and sellers. Based on how clients’ are fulfilled, brokers are of two types, namely, Market Makers and Electronic Communication Networks.

Market Makers

As the name pretty much suggests, these brokers ‘make’ the market. A market maker acts as a bookie who takes the opposite side of its customers’ trades. So, basically, the trades here are between a retail trader and the broker. Since the broker takes the opposite position of his customers, he is actually trading against them. In layman terms, market makers need losers to profit from. Trading with this kind of brokers, customers don’t really reach the real market, as they’re placing bets on the quotes provided by the broker.

Electronic Communication Network

Trading with an ECN broker is different from that of market makers. Here, the interest of the customer is aligned with that of the broker. An ECN broker passes on its customers’ orders through to liquidity providers or the interbank market. So, unlike the case of market makers, their trades are actually matched with the real market. And as far as revenue of these brokers is concerned, they always make a profit from the spreads (bid/ask price) or trading fees. Since they connect the clients to deal with the interbank market, they form the network where communication takes place electronically.

That’s about the introduction to Forex brokers. Take the below quiz to know if you have understood the lesson correctly.

[wp_quiz id=”48281″]
Categories
Forex Course

19. Decentralized Forex market and its hierarchy

Introduction

It is a known fact that the forex market is the market for trading currencies, and the stock market is for trading shares of a company. This being the major difference between the two, there is another significant difference you must know. The stock market is fully centralized, while the forex market is decentralized. In this lesson, let us discuss how different a decentralized market is to a centralized one. Apart from that, let us also understand the structure of the forex market.

The Centralized Market

In a centralized market (stock market), there exists an intermediary between the buyer and seller to trade in the market. There is an entity called the central exchange, which facilitates the transactions between the two parties. In the present day, ECNs on stock markets have brought this to an end as they connect both the parties directly, which ensures the bid and ask prices are unified. Also, the competition between ECNs and direct traders tighten spreads and increments the available volume, making harder the manipulation of the prices.

The Decentralized Market

In a decentralized market, there is no concept of centralized exchanges. With the absence of a central intermediary, there is direct trading between buyers and sellers among top institutions. However, by default, retail traders will have to approach a broker to facilitate their transactions. Depending on the liquidity provider, the quotes of the currencies typically vary from broker to broker. That makes accounts open on non-ECN brokers suitable for price and spread manipulation. There is a possibility that a retail trader won’t be guaranteed the real bid and ask prices in the market. However, though there is manipulation, the volume of traders in the forex market is much higher when compared to the stock market. This could be due to the fact that the leverage in the forex market is considerably higher than the stock market.

Hierarchy of the forex market

Banks and retail traders are not the only ones who contribute to the Forex Market. In fact, there is a linear organization in the contributors to the forex. The hierarchy for the same is given below based on their significance in the market.

  • Major Banks ( Central banks + Top Commercial Banks)
  • Electronic broking services (EBS) | Reuters dealing
  • Medium-sized banks and small-sized banks
  • Hedge funds and commercial companies | retail ECNs
  • Retail traders

From the above hierarchy, it is clear that the major banks are the largest contributors in the market. Major Banks consist of the largest banks around the world. The uniqueness of the major banks is that they trade directly with each other or via the EBSs or the Reuters dealing. Hence, it is also referred to as the interbank market. And this interbank market includes the medium-sized banks as well as the small-sized banks.

Next up in the line come the hedge funds, commercial companies, and retail ECNs. These sets of traders don’t make the transactions with the interbank market, but, instead, they get it done via commercial banks. Typically, the quotes offered here are much higher than that of the interbank market.

Finally, last up in the line stand the retail traders. Retail traders are the ones who place their trades via forex brokers. The number of traders in this hierarchy is extremely high. However, when it comes to the volume they trade, it is significantly lesser when compared to banks and hedge funds. Back in the day, it was not possible for small retail traders to enter the market. But, nowadays, anyone can trade the Forex market by depositing as low as $100 into their account.

Hence, this completes the lesson on the forex market hierarchy. In the following lesson, we shall take this topic forward by as we’ll be covering the different types of players in the forex market in detail.

[wp_quiz id=”47497″]
Categories
Forex Market

Leverage Trading & Important Money Management Rules To Follow

What is Leverage?

Leverage trading, AKA Margin trading involves borrowing extra funds to increase a trader’s bet while they trade. In this aggressive mode of trading, traders take more risk while expecting for additional rewards. This is done by the traders only when they think the odds are in their favor. Leverages is basically represented as a ratio or with an ‘X’ next to the times of leverage. For instance, to take a trade what is double the size of the amount you want to risk, you are essentially taking leverage of 2:1 or 2x.

The main leveraged products available today for Forex traders are spread betting and contract for difference (CFDs). Other products include options, futures, and some exchange-traded funds (ETFs). Before using leverage, a trader needs to understand the risk associated with it. Controlling risk means having money management principles that can be used on a daily basis. Since leverage trading can be risky, as losses can exceed your initial investment, there are appropriate money management tools that can be used to reduce your potential losses. Now let’s look at a few of these tools.

Money management rules

Using stops

Putting a stop-loss to your position can restrict your losses if the price moves against you. As mentioned in previous articles, markets move quickly, and certain conditions may result in your stop-loss not being triggered at the price you’ve set. Do not forget to trail your stop-loss after you get in a profitable position. By trailing your stop-loss, you will be able to lock in the profits you have made on your trade. There is no need to monitor your position nor the need to adjust your stop-loss manually.

The right risk to reward ratio

The risk to reward ratio can be calculated by taking the total potential profit and then dividing it by the potential loss. You need to calculate risk based on your trading capital (risking not more than 2% of trading capital) and the leverage that you use to trade, as the leverage can alter your stop-loss.

Choosing the right leverage level

It is hard to determine the right margin level for a trader as it depends on trading strategy and the overall market volatility. But from a risk perspective, there is a maximum level of margin that one should use in order not to overexpose themselves to the market. It is seen that scalpers and breakout traders use high leverage when compared to positional traders, who often trade with low leverage. Irrespective of the type of trader you are, you should choose the level of leverage that makes you most comfortable. Since forex brokers provide a maximum leverage of 1:500, newcomers find it attractive and start trading with that amount of leverage, which is very dangerous.

If you are a novice trader, the optimal leverage to use in Forex should be below 10X. But if you are an experienced trader and are extremely sure about the trade you are about to take, the maximum you can go up to is 50X. But as discussed, Forex brokers offer a maximum leverage of 500X and some time more too. But it is advisable not to go that far until and unless you have the appetite to take that risk. By using less leverage, you can still trade even after having a series of losses in the market as you are taking a calculated risk.

Bottom line

A simple rule to keep in mind is that you shouldn’t be risking more than you can afford in the market. You can open a special type of account with a forex broker known as limited-risk accounts, which ensures that all your positions have a guaranteed stop. They decide your account type and leverage based on the information you give them while opening an account. Hence, leverage can be used successfully and profitably with proper money management techniques.

Categories
Forex Basic Strategies

You Must Definitely Try These Most Promising Bollinger Bands Strategies

Understanding Bollinger Bands

Bollinger Bands is one of the most famous indicators out there, developed by a technical analyst named John Bollinger in the 1980s. This indicator primarily identifies the volatility level of a currency pair. Bollinger bands are volatility bands placed below and above a moving average. These bands are designed such that they automatically widen when the market volatility increases and narrow or contract when volatility drops.

One of the important purposes of the Bollinger bands is to determine the relative high and low prices of the market. As simple as it gets, the prices are comprehended to be low at the lower band and high at the higher band. With this definition, we can come up with trading patterns that can help predict the upcoming market trend.

Calculation

Bollinger bands have three bands, namely, the upper band, the middle(mean) band, the lower band. And they are calculated as follows:

Upper Band = Middle band + 20-day Standard deviation x 2

Middle Band = 20-period the moving average (20 SMA)

Lower Band = Middle band – 20-day Standard deviation x 2

Below is a chart that has the Bollinger Bands embedded in it.

Setting up the Bollinger band

Every trading platform will ask you for the length of the Bollinger band. By default, the value is set to 20. And it is highly recommended to keep the default configurations to obtain optimal results from the indicator.

Now, let’s put all of the above information into action by analyzing some great strategies.

Strategy 1: Double Bottom Setup

One of the most popular trading strategies using the Bollinger bands is the double bottom setup. This is because John Bollinger himself said that, “Bollinger bands can be used in pattern recognition to define pure price patterns such as “W” bottoms, “M” tops, momentum, shifts, etc.”.

In this strategy, we will be discussing the “W” bottoms, and “M” tops.

W-Bottoms

This strategy can be applied when the market is coming from a predominant downtrend. There are four stages to consider to trade the W-bottom (double bottom) Bollinger band strategy.

  1. The reaction low must form around the lower band.
  2. From the lower band, there must be a bounce up to the middle band.
  3. Thirdly, there should be a new low, which must hold above the lower band. The hold above the previous low confirms the inability of the sellers to push the prices lower.
  4. Lastly, the price must move off the low and break the previous resistance. This confirms the start of bullishness in the market.

Example

In the below chart, the market was in a downtrend. It made a low at the lower band and went up until the middle band and held. This satisfies the first two considerations in the W-bottom strategy. Moving forward, the price comes down again, but this time, it holds above the lower band. This confirms the third consideration, as well. Finally, the market shoots up and breaks the resistance (black line), indicating a buy signal.

M-top

M-top is the opposite of the W-bottom strategy. But, the working of this strategy remains the same. That is, firstly, the price must try to go above the upper band. Secondly, the price should drop down to the middle band. Thirdly, it must go up again but not higher than the previous high. And finally, the market must drop below the support line. And once all these scenarios take place, we can prepare to go short.

Example

In the below chart, the market went above the upper band, pulled back to the middle band, shot up again, but could not go higher than the upper band, and finally, the price dropped below the support (black line). So, this is when we can confidently hit the sell.

Strategy 2: Return to the Mean or Middle of the band

If you wish to extract only small profits from the market, then this strategy will be apt for you. This strategy mainly focusses only on small movements rather than big swings. An advantage of this strategy is that you will be able to pull off consistent profits and reduce risks significantly.

The principle of this strategy is to go long when the price comes down to the middle line. However, to reduce the risk, there are some factors which are implemented when trading this strategy. Below, we have mentioned some of the techniques to trade this strategy.

In the below chart, we can see that the market shot to the upside, pulled back to the middle line, and again shot up north. Here, if we were buying at the middle line, we would have made a profit out of it. But, not always will this work in your favor.

There are some points you must consider before trading this strategy. Firstly, the initial buyers must be very strong. Secondly, the sellers (pullback) must be weaker than the preceding buyers. Thirdly, the price must hold around the mean line. The occurrence of patterns like doji, hammer, spinning top, etc. around the mean line can give additional confirmation on the trade. Therefore, once all the criteria are satisfied, you can go for the buy.

Bottom line

Bollinger band is an excellent indicator to determine the direction of the market. The bands indicate if the market is at a relatively high or low. And these highs and lows help in predicting if the market is continuing its trend or preparing to reverse. Also, chartists combine this indicator with other indicators to have an extra edge over their trade.

We hope you understood these strategies. It is highly recommended to try these in your daily trading activities. With practice, you can master this indicator and can make consistent profits if used correctly. Let u know if you have any questions in the comments below. Happy Trading!
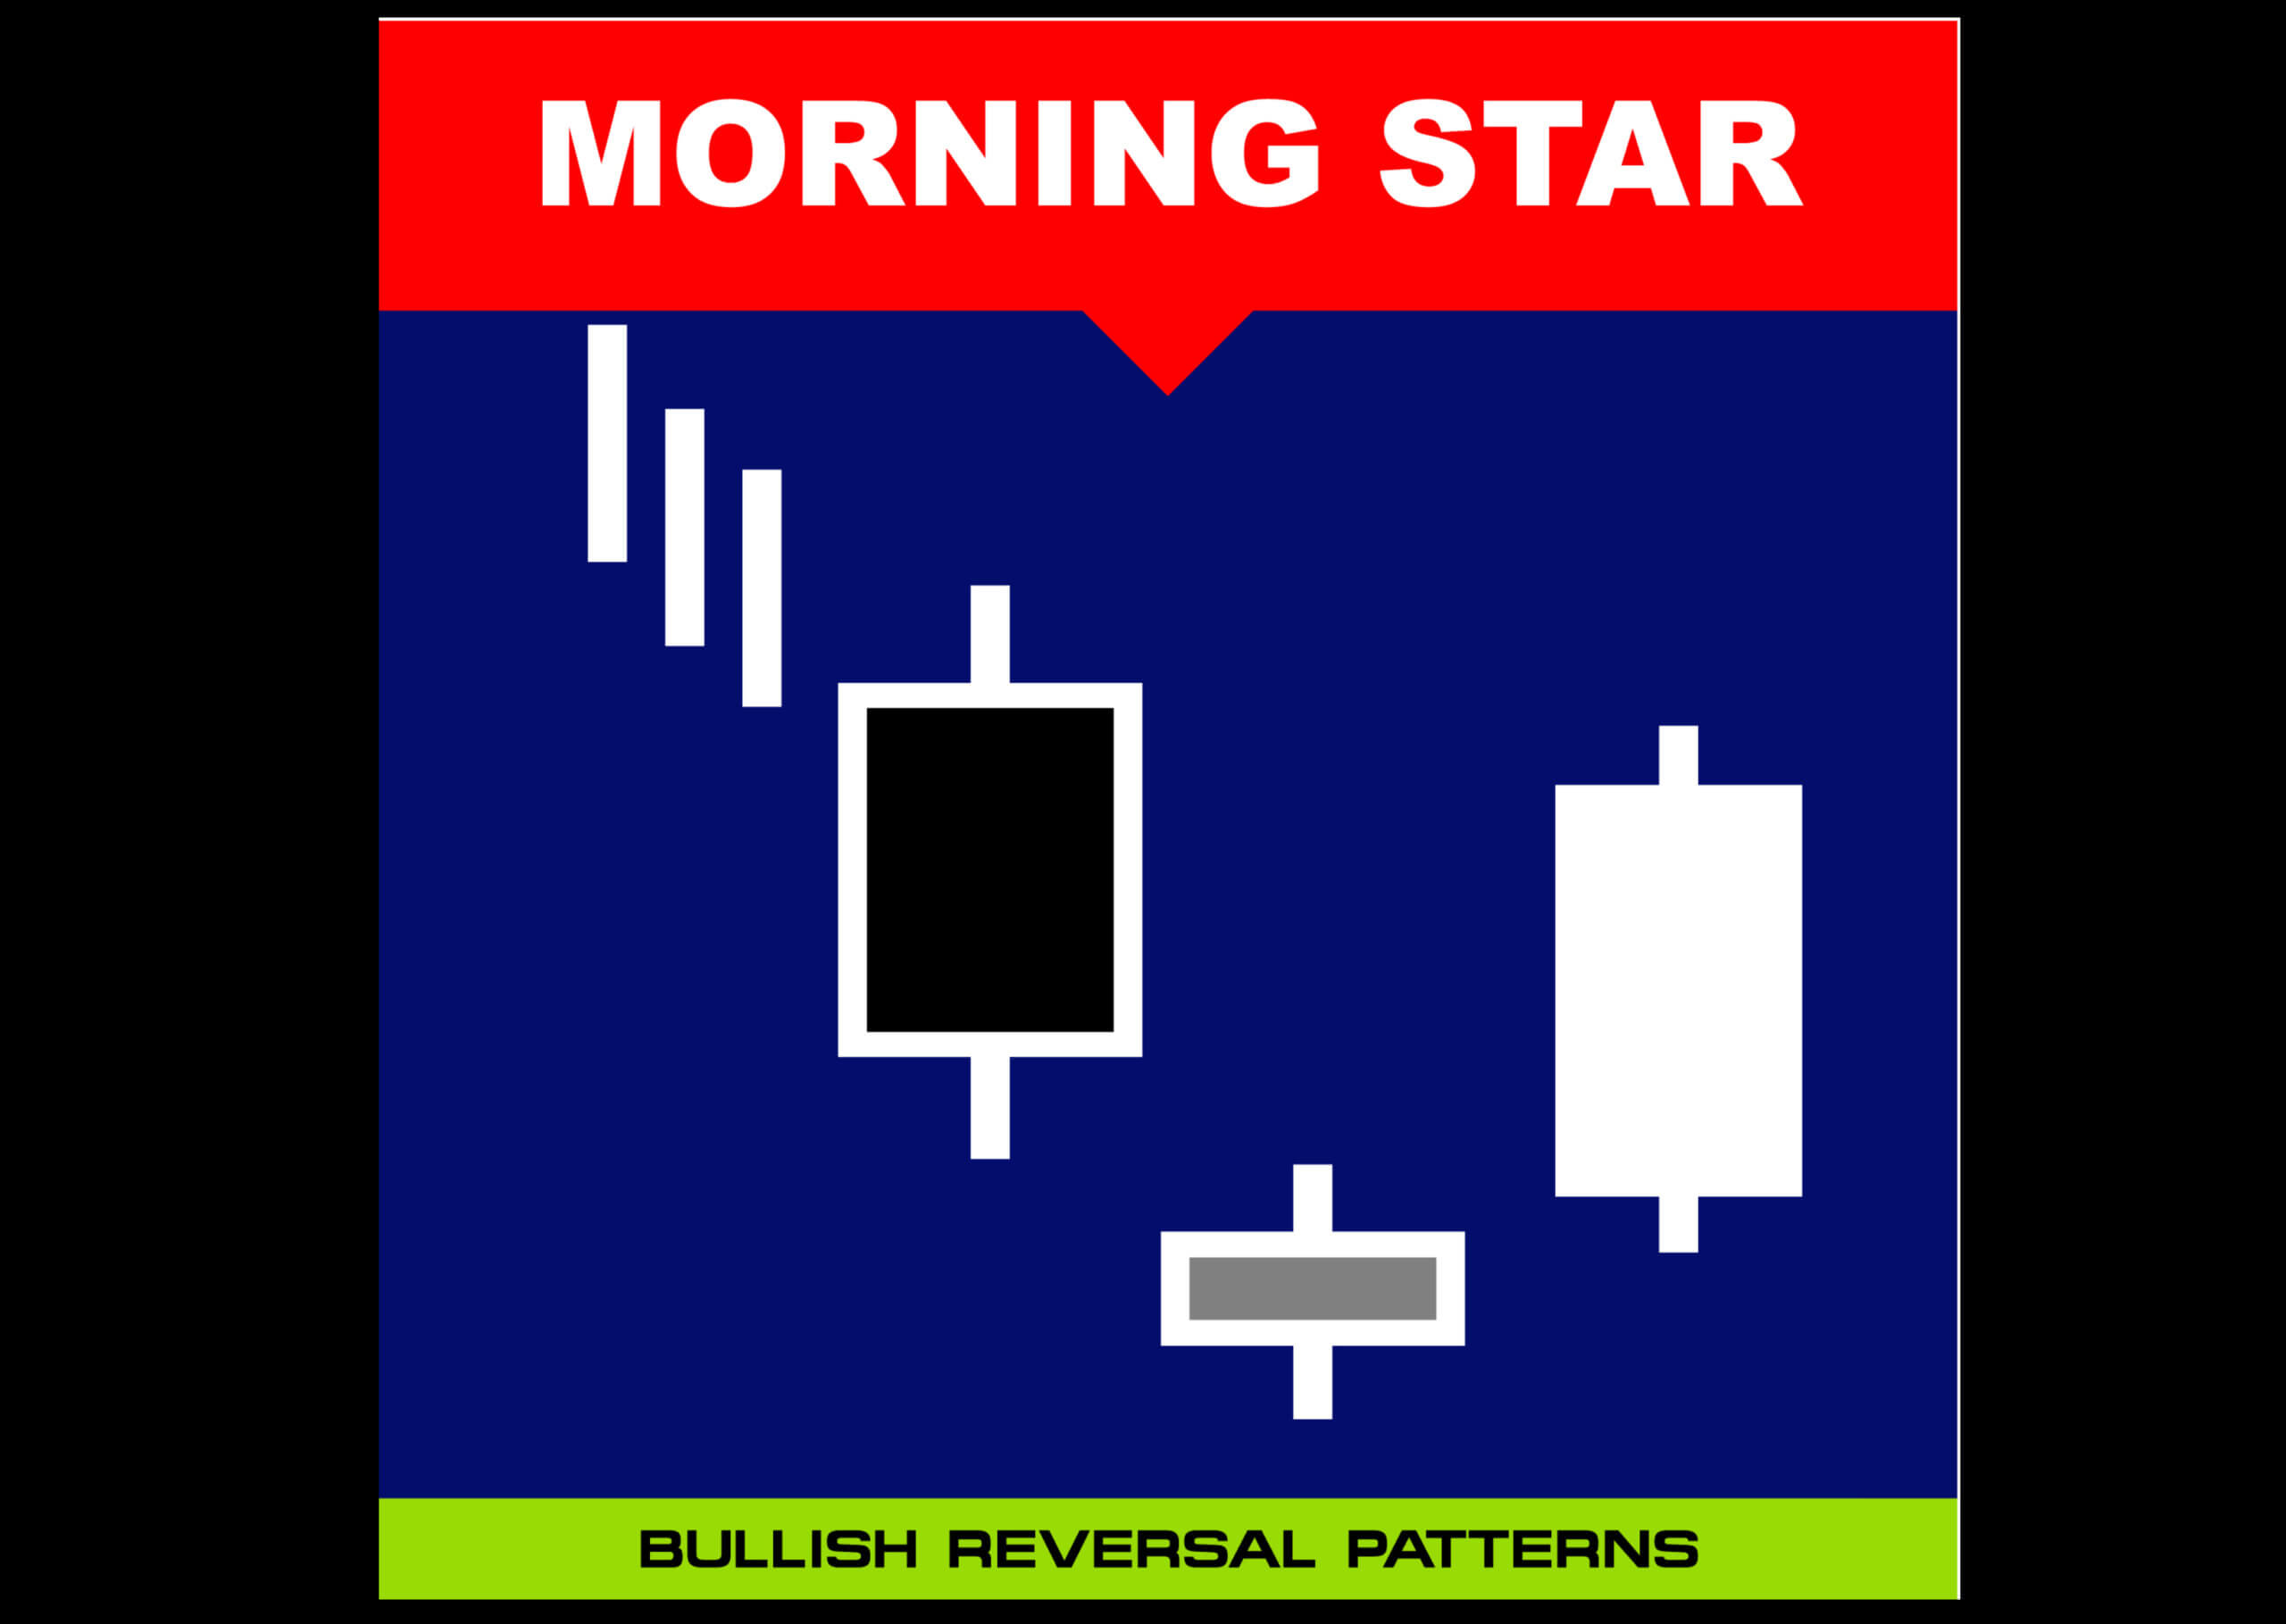
Categories
Crypto Guides

Blockchain Technology – The Fundamental Aspect Of Most Of The Cryptocurrencies

Introduction

In this crypto guide, we have seen various articles about cryptocurrencies so far. In this article, let us examine the underlying technology, which essentially enables the working of these cryptocurrencies. It is none other than the revolutionary blockchain technology. Bitcoin and blockchain terminologies have been synonymous for a long time, but not anymore. The true potential of blockchain is realized in the past decade, and its applications are being widespread in many industries currently. The adoption is still in its nascent stage, like any other new technology in its initial days. The industries which have adopted the technology are reaping benefits in millions if not in billions already. So, it is important for us to understand what this technology is all about.

What is blockchain?

Blockchains are open global distributed ledgers, which are necessarily a chain of blocks. These blocks contain transactions or records bundled together with encryption techniques called cryptographic hash functions to form a blockchain. This is the simple definition of blockchain. The concept is as simple as it sounds, but it revolutionized the way the records are maintained in any industry.

Blockchain platforms are peer-to-peer networks. Making the ledger open and distributed; this means everyone involved in the system will have a copy of the ledger. The transactions being committed in the network are validated using a consensus algorithm. Say a block has a capacity of 1 MB of transactions, these transactions are verified and sealed in a block. This new block is linked to its previous block using cryptographic techniques. Once the block is linked in the blockchain to the last block, the contents of this block can never be changed. This property is called ‘immutability,’ a significant feature of blockchain.

What are these cryptographic hash functions?

Cryptographic hash functions are standard algorithms designed by the National Security Agency (NSA) of the USA. Any information can be sent through this algorithm, and the output we get is the hash of the input, and it is a unique value. Every block in the blockchain is linked to its previous block using the hash value of the last block. This hash value of a block is generated by all the transactions of a block plus the hash of the previous block. Thus, if we make any change in a block that is mined already, the hash value of that block is changed. All the blocks before that block would be disturbed. Thus, the property of immutability comes into the picture. This is the basics of how blockchain technology works in general.

Different blockchain platforms:

Since realizing the true potential of blockchain, different blockchain platforms are developed for various industrial use cases.

Hyperledger platforms: These platforms are developed for cross-industry applications. It is an umbrella of open source platforms like Hyperledger Fabric, Hyperledger Sawtooth, Hyperledger Iroha, and so on, designed for each industrial use.

Ethereum: Ethereum is, again, a platform developed to deploy self-executed contracts known as smart contracts. Also, a platform to create decentralized apps (Dapps) to use the blockchain functionalities in everyday apps we use.

R3 Corda: This is a consortium of around 300 different firms working together in the financial background to nurture and develop the technology to revolutionize the financial sector.

These are only some of the various platforms in use today.

Bottom line

Blockchain, as a technology, has a vast potential to revolutionize many industries. Blockchain developers will be required on a massive scale in the coming future to bridge the gap and to fulfill the requirements. The world where privacy is at stake at the moment, blockchain is a savior to ensure our privacy and security of digital information.

Categories
Crypto Guides

Which kind of Problems can be Solved by Cryptocurrencies?

Introduction

Cryptocurrencies have made an impact on the world’s financial system in an unprecedented way. The speed and agility of global transactions have changed with the advent of cryptos. At present, there are around 3053 cryptocurrencies trading across the world, with a market cap of more than $246 billion. Many global companies around the globe have started to accept cryptos as a mode of payment for the products and services they provide. Bitcoin atm’s and debit cards are making the widespread adoption of cryptocurrencies easy and worthwhile. In this article, let us understand the reason for this wide adoption of these cryptos by looking at some of the problems they solve.

🏳️ Centralization: Cryptocurrencies are built on blockchain platforms enabling them to adopt all the features of the blockchain technology. The fiat currency we use today is minted by the central banks of the respective countries. The presence of a central entity to control something is called centralization. Banks play a significant role in the financial status of any country. It is well known that the financial crisis of 2008 is due to the banking crisis. That was the time when Bitcoin came into the picture, paving the way for the decentralized currency. Cryptocurrencies are decentralized with no third-party control. They run on blockchain technology as per the network setup initially. The network is maintained and run by different entities mining the native currency. Thus by no one controlling the money, they remain unique and stable. This is the prominent problem that cryptocurrencies solve over fiat currency.

🏳️ Intermediary costs: The transaction costs to send money between different countries is too high. The respective entities charge a certain percentage of the transaction amount, and it depends on the amount we send and the service we utilize. Also, it takes more time to settle transactions across different countries. There is no limit for cryptocurrency transfer across the world. It is instantaneous with a minimal amount as a transaction fee when compared with the standard bank wire transfers.

🏳️ Privacy: The transactions you make in cryptos are semi-anonymous; some cryptos even ensure complete anonymity. Each of the users will have their crypto addresses, which are used to make transactions. These addresses ensure privacy while transacting cryptos. Having said that, the level of privacy varies from one crypto to others.

🏳️ Security: Blockchain assures the utmost protection when it comes to cryptocurrency transactions. The transactions in the blockchain cannot be reversed; once committed, they are committed for a lifetime. The cryptographic techniques used to secure the transactions are almost impossible to hack.

🏳️ Inflation: Any cryptocurrency has a limit of coins that it can ever have or in some coins, the number of coins that can be mined per year will be capped. In the case of fiat currency, the government can issue bonds and manipulate interest rates to increase the circulating money, thus decreasing its value leading to inflation. Since the number of coins that ever will be available is capped in the case of crypto, inflation can be effectively handled.

These are only a few problems that cryptocurrencies can solve, but with the widespread usage, there would be solutions for problems that we don’t even see now. We hope you find this article informative. Cheers!

Categories
Forex Course

18. What Should You Know About Trading The New York Session

Introduction

After the Asian and the London session, the big fishes enter into the market, i.e., the New York market. When London’s session is halfway through its trading, the New York markets make an entry into the market. Precisely, the New York session begins at 8:00 AM EST. This session is also referred to as the North American session. The liquidity during this session is pretty high.

As we have discussed the average pip movement in the Tokyo session and the London session, let us compare the pip movement by considering all the three sessions. The London session tops the table, which is then followed by the New York session and, finally, the Tokyo session.

Average Pip Movement

London session > New York session > Tokyo session

Now, let us see the average pip movement for some of the extensively traded currencies in the market.

How to trade the New York session

The New York session opens at 8:00 AM EST, which is during the London session. That is, there is an overlap between the two sessions. Since the world’s two largest markets are trading in the forex market, one can expect a high volume of orders flowing into the markets. Hence, this is an ideal time to enter the market as the spreads are quite low during this phase of time.

During the New York session, the economic news begins to drop. And as a matter of fact, 85% of the news is related to the US Dollar. So, news traders can keep a close watch on all the US Dollar pairs as the news typically moves the market drastically.

During the market open, the liquidity of the market is excellent, but as the noon approaches, it begins to drop. That is, during lunch hours, the market goes into a consolidation phase.

Another interesting fact to consider is, the market loses its momentum on Friday afternoon as the weekend begins for the Asian and the European markets. Hence, it is not a good idea to trade on Friday afternoons. Apart from momentum, it is possible for the markets to reverse its direction as the traders might look to square their positions off.

Which pairs should you have on your watchlist

The liquidity during the start of the session is excellent, as the London markets are open as well. So, during this time, you can choose to trade any pair. However, it is recommended to concentrate more on the major and minor currency pairs.
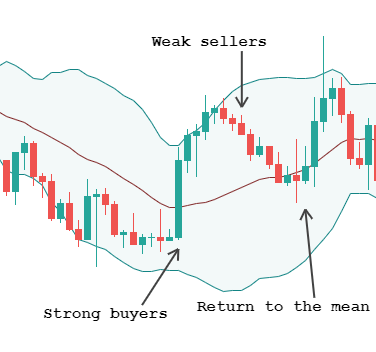
Several news events come in during this session. So, a news trader can take advantage of them, although a novice trader should stay away from pairs affected by such events, as it requires abilities unrelated to technical analysis.

Therefore, all in all, the New York session is a session that can be profitable for all types of traders. The volatility of the market during this session stands in between the London session and the Asian session. Hence, if you’re a novice trader, it is a good idea to start off with the New York session.

We have completed this short tutorial in the New York session. And in the next lesson, we shall go more precisely into when exactly to trade the Forex market. Let’s see if you have understood this lesson correctly by answering the questions below.

[wp_quiz id=”47122″]
Categories
Forex Course

17. What Is The Best Time To Trade The Forex Market?

Introduction

The Forex market is open 24 hours daily and is traded from Monday to Friday. This feature makes it feasible for traders all around the world to trade it. However, it is not quite ideal to trade anytime in Forex. There are specific times of the day and week that offer greater liquidity. These are the times when the professional traders step into the market as well. So, let’s dive right into the topic.

The preferable time to enter the forex market

Liquidity and volatility are the two vital factors a trader must consider before choosing the best time to trade. Because, with the absence of liquidity and volatility, it is not possible to grab big moves in the market. Hence, one must look out for the times when there is a high volume of trading happening in Forex.

As far as liquidity is concerned, liquidity is excellent (as well as volatility) when two sessions overlap. During these times, the volume of orders double, making significant movements on major pairs. Hence, getting in-depth knowledge about how pairs behave during session overlaps is very important.

The overlapping sessions

The Tokyo-London Overlap

During the Asian session, there is not much movement in the market. But, when the London market opens, the Tokyo markets are still running. Hence the volume during the overlap time segment increases as both the markets are actively traded. Having said that, most of the volume comes from London, which ends up suppressing the Tokyo market. Hence, trading this overlap session is highly recommended.

The London-New York session

The London market and the New York market alone bring in considerable volatility. And when both these markets combine, the liquidity rises significantly. Hence, this becomes the ideal time to trade the forex market. Moreover, due to the high liquidity, the spreads during this time are incredibly tight.

Now that we’re clear with the preferable time to trade the markets let us discuss the preferred weekdays to engage in trading.

What are the days of the week best to trade?

Let us answer this question by considering the average pip movement of currencies pairs on all trading days of the week.

From the above table, we can ascertain that the pip movement on Monday is lesser when compared from Tuesday – Friday. Also, on Friday, once the afternoon sets off, the liquidity reduces considerably. Hence, to get the best from the Forex pairs, it is best to work during the middle of the week and near the time of the market openings.

This brings us to the end of this lesson. To get a recap of the above lesson, you can take up the quiz given below.

[wp_quiz id=”47251″]