Introduction
NZDJPY, or the NZD/JPY or the New Zealand dollar against the Japanese yen, is a cross-currency pair in the Forex market. The left currency (NZD) represents the base currency, and the one the right (JPY) represents the quote currency.
Understanding NZD/JPY
The market value of NZDJPY is a value of JPY that is required to buy one NZD. It is quoted as 1 NZD per X JPY. For example, if the CMP (current market price) of NZDJPY is 72.657, then it takes 72.657 yen to buy one New Zealand dollar.
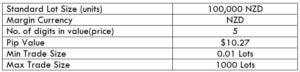
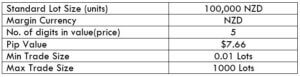
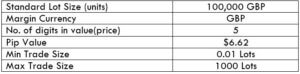
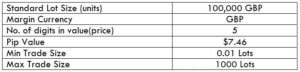
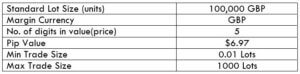
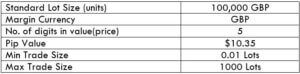
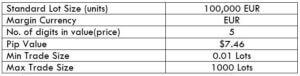
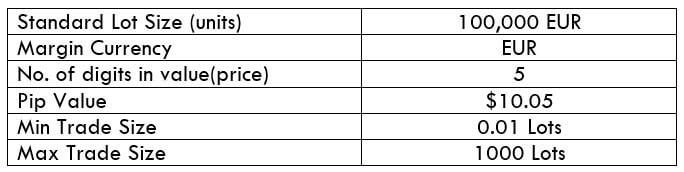
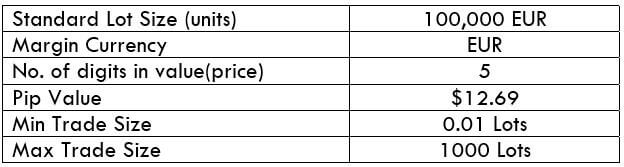
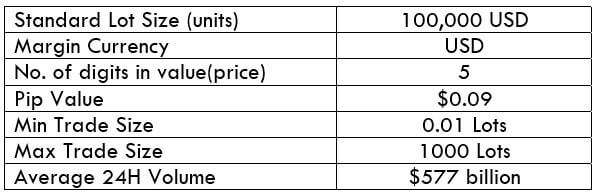
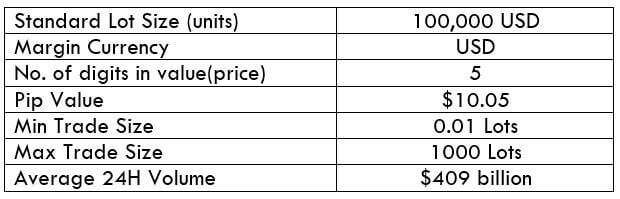
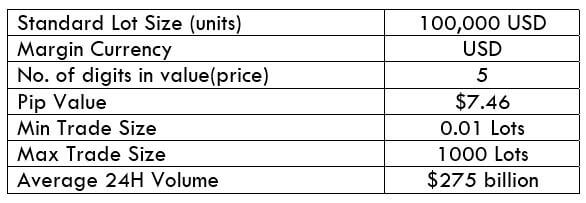
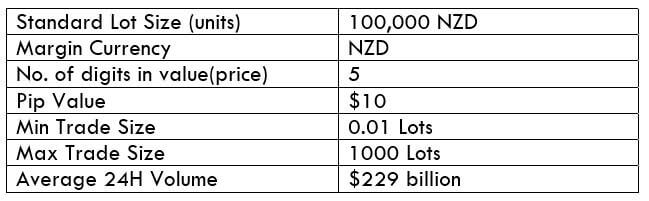
NZD/JPY Specification
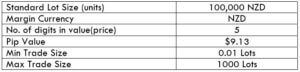
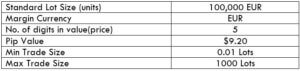
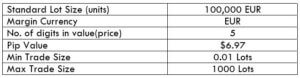
Spread
Spread is the difference between the bid price and the ask price controlled by the broker. It varies across brokers and their type of execution.
ECN: 0.8 | STP: 1.7
Fees
On every trade a trader takes, there are few pips of fee on it. And this is only on ECN accounts because the fee on STP accounts is nil.
Slippage
Slippage, which happens on market orders, is the difference between the price asked by the client and the price he actually received. There are two primary reasons for it, namely, the broker’s execution speed and the change in volatility of the market.
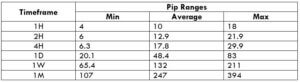
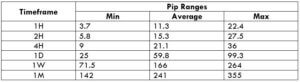
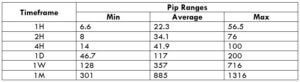
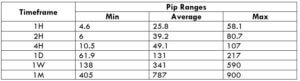
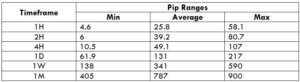
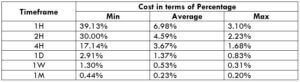
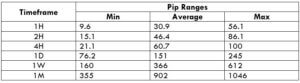
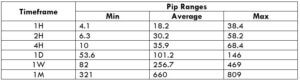
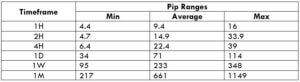
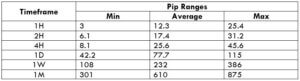
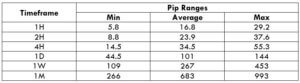
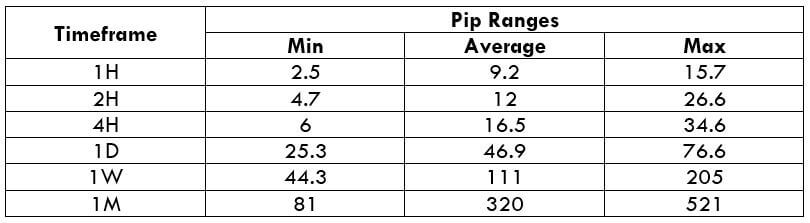
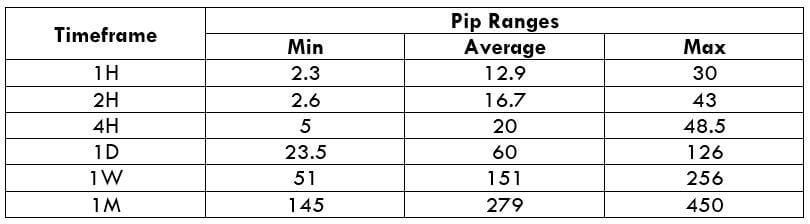
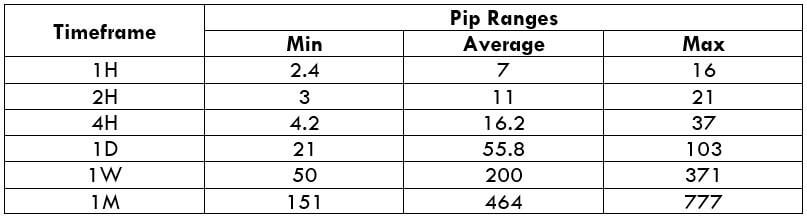
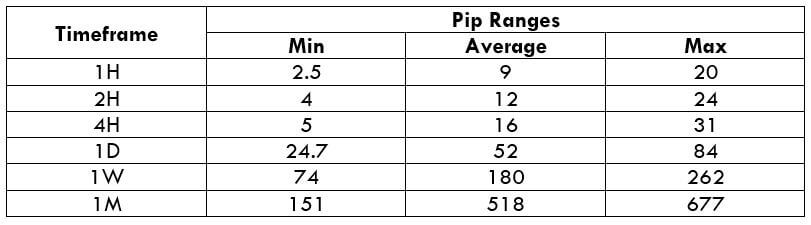
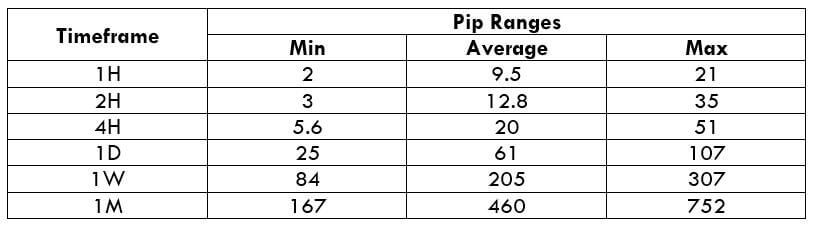
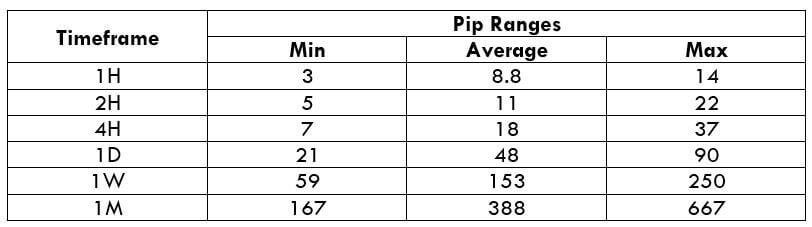
Trading Range in NZD/JPY
The average, minimum, and maximum pip movement is determined in the trading range table. This comprehensive table helps traders assess the profit they can generate and loss they can incur in a given timeframe. Moreover, this table is helpful in analyzing the cost variation in a trade, which shall be discussed in the next section.

Procedure to assess Pip Ranges
- Add the ATR indicator to your chart
- Set the period to 1
- Add a 200-period SMA to this indicator
- Shrink the chart so you can assess a large time period
- Select your desired timeframe
- Measure the floor level and set this value as the min
- Measure the level of the 200-period SMA and set this as the average
- Measure the peak levels and set this as Max.
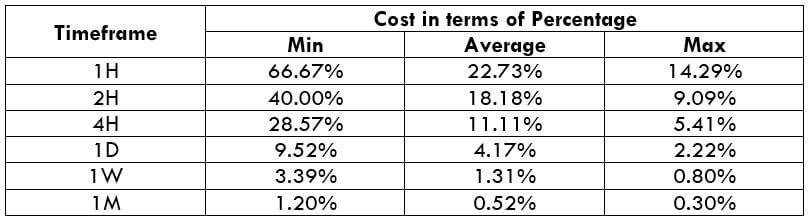
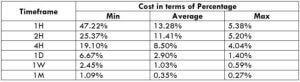
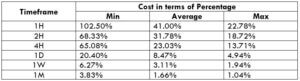
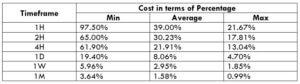
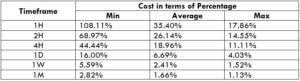
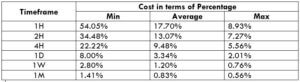
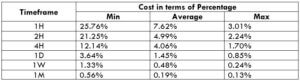
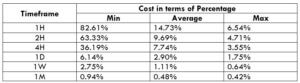
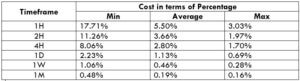
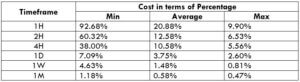
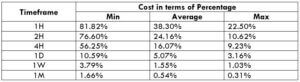
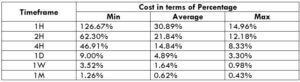
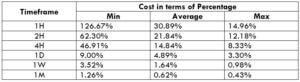
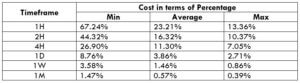
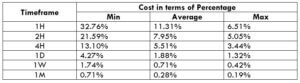
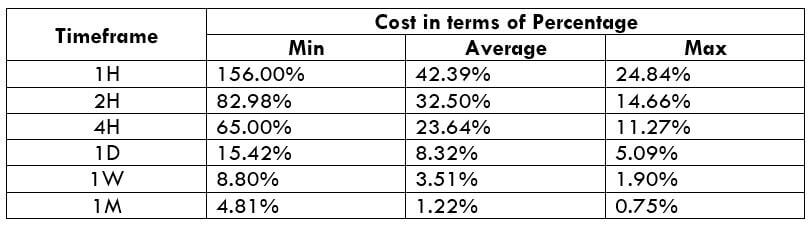
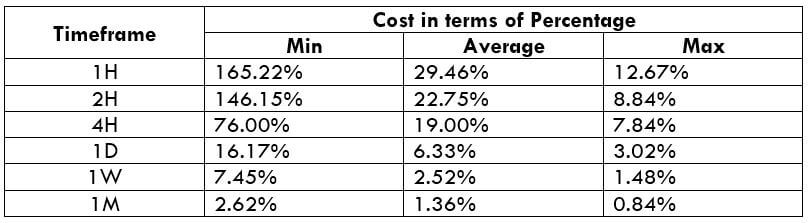
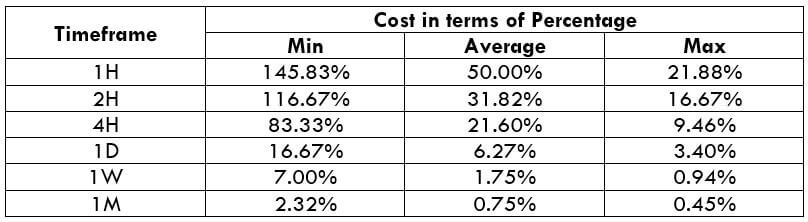
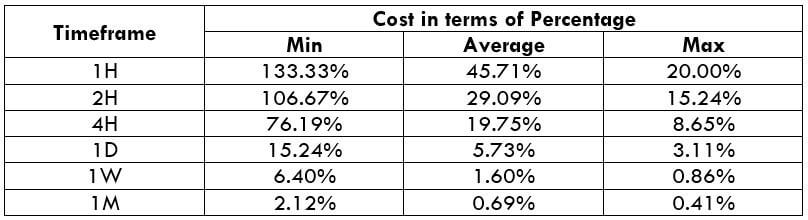
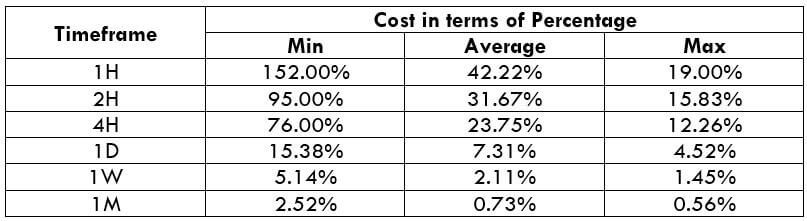
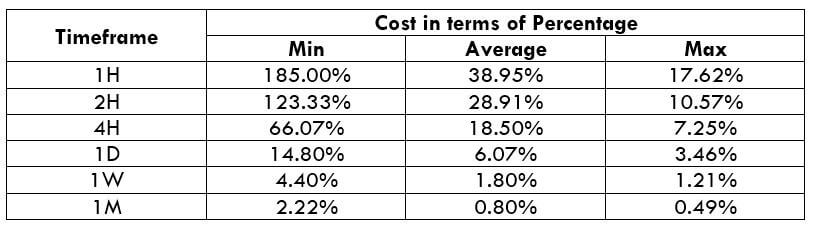
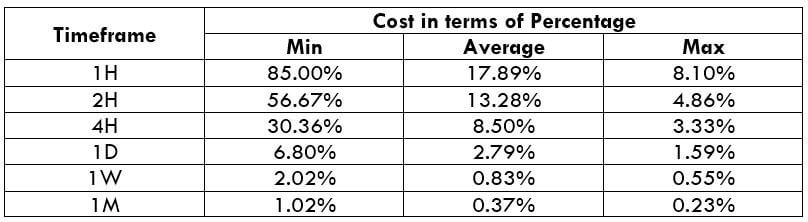
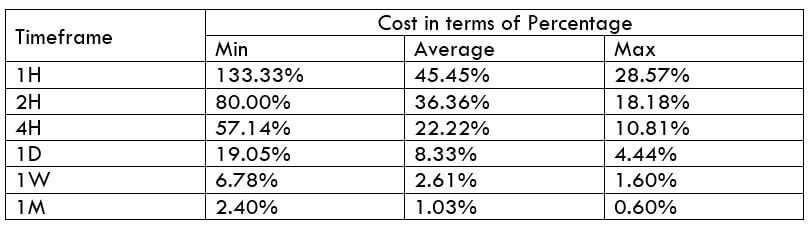
NZD/JPY Cost as a Percent of the Trading Range
The cost of a trade is not the same throughout the trading day. It varies based on the volatility of the market. Hence, it is necessary to know during what times the cost is high and what times it is low. This could be found out from the table illustrated below.
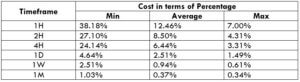
ECN Model Account
Spread = 0.8 | Slippage = 2 |Trading fee = 1
Total cost = Slippage + Spread + Trading Fee = 2 + 0.8 + 1 = 3.8
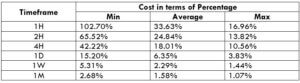
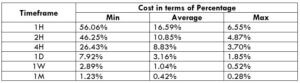
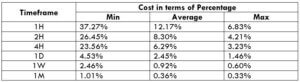
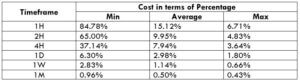
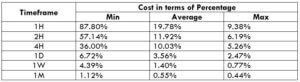
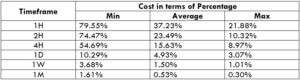
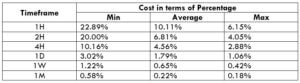
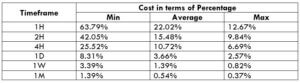
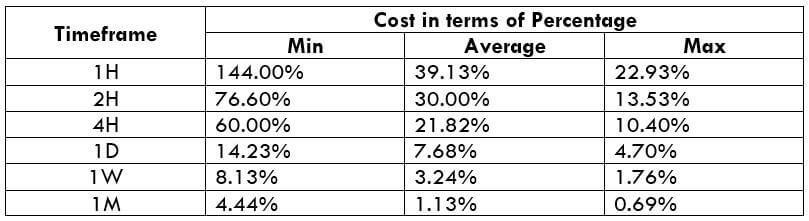
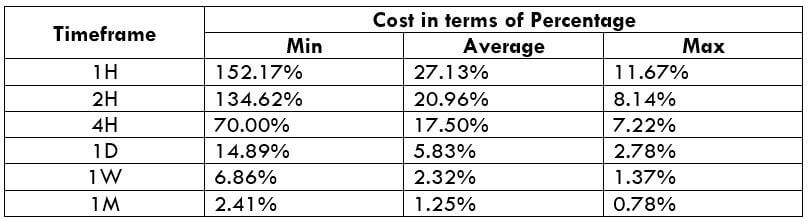
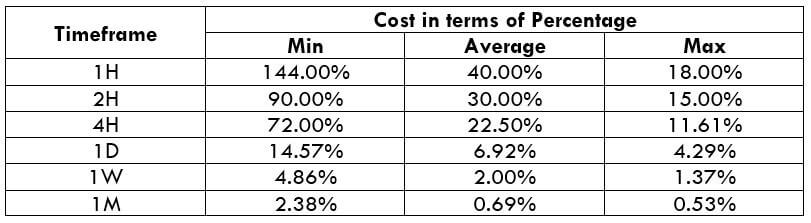
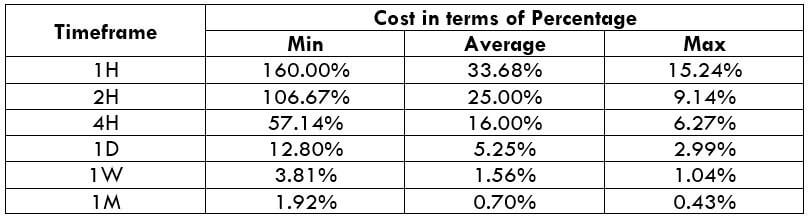
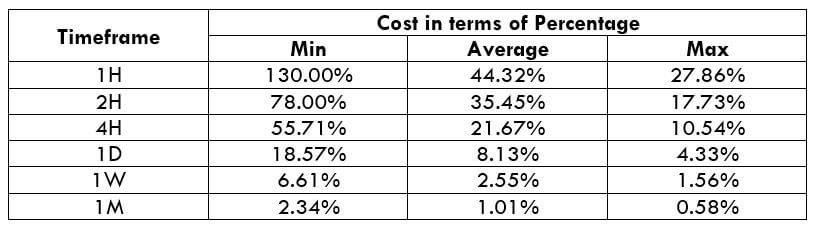
STP Model Account
Spread = 1.7 | Slippage = 2 | Trading fee = 0
Total cost = Slippage + Spread + Trading Fee = 2 + 1.7 + 0 = 3.7
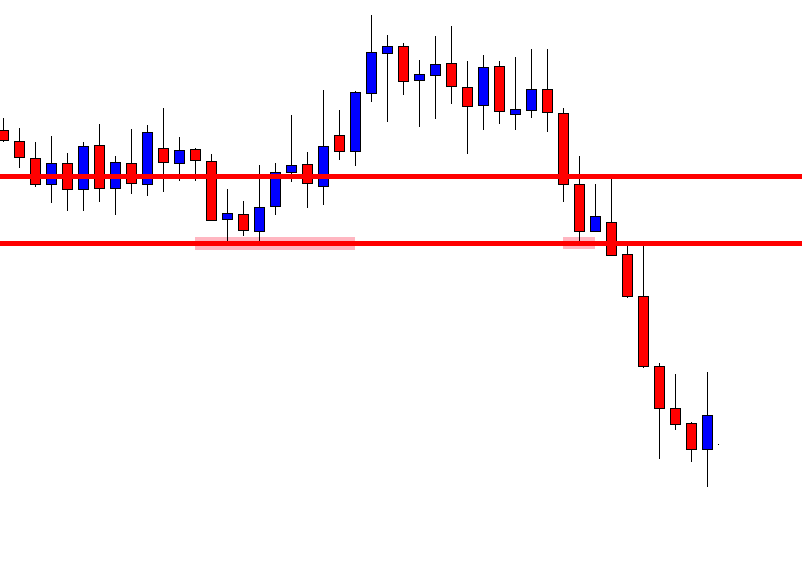
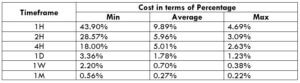
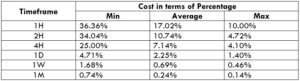
The Ideal way to trade the NZD/JPY
The magnitude of the cost percentage is directly proportional to the cost of a trade. So, the higher the value of the percentage, the higher is the cost of a trade. From the table, it can be observed that the cost is highest in the min column compared to the other two columns. This means that the costs are highest when the volatility of the market is low and vice versa, irrespective of the timeframe you’re trading. It is neither ideal to trade when the volatility of the market is high, nor when the costs are high. The average column is on the one we focus on. Trading when the volatility is at the average value is when you can expect moderate volatility and decent costs.
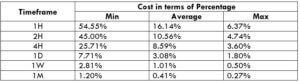
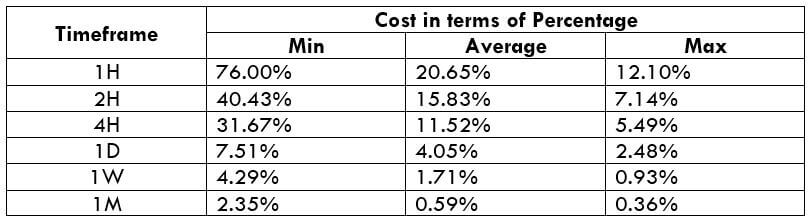
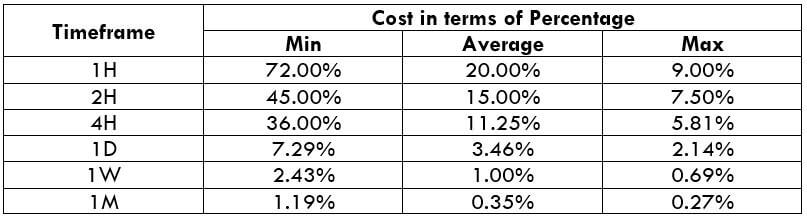
Also, you may reduce your costs by trading using limit or pending orders instead of market orders. This will bring the slippage to ground zero. This, in turn, will reduce the total cost of the trade as well. An example of the same is illustrated below.
Spread = 1.7 | Slippage = 0 | Trading fee = 0
Total cost = Slippage + Spread + Trading Fee = 0 + 1.7 + 0 = 1.7
Hence, it is seen that the costs have reduced by around 50% of the previous value.


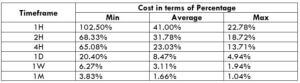
 The Ideal way to trade the GBP/NZD


 Spread
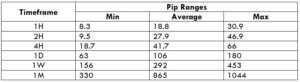


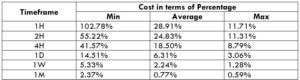
 The Ideal Timeframe to Trade NZD/USD