Categories
Forex Fundamental Analysis

AUD/USD Global Macro Analysis – Part 3

AUD/USD Exogenous Analysis

In the exogenous analysis, we will compare the differentials in the US and the Australian economies at an international level. We will use:

  • The differential in GDP growth in the US and Australia
  • The US and Australian interest rate differential
  • The differential in the US and Australian balance of trade

The differential in GDP growth in the US and Australia

Domestically, the value of USD and AUD are pushed by the changes in the macroeconomic factors that drive GDP growth. The dynamic of the AUD/USD exchange rate is affected by the difference in the GDP growth rate. The country with a faster GDP growth will see its currency appreciate more than the one with slower growth.

In Q3 of 2020, the Australian GDP increased by 3.3% compared to the 7% drop in Q2. The US economy expanded by 33.1% in Q3 2020 compared to a 31.4% drop in Q2. In the first three quarters, the US economy has contracted by 3.3% while the Australian economy has contracted by 4%. Therefore, the GDP growth differential between Australia and the US is -0.7%. Based on the correlation analysis with the AUD/USD pair, we assign a score of -2.

The US and Australian interest rate differential

This measures the difference between the interest rate set by the Reserve Bank of Australia (RBA) and the US Federal Reserve. In the forex market, carry traders tend to be bullish when a currency pair has a positive interest rate differential and bearish when it is negative. That is because more investor funds flow towards the country with a higher interest rate.

At the onset of the COVID-19 pandemic, the RBA cut interest rates from 0.75% to 0.1%, while the Federal Reserve cut interest rates from 1.75% to 0.25%. That makes the interest rate differential for the AUD/USD pair -0.15%. Based on correlation analysis with the exchange rate for the AUD/USD pair, we assign a score of -2.

The differential in the US and Australian balance of trade

The difference between the balance of trade for Australia and the US will help determine which currency is in higher demand in international trade. Note that increased demand in the forex market also increases the value of that currency.

In October 2020, Australia’s trade surplus increased to AUD 7.46 billion compared to 5.82 billion in September. However, it is still lower than the highest recorded AUD 9.62 billion surpluses in March. The US had a trade deficit of $63.1 billion in October, which has been expanding since January. The balance of trade differential is $68.633 billion between Australia and the US. Based on the correlation with the AUD/USD exchange rate, we assign a score of 6.

Conclusion

The exogenous score for the AUD/USD pair is 2. It means that we can expect that the pair will be on a bullish trend in the short-term.

In technical analysis, the short-term bullish trend is supported by the fact that the pair is trading above the 200-period MA and breaching the upper Bollinger Band. Cheers!

Categories
Crypto Market Analysis

BTC/USD Weekly Chart Analysis + Possible Outcomes

In this week’s BTC/USD analysis, we will be taking an in-depth look at the most recent technical formations, as well as look for the possible short-term price outcomes.

Overview

Bitcoin has had quite a volatile week experienced yet another steep decrease in price as a continuation of the bear retracement after the cryptocurrency couldn’t post new all-time highs with confidence. However, the largest cryptocurrency by market cap has recovered from the decline in a matter of days, with its price over $19,000 once again.

While Bitcoin’s fundamentals only grew stronger as more and more institutional investors acknowledge it as a competitor to gold. This trend of large public companies investing in the best-known cryptocurrency has been seen throughout 2020, and many say that this is the sole reason for the current Bitcoin’s run.

Technical factors


Bitcoin is currently in a steep upwards-facing trend, which brought its price from $17,600 all the way to $19,000. While the channel is way too steep to be considered a long-term option, Bitcoin has the option to follow it for a little bit more, possibly riding the way up to the $19,666 major resistance (and a previous all-time high on Bistamp). This will most likely be the pivot point for Bitcoin, which will decide if it will try to tackle the levels above $20,000 or stay below it and seek support near $19,100.

Likely Outcomes

Bitcoin’s currently sending out very bullish signals, but we included a slightly bearish scenario as well, just to make sure all bases are covered.

1: In case Bitcoin heads further up, its price will most likely stop at the major pivot point, which sits at $19,666. This level is the all-time high from 2017 and is a major resistance level. From here, Bitcoin bulls will have to decide whether they will push towards the upside or remain below this level:

  • In case that the price moves further up, its next possible resistance level (there isn’t much resistance above $20,000, so all possible resistance levels will be extensions of the Fib retracements) is most likely to be sitting at around $20,750.
  • In case the price decides to stay below $19,666, we can expect it to move down and look for support at $19,100 or $18,600 levels.

2: If Bitcoin breaks the ascending channel early and pushes towards the downside, its first strong support level is $19,100 (which it will inevitably break if it pushes down and breaks the channel) and then $18,600.

Entering any short trades could be quite risky at the moment due to the bullish momentum Bitcoin has gathered. However, trading above $20,000 is equally as risky as Bitcoin would be entering a zone with no set resistance and support levels. However, entering long traders is certainly a safer option at the moment.

Categories
Forex Videos

Forex Trading Algorithms Part 3-Converting Trading Strategy To EA’s & Elements Of Computer Language!


Trading Algorithms – The Elements of a Computer Language – Part I


A computer language is a formal language to convert our ideas into a language understandable by a computer. Along with computing history, languages have evolved from plain ones and zeroes to assembly language and up to the high-level languages we have today.

Assembly language

Assembly language is a direct link to the computer’s CPU. Every assembly instruction of the instruction set is linked to a specific instruction code to the CPU.  

Fig 1. The basic structure of an X86 CPU. Source cs.lmu.edu

The CPU characteristics are reflected in the instruction set. For instance, an X86 CPU has eight floating-point 80-bit registers, sixteen 64-bit registers, and six 16-bit registers. Registers are ultrafast memories for the CPU use. Thus every register has assembly instructions to load, add, subtract, and move values using them. 

Fig 2- Example of assembly language

source codeproject.com

A computer program developed in assembly language is highly efficient, but it is a nightmare for the developer when the project is large. Therefore, high-level languages have been created for the benefit of computer scientists.

The Elements of a high-level language

A modern computer language is a combination of efficient high-level data structures, elegant and easy-to-understand syntax, and an extensive library of functions to allow fast application development.

Numbers

A computer application usually receives inputs in the form of numbers. These come in two styles: integer and floating-point. Usually, they are linked to a name called “variable.” That name is used so that we can use different names for the many sources of information. For instance, a bar of market data is composed of Open, High, Low, and Close. We could assign each category the corresponding name in our program.

Integers correspond to a mathematical integer. An integer does not hold decimals. For instance, an integer division of 3/2 is 1. integers are usually used as counters or pointers to larger objects, such as lists or arrays.

A floating-point number is allowed to have decimals. Thus a 3/2 division is equal to 1.5. All OHLC market data comes in floating-point format.

Strings

A string is a data type to store written information made of characters. Strings are used as labels and to present information in a human-understandable form. Recently, strings are used as input in sentiment-analysis functions. Sentiment analysis 

Boolean

Boolean types represent true/false values. A true or false value is the result of a question or “if” statement. It can also be assigned directly to a variable, such as in

buyCondition = EURUSD.Close[0] > 1.151

In this case, buyCondition is False for EURUSD closes below 1.151, and is True when the close value is higher than 1.151.

Lists 

We usually do not deal with a single number. If we want to compute a 20-period moving average of the USDJPY pair’s Close, we would need its last 20 closes. To store these values, the language uses lists (or arrays in C++). A list is an ordered collection of values or other types of information, such as strings.

Since Lists are ordered, we can refer to a particular element in the list using an index. For instance, if we were to retrieve the candlestick Close two bars ago of the USDJPY, we would ask for USDJPY.Close[2]

Sets

A Set is an unordered collection of elements. Sets do not allow duplication of elements. That means it eliminates duplicate entries. Not all languages have built-in Sets, although it can be made through programming if needed.

Dictionaries

Dictionaries are a useful data type that maps a key to a value. For instance, in Python 

tel = {‘Joe’: 554 098 111, ‘Jane’: 660 413 901} 

is a telephone structure. To retrieve Joe’s phone, we would write:

mytel = tel[‘Joe’]

with mytel holding 554 098 111

As with sets, not all high-level languages have built-in dictionaries, but a savvy programmer is able to create one.


In the next video of this series, we will explain the elements for flow control.


Categories
Forex Videos

Forex Trading Algorithms Part 2 Converting Trading Strategy To EA’s! From Ideas To Code!


Trading Algorithms -From Ideas to code


As we have already said, computers are dumb. We need to explain to them everything. Moreover, digital computers are binary. They only understand ones and zeroes. Nothing else. 

Compilers and interpreters

To make our lives easier, we have created interpreters and compilers, able to translate our ideas into binary. Basically, both do the same job. Compilers produce a binary file that a computer can later execute, whereas interpreters translate each instruction as it comes in real-time.

From idea to the algorithm

Usually, traders think about when to enter and exit trades. An example brought by George Pruitt in his book The Ultimate Algorithmic Trading System Toolbox is the following. A trader wanted a code to enter the market and told him: 

” Buy when the market closes above the 200-day moving average and then starts to trend downward and the RSI bottoms out below 20 and starts moving up. The sell-short side is just the opposite.” 

No computer would understand that. In this case, the idea was partially defined, though: To buy when the price was above the 200-day SMA, and the RSI crosses down below 20. But what did he mean by “downward trend”? or “starts moving up”?

Pseudo-code

The first step to make a trading algorithm is to create an approximation to the code using plain English, but with more concise wording.

In the example above, Pruitt says that he could translate the above sentence into the following pseudo-code after some calls to his client:

The number inside brackets represents the close x days before the current session; thus, [1] is yesterday’s close.

In the pseudo-code, close below close[1] and close [1] below close [2] and close[2] below close[3] is the definition of a downtrend. But we could define it differently. What’s important is that a computer doesn’t know what a downtrend is, and every concept needed for our purposes should be defined, such as a moving average, RSI, and so forth.

The code

The next thing we need to do is move the pseudo-code to the actual code. There are several languages devised for trading. MT4/5 offers MQL4/5, which are variants of C++, with a complete library for trading. Another popular language is Easylanguage, created by Tradestation, which is also compatible with other platforms, such as Multicharts. Another popular language among quants is Python, a terrific high-level language with extensive libraries to design and test trading systems.

The code snippet above creates a Python function that translates the above code idea. In this case, the myBuy function must be told the actual asset to buy ( which should point to the asset’s historical data), and it checks for a buy condition. If true, it will return a label for the buy and the level to perform the buy, the next open of the asset in this case.

Systematic or discretionary?

The steps from idea to pseudo-code to code is critical. If you do not have a working algorithm, there is no way you could create a systematic trading system. But this is only the beginning. Creating a successful automated trading system is very hard and involves many developing, testing, and optimizing cycles. The market shifts its condition, and not always your system will perform. Then, you have to ask yourself if you’ll endure the drawdown stage until the market comes in sync with the system again.

Some systematic traders think that the best way to attack the market is to have a basket of uncorrelated trading systems, which are in tune with the market’s different stages: low-volatility trend, high-volatility trend, low-volatility sideways, high-volatility sideways, so your risk and reward is an average of all of them.

In the coming videos, we will dissect the steps to create an automated trading system. Stay tuned!

Categories
Forex Elliott Wave Forex Technical Analysis

EURGBP Soars!, More Gains Ahead?

The EURGBP cross soared on Friday session, surpassing the psychological 0.92 barrier, advancing until the target area forecasted in our previous short-term analysis (here.)

Technical Overview

Our previous analysis discussed the completion of the complex corrective formation identified as a double-three pattern of Minute degree labeled in black, which began on last September 11th at 0.92916 and finished on November 11th at 0.88610. Likewise, after the double-three completion, the cross completed the wave B of Minor degree identified in green.

Once the EURGBP found the bottom at 0.88610, the cross began a rally corresponding to wave C. We have seen in our previous analysis the price completed wave ((ii)) at 0.88667 on November 23rd. After this completion, both the breakout of the descending trendline of the second wave in black and the strong bullish long-body candlestick formation developed in the November 27th session confirmed the start of the third wave in black.

Technical Outlook

During the last trading session of the week, the short-term Elliott wave view for the EURGBP cross exposed in the following 8-hour chart reveals the acceleration in its advance, which surpassed the supply zone between 0.92008 and 0.92181, finding resistance at 0.92298.

The impulsive upward movement observed during Friday’s session allows us to distinguish the completion of the wave ((iii)) at 0.92298 and the beginning of the fourth wave of the same degree.

In this context, the current corrective formation identified as wave ((iv)) in black could decline until the previous supply zone between 0.90686 and 0.90446, where the cross could find fresh buyers. Once the fourth wave completes, the cross should advance in a new rally corresponding to wave ((v)), which would be subdivided into a five-wave sequence. The potential target for the end of wave C is within the next supply zone between 0.92568 and 0.92916.

In summary, the EURGBP cross appears moving in an incomplete wave C of Minor degree, which, in its lesser degree count, shows the beginning of the fourth wave in black. This corrective formation could decline until the previous supply zone is located between 0.90446 and 0.90686. The cross, then, could find fresh buyers expecting the continuation of the trend that would push up the price toward the supply zone between 0.92568 and 0.92916.

Lastly, the invalidation level for this bullish scenario can be found at 0.90031.

Categories
Crypto Daily Topic Cryptocurrencies

What Exactly Are Dark Pools? 

The finance world has always been filled with curiosities. Money is a touchy subject, and people often go to extraordinary lengths to protect their positions. Out of this has emerged the concept of ‘dark pools,’ which are financial trading hubs taking place away from the public’s eye. 

What are dark pools? How did they come to be? We’ll be looking at that and more in this article. Importantly, we’ll see the role they’ve played in the crypto space, if any. 

Understanding a Dark Pool

A dark pool is a privately arranged venue/hub/platform where financial instruments’ trading is held. Dark pools are in direct contrast with public exchange markets, which are heavily regulated and have a lot of media visibility. A dark pool has no publicly available order book, nor is its trades publicly visible (or are only visible once executed). 

Dark pools’ liquidity is known as dark pool liquidity. Most dark pool trading is executed in block trades. A block trade is a particularly large volume trade, usually at a predetermined price. 

Dark pools hark back to the 80s when institutional investors used them to exchange huge amounts of securities. Dark pools allow traders to place large orders without letting them known their intentions first. This is important because the public knowing their intentions to buy or sell large volumes of a security could negatively impact the trade before they can get to carry it out. 

Dark pools have become a substantial part of global financial markets, and we’ll be debunking them further in this article, together with their application in cryptocurrency. 

Cryptocurrency dark pools

UK-based crypto exchange Kraken pioneered dark pools crypto in 2016. “Dark pool trading allows for orders to be placed out of sight so that traders can make large buy or sell orders (minimum of 50 bitcoin or 2500 ether) without revealing their sentiment to other traders. Advantages include reduced market impact and better price for large blocks,” said Joseph Powell, CEO. 

A few countries around the world have been friendly to the concept of crypto dark pools. This is saying something when you consider the crime reputation that cryptocurrency has. Bermudan digital asset exchange Omega One’s Dark Pool was awarded the country’s first-ever crypto exchange license: “We are now on-boarding select institutions, liquidity venues, and market makers with a trading volume of $10 million a month.”

Why Use Dark Pools? 

Let’s say an institutional investor, A, believes Bitcoin’s price will soon take a hit. They decide to sell $1 million worth of BTC to ride out the fall in price safely. But two problems are impeding this proposition. First off, selling such a large amount of BTC on any open exchange will impact the market one way or another. They don’t want to cause such a large ripple in the market. 

The other problem is, no buyers are willing to purchase such a huge amount of Bitcoin, at least immediately. So they will have to break down the sale into the more manageable pieces of $50,000 at a time, 20 times. 

This means: 

  • They will incur charges on all the 20 sales. 
  • The sale will affect the market and probably send retail investors offloading as well, causing the price to crash.
  • The sale could end up being more costly – it’s highly likely they will not be able to sell each BTC at the going price, but lower. 

If the institutional investor used a dark pool, they’d save themselves from the above unfortunate scenarios. Selling on an open market would expose them to potential loss and send a negative signal to the market. 

Advantages of using a dark pool

There are several benefits of taking it dark: 

  • Avoid impact on market sentiment: Traders who wish to make large trades can do so in a way that they do not send signals to the market.
  • Better prices: In a dark pool, both seller and buyer get better prices than they would in the open market. The buyer buys low, while the seller sells high.
  • No slippage: The majority of trades in dark pools are usually block-trades set at predetermined prices. Traders know they can execute the trade at the expected price.

Controversies surrounding dark pools 

  • Conflict of interest: Seeing as the order book is not publicly available, a trader has no way of knowing that a trade was completed at the best possible price. If the entity facilitating the trade has a conflict of interest, they can potentially obfuscate the real price.
  • Negative effect on markets: If a large part of trading is happening in dark pools, the real market price may not reflect reality. The finance market relies on the free flow of information, and if a huge part of trading is happening under the radar, the actual market is disadvantaged.
  • Vulnerability to predatory practices: Dark pools are perhaps the best playing ground for predatory practices. In particular, high-frequency traders who may have access to order book data can unfairly exploit unsuspecting traders. 
  • Enabling pinging: Dark pools enable pinging, a questionable practice that involves sending many small orders to obscure a big hidden order. Pinging is used to identify liquidity in order books and can have an unhealthy effect on the market.
  • Decreasing popularity: Dark pools are not growing more popular – quite the opposite. This means institutional investors might be moving away from the practice. When their existence is less compelling, their overall effect on the broader market is harmful.

Decentralized dark pools

Just like dark pools in the traditional finance market, dark cryptocurrency pools are available on some exchanges, as we previously mentioned. Unlike traditional dark pools, decentralized dark pools enjoy better and more secure verification. Such verification is powered by state-of-the-art cryptography. Also, crypto dark pools are run by automatic protocols that help maintain fairness for all participants and less likely to be manipulated by unscrupulous players. Zero-knowledge proofs and other cryptographic technologies ensure a high degree of transparency and integrity. 

If a trade involves more than one blockchain, it can be seen through by cross-chain atomic swaps that are not only cheaper but also remove the bloat associated with third-party intermediaries. Dark pools can also help in illiquid cryptomarkets by enabling traders to conduct high-volume trades without slippage. While a huge order would send a negative signal in an open illiquid market, it wouldn’t have the same effect in a dark pool. 

So far, dark pools haven’t had a major effect on the crypto markets due to the relative lack of institutional traders in the space. Whether this will change in the future is anyone’s guess. 

Closing Thoughts

Courtesy of their secretive nature, dark pools have been a source of controversy throughout their existence. When a part of investing and trading activity occurs underground, it can never be desirable on any market. However, with decentralized dark pools, we could potentially see a shift in not just how they’re perceived but their usefulness to various players. Open source approaches to dark pools could ensure that everyone uses the same rule book, alleviating much of the associated risk. 

Categories
Forex Elliott Wave Forex Market Analysis

EURNZD Consolidates after Bouncing from its Recent Lows

The EURNZD cross is seen consolidating near the extreme bearish sentiment zone backed by the strength of the New Zealand dollar. This consolidation suggests a pause of the downward sequence that began on August 20th and ended heavily oversold after its latest decline that drove it to 1.69472.

Technical Overview

The following 12-hour chart illustrates the short-term markets participants’ sentiment bounded by the 90 high and low range, which shows the price consolidating in the extreme bearish sentiment zone after the cross found support on 1.69472 on November 24th.

Furthermore, the previous chart shows the primary trend outlined a blue trend-line that tells the bias remains mostly bearish. Likewise, the secondary trend represented with the green trend-line exposes the downward acceleration, and, shows also its consolidation range between the levels of 1.69472 and 1.72664.

Finally, as long as the EURNZD cross keeps moving below level 1.72664, the bias will remain bearish, so we could expect further drops, likely below 1.69472. Whereas, the breakout of the extreme bearish zone of 1.72664 to the upside could indicate the start of a recovery.

Short-term Technical Outlook

The short-term outlook for the EURNZD cross under the Elliott Wave perspective is shown in the next 2-hour chart and seen moving in an incomplete downward sequence. The current leg in which is moving corresponds to the wave ((c)) of Minute degree labeled in black.  Within that wave ((c)), the price is advancing in its fourth wave of Minuette degree identified in blue.


We see all that the wave ((c)) of Minute degree labeled in black came after the completion of the wave ((b)), which ends on 1.80212 where the cross found fresh sellers dragging it in an accelerated bearish movement. In this context, the current wave ((c)) should develop an internal structure of five waves.

Right now, the chart shows the action is happening in its fourth wave, in blue, which could be advancing in its internal wave b of Subminuette degree identified in green. This leg could possibly test November’s lows. Likewise, considering that the third wave, in blue, looks like an extended wave, the fourth wave should be complex in price, time, or both. Therefore, the current corrective wave could continue evlving likely until early 2021.

Concerning the fifth wave, in blue, and considering that the third one of the same degree was the extended movement, there are two potential scenarios for the cross:

  • First scenario: the cross fails in its downward sequence finding fresh buyers above the end of the third wave, in blue, at 1.69472.
  • Second scenario: the cross penetrates below 1.69472, creating a new lower low. In this case, this new leg down could continue until the psychological barrier of 1.68.

In summary, the EURNZD cross currently moves in a corrective formation in the extreme bearish sentiment zone. In this context, our principal bias remains neutral until the completion of the fourth wave in blue. Once the cross ends the current consolidation, we could seek short positions following the direction of the fifth wave. Finally, the invalidation level of the bearish scenario locates at 1.73606.

Categories
Crypto Daily Topic Cryptocurrencies

How to Buy Ethereum Using PayPal

For years now, Ethereum has been the most sought-after cryptocurrency right after Bitcoin. And in recent months, the coin seems to be on an unstoppable rally – which has only doubled down after the news that the long-awaited Eth2, an upgrade to the network, will be rolled out in December. At the time of writing, ETH is trading at over $500, according to Coinmarketcap. The currency has been oscillating within that range, which is a big deal considering the coin began the year with a tepid $130 in value. 

This is to say that Ethereum is more relevant than ever and will continue to command a huge share of the crypto market, at least in the foreseeable future. It’s also to say that demand for the currency is quite high at this point. 

For investors who wish to grab a piece of the Ethereum pie, what are their options to do so? Given that PayPal is one of the most widely used payment options, is it possible in 2020 to purchase Ethereum with it? 

This article set out to establish that. What we discovered is that PayPal is not supported in many crypto exchanges. However, you’re in luck because there are 2 or 3 places where you can buy ETH with PayPal, including on PayPal itself! 

Best Places to Buy Ethereum Using PayPal

#1. LocalCryptos

LocalCryptos is a peer-to-peer (P2P) cryptocurrency exchange that allows users to buy and sell crypto. The platform has tens of thousands of traders exchanging crypto with each other via various payment methods – PayPal included. 

When you purchase Ethereum via PayPal on LocalCryptos, you’re doing so directly from another user. The process is pretty straightforward. You’ll need to: 

  • Select a Buy With PayPal offer (posted by another user)
  • Enter the quantity of ETH you’d like to buy 

LocalCryptos requires the seller to put the ETH in an escrow before they can receive payment. When they do this, you can then transfer money with PayPal. You’ll receive the ETH after payment confirmation. The crypto-buying process on LocalCryptos is safe, beginner-friendly, and convenient. 

#2. eToro

eToro is a trading platform previously famous for CFD trading but has become one of the most reliable places to buy crypto in recent years. eToro allows buyers to purchase several cryptocurrencies with PayPal, including Ethereum, Ethereum Classic, Bitcoin, Bitcoin Cash, Binance Coin, Cardano, Litecoin, Dash, and more.

The platform even provides a dedicated eToro wallet, though not for every crypto (yet). However, at least it supports Ethereum. This makes eToro beginner-friendly to buy Ethereum. However, let the wallet be a placeholder as you look for a more solid and secure wallet. It’s good practice not to let your crypto hang around any exchange for too long since exchanges are susceptible to all kinds of online vulnerabilities. For some of the best wallet options in the market, see here

#3. PayPal

In highly welcome news, PayPal announced in October that they would start supporting the buying, selling, and holding of Ethereum, Bitcoin, Bitcoin Cash, and Litecoin on their platform. They also signaled support for the currency as a funding source for millions of merchants worldwide. 

There’s a caveat, though: this functionality will first be only available to eligible US accounts. Ethereum enthusiasts in other countries who use PayPal may have to wait a bit longer. 

Cost and Safety Implications

Buying Ethereum with PayPal is generally safe, especially since you can always initiate a chargeback if the seller doesn’t release ETH. However, be sure to use the function only if necessary; otherwise, overstretching it could get your account blacklisted by PayPal. 

Final Thoughts

Ethereum is currently roaring, and by all indications – it will continue to do so in coming months (and most likely years). With the impending protocol upgrade and an already incredibly bullish run, the currency shows no signs of stopping. With PayPal being one of the ‘mainstream’ payment methods today, it’s gratifying to know you can purchase the currency using the platform. 

Categories
Cryptocurrencies

What’s a Bitcoin Improvement Proposal? 

Bitcoin was the world’s first cryptocurrency. It has completely changed how the world views finance while at the same time rallying an entire industry of cryptocurrencies. Bitcoin holds (and probably will always hold) a very special place in cryptoverse. However, just like any new tech, Bitcoin has its growing pains. For this reason, Bitcoin developers are always coming up with improvement proposals for the network to make it even better. 

However, this is not done in a random fashion. Nine years ago, a man named Amir Taaki wisely came up with what’s known as a Bitcoin Improvement Proposal (BIP) that anyone should follow to suggest changes to the Bitcoin ecosystem. This article looks at what exactly a BIP is and what it entails. 

What’s a Bitcoin Improvement Proposal?

A Bitcoin Improvement Proposal (BIP) is an established standard in which people can suggest changes to the Bitcoin protocol. Such a proposed change can be about any aspect, including soft forks, improved recovery phrase formats, the peer-to-peer layer, and so on. Usually, BIPs are made by crypto developers or generally people with advanced computing skills. 

A BIP is created by individuals who believe that they have an idea that could vastly improve the Bitcoin ecosystem. The first-ever BIP – labeled BIP 0001 was made by a person named Amir Taaki. In essence, BIP 0001 was the groundwork for future BIPs – including how they would work and the expected standards. Not every change to the Bitcoin protocol affects it, and not every change requires a BIP.  

How a BIP is Approved or Rejected

Every BIP is initially a draft submitted by one or more individuals. However, before it is a draft, it has usually undergone rounds of discussions on the Bitcoin development mailing list, Bitcoin social forums, etc. 

When the BIP author receives feedback from the community, they can change or improve it based on that feedback. If it’s a major protocol change, it will first have to be implemented as a trial. If community members reach a consensus on the proposal, it proceeds to implementation. The final stage will involve developers implementing the new BIP code and network participants choosing to download it. 

Types of BIPs

BIPs are usually recognized as belonging to three categories. Let’s take a look at each: 

#1. Standards Track BIPs

These are BIPs that seek to improve the Bitcoin protocol, things such as blocks, scaling solutions, verifying transactions, etc. As you can see, standard track BIPs really get to the core of Bitcoin and its underlying infrastructure. Due to this, if the community accepts these types of BIPs they can have a permanent/major impact on the cryptocurrency. However, thanks to Bitcoin being already solid and ‘mainstream,’ it can be tough for a standard track BIP to be implemented and put into motion. 

#2. Information BIP

These types of BIPs are mainly targeted at issues like the design of the protocol and general guidelines. What this means is that information BIPs do not target the heart of Bitcoin and its underlying tech. However, these BIPs are still important and can be helpful to the Bitcoin ecosystem. 

#3. Process BIPs 

As the name suggests, process BIPs are suggestions to the BIP process. In this way, process BIPs are a lot like Standards Track BIPs, except they apply off-chain. In short, process BIPs apply to issues related to bitcoin but not directly involved in the underlying tech and code of Bitcoin. 

Structure of a BIP

If you’d like to submit a BIP, you’re expected to follow a certain structure to do so. The structure consists of the following: 

#1. Preamble

A preamble is the first section of a BIP. Here, the author includes details such as the BIP number, title, metadata of the BIP, and the author’s contact information and identity (s). Info in this section is important because it makes the BIP organized and easier to be shared or looked up. 

#2. Abstract

This is a description of the BIP, and it’s usually 200 words or less. In the abstract, the author distillates the proposal in simple and brief terms. The essence of the abstract is for people to easily understand what your BIP is about and what the core message is. 

#3. Copyright

In this section, the author includes any relevant copyright info for the proposal. This could be publication licenses, and so on. If the author uses license info, they must detail it here and see to it that all legal parameters are adhered to. 

#4. Specification

In this section, the author talks about any new features or ideas proposing to the Bitcoin protocol. Here, readers should have their questions answered about what your idea is and why they should care. Indeed, the specification section is the flesh of your BIP. As such, the author needs to write this section so that it’s easy to understand and be taken seriously. 

#5. Motivation

This is where an author describes why their idea is an improvement to Bitcoin. Here, you need to talk about why the existing solution is not good enough and how your idea can improve it. This doesn’t mean that the majority of the community will be on board. Still, it’s in this section why you make your case for better for worse. Even before you think about coming up with a VIP, ensure your idea is persuasive enough. Otherwise, your BIP may not go anywhere. 

#6. Rationale

This section is in some ways similar to the above section. But instead of talking about why the idea is important, you explain how you reached the decision to create your own BIP. This could be the decisions you made concerning the design, how you pushed through perceived rejections to the proposal, and so on. In short, the rationale section is where you preemptively respond to your critics way before they get a chance to criticize your idea. 

#7. Backward compatibility

In this section, you inform readers whether your BIP is backward compatible. If it’s not, you should provide details about the incompatibilities, including how severe they are and how you plan to deal with them. 

#8. Reference implementation

In this section, the author should provide an example of the idea that other developers could implement in the future. In other words, this is where you demonstrate your idea and showcase it to the community. If you don’t have a completed example, then your idea won’t cut it. After all, people need to see the idea of working in real life and not have to imagine it. This means it’s good to have a reference implementation before you begin working on your BIP.

The Big Picture 

BIPs can be extremely valuable to the Bitcoin ecosystem, especially as Bitcoin continues to rise in value. If positive changes are made to the protocol, it could make the world’s most popular cryptocurrency even stronger. The reverse is true. 

Much of the BIPs submitted so far have been about scaling Bitcoin. Some of them have led to contentious disagreements within the community, leading to contentious hard forks such as Bitcoin Cash and Bitcoin Gold. Others like SegWit2x have been turned down by a majority of the community. However, others, like SegWit and The Lightning Network, saw the green light of the community. Such updates could prove very key for the Bitcoin scaling issue.

Categories
Forex Videos

Forex Trading Algorithms Part 1-Converting Trading Strategy To EA’s & Running Tests On Profitability

Trading Algorithms –  An Introduction


Almost all traders, novices and pros alike, know at least the basics of technical analysis. Still, not many know how to convert a trading idea into a set of rules and then test them for profitability.  This video series aims to be an introduction to algorithms applied to trading. Even if you are not considering creating one EA or trading bot, we think it is very interesting to be proficient in converting your trading idea into formal code and test it. We will use mostly pseudo-code, but also python, a very easy-to-learn but powerful high-level language, and Easylanguage, developed by Tradestation, which is almost as pseudo-code because it was designed to be read as a natural language.


What is an algorithm?

An algorithm is a set of rules to perform a task in a finite number of steps. Basically, an algorithm is a recipe.


For example, if we were to create an algorithm to make a phone call manually. A possible solution could be this :

1.- Open the phone
2.- select the keyboard
3.- dial each number from left to right
4.- Click the green phone icon
5.- Hear the calling sound

6.- Busy tone?
    A- no ---> wait  60 seconds for the answer.
        Did somebody answer?
                Yes--> Start a conversation
                    I - Conversation ended?
                            Yes --> Hang up.
                No --> Hang up
    B- Yes ---> Wait 120 seconds and go to 4th step

Algorithms  used in Trading

There are many ways to create Trading algorithms, including advanced sentiment analysis, evaluating the words used in trading forums and news releases. Still, we will focus on algorithms for historical price action data series.

 The ability to create, test, and evaluate a trading algorithm is a terrific ability to own. This allows creating market models that map and profit from the market’s inefficiencies. If you happen to find one set of rules that historically made profits, it could likely continue making profits in the future. This is the basic premise of automated algos, expert advisors, and trading bots.


Algorithm properties

  • Inputs: zero or more values can be externally supplied. Some algorithms don’t need inputs, although the majority will, and of course, a trading algorithm will need to get timely data from the market to generate outputs.
  • Outputs: at least one result should be delivered. That is logical. The output may not only be a text. It can be a picture, a sound, or a market trading order.
  • Unambiguous: Each instruction must be explicit, with a single meaning.
  • Finite: It ends after a limited number of steps.
  • The algorithm should precisely specify what the computer should do. The computer is not smart. It is dumb. You should tell it precisely the action it has to make.
  • Effective: Every instruction should be basic enough to be made by hand or uses other algorithmic sub-units with the same property. Of course, the action must be feasible, which means the computer can perform that action because the instruction is included in the instruction set of the programming language you’re using.

The key to a good algorithm, as with recipes, is to break the ideas down into simple building blocks.

Flow Diagrams

Algorithms can be more complicated than a simple recipe. Besides, a recipe is interpreted by a (supposedly) intelligent cooker. On the other hand, algorithms are to be interpreted by brainless CPUs. Besides, algorithms usually accept a stream of data inputs, which must be transformed until an output or output is produced.  Flow diagrams are a pictorial representation of the algorithm’s process and data flow.

A Flow diagram is a very handy tool to develop your ideas into coherent algorithms because it helps you spot potential flaws and improvements and should be the first step before proceeding to the actual code.


In the next chapters, we will continue developing this basic idea, applied to trading, using trading examples.


Further reading:

The Ultimate Algorithm Trading Toolbox, by George Pruitt.


Categories
Forex Videos

Forex Position Sizing Part 12 – Two Tier Optimal F Part 2


Position Sizing XIII- Two-Tier Optimal f Part II


In Two-Tier Optimal f part I, we discussed the virtues and drawbacks of optimal f trading. In this part II video, we will present a methodology that will almost ensure that our initial capital is preserved with the possibility of astonishing growth factors on our trading account. This content is exclusive, and, so far, you will not see it explained elsewhere.


System requirements:

This methodology is valid only with profitable strategies. This method is not a miracle solution for losing systems.

It works best when the risk is homogeneous. That is, the dollar risk is a constant R factor to the rewards.

The better the system, the higher the and smoother are the rewards.


The Two-tier Strategy

1.- We split the trading account un two portions. One portion ( 25% of the total in our case) will be used with Optimal f positioning. The other part will be applied to a 1% risk positioning.

2.- After a determined goal (2X, 5X, 10X, 20X of the Opt-f portion), the account will be rebalanced ( by adding both sub-balances together) and then re-split(25%-75%) to start a new cycle. The cycle will also reboot itself if the Opt-f section’s balance goes below 25% of the value at the beginning of that cycle.


What was the procedure to test the two-tier Opt-f position system?

We took the current Signal Table closes signals and created two 10K trading histories of what would have been one year of trading activity. Thus, resulting in two collections of 10,000m years of trading data. One of the collections was to be used with the Optimal f position sizing portion, and the other one was employed in the 75%-portion of the account. The Python code for the entire simulation is shown below.

We did this procedure using several targets for the balance of the portion traded using Opt-f: 2X, 5X, 10X, and 20X. We focused the results on the following parameters: Average final capital, max final capital, min final capital, average trades need to 10X total capital appreciation, average max drawdown, The drawdown with 1% probability of occurrence. In the below table, we also present the results of the 1% risk and 100% Opt-f strategies. ( click the image to enlarge).


Discussion

We see that the 1% risk strategy is not bad at all since it can multiply by five the initial balance in one year. It does this with an average max drawdown of 8.79 percent, with the odds of reaching a 16.2% drawdown on one every 100 years. We see also that, on average, it needs 664 trades to multiply by ten the initial capital.  

On all two-tier columns, we see a remarkable fact that the min final capital is 10,486. That meant that in all the 10K years of simulated market action, not a single one ended below the initial 10K balance. Thus, this strategy seems to protect us against the loss of the initial capital. That is a terrific psychological reinforcement to withstand the high max drawdowns it presents.  The use of the 2X goal is the best choice for the less bold investors, as this method offers an average max drawdown of 38.32%, with a 1% chance of reaching 59% drawdown.  After one year, the average final capital is $8.5 million, with a starting capital of only 10K.  This positioning strategy multiplies by ten the capital, on average, every 113 trades. The second best choice is a 5X goal.  That will more than double the yearly returns at the expense of a near 50% drawdown on average.   On the table, we can see that the more we increase the goals to rebalance, the more the account growth, but also the max drawdown.

We can see that these strategies’ growth is orders of magnitude lower than fully Optf position sizing. Still, the attractiveness of this strategy is that the odds of being smaller than 10K after one year of trading are virtually none.

More ideas

We used 1% as the size used in 75% of the total capital in the preceding trading sizing proposals. Of course, we could modify that to better profit from the total capital with almost no increase in drawdown and fully preserving our initial capital. You can make your own simulations on this to find the best fit for you. As examples, let’s present three more simulations using Optf/10, Optf/ 5, and Optf/2 with 2X rebalancing goals. 


In the image above, we see that using Optf/5 in 75% of the capital will deliver huge profits with 40%-63% Drawdown figures and 79 trades to 10X capital appreciation. All this with almost no chance to blow up the account. 

Final words

This video shows exclusive and never taught position sizing methodologies that protect the initial capital and offer vastly superior results to the 1% risk standard methodology.  But you must be aware that we are assuming the trading strategy is effective long term. The trader will also need to find the safest optimal f value by performing the proper computer simulations.

That also shows that position sizing is part of a trading system that really helps you achieve your monetary objectives. And for optimizing it, you need to know the optimal f of the system you’re using.

Of course, the market will limit the trading size we can reach without influencing it, but as theory, these methodologies are real wealth multipliers for the serious trader.

To employ a two-tier methodology in the real market, you will need to be fully organized, have an appropriate spreadsheet to follow the trade results, have two split balances, and compute the size of the coming positions.

Categories
Forex Course

189. Summary – Trading The News

What did we learn till now? 

Sometimes in the forex market, the movement of prices seems random. In the previous series of courses, we have shown that most of the randomness you observe can be explained. By now, you should be capable of identifying the various news releases published daily. You should also be able to determine which currency pairs the news release is likely to impact.

In this final course, we’ll recap all that we have learned so far.

When it comes to news trading, a forex trader can either have a directional bias to trading or have a non-directional bias. For directionally biased traders, they have to:

  • Familiarise themselves with the economic calendar to know when economic indicators are scheduled for release
  • Understand the impact that each indicator might have and which currency pairs are best to trade
  • Understand that the analysts’ consensus or expectations are what determines if the news release is negative, positive, or in-line
  • Know which news releases to avoid trading

On the other hand, forex traders who have a non-directional bias do not necessarily need to familiarise themselves with these conditions. Such traders only need to know two things.

  • The scheduled release of economic indicators, speeches by influential people, and significant geopolitical events
  • Whether the upcoming event is of a high or low impact

Traders with a non-directional bias only concern themselves with the magnitude of the price movement after an event – not the direction. That is why they adopt the straddle strategy.

The straddle strategy uses forex stop orders, which triggers long or short positions if the market significantly moves in either direction. The buy stop order will trigger a long trade if the news release results in a bullish market. With the sell stop order, s short sell will be executed if the news release results in a bear market.

Remember to be careful when trading the news. Always keep an eye on the prevailing macroeconomic trends and geopolitical events. The overall market sentiment can sometimes amplify or dampen the impact of a news release.

If, for example, moments before the release of UK manufacturing data, the market receives news that the ongoing Brexit negotiations have hit a snag. If the manufacturing data is positive, its impact on the market will be dampened; if the release is negative, its impact will be magnified. All the best.

Categories
Cryptocurrencies

Monero Reaches 2-Year High, Is It the Next-Best Alternative?

Recently (Oct 2020), Monero hit $139 – its 2-year high, and investors are expressing renewed confidence in this crypto. What’s even more inspiring is the fact that the cryptocurrency has maintained a consistent sideways or upward – but not downward – trend since then. Before the 2017 crypto bull run, Monero always shied from surpassing the $1 mark. But the boom seemed to have inspired this crypto to take on the major players. 

On the other hand, investors are all over the place scrambling for Bitcoin, partly why it is currently shining in glory. While most of those jumping onto the Bitcoin frenzy might be a bit late to the fiesta, the case could be different for Monero investors. Could it be the next-best alternative to Bitcoin at the moment?

Let’s take a closer look at this crypto and determine whether it can give Bitcoin a run for its money.

What Makes Monero Special?

Monero was invented in 2014 with one goal: to facilitate private and anonymous transactions. But Bitcoin was already doing that! Well, not quite. Bitcoin was thought to be anonymous, but that is not the case. With the Bitcoin blockchain (and many others), it is possible to trace the transaction’s origin because the blockchain is transparent. 

Monero, on the other hand, provides a high level of obscurity for transactions. We can’t say that it is impossible or not to tell the source of an XMR transaction, but as of now, that possibility remains a matter of conjecture. 

In this age, users seem to cherish privacy, even when they are doing nothing illegal. As Monero positions itself as one of the most private and anonymous cryptocurrencies, it is gradually becoming a darling to many. 

Other than providing unmatched privacy and anonymity, Monero is also cheap, fast, and easy to use – qualities that appeal to both neophytes and seasoned users.  

The Sudden Interest in Monero

It’s not only speculators and investors who have expressed increasing interest in Monero – hackers and regulators are also realigning their strategies around this crypto. For instance, Sodinokibi, a ransomware (criminal hacking) group, recently announced that they would start taking ransom in Monero instead of Bitcoin. They added that their decision to abandon Bitcoin was based on privacy issues, which Monero does not face. 

If you follow dark web affairs, you know that there is a close relationship between cryptocurrency adoption for illegal activities and the growth of Monero. This can be evidenced by Bitcoin’s momentary decline in 2013 after Silk Road, one of the largest black markets, was seized by the FBI. If we draw parallels between BTC’s adoption in the black market and Monero’s interest in the underworld, there can be no denying that Monero will soon become a much sought-after gem. 

Authorities are also showing interest in the crypto, albeit not for investment purposes. In September, the US Internal Revenue Service announced that it’s giving out a bountiful reward to anyone who can help them trace the source of Monero transactions. Europol also reported that Monero is fast rising as the standard for dark web transactions.

These events suggest that XMR’s adoption is likely to increase. With increased adoption comes increased volumes, market capitalization, and prices. 

Monero’s Historical Performance

The coin was launched in 2014, exchanging at about $2 or 0.005 BTC. After struggling for several years, the 2017 crypto bull finally came to its rescue, raising its value to over $400 at some point. However, XMR’s performance against BTC had started rallying way before the crypto boom. Since mid-2016, XMR had already started gaining against Bitcoin. This was a noteworthy trend since XMR has largely maintained its growth against BTC.

The crypto has also grown its 24-hour trading volumes tremendously. Just a year ago, Monero seemed to struggle to reach $100 million in daily transactions. Even during the 2018 peak when it was fetching $400 in XMR/USD trades, daily volumes hardly surpassed $200 million. At the time of writing, XRM was exchanging at only $116, but the 24-hour volume was hitting over $2 billion. In other words, 24-hour volumes have increased 20-fold in 12 months. There is no doubt investors are increasingly trying out this alternative. 

XMR/USD or XMR/BTC?

If you are convinced that Monero is a worthy alternative to Bitcoin, there’s one crucial decision you need to make – and that is whether to trade XRM with Bitcoin or with USD. After all, most exchanges that list XMR offer both pairs. It is important to evaluate this decision because XMR’s relationship with BTC and USD hasn’t been linear – there are times when the crypto has fetched more BTC than the equivalent in USD. In fact, this has been the case during most of its lifetime, except for the last few weeks where Bitcoin has grabbed headlines for its performance. 

Based on the historical exchange rates, it would be more profitable to exchange XMR with BTC when selling than with USD. However, owing to the trend reversal in the last few weeks of Bitcoin’s glory, it is important to watch how the curve extends. 

Concerns You Might Consider

While Monero is generally promising, there are two major concerns you might want to evaluate before picking it as an alternative to Bitcoin. 

#1: It might not be available on your favorite exchange – Due to the crypto’s high level of privacy, some major exchanges do not list it. This is especially true for exchanges that seek to comply with regulators. As we have seen, Monero is increasingly becoming popular in the underground economy, and reputable exchanges might want to distance themselves from it.

#2: Monero is widely associated with facilitating illegal trade – When you mention that you are a Monero, Zcash, or Dash investor, chances are you might be mistaken for being part of the dark web economy. Well, this won’t dampen your chances of successful crypto investment, but it’s worth keeping in mind all the same.

Final Thoughts

Monero is one of the fast-rising altcoins besides the fact that it has had a good track record in financial performance. In 2020, the coin has grabbed regulators’ attention due to its increased adoption in the underground economy. At the same time, the coin has consistently gained against both the USD and BTC throughout the year, save for the last few weeks where it has lost slightly against BTC. Also noteworthy is that the crypto’s daily volume has increased more than 20 times since the beginning of the year – signaling its increasing adoption. Although there might be a few concerns regarding the use of this cryptocurrency for covert activities, there is no denying it is a worthy alternative to Bitcoin.

Categories
Crypto Daily Topic Cryptocurrencies

How to Buy Bitcoin with a Credit/Debit Card

Credit/debit cards have enabled us to make instant, convenient, and hassle-free payments since the founding of the Diners Club in the 1950s, and today, this possibility has been extended to the purchase of Bitcoin. Buying Bitcoin with a credit card is among the easiest ways to get yourself some crypto. 

But where can you buy Bitcoin using a credit card? And is it safe? What about transaction costs? We’ll look at these concerns and more in this article.

How You Can Buy BTC with a Credit Card

When it comes to buying BTC with a credit card, there are two main possibilities. 

i) Direct payment – This is the least confusing option. With direct payments, you go to the exchange’s website, make your purchase and use the Visa/MasterCard/AmericanExpress (or just the cards that are available) option. The checkout process will be similar to buying anything else with your credit card. 

ii) Through a payment gateway/ payment service provider – For reasons such as cost savings, bonuses, and offers, you might want to pay through a payment gateway or money transfer service provider such as PayPal and Skrill. If you’re new to buying BTC, or if you’re buying just a few coins, this long route might not make much sense. However, if you are a high-stake investor, you might want to take advantage of any slight margins, although with increased inconvenience.

To buy Bitcoin with your credit card through a payment gateway, you’ll need to load your payment gateway’s account with funds first. Then, when checking out from your exchange, you choose to pay with Skrill/PayPal or whichever method you’re using. 

Best Places to Buy BTC with a Credit Card

Most likely, you will be buying Bitcoin from a crypto exchange like Coinbase, Kraken, or eToro. There are other methods, such as buying from individuals, but we’ll be focusing on exchanges.

That said, the following are among the best exchanges where you can Bitcoin using your credit card. These exchanges have been selected based on ease of use, buying limit, security, and transaction costs. The exchanges are not ranked in any particular order.

#1. Coinmama

Purchases made with credit cards usually have various limits to mitigate fraud. Coinmana offers among the highest purchase limits. The exchange is also available globally, which makes it a convenient option wherever you are. Additionally, the exchange has a reputation when it comes to reliability and trust among its user community.

When buying BTC on Coinmama, you will need to register/ sign in and create a crypto wallet on the platform. Then, when you get to the step of selecting a payment method, you’ll be required to choose from either Visa or MasterCard. Card payments are instant and attract a 5% processing fee. This cost is a bit high compared to going through a payment provider such as Skrill (Skrill charges 2.5% of the transaction value). Nevertheless, the experience is swift.

#2. Coinbase

Coinbase allows you to buy up to $150 or €150 worth of BTC per week. Debit card payments are accepted in all countries where Coinbase operates. However, you cannot buy BTC with a credit card if you reside in the US, Canada, Australia, and anywhere within Europe. 

If you want to buy BTC on Coinbase using your card, you will need to set up your user profile and link your credit/debit card. Later on, when you are actually buying BTC, you will select your already-added card at checkout. Transactions cost 3.99% regardless of the amount, and settlement is instant. The buying experience on Coinbase is also smooth.

#3. Bitpanda

Bitpanda is another reputable exchange where you can buy BTC using your card. First, you will need a Bitpanda account to buy BTC. Once you log in to the account, you can navigate to the ‘Buy’ tab on the menu. Bitpanda allows you to add the payment method during checkout, so you don’t have to link your card in advance. 

After selecting ‘Buy,’ you will see large buttons with the names of some of the major cryptos and other buttons for payment methods. You will need to make the appropriate selections to proceed. If you pay by card, both credit and debit cards are supported, but it must be Visa/MasterCard. Once you have selected your card, the rest of the process is easy to complete. 

Bitpanda offers one of the most secure card payment options. To make a card payment for crypto purchases on this exchange, your card must have 3-D Secure verification enabled. Note that there’s nothing you can do if your card does not support this protocol (other than look for another exchange).

#4. CEX.io

CEX.io is one of the earliest cryptocurrency exchanges to exist. Even so, it has never moved its operations beyond Europe, some countries in South America, and some states in the US. It is still a great place to buy BTC using your card if you are from any of these regions

CEX.io boasts of unmatched security and trust. The exchange is registered in the US as a Money Services Business. In the UK, it is incorporated as a private limited company. CEX.io is also PCI-DSS compliant. PCI-DSS is the global security standard for card payment providers. Due to the company’s focus on security and compliance, user experience is adversely affected. For instance, transaction verifications can take up to 30 minutes. 

Security/ Safety

The security and safety of your credit/debit card are paramount. Generally, buying crypto using cards is not riskier than using your card for your regular shopping. However, it is important to do the basic checks to ensure that you are dealing with legitimate and reputable exchanges. 

When using your credit card to buy Bitcoin, you will inevitably share your details with your exchange. Thus, it is essential to ensure that you’re dealing with a legitimate exchange, and two, the exchange is reputable. If you leave your card details with a shady exchange, how can you be sure that your card details will not be used for fraudulent purchases?

Final Thoughts

Credit/debit cards are a relatively easy and convenient option for paying for your Bitcoin purchases. This payment option is also supported by most major exchanges like Coinbase, Coinmama, and Bitpanda. Additionally, paying for BTC with your card is safe, as long as you’re dealing with reputable exchanges. On the downside, cards have restrictive transaction limits, which may disadvantage large buyers. Also, some exchanges do not accept credit cards from certain countries. Whichever the case, you can always find an option among the many. 

Categories
Forex Elliott Wave Forex Market Analysis

GBPUSD Ending Diagonal Completion a Warning Sign for a Trend Reversal?

In our last GBPUSD analysis, we discussed its upward advance in an incomplete ending diagonal pattern. We said that the terminal Elliott wave formation progressed in its fifth wave of Minuette degree identified in blue that belongs to a wave ((c)) of Minute degree labeled in black. Likewise, the wave ((c)) corresponds to the third internal segment of the wave B of Minor degree identified in green. 

Technical Overview

The big picture unveiled the sideways movement in an incomplete corrective formation, which could correspond to an expanding flat pattern. In this regard, after the completion of wave B, the Sterling should start developing wave C, which should lead to a decline of this major pair in a five-wave internal sequence.

On the other hand, the following 8-hour chart reveals the market participants’ sentiment unfolded by the 90-day high and low range, which looks advancing in the extreme bullish sentiment zone. 

The previous chart illustrates the bullish failure in the Wednesday trading session, which couldn’t strike the last high of 1.35394. This failure added to the breakdown of the previous upward trendline plotted in green leads us to expect further declines in the coming trading sessions, likely to the ascending primary trend-line identified in blue.

Short-term Technical Outlook

The intraday Elliott wave view for the GBPUSD pair displayed by the following 2-hour chart exposes the breakdown of the ending diagonal pattern formed on December 07th, confirming the completion of the terminal formation unveiled in the wave ((c)) identified in black. 

Once the Pound found the intraday support at 1.32238, the price action began to bounce in an internal corrective rally subdivided in a three-wave sequence corresponding to wave ((ii)) in black, founding resistance at 1.34779 on the Wednesday trading session.

In this regard, the breakdown of the intraday trend-line that connects the waves ((i)) and (b) should confirm the downward progress of its wave ((iii)) in black, which according to the Elliott wave theory, should be the largest wave of the downward sequence.

The third wave in black could find support in the demand zone between 1.31296 and 1.31064. If the price action continues deteriorating, the Cable could drop toward the next demand zone between 1.29843 and 1.29144.

Summarizing

After the GBPUSD pair made a breakdown of its ending diagonal pattern, is currently moving in a corrective rally corresponding to wave ((ii)), which should give way to a new decline corresponding to the third wave of Minute degree. According to the textbook, this movement should be the largest decline of the current downward sequence and could find support in the demand zone between 1.31296 and 1.31064. Finally, the invalidation level of the current bearish scenario can be found at 1.35394.

Categories
Forex Fundamental Analysis

USD/JPY Global Macro Analysis – Part 3

USD/JPY Exogenous Analysis

In the exogenous analysis, we will analyze economic indicators that exhaustively compare the performance of the US and the Japanese economies. These factors impact the dynamic of the USD/JPY pair in the forex market. They include:

  • US and Japan interest rate differential
  • The difference in the GDP growth in the US and Japan
  • Balance of trade

US and Japan interest rate differential

The interest rate differential is the difference between the interest rate in the US and that of Japan. Investors would prefer to invest their funds in a country that offers higher returns. Furthermore, carry traders are often bullish on the currency with a higher interest, which ensures that they earn higher yields.

The Bank of Japan has kept the interest rates at -0.1% since 2016. The current federal funds rate in the US is 0.25%. Thus, the interest rate differential for the USD/JPY is 0.35%. Since there are no foreseeable changes in the interest rates in either country, we assign it an inflationary score of 2.

Balance of trade

Balance of trade determines whether a country has a trade surplus or deficit in international trade. A trade surplus results from a country’s exports being of higher value than that of its imports. A deficit occurs when the imports are of higher value than exports. Japan mostly exports machinery and electronics, which puts it at a significant advantage due to the value of these goods. On the other hand, the US is a net importer.

In October 2020, japan has a trade surplus of ¥872.9 billion, which has been steadily increasing since June. The US has a trade deficit of $63.9 billion, which has been growing throughout the year.

The balance of trade differential between the US and Japan has been widening in favor of Japan. Based on our correlation analysis with the USD/JPY, we assign it a score of -6. It means that if this trend persists, we expect the USD/JPY to be bullish in the near term.

The difference in the GDP growth in the US and Japan

Although the US has a higher GDP than Japan, we can compare the two economies based on their growth rates.

The US economy had a GDP growth rate of 33.1% in Q3 2020, while Japan’s economy expanded by only 5%. The US economy is seen to be expanding at a faster pace than that of Japan. Based on the correlation with the price of the USD/JPY pair, we assign an inflationary score of 2. This means that we should expect a bullish trend on the USD/JPY pair if the US economy keeps expanding faster than that of Japan.

Conclusion

The total score from the exogenous analysis of the USD/JPY pair is -2. This implies that in the near term, we should expect a bearish trend in the pair.

Technical analysis of the USD/JPY pair shows that the weekly chart is still trading way below the 200-period MA. Furthermore, the pair has failed to successfully breach the middle Bollinger band, which has served as its resistance level. All the best!

Categories
Forex Fundamental Analysis

USD/JPY Global Macro Analysis – Part 1 & 2

Introduction

Global macro analysis of the USD/JPY pair involves the analysis of endogenous factors that impact both the USD and the JPY; and exogenous analysis for the USD/JPY pair.

In the endogenous analysis, we’ll focus on domestic macroeconomic factors that drive the domestic growth in the US and Japan. The exogenous analysis will involve the analysis of global macroeconomic factors that define the dynamics of the USD/JPY pair.

Ranking Scale

We will rank both the endogenous and the exogenous factors on a sliding scale of -10 to +10. Whenever the ranking is negative, it means that the macroeconomic indicator led to the depreciation of the currency. A positive ranking means that the indicator had an inflationary impact.

USD Endogenous Analysis – Summary

A score of -19.1 implies a clear deflationary effect on the US Dollar. This means that USD has lost its value since the beginning of 2020, according to these indicators.

You can find the complete USD Endogenous Analysis here.

JPY Endogenous Analysis – Summary

The endogenous analysis for the Japanese economy resulted in an overall inflationary score of 3. Based on this analysis, we can expect that the JPY had appreciated marginally in 2020.

  • Japan Inflation Rate

The inflation rate in Japan is measured by the consumer price index  (CPI). The CPI weights various consumer expenditures depending on their level of importance. Food is weighted at 25%, Housing 21%, transport and communication 14%, recreation 11.5%, energy and water 7%,  medical care 4.3%, and clothing 4%.

A higher rate of inflation is necessary for economic growth. It also forestalls a possible interest rate hike, which is accompanied by currency appreciation.

In October 2020, the MoM inflation rate in Japan decreased by 0.1% constant change since August. The YoY inflation rate decline by 0.4%, the first decline in about four years.

Based on our correlation analysis, we assign Japan’s inflation rate, a deflationary score of -2.

  • Japan Unemployment Rate

The unemployment rate measures the number of Japanese citizens eligible for employment who are currently seeking gainful employment opportunities.

An increasing rate of unemployment means that more jobs are lost in the economy faster than new jobs are being created. That’s an indicator that the economy is contracting.

In October 2020, Japan’s unemployment rate increased to 3.1%, representing 21.4 million people, the highest recorded since May 2017.

Due to the high correlation between the unemployment rate and GDP, we assign it a score of -5.

  • Japan Manufacturing PMI

The Japan manufacturing PMI is also known as the Jibun Bank Japan Manufacturing PMI. The PMI is compiled through a series of monthly questionnaires surveying about 400 manufacturers. The manufacturers are segregated depending on their industry’s contribution to GDP, and their responses aggregated into a diffusion index. When the index is above 50, it means that the manufacturing activity increased while a below 50 reading implies a slow-down in the manufacturing sector.

Japan is a highly industrialized economy, and its manufacturing activities have a high correlation with its GDP growth rate.

In November 2020, the Japan Manufacturing PMI was 49, inching closer to the highest recorded 49.3 in January. Since the manufacturing PMI has been steadily increasing from the lows of 38.4 in May, we assign it an inflationary score of 6.

This PMI is also known as Jibun Bank Japan Services PMI. It is a survey of over 400 services companies operating in the Japanese services industry. A Survey of the purchasing managers is used to track industry changes in employment, inventories, sales, and prices. Sectors covered by the survey include transport and communication, personal services, financial services, hotel industry, and IT. The responses are weighted based on the sector’s size and aggregated into an index from 0 to 100.

When the index is above 50, it signals that there is an expansion in the services industry, while below 50 shows contraction.

In November 2020, the Japan services PMI dropped to 46.7 from 47.7 in October. Although the index is above the lows of 21.5 recorded at the height of the coronavirus pandemic, it is still lower than the levels observed in the pre-pandemic period.

Based on our correlation analysis, we assign Japan services PMI an inflationary score of 2.

  • Japan Retail sales

The monthly retail sales measure the change in the value of goods consumed directly by households. In any economy, the growth in GDP is primarily driven by the demand by households. Thus, retail sales can be considered a significant indicator of economic growth.

In October 2020, the MoM retail sales in Japan increased by 0.4%, while YoY retail sales increased by 6.4%. The increase in October is the first time the YoY retail sales have increased since February. This shows demand in the Japanese economy is growing after the easing restrictions implemented in the wake of the pandemic.

Due to its high correlation with the GDP, we assign Japan retail sales an inflationary score of 5.

  • Japan General Government Gross Debt to GDP

This is the ratio between the amount of debt, both domestic and foreign, that the Japanese government has accumulated to national GDP. Typically, lenders use this ratio to determine if a country’s economy is overly leveraged and if the government might default in the future.

Note that Japan has the largest national debt to GDP in the world. However, although it is heavily indebted, unlike many other countries, Japanese debt is denominated in Yen. More so, foreigners only hold about 6.5% of the total debt. That is why Japan can continue to accumulate such massive debts without any fears of hyperinflation or default risks. But that doesn’t mean that the debt isn’t weighing down on the economy.

In 2019, the Japan national debt to GDP was 238%, an increase from 236.6% in 2018. In 2020, it is projected to exceed 240% due to the measures implemented to fight the pandemic. Based on our correlation analysis, we assign it a deflationary score of -3.

Please check our next article to find the Exogenous analysis of both USD and JPY currencies. We have also come to a conclusion on whether you should expect a bullish or bearish trend in this pair.

Categories
Forex Videos

Position Sizing Part 12 – Two Tier Optimal F – I

Position Sizing XII- Two-Tier Optimal f Part I


In our past video presentation about the Kelly Criterion and Optimal f position sizing methods, we have learned that using these position size methods bring the maximal growth factor to any trading account using a profitable strategy. But, optimal fraction position sizes also presented drawdowns of over 90%, making them unsuitable for any trader except for a robot.

Nevertheless, optimal fraction position size shows the fastest growth rate, meaning achieving a determined goal in minimal time. Consequently, if we were to devise a methodology to reduce drawdown at tolerable levels, diminishing the risk of ruin to zero, and boost the basic 1-percent risk equity progression to unseen levels, we could take advantage of a terrific methodology and produce psychologically acceptable growth optimization.  That is the object of the current video presentation. 

To make this analysis, we used the currently available data from our Live trading signals. That way, our study is as close to a real system as it can be. 

At the time of this writing, we have delivered 203 signals since March 20. Thus, about 51 signals per month, that is, 2.5 signals per trading day. The general statistics were:

STRATEGY STATISTICAL PARAMETERS: 
 Nr. of Trades        : 203.00
 Percent winners      : 65.52%
 Profit Factor        : 2.10
 Average Reward Ratio : 1.11
 Sample Statistics:      
 Mathematical Expectation : 0.3800
 Standard dev            : 1.3682
VAN K THARP SQN           : 2.7774

To find the safest optimal f, we did a Monte Carlo resampling of the original trade sequence. The resampling was done with what would have been one trading year using 10,000 resamples, supplying us with 10,000 years of synthetic market activity.

The resulting optimal fractions were plotted and shown below. We can see a Gaussian bell curve centered at 0.62.

But the average f is not a safe fraction because 50% of the values lie below the average. We seek an optimal f that guarantees as much as possible that no future values lie below it.

Opt f Key Values   
       max: 91.33%
   average: 62.58%
       min: 23.57%

Thus, to be safe, we want the minimum f, which is 23.57%. 

The Live Trade Signals using a fixed 1% risk per trade

To create a reference from which to compare our proposal, we have computed what would have been four years of trading activity using our Live Signals

The next figure shows the equity curves resulting from the 10K resamples, corresponding to a 1% dollar risk on each trade and over what would have been approximately one year of activity.

We see that starting with $10,000, the end capital of the equity curves range from $19,967 up to over $140,000, although the average ending capital is $53,122.

      Average ending Capital : 53,122.77
          Max ending Capital : 154,077.50 
           Min ending Capital: 19,967.23


From these data, we can also create an interesting statistic to answer the question of how many trades are needed to reach a determined goal. In this case, we present the Trades to reach 10X. The curve results from computing this value on all 10K equity curves and computes the odds relative to the number of trades.

In the case of the 1% risk, we see that the average time to reach 10X, the initial capital is about 650 trades, with a minimum of 400 days and a maximum of 1000 days. Not bad at all. But that can be improved dramatically using a mix of conservative and aggressive position sizing.

The optimal F Positioning Strategy

Using the optimal f positioning strategy, a bold investor will navigate in the turbulent waters of one of these equity curves:

The chart is on a semi-log scale because the range of values is too vast to handle on a linear chart. We see that the y-axis show scientific notation, but do not fret. The number of trailing zeros of the equity corresponds with the last digit is in superscript. For instance, in the previous figure, we see that the ending capital after one year of trades ranges from below $1,000 to a theoretical value with 22 trailing zeros.

The next figure shows the cumulated probability of reaching a certain number of trailing zeros:

We observe that a small portion of the equity curves end below 4 digits, meaning they are net losers.  The following data clarifies this by showing relevant figures:

      Average ending Capital : 517.14 billion
          Max ending Capital : 43,096,478,975,341.38 billion 
           Min ending Capital: 153.51
     Capital ending above 517 billion : 55.63 % of the equity curves
     Capital ending above 1 million :  92.51 %
     Capital ending above 100,000 : 92.96 %
     Capital ending below 10,000 :  6.8507 %
     Capital ending below 5,000 :  3.4253 %

And, next, the chart that shows the power of trading using optimal f. The chart shows the time to reach 10X the initial capital,

The graph shows that the average time to reach 10X growth (50% probability) went from about 620 days down to 42 days. The same growth achieved in one-tenth of the time!

The Two-tier risk system.

The proposed system aims to profit from the rapid growth of an optimal fraction position sizing while minimizing the risk of blowing up the account. In this video, we will outline the idea and, in the following videos, will present its results and also the optimal requirements to make it work and minimize the risk.

The critical value here is the percentage of times the optimal f ends below 10K in a determined period.  Here we will take 80 trades instead of one-year of trading, as this shows a more realistic use in a Two-tier system.

40-trade figures:

    Average ending Capital : 213,793 
        Max ending Capital : 5,127 billion 
         Min ending Capital: 154

     Odds of

             Ending above 46,474    : 51.74 %
             Ending above 1,000,000 : 29.61 %
             Ending above 100,000   : 62.82 %
             Ending below 10,000    : 13.35 %
             Ending below 5,000     : 10.40 %

The key idea is based on the odds of the trading capital ending below the initial 10K value. In the case of sequences of 80 trades, we see that the odds are roughly 13.3%, and the odds of ending below 50% of the original figure is just 10.4%. 

That is the risk for the opportunity to have an average of $213,793 ending capital, which is over 21X. The risk/ reward ratio of the proposition is 214/5, which is 43. That means we can be wrong up to 42 times and recover after just one good trading sequence. Our initial proposal is to take 1/4 of the capital to allocate for an opt f positioning strategy.

The Two-tier optimal f proposal 

  1. Take 25% of your current trading balance and use it for the optimal f strategy. Use the rest 75% for 1% risk trades or let it be in cash. (more variations possible)
  2. Let computations of the optimal f strategy be separated in its own pocket to compute the subsequent trades.
  3. The account will be rebalanced after a determined goal has been achieved or goes below a predetermined level ( in our case, we will rebalance if the Optf part drops below ¼ of the initial capital on each cycle).
  4. After rebalancing, a new cycle of 25%-75% allocation begins.

In our next video, we will deal with the results and trade parameters of this combined strategy, as well as our advice on which features are desirable to make this strategy optimal.


Categories
Forex Course

188. Straddle Trading Strategy – An Efficient Way To Trade The News

Introduction 

In the previous lesson, we covered how you can make money if you knew the direction the market was going to move. In this lesson, we will show you how you can make money if you have no idea about the direction the market is going to move.

When there is high volatility in the market, especially as a result of a news release, it is possible to achieve this. Note that this strategy is different from trading with a directional bias.

Let’s break it down!

Firstly, you have to aware of an upcoming high-impact news release. Unlike trading with a directional bias, you don’t have to familiarise yourself with the direction the news will move the market. All you have to know is that the market will significantly move.

Let’s say, for example, that a news release is scheduled for 8.30 AM. Using the 5-minute timeframe, observe the trend for the past 30 minutes and establish the support and resistance levels. You will use these levels to set a buy stop and sell stop order.

With the buy stop orders, if the price breaks above the resistance level, a long order will be triggered. In the sell stop order, if the price breaks below the support level, a sell order will be triggered. Let’s use the news release of the US unemployment rate on October 2, 2020, at 8.30 AM EST.

Here’s the logic behind the straddle strategy. If the news is significant enough to break through the support level, then it is plausible for the bullish trend to continue in the short term. Conversely, if the news release is significant enough to blow the price past the support level, then the bearish trend might progress in the short-term.

Note that you can pre-set your ‘take profit’ and ‘stop-loss’ levels when using the forex pending order types. Doing this ensures that you get to determine your absolute downside in case a trend doesn’t hold. Furthermore, you can opt for only the ‘trailing stop order’ alongside the stop orders. Your ‘stop-loss’ value is not fixed with the trailing stop, which increases your exposure to the upside.

For instance, if, in the above example, we had set our take profit level at ten pips, we would have only made the ten pips. But, if we used the trailing stop order instead, we would have gained more than the ten pips. Cheers!

[wp_quiz id=”98844″]
Categories
Crypto Daily Topic Forex Daily Topic Forex Videos

Position Sizing Part 1 Drawdown – Why You Keep Blowing Your Account!


Position Sizing. Drawdown- The dark side of Trade


This video will be dedicated to explaining the relation between performance and drawdown.  It is an essential topic since most of the trading community ignores the fact that the drawdown of a trading strategy or system is not an independent value. It is position sizing dependent. Furthermore, the profitability of a trading system is also dependent on the size of the position.

Imagine several investors trying to choose a copy-trading service, and you need to rank the potential candidates. Which parameter do you think most of them would choose to grade the quality of that group of systems?  Total returns? Average trade return? Percent winners? Drawdowns?

The majority would rank them by total returns, without any further analysis on how the returns were obtained. This could lead them to select the worst candidate instead. 

The fact is that returns and risks are interlinked in all investments.  You cannot increment returns without increasing the risk. Consequently, traders and investors must analyze both simultaneously.

Let’s look at the characteristics of returns vs. drawdown using a simple position sizing method applied to the trades of one year using a sound system such as our Live Signals Service. 

Let’s see first how this system behaves using just one mini-lot size, which corresponds to $1 per pip gained or lost. 

The figure corresponds to a trader having $1,000 initial capital, using a constant one micro-lot trade. To compute the maximum drawdown, we created 10,000 synthetic account paths using Monte Carlo resampling. The corresponding max drawdown distribution is shown below.

The Average Max Drawdown is 1.94 % with a very tiny possibility a 8% drawdown.

Let’s see how this system performs under increasing lot sizes:

1 mini-lot size

The corresponding drawdown curve  is shown below:

In this case, the average max drawdown goes to 11.77%. But, there is a 30% chance (about one in three) that max drawdown goes to 20%, and in about 2.5% of the occasions, the max drawdown went as high as 40%.

Let’s use now one lot

And the corresponding max drawdown curve is

In this case, the average max drawdown is 40%, but there is a 20% chance of a 65% drawdown and a 5% chance of an 85% drawdown.  40% drawdown is about the limit a usual trader can endure, but inevitably a 65% drawdown would force most traders to stop trading, even when we can see that the system is profitable.

We can see that even using a constant trading size, the drawdown grows with the position size. Of course, we can observe that the returns also grow. Furthermore, profits grow at a much higher rate than risk.  From the preceding examples, any astute observer can notice that moving from one micro-lot to one lot, 1-year returns went from $1,158 to $115,840, a 100X increment, while the drawdown moved from about 2% to 40%, a 20X increase.  

Therefore, the theory behind position sizing is aimed at optimizing both return and drawdown. Of course, there is no single solution to this problem. The solution must fit the particular psychology of the trader. 

Categories
Cryptocurrencies

Indicators DeFi Investors need To Know: Number 4 Is A must Have.

Decentralized finance (Defi) is one of the relatively new blockchain applications, and it can be confusing for newcomer investors. Be that as it may, the pace at which the space is growing leaves no time to ‘wait and see.’ DeFi is evolving crazy fast, and new metrics are being invented to help investors weigh their options. Given the novelty of the subject, there are no widely-accepted standards yet. Still, there are some common indicators that we can use to judge whether one DeFi protocol is better than the next.  

This article looks at some of the top metrics that you can use to compare DeFi protocols.

#1. Total Value Locked (TVL) 

This is perhaps the most-common indicator when it comes to evaluating DeFi protocols. TVL refers to the total of funds locked in a given protocol. An easier way to understand it is to think of it as the dollar value of all tokens held in a smart contract for a given DeFi project. 

As an investor, you can know the general interest in a particular DeFi by just looking at its TVL. It is equally useful when evaluating the market size of different projects. In crypto, TVL would be the equivalent of market capitalization. 

TVL is simple yet confusing. If a user deposits 10 BTC then borrows BTC 5 and thereafter deposits back the 5 BTC, the market would report 100 BTC. But, there have been deposits amounting to 140 BTC. That’s part of the confusion that’s associated with this metric. 

TVL was created by DeFi Pulse, the world’s leading DeFi resource. Although liquidity providers usually fund DeFi projects in crypto, TVL is measured in dollars. As pointed above, there has been confusion abounds regarding the accuracy of TVL. However, as initially mentioned, DeFi and all its metrics are still evolving. Until such a time when there will be general agreement on these indicators, TVL remains a useful metric for evaluating the investment potential of a DeFi project.

#2. Token Supply

Token supply tells investors how many tokens are ‘floating’ in an exchange. When there’s a high number of tokens floating in an exchange, token holders are likely letting go of their tokens, which creates an increase in the supply. This could be happening for the same reasons it happens in other money markets. For example, investors could be fearing that the market is getting riskier. 

A high volume of token supply could result from a whale selling off their shares in some instances. The same phenomenon could also be observed when investors use their holdings as collateral for a margin or futures trade. As such, while the token supply on exchanges can tip you off of an impending voluminous sale, it might not be as straightforward. Crypto is typically traded on centralized exchanges, although this trend is changing in favor of decentralized exchanges. The advantage of centralized exchanges is that they are usually able to maintain stronger liquidity. 

#3. Changes in Token Balances

Tracking token supply on exchanges is a savvy move. And as a trader, you can complement this by finding out how balances are changing. Volume tracking is a bit static and does not accurately picture a market’s current financial trend. Evaluating the changes in token balances will likely give you a better picture of what is happening.

Typically, a large change in token balances tells you that the market is currently volatile. For example, if large holders are accruing tokens, you might notice large withdrawals from exchanges. As is the case with the other metrics discussed above, treat this only as a guide.

#4. Unique Address Count

Unique address count is the number of addresses that are holding a given token. A high number of addresses likely means that there is a high number of users on that market. By contrast, if you only see a relatively small number of addresses, it could be that the DeFi protocol has yet to gain widespread adoption. 

Since the number of unique addresses is a static metric, it would be more meaningful to track the new addresses’ rate. This will give you a better picture of how fast users are joining the DeFi protocol. And just like how it works with bull runs in the money markets, the best time to join is when the adoption rate is high. This is the time when you would typically expect the fastest growth in your investment.

Beware, though: one user could create multiple addresses and distribute their tokens to all of them. Therefore, this indicator should also be used merely as a guide, and better yet, be used in combination with other indicators.

#5. Inflation

Inflation is the rate at which new tokens are being pumped into the ecosystem – just like with economic inflation. Usually, limited supply alludes to the rarity of tokens and hence a higher value. If new tokens are being minted easily and fast, existing ones will be devalued at the same rate. 

However, it’s advisable to approach this indicator with some caution. In economics, rising inflation encourages people to spend and thus promotes economic growth. The same phenomenon can be observed in DeFi, where an increasing supply of tokens can boost investor sentiment and actually result in bullish activity. In the same way, limited supply could only be temporary. Thus, it would be best if you did not conflate token scarcity with value. 

#6.Price-to-Sales Ratio

The price-to-sales ratio (P/S ratio) is used to assess whether an asset is undervalued or overvalued. In traditional finance, this ratio is obtained by dividing a company’s revenue by its stock price. In DeFi, it’s calculated by dividing the protocol’s market capitalization by its revenue. Generally, a relatively high value means that the DeFi project could be overvalued. 

#7. Non-Speculative Usage

Non-speculative usage refers to the usefulness of a token beyond mere hype. When you’re evaluating a token’s value, it is important to check whether there is a solid project behind the token. It might be difficult to track whether token purchases are based on speculation or people are actually buying them for specific uses. 

Final Thoughts

DeFi is a fast-rising financial tech that promises investors new and exciting opportunities. As a DeFi investor, it helps to be able to analyze and compare different protocols. The above indicators can steer investors in the right direction when it comes to evaluating different DeFi options. Always analyze each DeFi protocol by its merits or lack of them, and most importantly, do your own research.

Categories
Forex Elliott Wave Forex Market Analysis

EURUSD: is 1.22 at Hand?

The EURUSD pair advances in the extreme bullish sentiment range, consolidating the short-term rally that started on November 04th when the price found fresh buyers at 1.15615.

Technical Overview

The following 8-hour chart shows the short-term participants’ sentiment keeps pushing higher the price action. In this view, the common currency looks to consolidate the pair’s impulsive movement that began in early November.

In this chart, we can see that the current primary trend is clearly bullish. Simultaneously, the accelerated trendline identified with the green line shows the short-term bull market remains intact.

On the other hand, both the intraday sideways channel and the retracement observed in the EMA(60) to Close Index lead to a consolidation of the rally experienced by the common currency during the previous trading sessions.

Therefore, if the price action penetrates below 1.20338, the likelihood of a reversal movement in the EURUSD increases.

Short-term Technical Outlook

The short-term Elliott Wave view for the EURUSD pair unfolded in the next 4-hour chart reveals the advance in an incomplete bullish impulsive wave of Minor degree identified in green.

The EURUSD 4-hour chart illustrates the impulsive rally that began on November 04th when the price found fresh buyers at 1.16025. The price action currently looks to have completed its third wave of Minute degree labeled in black, confirmed by the broadest distance shown on the MACD oscillator

On the other hand, the consolidation structure in progress reveals the potential sideways advance of its fourth wave. Considering the Elliott Wave Principle, the fourth wave shouldn’t penetrate below the invalidation level located at 1.19201, which corresponds to the end of wave ((i)) in black.

Also, considering both the second wave, which looks like a simple corrective pattern, and the alternation principle on corrective waves, the fourth wave should be a complex correction. In this context, the fourth wave could be a triangle or a combination of simple waves grouped in a double-three or a triple-three formation.

Finally, the extension in terms of time should indicate the exhaustion of the bullish pressure; thus, the common currency could soon end its bullish cycle.

Categories
Crypto Videos

Asset Mangers Being Left Behind By Not Understanding The Fastest Growing Asset Ever… Bitcoin!


Asset Managers Risk Their Careers by Not Understanding Bitcoin

Shapeshift CEO Erik Voorhees has spoken about the future of financial management in the future, stating that every asset manager should, even now, have an understanding of Bitcoin based on its astonishing rate of return.

Voorhees commented on this topic while retweeting data shared by analytics platform Messari co-founder Dan McArdle that shows Bitcoin dramatically outperforming every other asset over the last decade. 


While gold has made a return of 32% and the S&P 500 has tripled its investors’ money, Bitcoin has posted an astonishing 7,837,884% gain in ten years.

Looking at its 10-year life, Voorhees believes that Bitcoin is “vastly superior to any other investment.” He then stated that:

“One could be forgiven for not understanding Bitcoin eight years ago… but any asset manager today who remains even somewhat ignorant of this phenomenon needs to seriously check what they are doing.”

Voorhees is not the only one talking about the recent embrace of Bitcoin by institutions and the rest of traditional finance that is believed to underpin the most recent rally. Just the past week alone, half a dozen experts in the traditional finance sector made similarly bullish observations. On December 2, crypto trading firm Genesis CEO Michael Moro made a prediction that 250 publicly traded companies will put at least some of their funds in Bitcoin by the end of 2021.

On December 4, former JP Morgan commodity trader Danny Masters told CNBC that it would soon be a “career-risk to not have Bitcoin in your portfolio.”

BlackRock CIO Larry Fink also spoke about Bitcoin and warned that Bitcoin’s success could have a substantial impact on the US dollar and that it will even “take the place of gold to a large extent.” 

Of course, every asset has its bulls and bears, and no matter how many pundits back Bitcoin, or how many institutions put their money into it, gold bug Peter Schiff still remains unmoved, stating that Bitcoin and gold have nothing in common and that Bitcoin will never replace gold.

Categories
Forex Elliott Wave Forex Market Analysis

GBPAUD Consolidates in an Incomplete Correction

The GBPAUD cross continues consolidating in what is a corrective formation that continues in development since October 22nd when the price found fresh sellers on 1.85272. In this context, the current consolidation pattern suggests a coming rally in the following trading weeks.

Technical Overview

The next 12-hour chart illustrates the short-term market participants’ sentiment displaying the 90-day high and low range, which bounced in the bearish sentiment zone finding resistance in the neutral level of 1.80104, where the cross is still moving in the current trading session. However, as long as the GBPAUD cross doesn’t surpass and closes above the level of 1.80104, the bias will stay mostly bearish.

The primary trend identified in blue shows that the current uptrend remains in its formation process. In this context, the corrective movement in progress represents a secondary trend from the last upward move that carried the cross from 1.74935 to 1.85272.

Short-term Technical Outlook

The short-term Elliott wave view for the GBPAUD cross shown in the following 4-hour chart reveals the downward advance in an incomplete double-three pattern of Minute degree labeled in black, which suggests further declines for the following trading sessions.

The previous chart shows the GBPAUD developing a double three pattern. According to the textbook, this complex corrective formation follows an internal sequence subdivided into 3-3-3, where each three corresponds to a basic corrective structure.

Currently, the cross looks advancing in its wave (c) of Minuette degree labeled in blue, which belongs to the wave ((y)) of Minute degree identified in black. The movement developed until now fits two potential scenarios:

  • The first scenario considers the pause in the wave (c), which could see further declines to the demand zone between 1.7774 and 1.7716. The cross could even extend its drops until 1.7610 and 1.7554, where the price could find fresh buyers expecting a boost in its price to new highs.
  • The second occurs if the price ends its wave (c) in blue and rally toward fresh highs. In this context, the cross should confirm the breakout of the supply zone resistance at 1.8041. Also, the cross must break up the ((x))-(b) trend-line.

Finally, the invalidation level for this bearish sequence in progress can be found at the end of wave (b) in blue at 1.82144.

Categories
Forex Basic Strategies

Ever Heard Of The Andrew’s Pitchfork Forex Trading Strategy?

Introduction

Pitchfork is a technical indicator developed by Alan Andrews. This indicator consists of three parallel lines- These three lines help us identify the possible support and resistance levels. They also do help us in recognizing potential breakout and breakdown levels. With this, we can identify possible trading opportunities in the Forex market. Long term investors use this indicator to identify and gauge the overall cycles that affect the activity of the underlying currency pair.

Three lines of Andrew’s pitchfork tool are as follows. The first one is the median trend line in the center, and the two equidistant trend lines on each side. Moving from left to right of the chart, these lines are drawn by selecting the three points, which are usually a reaction of highs and lows. As long as price action holds inside the Andrew pitchfork tool, it indicates that the trend is in place. Reversals occur when the price breaks the pitchfork.

Andrew’s pitchfork indicator can be used on all the timeframes, and it works on every single chart. Note that this indicator works very well on all types of securities, such as stocks, cryptocurrencies, futures, or the Forex market.

Picking The Three Points

The first step to know before using Andrew’s pitchfork tool is to select the three points for drawing the trend lines. The first point that we chose must be either a high or low that occurs on the price chart. Once that point is chosen, we must identify the trough and peak to the right and left sides of this point. This must be a pullback, which is opposite in the direction of the ongoing trend. Once these points have been isolated, the indicator is placed on the price chart. The two prongs formed by the peak and trough serves as a support and resistance of the trend as shown below.

Trading Strategies Using The Andrew Pitchfork Tool

Mini Median Method

This one is the most basic and popular strategy used by the traders to trade the market using the Pitchfork indicator. We must place the Andrew Pitchfork tool in a strong ongoing trend and look for the buy/sell opportunities.

In the below image, we marked a few trading opportunities presented by this indicator.  We can see that when the price hits the lower line of the tool, we went long. Likewise, we have activated sell trades when the price action hits the median line. This strategy is basic, but it provides a good risk to reward ratio trades in a strong trending market.

In case of a buy entry, exit your position when the price hits the median line. Conversely, take sell when price reverses at the median line, and we can book our profit at the lower line. Place the stop loss a few pips above your entry and ride the move.

This approach works best for aggressive traders who prefer to pull the trigger when prices reach any significant level. So, if you are an aggressive trader, you can go with this approach. But if you are a conservative/confirmation trader, follow the next strategy.

For Conservative Traders

Most conservative traders do not prefer taking many trades in a single day because they tend to seek extra confirmation before pulling the trigger. This Pitchfork strategy is for them.

When the price action approaches the lower line of the indicator, wait for the price action to hold there to take entry. The holding confirms that the price action respects the dynamic support line, and going long from here will be a good idea.

As you can see in the below price-chart, the USDJPY was in a strong uptrend. We have identified three opportunities to go long, but out of three, only two trades were held at the lower support line to confirm the entry. Both of our trades worked very well, and they went on to make a brand-new higher high.

By using this approach, we can safely trade the market. We must always go for smaller stops because the holding at any significant area confirms the power of buyers.

Breakout Trading

Breakout trading is a popular way to trade the markets. Most of the highly successful traders, market technicians, chartists, banks, hedge fund managers use this approach to trade the Forex market. In this strategy, let’s understand trading the breakouts successfully by using the Andrew Pitchfork tool.

The idea is to find a strong trending market first and wait for the price to pullback. When the price gives enough pullback, place the Andrew pitchfork tool on price action and wait for the breakout in the ongoing trend direction. When the breakout happens, take the trade in the direction of the ongoing trend.

As you can see in the below image, the USDJPY was in an uptrend, giving quite deeper pullbacks. When we got enough pullback, we applied the tool on the price action, and when the breakout happened, we went long. Look for the breakouts only in the direction of the ongoing trend.

The chart below represents our buy entry and risk management in this pair. We went long when the breakout happened, and the stop-loss order was placed just below the breakout line.

There are several ways to book our profits. We can use indicators like RSI and Stochastic to confirm our exits. Here we have used the pitchfork itself to book our profit in the above-discussed trade. When we activate a trade at the breakout, the first thing we must do is to apply the Andrew Pitchfork tool in the direction of our trade and wait for the price action to break the tool to book the profits.

In the below image, we applied the tool when our trade took off, and at around 109.60, the price strongly broke the Andrew pitchfork tool. This is an indication for us to close our whole buying position. Also, you can notice that after our exit, the price action blasted to the south.

Conclusion

Just like other trading tools, Andrew pitchfork is not perfect. We need to have strong knowledge of the money management techniques in place before using this tool on live markets. If you are a novice trader, it is advisable to gain experience by experimenting with this tool on the demo account. Using this tool first hand, we are sure that you will discover various ways of using this tool. This will enhance your ability to understand the market better. Cheers!

Categories
Crypto Videos

Michael Saylor Comparing Bitcoin To Lebron James? Institutional Investment Skyrocketing!


Bitcoin is like ‘Lebron James’ – MicroStrategy CEO Michael Saylor


In an interview with economist Marc Friedrich, CEO of MicroStrategy, Michael Saylor said that Bitcoin is just not the same asset it was in 2015 or 2017. As Saylor stated, the arguments against Bitcoin that were relevant two or four years ago are simply no longer applicable.

Bitcoin has grown exponentially since its peak in 2017. The growth happened in terms of infrastructure, fundamentals, as well as adoption. In the past year alone, many institutions have started to increasingly see Bitcoin as a store of value and an inflation hedge rather than as a speculative asset.

In 2017, Bitcoin critics said the cryptocurrency was too volatile and that there was a substantial risk of it dropping to zero. Saylor emphasized that these arguments have close to no relevance now because Bitcoin has evolved significantly in recent years.

Saylor said that Lebron James played basketball from ages 8 to 18, but then matured and evolved into one of the all-time greats. He said that Bitcoin went through a very similar period, stating that he thought that it was important to address the fears and anxieties of the crypto and non-crypto community head-on, but that people that still think that Bitcoin might go to zero are still living in the 2015 and 2017 timeframe. He compared Lebron James’ talent, which was, according to him, erratic and volatile in the early stages of his gameplay. But then he grew up and “destroyed everybody and everything in his way.”


One of the major changes Bitcoin has experienced since 2017 is its market structure. Going back to 2017, retail platforms like BitMEX were the dominant players in the derivatives market. Institutional platforms such as the CME have consistently processed volumes that were similar to leading retail-focused exchanges.

However, as of December 4, the CME Bitcoin futures market has an open interest of $1.14 billion, which is considerably higher than Binance Futures, Bybit, Huobi, as well as BitMEX.

On-chain data also shows a considerable increase in institutional interest. According to data coming from IntoTheBlock, the number of transactions valued at over $100,000 has increased twofold in 2020. This is indicative of the growth in institutional activity, the analysts stated. Furthermore, the total volume transferred in these transactions has experienced an even larger growth with 6x increase over the same period.”

Based on various factors, including the fact that the already-significant institutional involvement in the Bitcoin market is only increasing, investors like Saylor remain confident that Bitcoin is evolving into an established store of value.

Categories
Crypto Daily Topic Forex Daily Topic Position-sizing Guide

Forex Academy’s Guide to Position Size

After completing our series on position size, we would like to summarize what we have learned and make conclusions.

Starting this video series, we have understood that position size is the most crucial factor in trading. On Position Size: The most crucial factor in trading, we learned that deciding the position’s size is not intuitive. In an experiment made by Ralf Vince using forty PHDs with a system with 60 percent winners, only two ended up making money. Thus, if even PHDs couldn’t making money on a profitable strategy, Why do you think you’re going to do it right? You need to follow a set of rules not to fool yourself.

The Golden rules of trading

The trading environment seems simple, but it’s tough. You have total freedom to choose entries, exits, and the size of your trade. Some brokers even offer you up to 500x leverage. But you’re not free from yourself and your psychological weakness, Therefore, you need to set up a set of rules to stop the market to play with you. In “The golden rules of Forex trading” III, and III, we propose specific rules it is advisable to follow to succeed in trading. These include never open a position without knowing your dollar risk, defining your profits in terms of reward/risk factors, and limit your losses to less than 1R, a risk unit. We also advise to keep a record of trades and identify your strategy’s basic stats: Average profit, the standard deviation of the profits, and drawdown.

The dark side of the trade

In our video, The Dark Side of Trade, we explain the relation between position size, results, and drawdown, showing that position size plays a vital role in both aspects. In the video, We show that while results grow geometrically ( 100x), drawdown increase arithmetically, 10X. But the lesson here is that the size of the position must be chosen with the drawdown in mind. That is, we should choose a position size so that the max drawdown could be limited to a desirable size. 

The Gamblers Fallacy 

on Position Size – The Gamblers Fallacy, we explain why it is wise to consider position sizing independently of the previous results. We explain that a new trading result does not usually depend on prior results; thus, modulating the trade size, such as do Martingale systems, is not only useless but dangerous because winning or losing streak ends are unpredictable.

The Advantage!

Even when most retail traders don’t realize it, the “how much” question is the advantage or critical factor to achieve your trading goals because the size of the position defines both the trading results and the risk, or max drawdown, in your trading portfolio. We mention in Position Sizing III- The Advantage that in 1991 the Financial Analyst Journal published a study on the performance of 82 portfolio managers over a 10-year period. The conclusion was that 90% of their portfolio differences were due to “asset allocation,” a nice word for “investment size.”

In this article, we also presented the simplified MCP model to compute the right lots to trade as:

M = C/P, where M is the number of lots, C is the (Cash at) Risk, and P is the Pip distance from entry to stop-loss. The cash will depend on the percent you’re willing to risk and the cash available in your trading account. 

Equity Calculation Models

In our next video of this series, Position Size IV – Equity Calculation Models, We explain several models to calculate several simultaneous positions: 

  • The Core Supply Model, in which you determine the nest trade’s size using the remaining cash as the basis for computing C.  
  • The Balanced Total Supply Model, in which C is determined by the remaining cash plus all the profits secured by a stop-loss.
  • The Total Supply Model, in which the available cash is computed by adding all open position’s gains and losses plus the remaining cash.
  • The Boosted Supply Model uses two pockets: the Conservative Money Pocket and the Boosted Monet Pocket. 

The Percent Risk Model

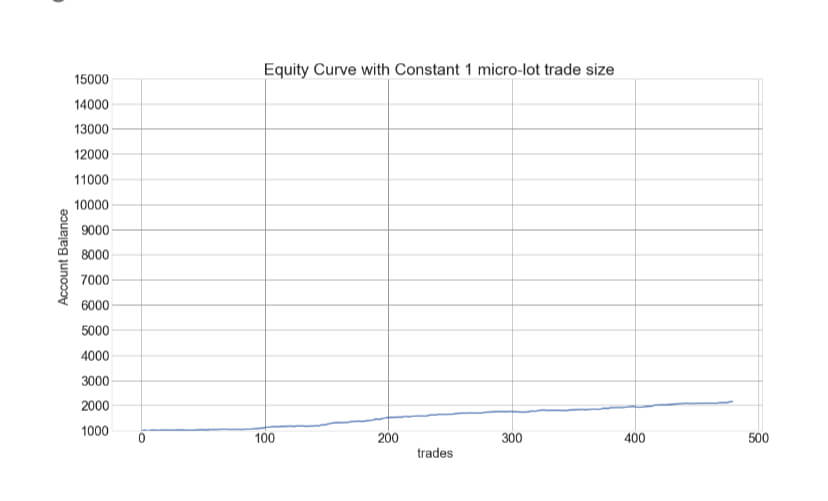
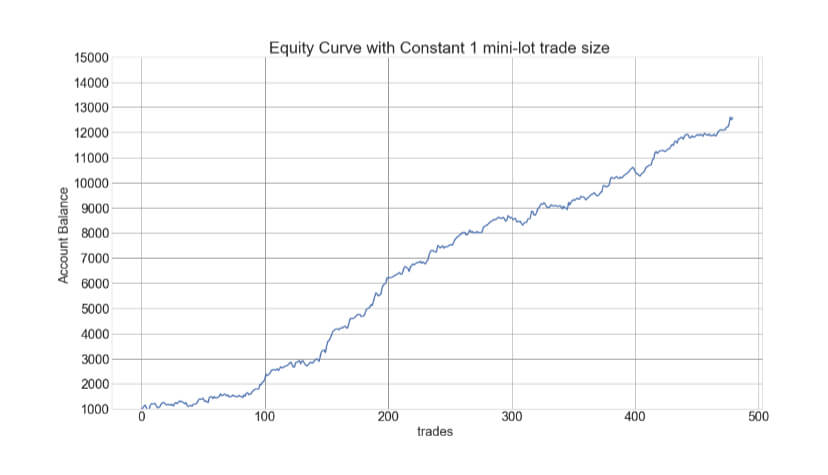
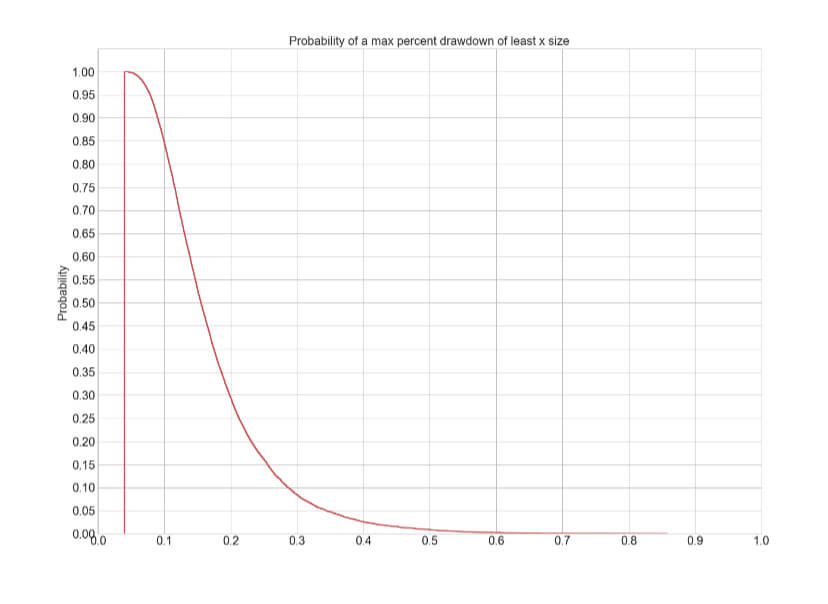
The Percent Risk Mode is the basic position sizing model, barring the constant size model. on Position Sizing Part 5, we analyze how various equity curves arise when using different percent risk sizes and how drawdown changes with risk. Finally, we presented an example using 2.5 percent risk for an average max drawdown of 21 percent.

The Kelly Criterion

Our next station is  The Kelly Criterion. The linked article explains how the Kelly Criterion is used to find the optimal bet amount to achieve maximal growth, based on the winner’s percentage and the Reward/risk ratio. The Kelly criterion was meant for constant reward bets, and as such, it cannot be used in trading, but it tells us the limit above which the size of the position increases the risk while decreases the profits. We should be aware of that limit considering that most retail Forex traders trade beyond it and blow out their accounts miserably.

Optimal fixed fraction trading

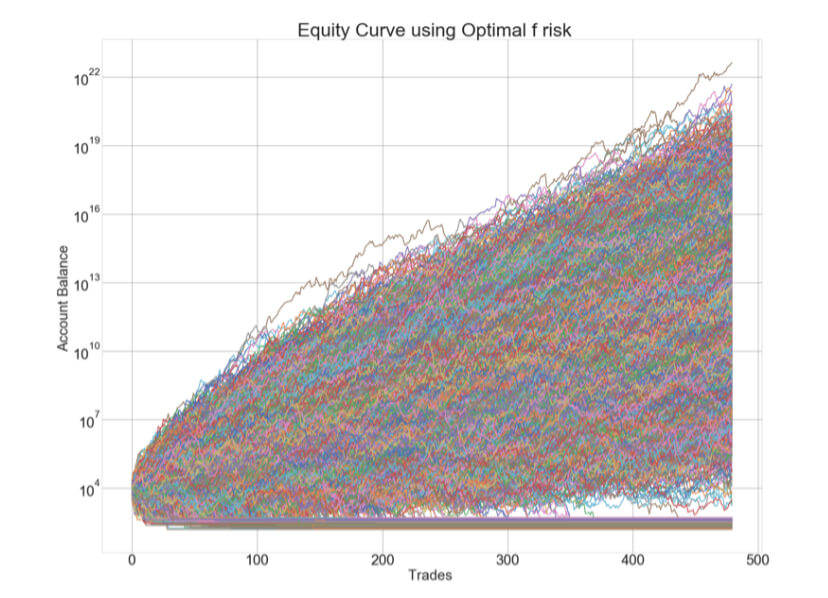
Optimal fixed fraction trading, Optimal f for short, is the adaptation of the Kelly criterion to the financial markets. The optimal f methodology was developed by Ralf Vince. In Position Size VII: Optimal Fixed Fraction Trading, we explain the method and give the Python code to find the Optimal fraction of a stream of trading results. The key idea behind the code is that the optimal fraction is the one that generates the maximal growth factor on a set of trades. That is, Opt F delivers the maximal geometric mean of the trading results.

Optimal f properties

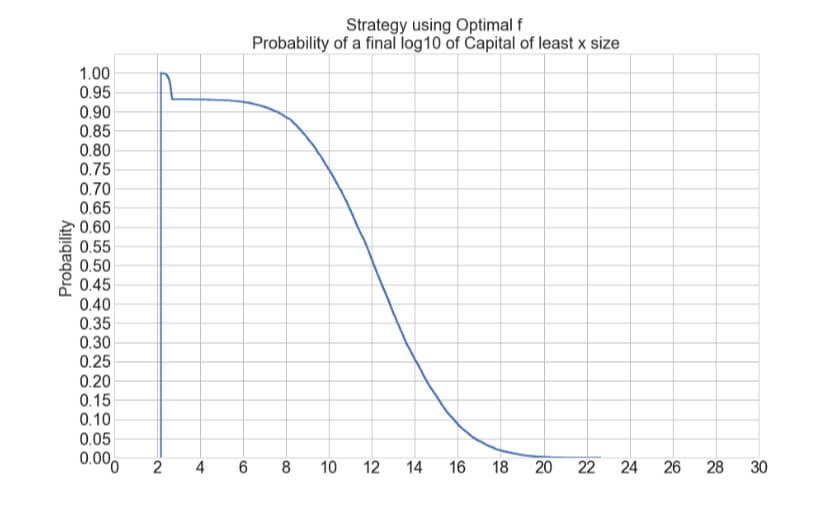
But nothing in life seems easy. Optimal f has dark corners that we should be aware of. In Position size VIII – Optimal F Revisited, we analyze the properties of this positioning methodology. We understood that, due to the trading results’ random nature, we should find a safer way to find the optimal fraction to trade. This article presented a safer way to compute it using Monte Carlo resampling and take the minimum value as optimal f. This way, the risk of ruin is minimized while preserving the strong growth factor Opt f provides.

Market’s money

Traders define their recent trading gains as “market’s money. A clever way to profit from the usual winning streaks is to use the market’s money to increase the position size in a planned manner. In Position Sizing IX: Improving the Percent Risk Model-Playing with market’s money,

we present the N-Step Up position sizing strategy, an innovative algorithm that adds the gains obtained in previous trades to boost the profits. This way, it could increase the profitability by 10X with a max drawdown increase of roughly 2.8X, from 8.02% to 22.5%. This article analyzes four models: one, two, and three steps with 100% reinvestment and three steps with 50% reinvestment.

Scaling in and out

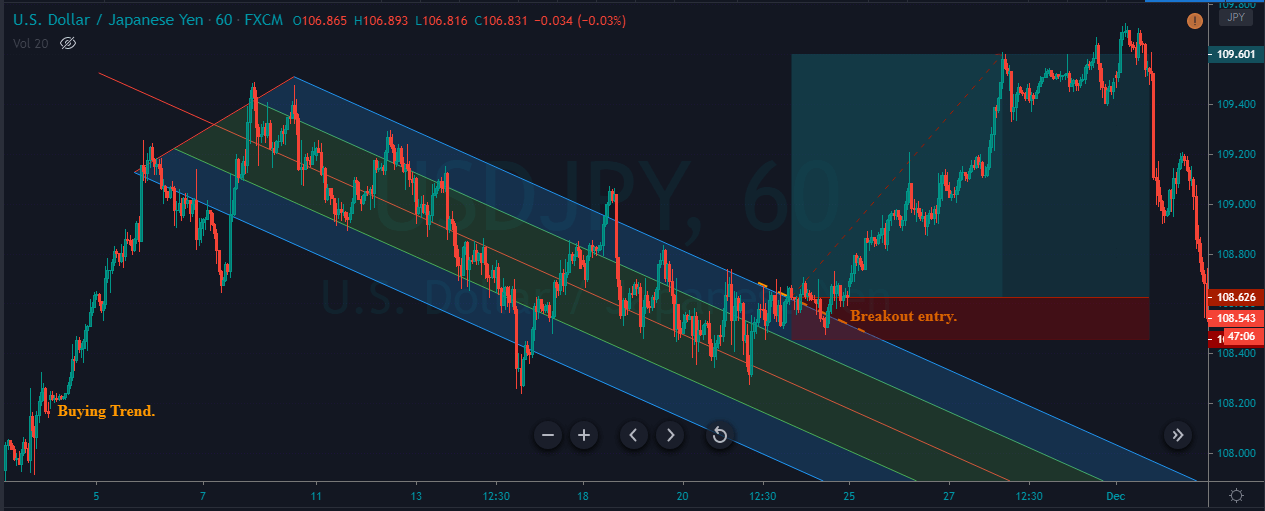
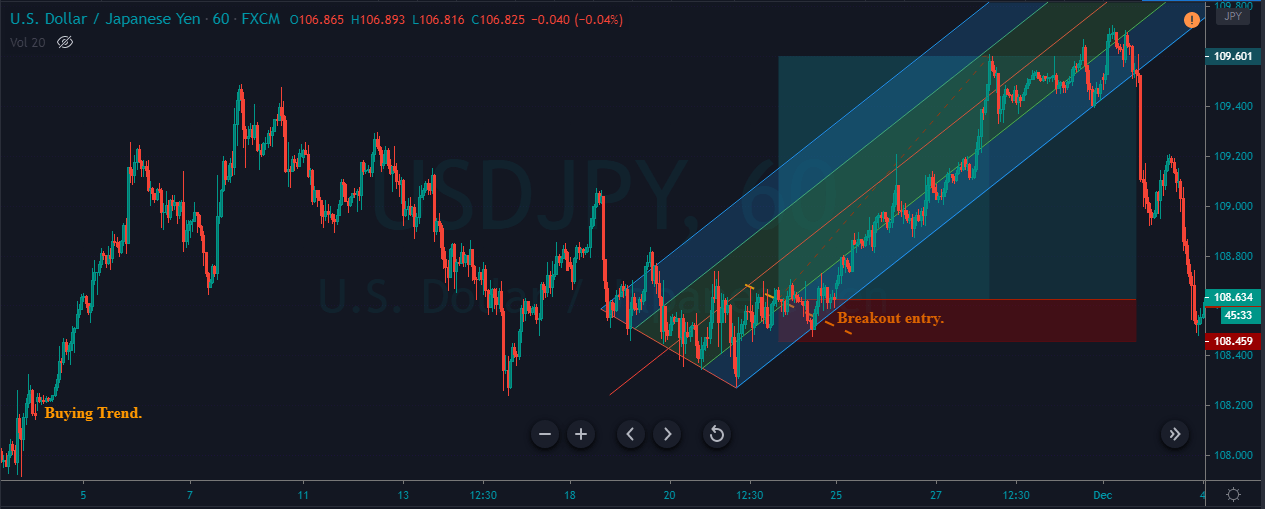
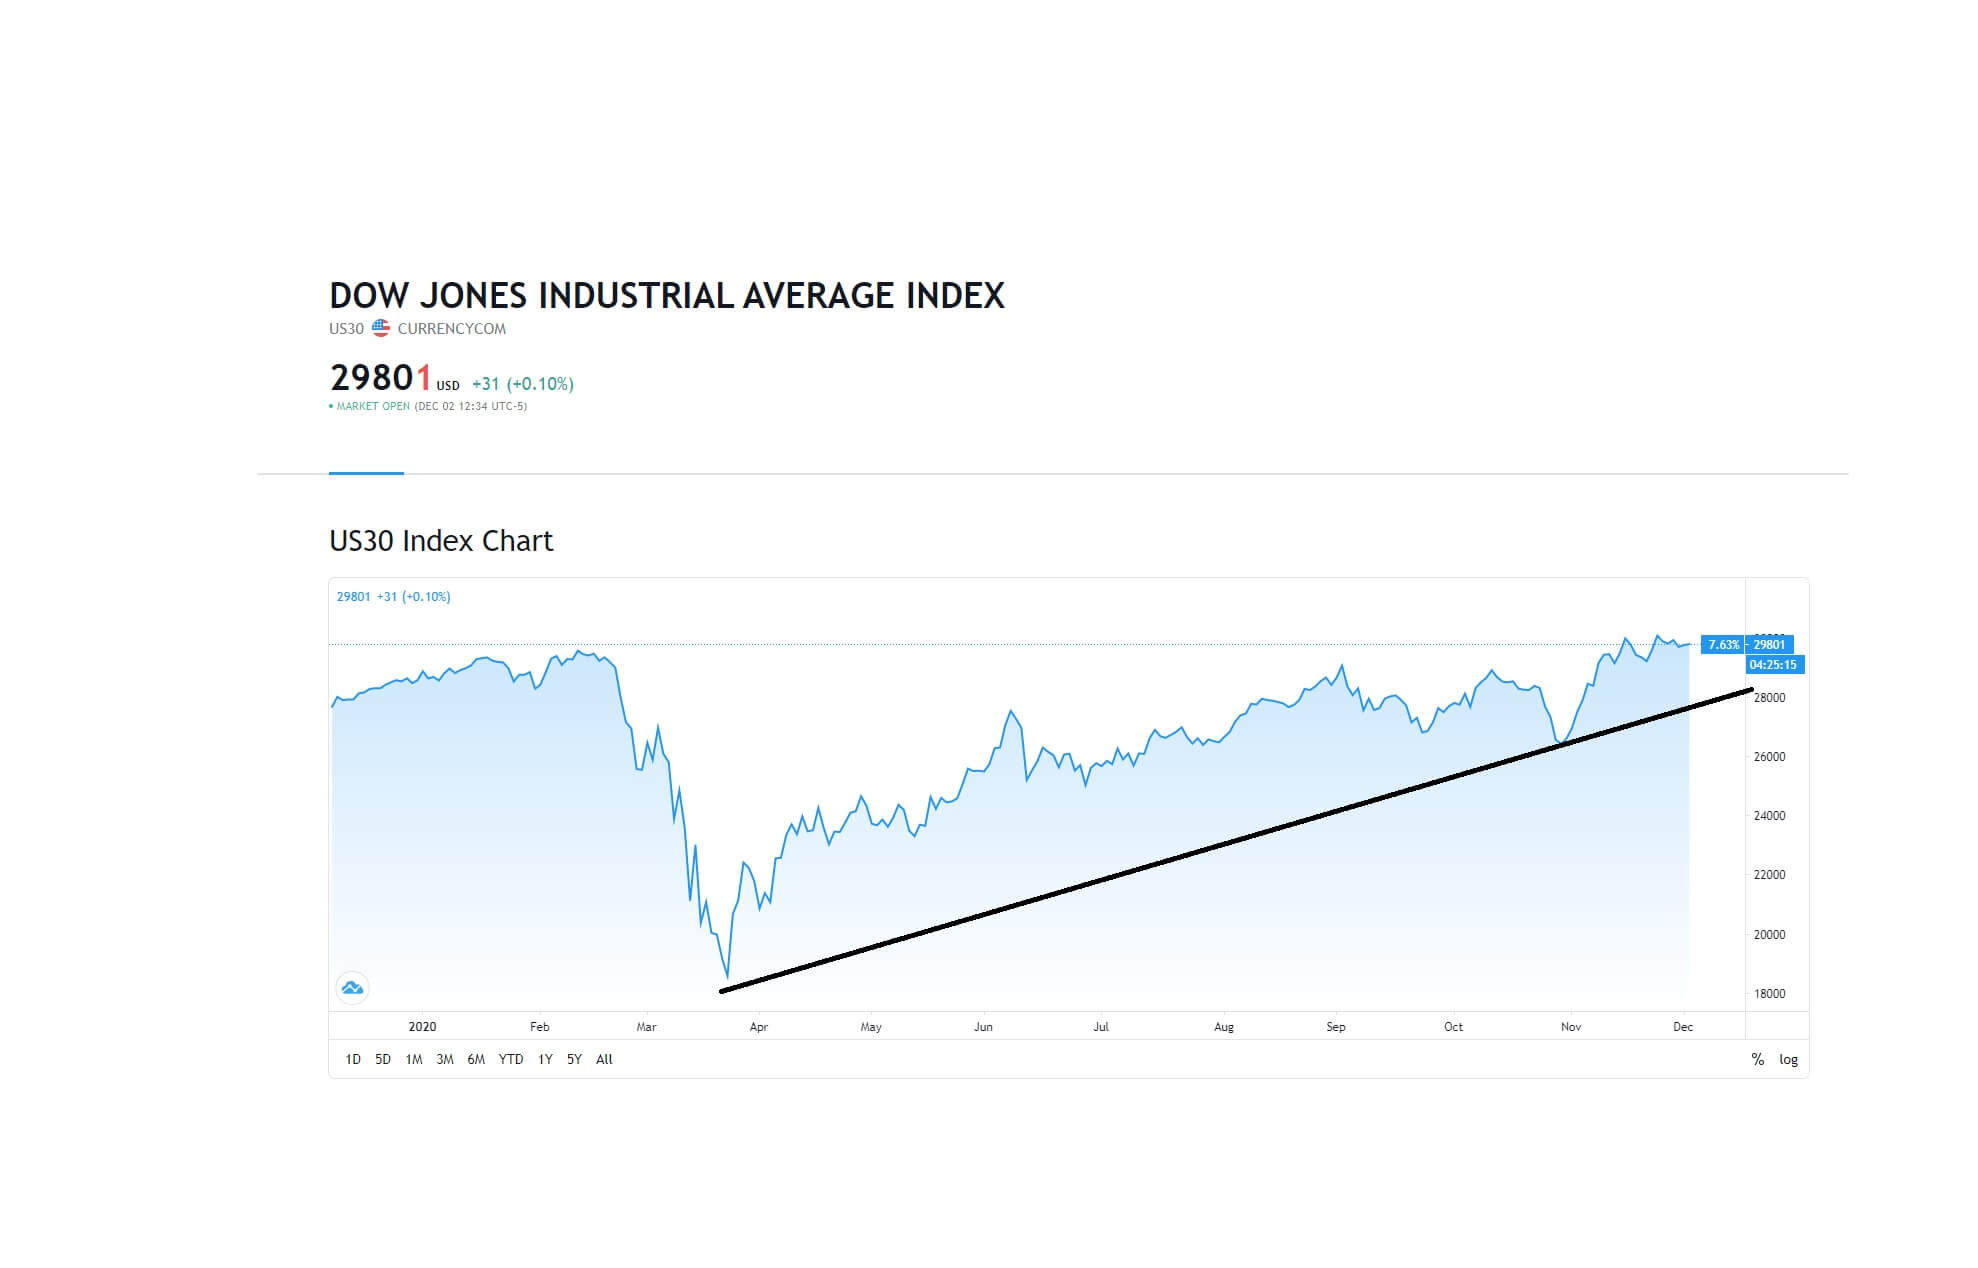
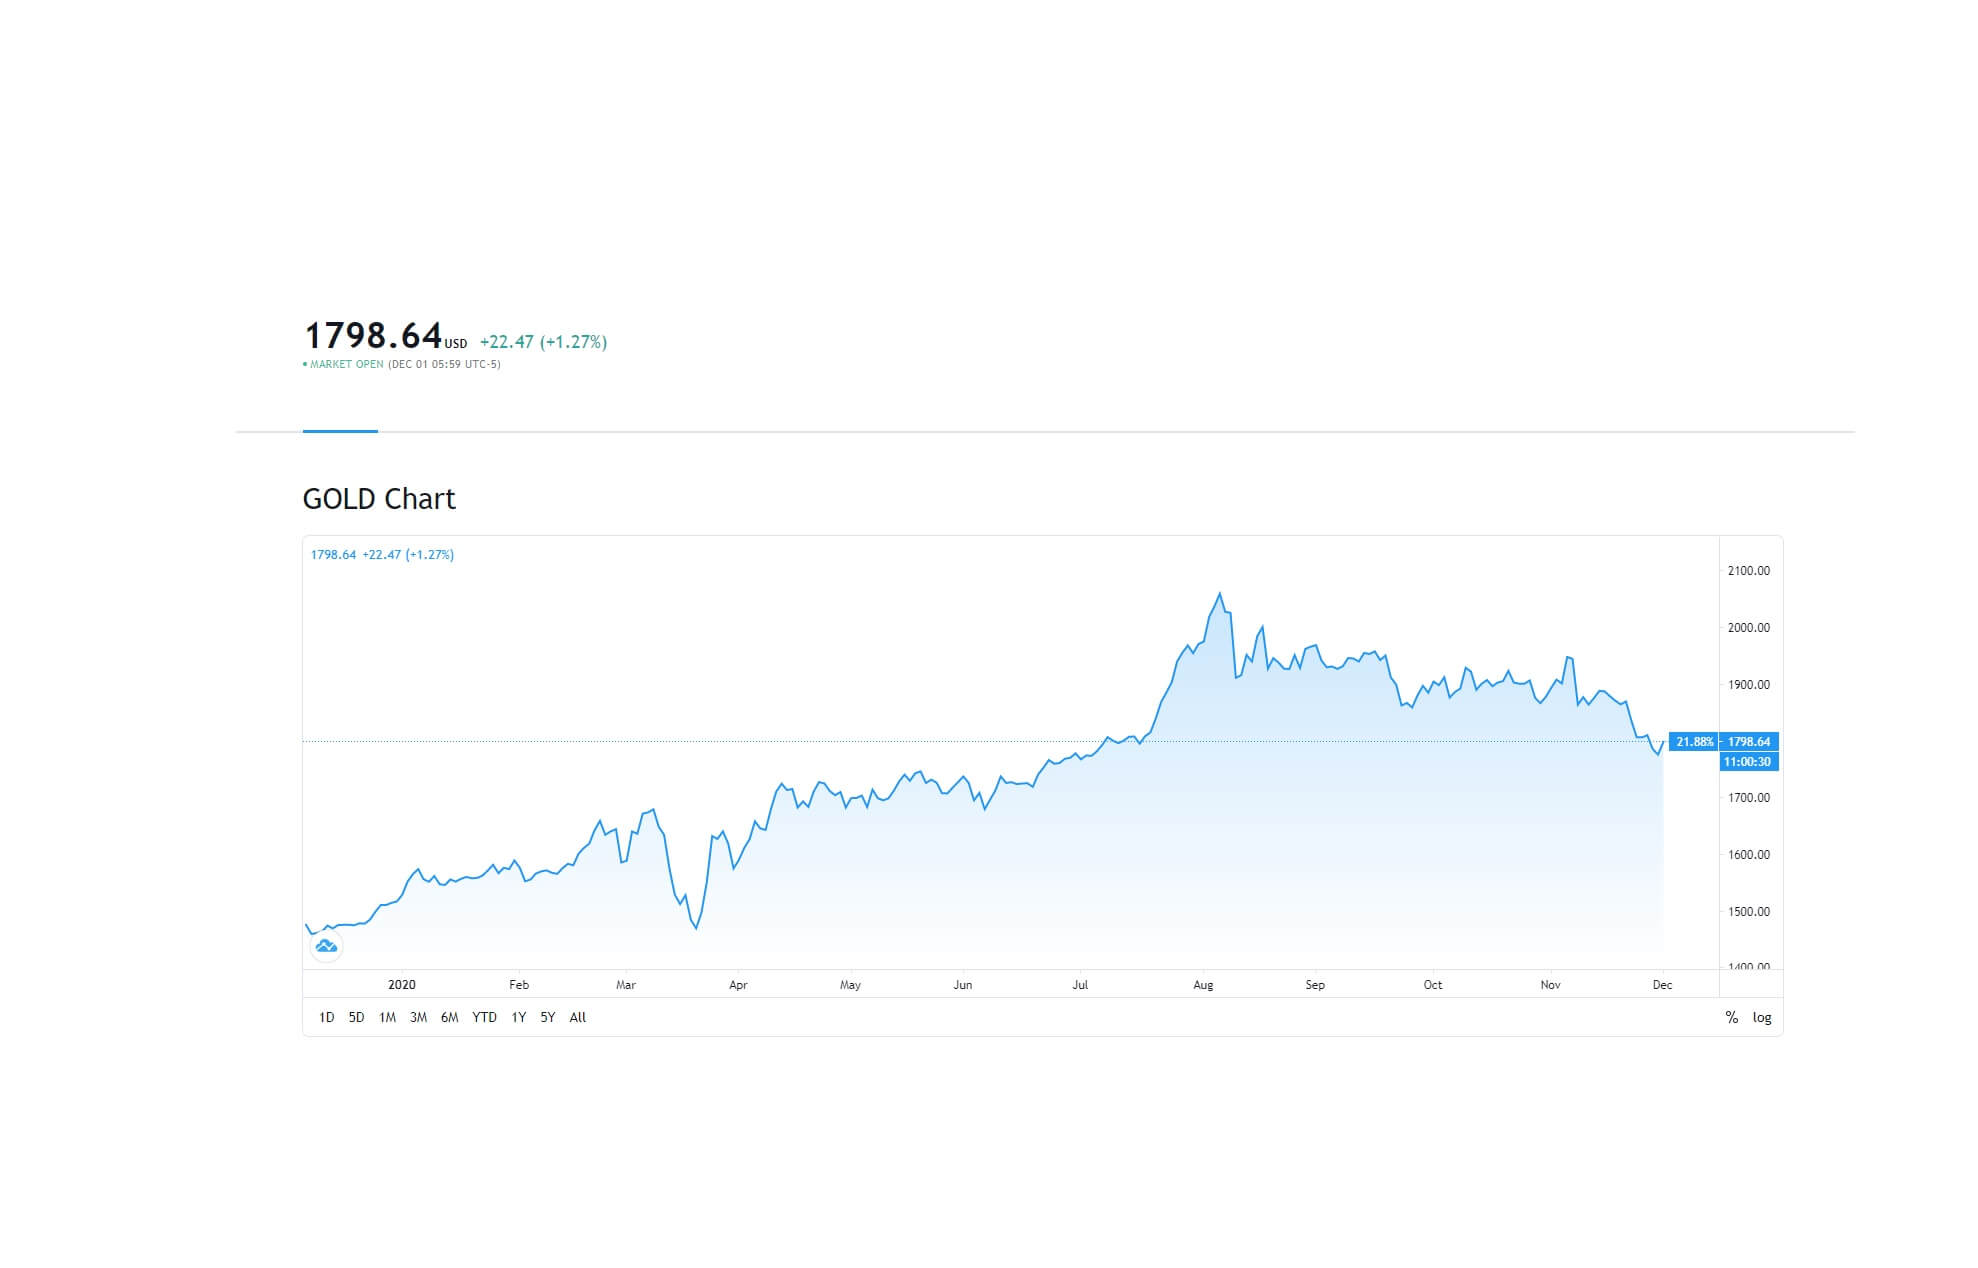
Our next section, Position sizing X: Scaling-in and scaling-out techniques, is dedicated to scaling in and out methods. Scaling in and out are techniques to increase the position size while maintaining the risk at bay. They work best with trending markets, for instance, the current crypto and gold markets. The main idea is to use the market’s money to add to our current position while trailing our stops. 

System Quality and Max Position Size

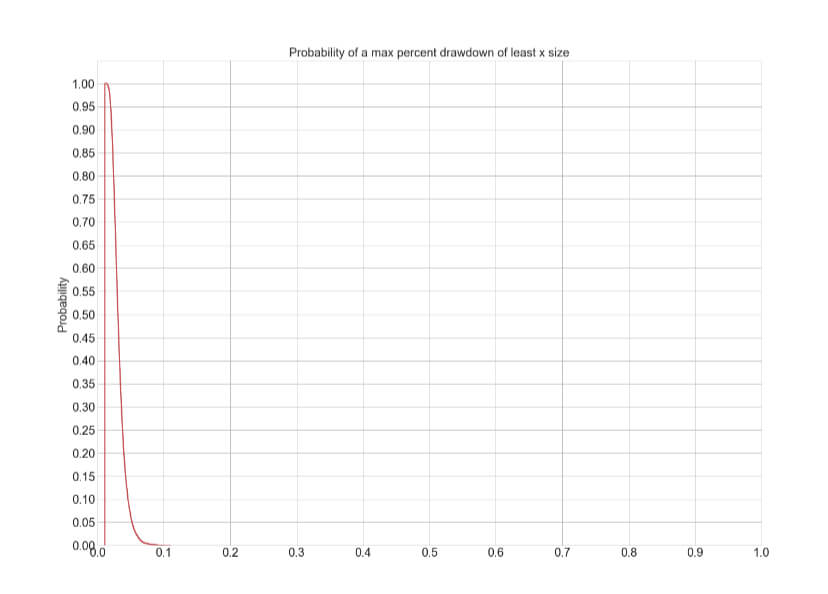
System quality has a profound influence over the risk, and, hence, over the maximum position size, a trader can take. In Position Sizing XI- System Quality and Max Position Size Part I and part II, we presented a study on how the trading strategy’s quality influences the maximum position size a trader should take. To accomplish this, we created nine systems with the same percentage of winners, 50 percent. We used Van K Tharp SQN formula to compute their quality and adjusted the reward to risk on each system to create nine variations with SQN from 1 to 5 in 0.5 steps. 

Then, since traders have different risk limits, we defined as ruin, a max drawdown below ten preset levels from 5 to 50 in 5-step.   

 Our procedure was to create a Monte Carlo resampling of the synthetic results, which simulated 10 thousand years of trading history on each system.  

Since a trading strategy or system is a mix between the trading logic and the trader’s discipline and experience, we can estimate that the overall outcome results from the interaction of the logic and the treader. Thus, we can accurately associate a lower SQN with lowing experienced traders and higher SQN to more professional traders. The study’s concussions suggest a limit of 0.5 percent risk on newbies, whereas more experienced traders could boost their trading risk to an overall 4.5%.

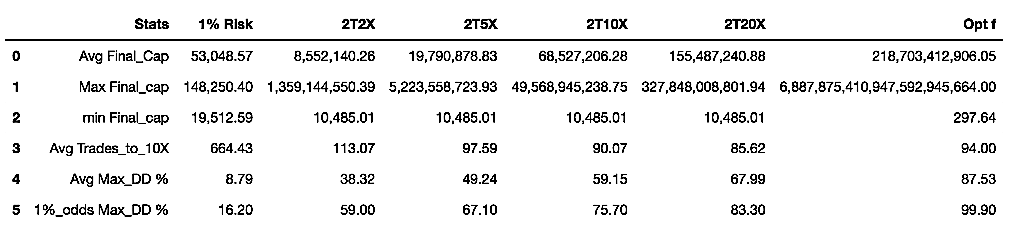
Two-tier Optimal f Positioning

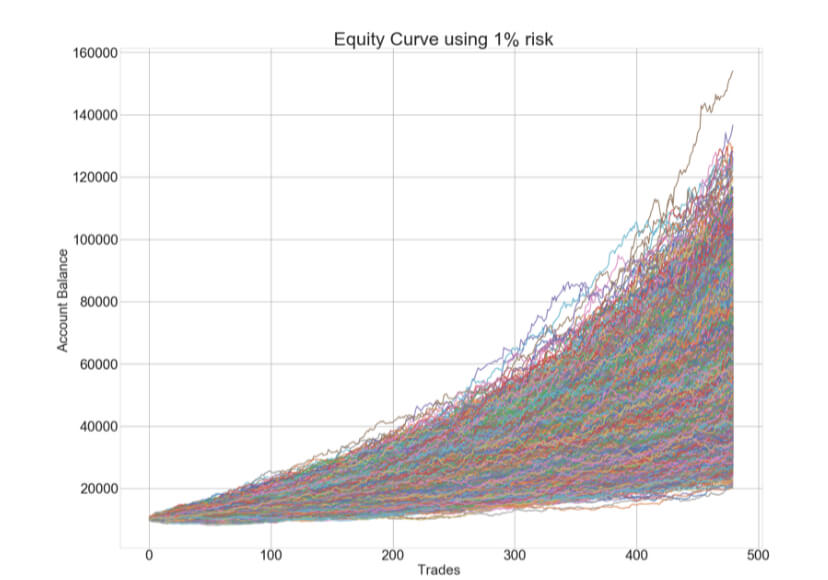
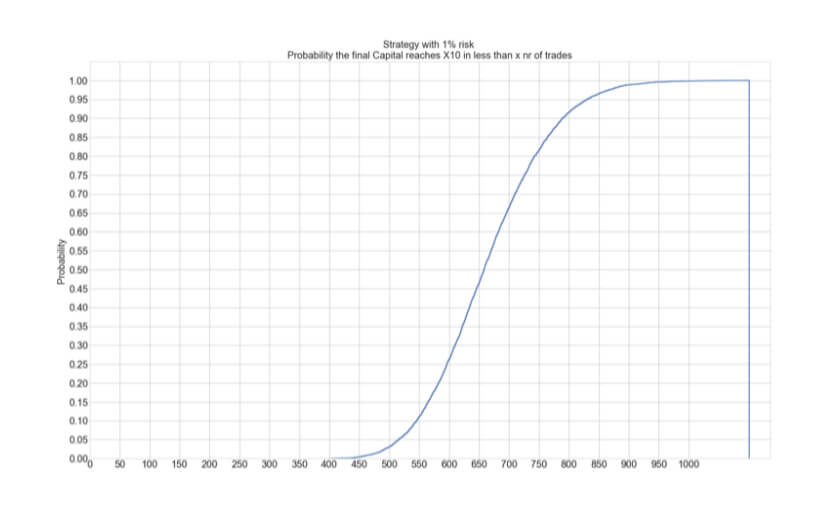
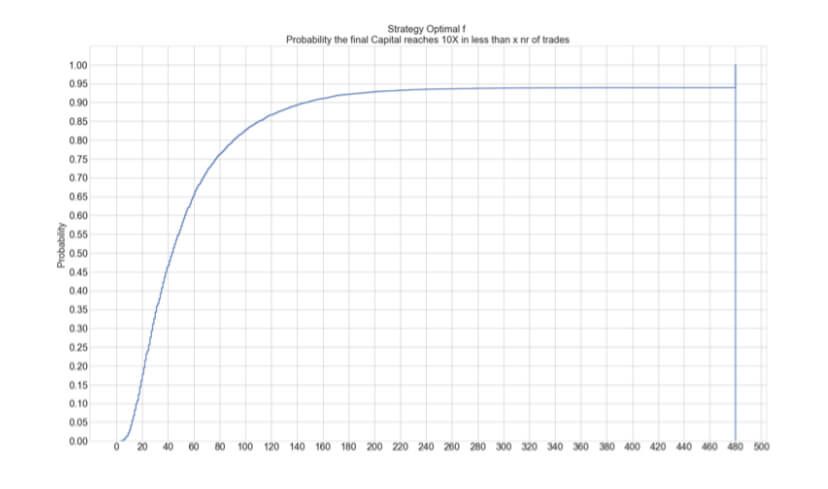
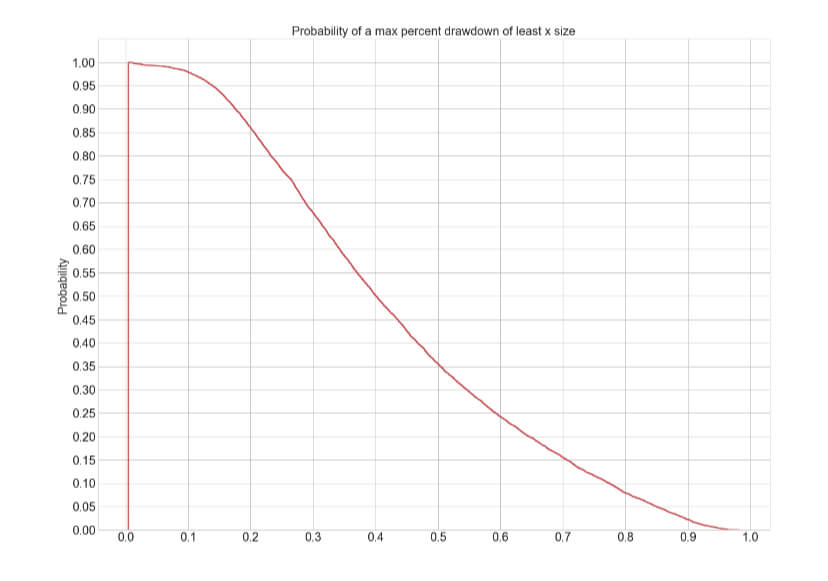
After this journey, we have understood that Using Ralf Vince’s optimal f position sizing method means maximally growing a portfolio. Still, the risk of a 95% drawdown makes it unbearable for any human being. Only non-sentient robots can withstand such heavy drops. In Position sizing XII- Two-tier Optimal f, we analyzed the growth speed of a 1% risk size, and we compare it with the Optimal f. We were interested in the average time to reach a 10X final capital. We saw that on a system with 65.5% winners and a profit factor of 2 ( average Reward/risk ratio of 1.1), using 1 percent risk, it would take650 days ( about two years) on average, whereas, using optimal f sizes, this growth was reached in 42 days, less than one-tenth of the time!.

The two-tier Optimal f positioning method uses the boosted supply model, and is a compromise between maximal growth and risk. The main objectives were to preserve the initial capital while maintaining the Optimal f method’s growth characteristics as much as possible.

The two-tier optimal f creates two pockets in the trading account. 

  1. The first pocket, representing 25% of the total trading capital, will be employed for the optimal f method. The rest, 75%, will use the conservative model of the 1 percent model.
  2. After a determined goal ( 2X, 5X, 10X, 20X), the account is rebalanced and re-split to begin a new cycle.

In Position sizing XII- Two-tier Optimal f part II, we presented the Python code to accurately test the approach using Monte Carlo resampling, creating 10,000 years of trading history.

 The results obtained proved that this methodology preserved the initial capital. This feat is quite significant because it shows the trader will dispose of unlimited trials without blowing out his account. Since the odds of ending in the lowest possible scenario are very low, there is almost the certainty of extremely fast growths.

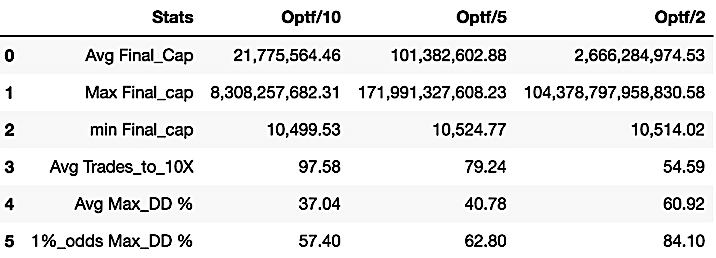
Finally, we also analyzed other mixes in the two-tier model, using Optf / 10, Optf/5, and Optf/2 instead of 1%, with goals of 10X growth to rebalance. These showed extraordinary results as well while preserving the initial capital. B.

Drawdowns

The trader should also consider the drawdowns involved before deciding which strategy best fit his tastes because, while this methodology lowers it, in some cases, it goes, on average, beyond 60%. We have found that the best balance between growth and risk was the combination of 75% Optf/10 and 25% Optf, which gave an average final capital of $21.775 million with an average drawdown of 37%.

To profit from this methodology, the trader must ensure the long-term profitability of his system. Secondly, he must perform a Monte Carlo analysis to find the lowest optimal f value. Finally, he should create an adequate spreadsheet to follow the plan.

Final words

After reading all this, we hope you know the importance of position sizing for your success goals as a trader.

One caveat: We have left some topics out, such as martingale methods, which many traders use and are the main cause of account blown out. Please adhere to the philosophy that position sizing should be thought of as a tool to reach your goals and handle your risk and drawdowns. As shown in The Dark Side of the trade, position sizing should be separated from the previous trades’ results.

Categories
Forex Course

187. Learning To Trade the News With Directional Bias

Introduction

In this course, we will further explain, with an example, how you can trade a news release with a directional bias. In the US, the labor market report is one of the most anticipated new releases in a month. The report has a significant impact on any pair with USD. Note that every trader has their approach to trading the news with a directional bias. Here’s our approach.

If you are a forex trader with a directional bias, you need to have in-depth knowledge of the news release you are trading. What do we mean by in-depth knowledge? Firstly, you have to know what that particular news release tells about the economy. For example, the US labor market report has the unemployment rate and nonfarm payroll data.

When both these indicators beat the analysts’ expectations, we can expect that the USD will become stronger than other currencies. The US labor market report is a leading indicator of consumer demand, contributing up to 70% of the GDP. Furthermore, in the current coronavirus pandemic, the labor market report is used to show the rate of economic recovery.

You’d also expect the USD to weaken relative to currencies it is paired with if the news of the labor market report doesn’t meet analysts’ expectations. In this case, it means that unemployment increased, and the economy didn’t add as many jobs as expected.

To make a proper directional bias trade, you need to understand how the labor market report impacts the forex price charts. You have to look into past releases and establish how much the market moved; this will help you get the average pip movement. You also need to be aware of the prevailing macroeconomic conditions and the recent unemployment rate trend.

What to do before the news release?

Go back a few hours on your chart and establish the intraday support and resistance levels. You will use these levels as your ‘take profit,’ and ‘stop-loss’ levels after the news is released.

Let’s check out the news release of the US unemployment rate on October 2, 2020, at 8.30 AM EST.

EUR/USD: Before US Unemployment Rate Release on October 2, 2020, 
just before 8.00 AM EST

Since the unemployment rate was lower than the previous release and also beat analysts’ expectations, our directional bias is to be bearish on the EUR/USD pair. In this case, we will use our previously established Support Level as the ‘take profit.’

EUR/USD: After US Unemployment Rate Release on October 2, 2020, 8.00 AM EST

[wp_quiz id=”94037″]
Categories
Forex Fundamental Analysis

EUR/USD Global Macro Analysis – Part 3

EUR/USD Exogenous Analysis

In the exogenous analysis, we’ll analyze the economic fundamentals that impact the Euro-US Dollar exchange rate. For this analysis, we’ll focus on:

EU and the US GDP Growth Difference

The primary drivers of GDP growth in an economy are domestic demand and international trade. When a country’s exports increase, it means that the demand for its currency also increases, which makes it appreciate.

The US and the EU GDP change are in tandem. In Q3 of 2020, the EU GDP expanded by 11.6%, while that of the US expanded at an annualized rate of 33.1%. Although this change seems much, the US GDP level is still about 3.5% lower than the pre-coronavirus pandemic levels.

Based on the correlation analysis of the GDP differential and the EUR/USD pair changes, we assign a deflationary score of -2. It implies that the difference in GDP growth between the EU and the US will lead to a bearish EUR/USD.

Trade Balance Difference

For each country, the trade balance shows if an economy is running on deficits in international trade. The trade balance is simply the difference between exports and imports. Surplus trade balance happens when an economy exports more than it imports. A negative trade balance means an economy is importing more than it exports.

The EU recorded a trade surplus of €24489.40 million in September 2020, while the US had a $63.9 billion trade deficit in the same period. The trade balance has a high correlation with the exchange rate of the EUR/USD pair. Therefore, we assign it an inflationary score of 7, meaning we expect a widening trade balance between the EU and the US to result in bullish EUR/USD.

EU and US Interest Rate Differential

This indicator measures the difference between the interest rates in the EU and that in the US. The economy with a higher interest rate will attract more investments from foreigners seeking higher returns.

In the US, the Federal Reserve has kept the interest rate within a range of 0% – 0.25%. In the EU, the ECB interest rate is 0%. Since the interest rate differential between the two economies is low, we do not expect it to impact the EUR/USD exchange rate. Therefore, we assign a deflationary score of -1. That means we expect it to result in a mild bearish trend for the EUR/USD pair.

Conclusion

The exogenous analysis of the EUR/USD fundamentals gives an inflationary score of 4. This implies that in 2020, the EUR/USD pair has had a bullish trend. In the short term, this bullish trend is expected to persist.

Note that the EUR/USD pair has formed a support level along with the middle Bollinger band. Therefore we can say that our Fundamental analysis is being supported by our Technical Analysis as well. Cheers!

Categories
Forex Fundamental Analysis

EUR/USD Global Macro Analysis – Part 1 & 2

Introduction

In this analysis, we’ll focus on endogenous economic growth factors in the EUR and the US. We’ll also analyze the exogenous factors that will help us compare the economic performance in both regions.

Endogenous economic factors are inherent within the domestic economy and are primarily driven by domestic demand. On the other hand, exogenous factors are external economic factors that result from a country’s participation in the international markets. Both of these factors influence the fluctuation of the currencies from both countries.

Ranking Scale

We will rank both the endogenous and the exogenous economic factors on a scale of -10 to +10. A negative ranking shows that the economic factor had a deflationary impact on the currency. Conversely, a positive ranking implies that it had an inflationary impact.

USD Endogenous Analysis – Summary

The USD endogenous factors recorded a score of -19.1, implying a deflationary effect on the USD. This essentially means that according to these indicators, the USD has lost its value since the beginning of this year.

You can find the complete USD Endogenous Analysis here.

EUR Endogenous Analysis – Summary

The endogenous analysis of the EU economy shows a modest deflationary score of -8.5. This means that in 2020, the Euro has shed some of its inherent value.

The endogenous economic indicators in the Eurozone are an aggregate of the 27 member countries in the EU.

  • Monthly retail sales

It measures the inflation-adjusted value of retail sales. About 40.1% of all retail sales in the EU are from food, drinks, and tobacco. Electronics and furniture account for 11.5%, while computer equipment accounts for11.4%. 9.2% of the retail sales are attributed to clothing and footwear,  while pharmaceutical and medical products account for 8.9%.

In September 2020, retail sales in the EU dropped by 2%. Given that retail sales account for about 70% of the GDP, our correlation analysis, we assign the EU retail sales an inflationary score of 2.5.

  • Industrial production

This indicator measures the total output by manufacturers, mines, and utility industries in the EU. The value is adjusted for inflation. Note that the industrial sector in the EU is among the top employers.

In September 2020, industrial production dropped by 0.4%, which is an improvement from the drop of 17.1% recorded in April. However, the change in industrial production has been steadily falling from a peak of 12.4% in May.

Based on our correlation analysis, we assign the EU change in monthly industrial production a deflationary score of -2.

  • Unemployment rate

This indicator shows the percentage of the total workforce in the EU who are seeking gainful employment. The data shows the monthly change.

In September 2020, the unemployment rate in the EU was 8.3%. Throughout the year, the EU has experienced a steady increase in the unemployment rate. This is due to the economic effects of the coronavirus pandemic. However, our correlation analysis shows the minimal impact of the unemployment rate on the EU GDP. Therefore, we assign it a deflationary score of -2.

  • Employment change

As an economic indicator, employment change shows the quarterly change in the number of EU citizens who are gainfully employed. This indicator can also be used to show the ability of the economy to create more jobs. It measures both full-time and part-time employment.

In the third quarter of 2020, the EU employment change increased by 0.9%, showing that the EU economy is recovering from the slump of Q2 2020. Our analysis shows a higher correlation of the employment change with the changes in GDP. Hence, we assign it an inflationary score of 4.

  • Business confidence

The business sentiment is also referred to as the Industry Sentiment. It measures the economic sentiment among manufacturers, consumers, and employers in the EU by rating the current and future economic conditions.

The lowest business confidence recorded in 2020 was -32.3 in April 2020. Since then, the indicator has been steadily improving to -9.5 in October. Based on the correlation analysis with the EU GDP, we assign business confidence a deflationary score of -3.

  • Consumer Spending

Consumer spending measures the quarterly amount that households spend on goods and services for personal consumption. As an economic indicator, it can be used to show households’ welfare and the prevailing economic conditions. Since consumer expenditure accounts for about 70% of the EU GDP, any changes in the quarterly expenditure are bound to impact the GDP levels directly.

In Q2 of 2020, consumer spending dropped to € 1511.14 billion from € 1716.59 billion in Q1 of 2020. It is the largest drop ever recorded in history and can be attributed to the pandemic-induced economic recession.

Due to its high correlation to the change in GDP, we assign consumer spending a deflationary score of -5.

  • European Union Government Debt To GDP

This ratio compares what the EU economy produces and what it owes. It shows the efficiency of the economic process and the capability of the government to service its debts without overstretching the available resources. Investors can use this ratio to gauge whether the debt in an economy is becoming unsustainable.

Increasing levels of government debt and a stagnating GDP results in a deflationary effect for the domestic currency.

By the end of 2020, the EU government debt to GDP is expected to reach 95% from 79.3% recorded in 2019. The higher government debt to GDP in 2020 is a direct result of the aggressive measures out in place to curb deep recessions from the coronavirus pandemic.

Based on our correlation analysis, we assign a deflationary score of -6 to the EU government debt to GDP.

  • EU Rate of inflation

In the EU, the inflation rate is best measured using the consumer price index (CPI). It measures the overall monthly change in the prices of consumer goods and services. The rate of inflation can be used as gauge the purchasing trends among households.

In theory, a rise in inflation implies that consumers’ demand for goods and services is increasing. Conversely, a drop in inflation implies that demand is shrinking hence corresponding to lower GDP levels.

In September 2020, the rate of inflation in the EU decreased by 0.2%. It is, however, an improvement from the -0.4% recorded in July and August. Based on its correlation with GDP, we assign the EU rate of inflation a score of 3.

In the next article, we have posted the Exogenous Analysis of the EUR/USD pair to have a clear idea of whether this pair is bullish or bearish market conditions.

Categories
Cryptocurrencies

Buying Bitcoin with Skrill: Don’t Try Before Reading This!

Bitcoin is the world’s most popular currency. So it’s not a surprise that most payment platforms worth their salt support the currency. One of these platforms is Skrill, the London-headquartered money transfer company that’s now one of the most popular globally. 

This article looks at how you can purchase Bitcoin via Skrill. We’ll dive briefly into what Skrill is, whether you should consider using it, and the best places to buy BTC with Skrill. 

What is Skrill?

Skrill is an international payment platform through which users can transfer, send, and receive money from across the globe. It sets itself apart from other money transfer companies such as PayPal through low-cost transactions. You can open a Skrill account in any of the 30+ supported currencies. Once you have an account, you can add other currencies if you’d like to receive payments in different currencies. Skrill is widely accepted by merchants worldwide, including cryptocurrency exchanges, which is why you need to know how you can purchase Bitcoin using Skrill. 

Should You Buy Bitcoin with Skrill?

Wondering whether it’s worth buying Bitcoin from Skrill? Apart from being just another option (the more options you have, the better), Skrill can save you some money. Additionally, you can buy Bitcoin directly from your Skrill account with your local Fiat currency. There are many ways you can fund your Skrill account to facilitate a crypto purchase. Skrill also offers convenience and ease of use through its mobile app. Finally, crypto purchases are instant, and your account is credited with the balance within seconds. 

With that, let’s take a look at where and how you can do it so. 

Best Places to Buy Bitcoin with Skrill

#1. Skrill

Skrill itself is one of the best places where you can buy BTC. Buying Bitcoin from Skrill is incredibly easy and straightforward. If you have an account, you will see the option when you log in. The interface is particularly user-friendly – simple, elegant, and minimally designed. 

To buy BTC from your Skrill account, you will need to fund it first. The quickest way to do so is to use your credit card. Whichever card you’re using, funding your account will cost you around 2.5% of the transaction value. Most of the major cards are accepted. 

Apart from Bitcoin, you can also buy other major cryptos on the platform. This is especially important if you’d like to diversify your crypto investment portfolio. As a bonus, you can also sell crypto from within your Skrill account. So buying BTC on Skrill is not only highly convenient, but it’s also option rich. 

#2. Paxful

Paxful is a peer-to-peer (P2P) Bitcoin marketplace launched in 2015. The platform allows you to buy and sell Bitcoin to other users. Like all other P2P marketplaces, users can browse through different seller profiles and select the one that offers the best rates and accepts Skrill payments.

Whether you have an account or not, Paxful allows you to filter sellers by country, accepted payment methods, and so on. When you select a seller, the platform gives you more details regarding the offer and the seller. You can even see the seller’s rate in comparison to the average market rates and determine whether their offer is fair. If your Skrill account is already funded, buying Bitcoin from Paxful is super easy. You will only need to check out with Skrill and complete the easy steps that follow. 

Best of all, Paxful summarizes many options for you, allowing you to quickly and simply purchase Bitcoin. 

#3. Capital.com

Capital.com is a UK-based crypto broker that allows users to buy and sell most of the major cryptocurrencies. Since it’s a broker, you’ll be either buying or selling directly to the company. If you are conscious of the risks of buying crypto from a P2P exchange, Capital.com is a great go-to option. 

#4. eToro

eToro is one of the biggest crypto exchanges, and it supports buying Bitcoin using Skrill. eToro is a social trading platform, which means it allows you to copy-trade. The platform is designed mostly for experienced traders. Nevertheless, its copy trading feature allows novices to take part.

When it comes to buying Bitcoin, eToro is one of the most sophisticated trading platforms. It presents multiple dashboards offering a preview of the most important BTC indicators, real-time prices included. Setting up an account is a little cumbersome as it requires you to provide numerous details. However, once all is set up, the rest of the purchase process is relatively easy. 

#5. Coingate

Coingate is a cryptocurrency payment gateway that allows businesses across the globe to accept Bitcoin. Crypto traders can also buy and sell their digital assets on the platform without making any deposit. When you choose to buy Bitcoin using Skrill, you’ll be able to make an instant payment without the need for registration or verification, as long as you’re verified on the platform. Coingate’s speed and ease of use make it an ideal option for users who want to buy Bitcoin quickly and without hassle. 

Coingate is sometimes criticized for offering poor rates and unsatisfactory customer service. However, user experience on the platform is generally smooth, and you’re unlikely to face challenges buying Bitcoin or paying with your Skrill account. 

#6. Bitpanda

Bitpanda is a world-famous crypto exchange that allows users to buy and sell various digital assets with the convenience of mobile and desktop options. Bitpanda has made buying/selling Bitcoin as easy as ABC. To buy Bitcoin with Skrill on Bitpanda, you need only follow three steps:

  • Create a Bitpanda account or log in if you have an existing one.
  • Verify your identity and fund your Bitpanda wallet. When depositing funds, you will be directed to select the source of funds, where you’ll choose Skrill.
  • Proceed to buy Bitcoin.

The difference between Bitpanda and Coingate is that with Coingate, you have to fund your Coingate account first. However, the whole buying experience is fast and user-friendly. 

Final Thoughts

Skrill is one of the most recognized global money transfer platforms. The platform attracts users with its low-cost money transfer offerings. When it comes to buying Bitcoin with Skrill, users get various options ranging from Skrill itself to the numerous exchanges that accept Skrill payments. If you’re using Skrill on a different platform, you need to evaluate the platform’s ease of use, transaction fees, and available withdrawal options. As for Skrill itself, Bitcoin purchases are simple and instant, which you should take advantage of.

Categories
Crypto Videos

What Would it Take for Ethereum to Fail?


What Would it Take for Ethereum to Fail?

Ethereum 2.0 has recently launched its Beacon Chain, concluding Phase 0 of a scaling effort. Although he expressed quite a bit of faith in Ethereum 2.0, Celsius CEO and founder Alex Mashinsky believe nothing has to be set in stone. The network could lose its spotlight if it doesn’t manage to scale quickly, effectively, and significantly.

“Ethereum needs to prove to the market that it can scale its transactions 100x without compromising on either security or decentralization,” Mashinsky stated when asked about Ethereum 2.0’s next hurdle after its Beacon Chain launch. “If Ethereum fails to scale, Cardano and Polkadot will take over the market.”

As of Thursday, December 3, Ethereum’s network hosts somewhere in the ballpark of 13 transactions per second, according to data coming from Blockchair. A 100-fold increase from now would total the network capacity to roughly 1,300 transactions per second.

Ethereum has served as the top blockchain for building decentralized applications over the past years. In 2020, the DeFi sector boom has largely taken place on Ethereum’s blockchain, as well. This surge in activity has led to incredibly high network traffic that Ethereum could not handle, and that at times resulted in high transaction fees. 

With Ethereum 2.0’s shift from a proof-of-work and onto a proof-of-stake consensus algorithm, scaling advancements should be evident very soon. Ethereum co-founder Vitalik Buterin previously stated that he believes the network has the possibility to scale to an astonishing 100,000 transactions per second.

The aforementioned network’s upgrade, however, faced a fair bit of delays before achieving Phase 0 earlier this month. MyEtherWallet founder said that he expects Ethereum 2.0’s next phases to take years to fully play out. Mashinsky didn’t give any specific time estimates, but he did give his vote of confidence in the network upgrade idea as a whole.

“I am a big believer in this upgrade, even if it will take longer than anticipated to scale and solve all the problems,” he said.

It’s important to note that Ethereum’s native token, Ether, also plays into the equation. Phase 0 requires all interested parties to lock up at least 32 Ether each, with a total of 524,288 Ether needed for the Beacon Chain launch. The Ether must remain locked until Phase 2 is live, and that could take years.


As more and more Ether is locked up for Ethereum 2.0 or used on different DeFi and CeFi platforms, the prices push to higher levels simply due to the scarcity effect. Almost all decentralized exchanges are denominated in Ether, which is also a huge advantage for Ethereum.

Categories
Crypto Videos

An Ethereum Fund Launching On The Toronto Stock Exchange!

Ethereum Fund Launching on the Toronto Stock Exchange

Canadian digital asset investment manager company 3iQ will be launching an IPO of an Ethereum exchange-traded trust, called The Ether Fund, on the Toronto Stock Exchange under the ticker QETH.U. 

The maximum offering for the trust launch is $100 million, and 3iq announced that the offering’s closing date would be no later than Thursday, December 10 of this year. 3iQ currently counts more than $400 million CAD under management. The company maintains a right focus on just several cryptocurrencies, including Bitcoin, Litecoin, and Ethereum.

In a press release that came out Thursday, December 3, 3iQ noted that the listing comes with a patriotic backstory behind it. “The concept of Ethereum was first developed in Canada in 2013, and then launched by a group of technologists coming from all over the world,” the company mentioned.


Ethereum’s co-founder and main figure, Vitalik Buterin, is Canadian-Russian, and his family moved to Toronto when he was just six years old.


Traders south of Canada’s borders have already demonstrated a remarkable appetite for publicly available Ethereum investment options. Despite an incredible price premium, which at points went to as much as 500% relative to net asset value for Grayscale’s Ethereum trust ETHE, the company reports that more and more investors have decided to test the waters and try investing in crypto.

These funds and trusts are the preferred methods of investing in crypto for many traders, as not many people are able or willing to provide their own crypto custody and security options.

On top of that, traders have enjoyed a rapid expansion of this sector, with new fund offerings surfacing across the globe in recent months. In November alone, VanEck launched a Bitcoin exchange-traded note product in Germany, as well as the VanEck Vectors Bitcoin ETN, while 3iQ introduced The Bitcoin Fund to Canada.

Categories
Crypto Daily Topic Forex Daily Topic

How to Trade Forex Anonymously with Bitcoin

Anonymous trading used to be a reserve for high-profile investors. But with the increasing acceptance of crypto in forex trading, anyone can trade anonymously now. There are both advantages and limitations to trading anonymously. If you choose to trade forex anonymously, you could use Bitcoin or any altcoin accepted by your broker. 

In this article, we’ll look at what it means to trade anonymously, why you would do it, and, most importantly, how to use Bitcoin in this endeavor.

KYC-Based vs. Anonymous Forex Trading

Unlike crypto trading, forex investment is a highly-regulated industry. For this reason, regulators require forex brokers to conduct extensive know-your-customer (KYC) processes before allowing traders in. Traditionally, exchanges have had no provision for anonymity. However, over time, many have switched to anonymous/hybrid trading practices. 

So, what is anonymous trading? Anonymous trading happens when investors choose to conceal their identity, although their trading activity remains visible in the order book. Usually, an investor will choose between trading on an anonymous (national) exchange or opt for the more private dark pools. 

Anonymous brokerage firms are still regulated and thus do not provide complete anonymity – regulators can still access personal information about a particular trader and their activity. On the other hand, dark pools are private trading platforms that are generally out of the investing public’s reach. They can be registered and operate legally, like conventional brokerages. 

Whether you’re trading in an open brokerage or a dark pool, crypto is particularly useful in keeping transactions identityless. 

With that, let’s find out why you would consider trading anonymously. 

Why Trade Forex Anonymously?

Motivations for trading anonymously may differ slightly between investors. However, the following are common reasons. 

  • Protecting identity – For personal reasons, you might opt to remain an unknown investor on the market. Sometimes one just desires privacy – be it to circumvent some restrictions, keep away stalkers, etc.
  • Protecting your strategy – If you’re a particularly savvy trader, your tricks will always be at risk of being copied. But if you trade with your identity concealed, you’re making it difficult for them to join the dots that make up your strategy. 
  • To conceal your intention – Crypto markets are sentimental, and if traders see you buying or selling in large volumes, prices can move, sometimes to your disadvantage. In such a case, buying or selling anonymously allows speculation to shape the course of price movements.

Using Bitcoin to Trade Forex Anonymously 

It’s very possible to trade forex using crypto. And while you can use any crypto to trade forex (as long as your broker allows it), Bitcoin has some advantages. Obviously, the main one is its wide acceptability. BTC’s volatility also makes it a suitable currency for investment. That said, this is how you can use Bitcoin to trade forex. 

#1. Get Bitcoin – Naturally, the first step is to acquire Bitcoin. For this, you will need to visit an exchange (not a forex exchange, though). Familiarize yourself with the likes of Coinbase, Binance, and Changelly. 

#2. Find a good broker – Not all forex brokers accept Bitcoin. Those that do may be referred to as Bitcoin deposit forex brokers. 

#3: Deposit Bitcoin with the broker and provide them with the finer details of the trade they should execute.

Of course, this is a high-level overview of the process. There are intricacies involved, such as how to evaluate brokers and the risks and the benefits of using Bitcoin to trade crypto that you need to be aware of. Let’s take a look at these below: 

Top 10 Bitcoin Deposit Forex Brokers

The list of Bitcoin deposit forex brokers is growing by the day. Some of the truly tried-and-tested include the following. Links go to a full review of the broker, where available.

#1. IC Markets – This broker is regulated by the Australian Securities and Investments Commission. They accept deposits from $200 in any of the supported currencies, including BTC. With IC Markets, you can get a leverage of up to 500:1. IC Markets allows its customers to trade Forex, Metals, indices, bonds, stocks, and digital currencies.

#2. EagleFX – EagleFX is a beginner-friendly broker with whom you can trade from as low as $10. The platform offers fast account setup and supports over 55 currencies and 32 digital assets. Withdrawals are also pretty fast. With leverage of 1:500, experienced traders can equally benefit from the platform. One of the things making EagleFX stand out is that it appeals to all levels of traders – from beginners to seasoned investors.

#3. CedarFX – CedarFX is a rather interesting option, as it offers zero commission trading with very tight spreads. This broker offers traders six asset classes: digital assets, stocks, indices, metals, futures, and commodities. When trading with CedarFX, the best part is that investors get to choose from a wide array of options. CedarFX’s leverage goes up to 1:500 and also accepts a minimum $10 deposit.

#4. FX Choice – Just like IC Markets, FX Choice is an electronic communication network (ECN). They accept deposits from $100 in a range of crypto and fiat currencies. The broker offers maximum leverage of 200:1 and a variety of Forex pairs, metals, indices, and digital assets.

#5. Longhorn FX – This broker seeks to attract beginner investors with low minimum deposits starting from $10. You can get leverage up to 1:500 to trade with over 55 currency pairs. Withdrawals are fast and easy, which increases its appeal. 

#6. Cryptorocket – This broker allows investors to trade various instruments that include crypto, commodities, stocks, and forex. Leverage of up to 1:500 is possible, and it can be applied to trade some 35 crypto pairs, 55 fiat currency pairs, among other asset classes. The broker features institutional-grade liquidity that guarantees investors competitive pricing. Also, Cryptorocket uses straight-through processing – so you can be sure there will be no price manipulation.

#7. Think Markets – Think Markets is a market maker non-dealing desk kind of broker. You can start with any amount for your deposit, which is encouraging for new users. It is regulated by the Australian Securities and Investments Commission (AU), the Financial Conduct Authority (UK), and the Financial Sector Conduct Authority (ZA). 

#8. FXTM – FXTM is an ECN market maker regulated by the Financial Services Commission of Mauritius. You can start trading from a minimum of $5 (or its equivalent in any of the supported currencies). The broker offers maximum leverage of 1:1000.

#9. HotForex – HotForex is also a market maker that accepts deposits from $5. It is regulated by the Dubai Financial Services Authority and accepts several base currencies. The maximum leverage you can get is 1:1000. 

#10 Hugosway – Hugosway is a well-established broker with offices in Kingstown, St. Vincent and the Grenadines. The broker accepts bank transfers as well as crypto funding while offering its customers fast times on deposits and withdrawals. It allows trading in digital assets, forex, indices, and metals.  The minimum deposit is $50 using credit card and bitcoin, and $10 using Vload.

Benefits of Trading Forex with Bitcoin

  • Increased privacy – When you trade forex using Bitcoin, you don’t need to share your personal financial info.
  • Increased leverage – Many brokerage firms offer leverage to Bitcoin traders. If you know how to use leverage, this can be hugely beneficial.
  • Potentially lower costs – Bitcoin deposit forex brokers are reportedly lowering brokerage fees to attract the new breed of BTC-forex investors.
  • Lower deposits allowed – Again, it appears like Bitcoin deposit forex brokers are using this strategy to attract new investors.
  • Easier cross-border trading – Thanks to Bitcoin being a global currency, you can trade with any broker from anywhere.

Risks of Trading Forex with Crypto

  • Volatility – Since Bitcoin’s prices change continuously, a broker may take advantage of traders by receiving their Bitcoin using the day’s lowest rate and exchanging it at the day’s highest rates. 
  • The leverage temptation – The special leverage used to entice BTC-forex brokers is a great risk to novice investors.
  • Mixing of asset classes – Bitcoin and forex are different asset classes. This use of an ‘intermediary’ currency increases trading complexity and risks.
  • Bitcoin’s inherent risks – Bitcoin, like all cryptos, can be easily stolen if not properly secured. A broker that is licensed and reputable ensures the safety of your funds.

Final Thoughts

Using Bitcoin to trade anonymously offers several benefits. You can take advantage of the higher leverage, lower deposits, lower costs, easier cross-border trading, and so on. There is also an ever-increasing number of Bitcoin deposit forex brokers you can experiment with. However, ensure to employ plenty of caution and thoroughly research brokers so you don’t lose money, and start slow, testing it with minimum deposits and thin trades. Overall, anonymous forex trading with Bitcoin is an exciting endeavor that you can explore – whether you’re a veteran or new to the game. 

Categories
Forex Course

186. What Are Directional & Non-Directional Bias While Trading The News?

Introduction

By now, you have a clear idea of how to make a news trading plan and schedule. The next thing you need to understand is that there are two primary ways of trading the news in the forex market. These ways involve whether or not you have a directional bias towards the news being released.

Having a Directional Bias

Among the first lessons you learn about the release of economic indicators is how they impact different currency pairs. For example, let’s say that you are interested in the GBP/USD pair, and there is an upcoming news release of the UK GDP.

We would expect that if the GDP shows that the UK economy has expanded, then then the GBP will appreciate relative to the dollar the pair will rise. Conversely, if the GDP shows that the UK economy contracted, you will expect the GBP to depreciate against the USD, and the pair will fall. This is what having a directional bias means.

We’re sure you have noticed the ‘consensus’ aspect from the economic calendar. This number is usually what the majority of financial analysts and economists agree on, as the forecast for a particular economic indicator. It is commonly referred to as “Analysts’ expectations.” In most cases, the market reaction to a news release is determined by whether the news was better than the analysts’ expectations, worse than the expectations, or in line with the expectations.

Let’s say that the analysts’ expectation for the upcoming UK GDP is a growth of 2% and when the actual GDP data released turns out to be 2.3%. If you have a directional bias, you will buy the GBP/USD pair as you expect the GBP to appreciate against the USD.

In another scenario, assume that the news release did not meet the analysts’ expectations and the actual GDP growth is 1.6%. For a forex trader with directional bias, they would sell the GBP/USD pair since they expect the GBP to depreciate relative to the USD. The analysts’ expectation is vital to a trader with a directional bias.

Non-Directional Bias

A news trader with non-directional bias ignores the analysts’ expectations. Such traders are aware that high-impact news will result in a significant movement in price action. For them, it doesn’t matter the direction of the market movement; they only follow the trend. They don’t bother whether the news release beat expectations or not.

We hope you got an understanding of what Directional and Non-Directional bias are while trading the news. Don’t forget to take the below quiz. Cheers!

[wp_quiz id=”94041″]
Categories
Forex Market Analysis

NZDCAD Heavy Drops driven by a Sharp Shift in Market Sentiment

In the last trading week, the NZDCAD cross  90-Day market sentiment declined from the extreme bullish to the bullish sentiment zone. The move was helped by the Canadian unemployment rate figures, which declined to 8.5% in November, beating the analysts’ expectations of 8.9%. 

Source: TradingEconomics.com

The last unemployment rate reading represents an improvement in the Canadian labor market, which showed a slight decline to 8.9% in October. On the other hand, during the current year, the data gathered from Statistics Canada stated that the record unemployment high was Mays figure of 13.7%, its highest level in more than four decades.

Technical Overview

The following 8-hour chart illustrates the market participants’ sentiment unfolded in the 90-day high and low range, revealing an aggressive decline in the Friday 04th trading session where the cross dropped over 1.7%. 

In this context, the downgrade on the market sentiment leads us to expect a corrective movement. This potential drop could find support in the neutral zone of 0.88698. Likewise, the descending of the NZDCAD EMA(60) to Close index below the zero-line drives us to anticipate a consolidation during the coming trading sessions before continuing a further decline.

Technical Outlook

The NZDCAD cross in its 8-hourly chart illustrates the mid-term uptrend that began on March 18th once the price confirmed its bottom of 0.80849. The primary trend plotted in blue reveals that the bull market remains intact.

Likewise, the breakdown observed in the last ascending secondary trend identified in green reveals a short-term correction with three potential key support levels: 0.89469, 0.88583, and 0.87489. Each of these levels shows a zone where the price action developed a polarization movement.

The following 2-hour chart shows an impulsive movement, which began on October 20th when the price found support at 0.86270. After completing its third wave of Minuette degree, in blue, the NZDCAD cross found resistance on December 03rd at 0.91630, where it started a decline in an incomplete corrective sequence that could correspond to wave (iv), in blue.

In this context, the cross could develop two potential scenarios:

  • The first scenario occurs if the price completes the third wave on 0.91630. In this case, the cross could advance mostly sideways in its wave (iv), in blue. In this scenario, the cross could find support in the demand zone between 0.89723 and 0.89490, where the price could begin to advance in its wave (v) of Minuette degree at least to the 0.9163 level.
  • The second scenario: considers an alternative count and occurs if the NZDCAD cross completes a wave (v), in blue, on 0.91630. If that is the case, it implies the price is currently advancing in a corrective formation of Minuette degree. Thus, the price could create a decline in a three-wave sequence toward the next demand zone between 0.88437 until 0.88234. 

In both scenarios, the invalidation level is found below the origin of wave (i) at 0.86270.

Categories
Crypto Daily Topic

How to Spot Scams in Decentralized Finance 

If you have been in the crypto industry for more than a minute, you’ve probably heard about decentralized finance (DeFi). It is one of the fastest-growing sectors in the crypto scene, having registered an 1116% increase this year. DeFi grew tremendously, increasing from $674 million in January to $14.185 billion today.

However, the impressive growth also comes with a drawback; DeFi scam projects. 

Thanks to FOMO, scammers are jumping on board the DeFi craze. Blockchain’s properties of being permissionless and decentralized make it easy for anyone to launch fraudulent scams. Scam cases have been so prevalent that prominent entrepreneurs, such as Craig Wright, write off DeFi completely. 

The truth is that not all projects are fake. So, how do you separate the wheat from the chaff? 

More on that later, but first, let’s have a look at the common DeFi scams you should be aware of. 

Common Types of DeFi Scams

Although criminals will come up with all kinds of DeFi scams, they most likely will fall under any of these four categories. 

i) Exit Scams

Exit scams are perhaps the most widespread DeFi scams around. In this case, developers announce a project’s launch and stir the crypto scene with details of the project. Once they have people talking about the project, the criminals disappear with all the funds locked in the protocol. 

Exit scams are usually hard to trace, thanks to the decentralized nature of blockchain. However, in an isolated incident, the world’s largest crypto exchange, Binance, announced in November that it had recovered 99% of the funds stolen from the platform through an exit scam. 

ii)Pump and Dump

Pump and dump schemes are no stranger to the financial world. These schemes are typical in the stock world and are used to boost stock prices on false statements. Crypto pump and dump schemes work similarly. Investors who are in on the scheme start by creating a buzz around a particular DeFi token. They increase the coin’s awareness on different social media channels, which results in a price increase. More unsuspecting investors get on board and buy the tokens, which further increases its price. 

Once the group reaches its target, the initial investors start selling their tokens. The massive sale of the tokens causes a dip in the prices. While the initial investors make a profit, those unconnected to the scam deal with significant losses. 

iii) Admin Imitator

Most of these scams happen on social media platforms such as Twitter, Telegram, and Discord. Usually, DeFi developers use this platform to form a community around their projects. 

Scammers use these platforms to target unsuspecting investors. They pose as one of the members of the support team and convince investors by using the same image and usernames as legitimate members of the development team. 

The scammers then pretend there’s an issue with the project and inform users of the same. They ask the users to send ETH to a specific address or send their private keys to solve the issue. 

iv) Discord Bot Scam

This is a relatively new tactic that scammers are using. The criminals create a bot representative of the DeFi project, which they use to send updates, news, and features updates via a link. Users who click on the link are then redirected to a compromised version of the DeFi platform. These bot scams usually end up in numerous phishing attacks on the users. 

5 Questions You Should Ask to Identify a DeFi Scam

So, how do you tell a legitimate DeFi project from a scam?

Before you invest your money, you need to ensure the project is viable. Finding the answer to these five questions will help you identify a DeFi scam from miles away. 

What’s the Project’s Purpose?

It may seem like an obvious question, especially for an investor who’s new to the crypto scene. However, taking a keen look at the project’s purpose can help you avoid hefty losses. 

DeFi projects are supposed to be innovative, and the legitimate ones usually are. However, most of the upcoming projects have nothing to offer and are only riding on the ongoing craze. 

Before committing your money, have a clear idea of what the project is all about. Does it bring anything new to the crypto scene? Is it an innovative solution? How different is it from its competitors?

Is There a Smart Contract Audit?

Project audits are a common feature in the DeFi space. For smart contracts, audits are an essential part of the development and help to ensure the project’s code is secure. 

Despite it being a requirement for developers to deploy their code with an audit, most don’t adhere to this. The audits are quite expensive, so scammers won’t bother incurring the additional costs. 

Sure, an audit report for a DeFi project doesn’t mean the platform is entirely safe and shouldn’t be a decisive benchmark for the ideal project. However, it’s an excellent indicator to help you weed out scam projects.  

Who Are The Founders?

Most investors don’t give a second thought about the founders, but it helps to have some information on them. 

Anonymity in the crypto space is not new; after all, it is one of the pillars of blockchain technology. Therefore, it’s not unusual to come across DeFi projects whose founders choose to remain anonymous. 

So, are all DeFi projects run by anonymous founders a scam? Not at all. However, if the founders are anonymous, they cannot be held accountable in case anything goes wrong. So, you can always go for a project with unknown founders, but you run the risk of losing everything and having no one to go after if you lose your money. 

Is There Any Developmental Activity?

One of the best features of DeFi is that most of the platforms are open-source. This means that the development team avails the code to the public so that anyone can make changes to it. Therefore, if you have any code-knowledge, you can always check out the source code to identify any malicious activity. 

The best part about open-source DeFi projects is that if they raise enough interest, more people get on board. You, therefore, have more people checking out the source code for any bugs; thus,  increasing the chances of spotting anything off. 

You should also check the developer’s activity. Are they often deploying new codes? It may not be enough to spot a fake, but a project with zero developer activity should undoubtedly raise some eyebrows. 

How is the Token Distribution?

When finding out more about a DeFi project, you should always pay keen attention to its tokenomics. For starters, find out more about the token’s allocation. 

As expected, the founders will probably hold the lion’s share for themselves. However, this could end up being a problem if the developers are scammers. They can easily hike the token’s prices and later dump their coins in the market, causing the token to lose its value. 

Additionally, the distribution model used is essential. An exclusive presale will mean that only a select few will acquire the tokens at first and cause hype around the project on social media. Airdrops are likely to cause a sell-pressure, while IEOs are more reliable since crypto exchanges put their reputation on the line. 

Do Your Own Research!

Figuring out whether a DeFi project is about to dupe, you can be an uphill task- yet, it’s quite necessary. After all, no one wants to lose their hard-earned money. 

Although these five crucial questions will give you a headstart, they aren’t conclusive. Before placing your money in a sinking ship, do your own research and learn all you can about the project. Not all DeFi projects are a scam, and if you get a legitimate one, it could end up being a worthy investment with massive profits.

Categories
Crypto Videos

Goodbye XRP! What Happens if XRP Gets Deemed a Security?


What Happens if XRP Gets Deemed a Security?

Ripple CEO Brad Garlinghouse believes that his company can and will still thrive under a hypothetical scenario where its cryptocurrency XRP is declared a security by the United States lawmakers. 

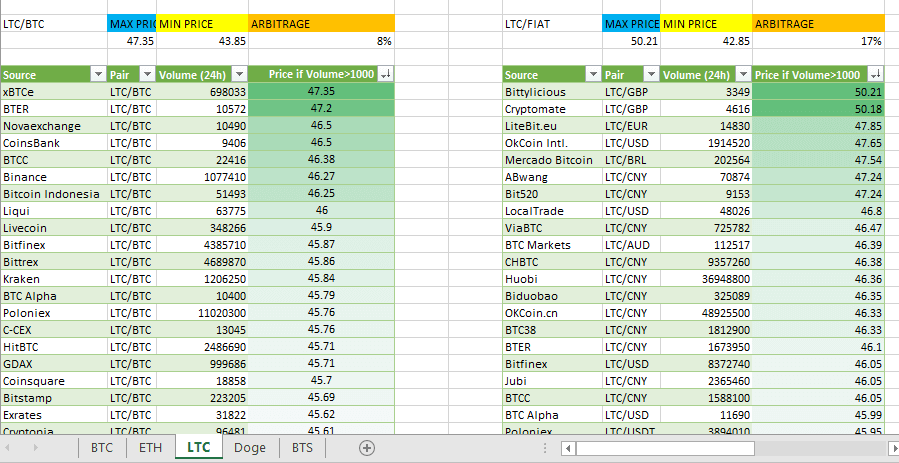
Appearing on episode 439 of the Anthony Pompliano’s Pomp Podcast, Garlinghouse spoke about the implications of XRP being declared a security by the US Securities and Exchange Commission. He said such a position is possible but that it would run contrary to the view that prevails among G20 markets.

While stating that “it’s very hard to look at XRP and say that it is a security,” Garlinghouse said:


“If XRP were deemed a security in the United States… you know, we have other G20 markets that have a completely different view. I’m not aware of any market in the world that thinks that XRP is a security.” Garlinghouse added that “over 90% of RippleNet customers are actually out of the United States,” suggesting that a possible unfavorable securities designation wouldn’t exactly hinder the company’s underlying business, but only its short-term popularity. If XRP were to be declared security in the US, investors would need to complete a broker-dealer registration with the US SEC.

XRP’s regulatory status has been a subject of intense scrutiny for a very long time now, with veteran futures and forex trader Peter Brandt being the latest of many public figures in line to declare it a security.

On the other hand, Congressman Tom Emmer, a Republican from the state of Minnesota, argued in August that XRP should not be deemed a security.

Ripple has been the subject of a major class-action lawsuit from disgruntled investors claiming that XRP is a security. This lawsuit alleges false advertising as well as unfair competition charges against Ripple. An amended filing from March 2020 claimed that Garlinghouse was shopping XRP to prospective investors while liquidating his holdings at the same time.

XRP is back in the limelight at the end of November as the market pushed its price above a multi-year high. The rally was a subject of heavy profit-taking, falling more than 28%.

Categories
Crypto Videos

How To Spot Bitcoin Bull & Bear Cycles Beginners Edition!


Bitcoin Bull and Bear cycles – Beginners Edition


Animals Bear Fighting With Bull

Since its launch over a decade ago, Bitcoin has seen a number of bull and bear cycles, with each one of them being greater than the last. However, many have tried to find an answer to the main question: What drives these cycles? Co-founder of Decred Jake Yocom-Piatt has claimed that the answer certainly lies within the human brain.

“Bitcoin’s bull and bear cycles are both functions of generic human psychology, attention spans, as well as its deterministic and diminishing issuance,” Yocom-Piatt stated.

Over the years, numerous parties have tried to find the reason behind and argue different cases for Bitcoin’s cycles, including PlanB’s infamous stock-to-flow model, which projects Bitcoin prices in the future based on its programmed halving events that happen every four years.

One major characteristic that sets Bitcoin apart from every other asset is its deflationary nature. It is programmed to have a finite supply, and that, combined with the ease of movement it provides, allows for borderless value storage better than any asset before.

Then, one might wonder whether the programmed supply that Bitcoin possesses dictates its price cycles on some level. This refers to its mining reward being cut in half every four years, essentially decreasing the amount of new Bitcoin put out on the market each time a block is mined. Its 21 million coins supply cap may also factor into this equation.

“Bitcoin’s rate of supply is constantly shrinking as a percentage of the circulation, with the addition of a massive supply shock every halvening,” explained Yocom-Piatt.

“Bull runs occur when the demand begins to outstrip the supply, driving up the price, which then gets the attention of myopic investors. After some time passes, these myopic investors’ attention span for a bull market fades away, and we revert back to a bear market. With each bull cycle, the overall awareness of Bitcoin grows, further sowing the seeds for the next bull cycle.”

Bitcoin recently approached its 2017 all-time high of $20,000, receiving a big chunk of mainstream media coverage during the time of the push towards the upside.

Categories
Crypto Market Analysis

BTC/USD Weekly Chart Analysis + Possible Outcomes

In this weekly BTC/USD analysis, we will be taking an in-depth look at the most recent technical formations, as well as look for the possible short-term price outcomes.

Overview

Bitcoin has spent the past week recovering levels it lost in a Nov 25 crash and even managed to push to a new all-time high on some exchanges. Still, the end-goal of Bitcoin above $20,000 was not reached.

Bitcoin’s institutional activity is more than booming, with news coming out left and right about companies investing in crypto, financial institutions preparing to embrace Bitcoin as an asset class, as well as regulators allowing Bitcoin to be held in employees’ company-funded 401k plans. On the other hand, Not being able to push past the $20,000 resistance level due to an incredible amount of sell orders near it has brought Bitcoin bears another day of hoping that the price will go lower.

Technical factors


Bitcoin has continued moving up until reaching an all-time high on some exchanges and then creating a doji candle followed by an inverted hammer candle on a weekly time-frame, indicating a possible bearish outlook as Bitcoin has most likely reached its short-term top. Looking at the shorter time-frames, such as the 4-hour one, we can see that Bitcoin has formed either a triangle formation or (if we include the movement from that started on Nov 27) a bull flag, which goes against the previously mentioned bearish outlook. Any break from the channel Bitcoin is trading in at the moment could mean a strong move towards that side.

The hash ribbons indicator flashed a BUY signal, which is an incredibly important update for long-term investors, as this indicator was the most consistent investment tool when it comes to RoI.

Likely Outcomes

Bitcoin’s sending out mixed signals on different time-frames, indicating indecisiveness from the retail sector. On the other hand, companies and institutions show incredibly bullishness as they are buying up Bitcoin over-the-counter. While a move to the downside is quite possible at the moment, the overall current trend is bullish, and short-selling could possibly harm traders’ portfolios more than they can improve it.

1: If Bitcoin fails to establish itself above $19,100 and breaks the range to the downside (slightly less likely), its most likely target will be $18,450. Due to a large number of buy orders in the zone between $18,190 and $18,450, this is the most likely place for reaccumulation and a push towards the upside after a pullback.

2: If Bitcoin manages to push towards the upside, first breaking $19,100 and then the descending black line (top line of the triangle formation), we can expect the price to attempt another push above $20,000, with the possibility of breaking it this time. If Bitcoin proves to be in a bull flag formation rather than a triangle formation, the profit target stays the same ($19,666 with possibly taking some profits along the way).

Entering any trade with having a target of above $20,000 is quite risky, and it would be better to play it safe and end the trade pre-$20,000 and then re-enter it if the price confidently moves up. The same goes for entering a short trade with sub-$18,450 in mind.

Categories
Forex Videos

How To Trade Forex Like Bankers Do & Spot Their Tactics!


A retail trader’s insight into how bankers trade Forex


In this session, we will give retail traders some insight into how professional bankers trade forex, with their own bank’s money, in the forex market.

Wouldn’t it be absolutely fantastic if everybody traded forex the same way?  But of course, that is not the case because traders use different time frames, have different opinions about where currency exchange rates should be, they have different views on political and economic situations which will affect forex exchange rates, and this dynamic array of variances makes Forex moves very difficult to predict on a long-term basis.  Situations can change in the blink of an eye and cause price action moves and reversals, which nobody could have foreseen.

However, if retail traders knew what was going on behind the scenes at a major investment bank, might it give them a better understanding of how price action is affected by the big guns’ actions?  Well, yes, it would.

Firstly, it is he said that under 10% of bank traders’ own banks’ funds, accounts for 90% of all forex volumes. The best way to explain this is to say that the average forex retail trader probably trades between a couple of dollars per pip, with larger account balance traders ramping their trades up to $10 or a standard lot, equivalent, and perhaps a little more when risk suits. And now factor in the fact that over 75% of retail traders lose all of their money in the first 6 months of trading.

And now, let’s look at bankers. The majority of their trading is for their corporate or high net worth client base, where they instigate forex trades on those client’s behalf. And where some of these trades are speculative, and some of these trades are because of clients doing business in other currencies abroad, or perhaps hedging against inflation or portfolios or fluctuating exchange rates, etc.

But when the bankers themselves come to trade, these guys do not mess about. They are likely to instigate a spot or forward Forex trade in ticket sizes ranging from $10 million up to $500 million.  And in which case, they are certainly not picking their trades on a whim. They do not scalp, and they do not go long or short because a stochastic is overbought or oversold, or because an RSI has reached a particular area, or because a Fibonacci retracement to X, Y, or Z level has occurred.

Professional bank traders have a dedicated team behind them who are professional analysts and economists advising them. They have a defined fundamental and technical view of where an exchange rate should be and where reversals in price action might occur, and they tend to be swing traders, not intraday traders, and they usually only do a couple of trades a week on their own bank’s book. But how do they choose their levels?

You definitely will not find something like this one hour chart of the EURUSD pair on a professional bank trader’s screen, which is cluttered with lagging indicators.

However, you probably would find something like this daily EURUSD chart. But what are they looking at? What information does such a chart provide them? 

Actually, it provides them with a wealth of information, such as here we have added some notes, including at position A , which shows defined lines of resistance and support, in a wedge-shaped formation, where a bullish breakout occurs.

And at position B, where price reverses 300 pips from the key 1.200 level, before forming a support line and where the price is moving higher, potentially retesting that key level again.

Now, if our professional bank traders bought this pair at the breakout from position A and rode that trade up to the peak at position B, they would have made 1000 pips on that trade, on a multimillion Euro – in this case – ticket size. The profits would have been incredible. 

Therefore, we know that professional bank traders take a longer-term view of the market. They enter with large size ticket trades, and they use a minimal amount of technical analysis indicators, preferring to draw their own trendlines while looking for breakouts and concentrating heavily on key numbers for support and resistance.

While bankers have deep pockets in terms of how much exposure they have with regard to stop losses, it is almost impossible for a retail trader to incorporate the same amount of risk into their trades.  However, if a retail trader understands where these large ticket trades are occurring, it could be beneficial in terms of their own trading setups.

In conclusion, no matter what your trading style is, look at the longer time frames and look at key areas of support and resistance, which is the institutional size traders maybe referring to, in order to better select your trades on the lower time frames.

Categories
Cryptocurrencies

Arbitrage Trading in 2021? Here Is How I Make A Kill

Cryptocurrency provides so many avenues for people to make money. Whether it’s trading, mining, staking, or lending, you can make money from crypto in any of several ways. However, one method that flies under the radar (and hence many people don’t know about!) is arbitrage trading. Arbitrage trading is a way through which you can make extra cash in a (relatively) risk-free manner.

This article explores the world of arbitrage trading. And, in the end, you will know whether it’s for you. 

What’s Arbitrage Trading? 

Arbitrage trading is an approach to trading that exploits the differences in the price of a cryptocurrency in various exchanges. For instance, let’s say Bitcoin is trading at $9,000 on Coinbase but at $9,200 on Huobi. A savvy trader might move in to take advantage of this price difference by buying the currency from Coinbase and immediately selling it at the price listed on Huobi. 

One may wonder, what causes the difference in pricing of the same asset on different exchanges? This could be due to issues like an exchange having a limited supply of a currency and hence selling it at a higher price than other exchanges that have the currency in a higher volume. 

Various crypto arbitrage methods

You can participate in arbitrage trading using either of three ways: spatial, cross-border, and statistical. 

#1.Spatial Arbitrage

This method involves exploiting the imbalance in prices of a cryptocurrency on two exchanges. While Exchange A might have set Bitcoin at $8,000, exchange B might be offering it at $8,400. A trader can buy the crypto from Exchange A and sell it on Exchange B. Such discrepancies are likely to occur due to the unregulated nature of the market. 

#2. Cross-border arbitrage

This method is not so different from spatial arbitrage – the only difference is that the exchanges involved are in different countries. It can be difficult to pull off cross-border arbitrage because it can be difficult to move the assets between such exchanges. 

#3. Statistical Arbitrage

This is the most sophisticated arbitrage of all three. Statistical arbitrage involves mathematical modeling using bots that take advantage of pricing imbalances that can exist in very short amounts of time. 

Why is Crypto Arbitrage Trading Worth it? 

There are several reasons why you might want to dip your toes in crypto arbitrage trading. Let’s look at these:

#1. Fast and easy profits

If your arbitrage trading goes according to plan, it’s a quick way to earn a profit. Since the process depends on speed, it’s easier to make money than with regular trades.

#2. Lots of opportunities

There are practically hundreds of exchanges where you can trade crypto, meaning you have lots of arbitrage opportunities.

#3. The crypto market is still growing and volatile 

The crypto market is still young, and there are no structures in place, meaning most exchanges will not share information and work independently. Most cryptos undergo quick rises and equally quick drops, causing price discrepancies and profitable arbitrage opportunities.

#4. Limited competition

In the crypto space, there’s less competition when you compare with the traditional finance market. Not many traders are looking to explore crypto, much less crypto arbitrage, making the field so much less competitive. 

#5. Guaranteed price disparities

It’s almost a given that a given cryptocurrency will have different prices on different exchanges – with the difference between 3% to 5% and sometimes (though rarely) even up to more than 20%.

#6. Choosing an exchange for crypto arbitrage

Fancy giving crypto arbitrage a trial? The first step is to evaluate the desired exchanges and then registering. Some exchanges require customers to have their account verified, which may take days or weeks, depending on the exchange. Others will require you to deposit money before you can start trading. Still, other exchanges may be less strict in their onboarding process, but most of them will require you to undergo a Know Your Customer (KYC) process. 

What to consider before you sign up on an exchange

  • Fees: When it comes to trading, fees matter, period. Always try and go for low fees. However, don’t sacrifice quality for cheap fees. Always find a balance.
  • Geography: Check whether an exchange or its features are restricted in your jurisdiction. 
  • Reputation: Check what people are saying about the exchange before you put in your money. Search on Google, check various crypto platforms, and so on. The goal is to avoid shady and spammy exchanges. 
  • Withdraw time: An exchange might take hours or days to allow cashouts, so make sure to understand the rules beforehand.
  • Account verification: Some exchanges allow you to withdraw money or provide full access to the markets only after verifying your account. Always confirm the procedure for the exchange before you sign on.
  • Liquidity: Exchanges do not have liquidity in equal measure. If you’re planning on trading large quantities of funds, make sure the exchange has sufficient liquidity.

The Potential Downsides of Arbitrage Trading

Just like with any worthy endeavor, crypto arbitrage trading has its downsides. Let’s see what you need to look out for: 

KYC Restrictions: As we’ve mentioned above, nearly every exchange has KYC regulations in place. You need to observe these regulations, even if they are inconvenient. For instance, you may need to have a bank account in the home jurisdiction of the exchange. Other requirements may include verifying your identity, and so on. Sometimes these procedures can take days before you’re allowed to trade. 

Safety of funds: Since you will be moving funds across several exchanges, you will most likely need to have funds across all of them. Most of the time, such funds are stored in online wallets, making them susceptible to theft. Some lesser-known exchanges could also steal from customers. It would be best if you were extra vigilant with where you sign up for trading. 

Fees: Exchanges usually charge a definite percentage of your profit as fees. Ensure to calculate this before you start celebrating 

The larger the trades, the more the profit: Profits from Bitcoin trading can be very meager when you factor in the processing delays and fees. So to make any substantial profits, you may need to trade more or increase the volume.

Withdrawal limits: Some exchanges impose withdrawal limits once trade volumes cross a certain threshold. This means you will not withdraw all your money within the same day.

Timing: Transactions can take minutes to be completed, depending on the blockchain. This is a very long time in the world of crypto. By the time they are over, you may have lost your potential profit. Indeed, many are times when you may not receive profits as the markets correct themselves, and the profits turn into a loss. You may have bought crypto in one exchange in some cases, but by the time you transfer them to the other, the markets have moved in the opposite direction.

Slow transactions: As crypto increases in popularity, so does trading volumes on crypto exchanges increase. This may make for slower transactions, which is the last thing you want in arbitrage trading. 

Competition: As more people move into crypto trading, the more the competition, and the fewer arbitrage opportunities for everyone

Final Words 

Arbitrage trading is a worthwhile way to make extra money with crypto. As long as you play your cards smart – and quickly – you can make good bucks. But like anything, there are a few downsides. However, you win some and lose some. That’s just life. 

Categories
Forex Videos

Forex – Fed Saturates The Markets With Dollars – How Should You Trade The Dollar Now!


Fed saturates the markets with dollars – what next? 


In this session, we will be looking at the extraordinary amounts of US dollars, which have been printed by the federal reserve in America and flooded into the system to try and prop up the US economy during the coronavirus.

Since the pandemic began and started to bite in the United States, it is estimated that over 20% of all circulating US dollar bills were printed during this time.

 Although the federal reserve has publicly declared that their monetary policy has not been designed to save Wall Street,…..

….there is no denying from this chart that dollars,  which are required to buy United States stocks,  are finding their way into US stocks and indices, such as the Dow Jones Industrial Average Index shown here, which had climbed from the panic sell-off in March 2020 when the pandemic began to take a grip of the United States,  up to record highs of over 30 thousand.

Purely on a supply and demand basis,  the shock and magnitude of the influx into the market of the US dollar has gone a long way to shedding its market value against currencies, including the major currency pairs as shown here on this dollar index where it was at a high of 103.00 in March, and while the fed has been pumping dollars into the system, it has collapsed to 91.70 at the time of writing.

While the safety of gold saw investors take flight here during the latter part of March 2020, causing the precious metal to rise in value in a risk-off event during the early stages of the pandemic in the USA to a peak of over 2000 an ounce, and where traders have pulled back while shifting their focus to the US stock market, in a risk-off phase, and where gold currently sits around 1800 per ounce.

The federal reserve has been getting into the markets indirectly, via the backdoor, by talking to hedge funds, mutual funds, credit facilities, market makers, and commercial paper funding facilities, and instigated a huge emergency repo loan operation with the New York fed, where it is said that over 6 trillion dollars have as entered into circulation through this facility.

The Fed’s pumping of dollars into the market, where its value has crashed in value relatively over the last 100 years, has given fuel for the rise in interest for bitcoins and other cryptocurrencies and as we have seen gold and other precious metals, while investors try to hedge against dollar depreciation and inflation, as the dollar continues to lose value against other assets. 

 And by the time the new president-elect, Joe Biden, takes office, the two political houses in the USA, currently at loggerheads, will agree more stimulus, in the range of 1 to 2 trillion dollars, and where once this has been agreed, this will only pour more oil on the burning cauldron and the effect will likely be the US dollar’s further decline, with a knock-on effect being volatility in the financial markets, and higher prices for consumers.  

Categories
Crypto Daily Topic

What Really Is Selfish Mining: Will Bitcoin Survive This?

Mining is the process through which new Bitcoin blocks are generated. Individual nodes on the Bitcoin network race against time in a series of guesses for the right block. Due to the large size of the network and transaction load, this process is resource-intensive – it requires sophisticated computing equipment and consumes massive amounts of power. 

Selfish mining is when a miner withholds newly generated blocks then releases them to the public ledger when they have formed the longest chain. Other legitimate miners may join the selfish miner on their private network due to the possibility of higher returns. The practice is neither illegal nor disallowed, but selfish mining undermines Satoshi’s vision of decentralized production and distribution of money. 

How Selfish Mining Works

Mining involves solving complex cryptographic puzzles, which are guesses. Depending on the difficulty of the puzzle being solved, and the associated power costs, the reward you can earn from this process can vary greatly. As such, even if miners combine effort, the overall output for each miner is proportional to the individual effort invested. 

This was the case until researchers Ittay Eyal and Emin Gun Sirer discovered that miners could actually cheat the system by hiding the newly-generated blocks from the public blockchain. Transactions will still be verified, and new BTC generated because the newly-generated blocks are made available on the selfish miners’ private networks. By withholding the new blocks from the public blockchain, such miners circumvent the infrastructure restrictions that make mining resource-intensive and speed up the discovery process. 

Whatever makes selfish mining possible is a vulnerability on the Bitcoin network that uses the longest chain rule to indicate which chain to follow. Usually, the correct chain to follow is the one with the highest number of new blocks – in other words, the one with the highest proof of work. Since it is possible to withhold a block and release it after accruing several of them, one can always wait until they have several blocks then release them to the public blockchain. This will result in other miners following that chain and surrendering their earnings to the owner of this chain. 

How It Impacts Bitcoin’s Integrity

Undoubtedly, selfish mining poses a threat to Bitcoin’s integrity. Cryptocurrencies sell on the premise that they are decentralized and tamper-proof. Thus, the idea that a group of people can collude to subvert the system’s mechanics raises concern. 

Of particular concern is how selfish mining increases the possibility of a 51% attack. Over time, selfish miners can create mining pools with an ever-growing hash rate. As more parties join the pools, their chances of acquiring majority power increases. Eventually, this may allow them to block other miners, reverse transactions, exclude transactions, and so on. However, considering how large the Bitcoin network is, there is only a low likelihood that a mining syndicate will gather enough resources to take most of the power. Additionally, Bitcoin enthusiasts believe that the motivation for selfish mining is lower than the rewards. If other parties decide to join selfish miners in their pools, they might eventually be unable to recover the investment they made in their mining operation.

The practice of selfish mining is also wasteful in that miners spend serious resources trying to find a block that another miner is withholding. Thus, it is only economical for all miners to just play by the rules. In short, this is neither a sustainable nor responsible way to generate earnings on the Bitcoin network. 

How Selfish Mining Undermines the Decentralization Philosophy 

Decentralization is at the heart of Bitcoin’s philosophy. Satoshi envisioned that no person or group of people would have the authority to control the production or distribution of coins on the network. 

When a selfish miner generates a new block, their chain will be shorter than the public blockchain. However, if they keep hoarding blocks, their chain might eventually become longer than the one on the public blockchain. Naturally, honest miners will be inclined to join the private chain to earn more because the private network has a better chance to realize new blocks faster. If the selfish miner keeps ‘recruiting’ rational miners to their pool, they could eventually control the majority of the public blockchain. In essence, they will have all the power to generate and distribute Bitcoin. 

Is It Anything New?

Selfish mining is not entirely new, and for that reason, it should be particularly worrying to Bitcoin users. At the moment, two-thirds of all Bitcoin generated is mined in China, which is not a result of selfish mining. It just happens that it is easier to access ASICs in the country, plus electricity is way cheaper there than in other mining locations. As such, concerns have been raised about whether China has had a mining monopoly of sorts. Whatever the case, there is no indication that Chinese miners are working as a single enterprise. 

Are There Consequences?

If only a few miners adopt selfish mining, the overall impact on the blockchain network will be negligible. On the other hand, if all miners, hypothetically, take up selfish mining, their efforts will cancel out. Renowned economists have reiterated that it seems to make sense, while theoretically, the practice is not economically viable. Paul Sztorc, a popular economist, thinks that selfish miners will lose motivation upon realizing they are only backstabbing each other. In conclusion, selfish mining does not have enough economic motivation to become a widespread practice. 

Also, this activity may adversely impact Bitcoin’s reputation, which may cause its price to drop. Consequently, selfish miners will earn more Bitcoins but ones that are devalued. 

What’s the Future of Selfish Mining?

Selfish mining is likely to remain in theory or limited practice due to the reasons we’ve mentioned earlier. As we have seen, the major challenge with this practice is that if it becomes widespread, it will turn into a dirty game as selfish miners will be competing in hoarding new blocks. While this decreases the economic motivation, it might not exactly protect the Bitcoin network from the inefficiencies created. 

So, what would be a better solution? A research paper has proposed a scheme for penalizing nodes that withhold new blocks. The proposal ensures that miners who generate new blocks and fail to publish them on the blockchain have their mining rewards reduced. This would be an ideal penalty for selfish miners, but it appears as if the practice is not a huge threat currently.

Final Thoughts 

Selfish mining can allow mining syndicates to increase their revenue by always creating the longest chain and attracting other miners to their pools. While the threat is realistic, the likelihood of widespread selfish mining is diminished. The practice is wasteful, and if it becomes widespread, all miners lose their rewards. As we wait to see if indeed the threat will ever become substantial, Bitcoin users can rest easy knowing that Satoshi’s vision of decentralized production and distribution of money lives on. 

Categories
Cryptocurrencies

Just How Promising is the NFT Market?

The NFT market is the collection of all NFT trades. So, let’s define NFTs first. An NFT (Non-Fungible Token) is a special kind of crypto token that just cannot be exchanged for another (possibly) equivalent token. 

In the cryptocurrency universe, there are coins, tokens, and other miscellaneous digital assets; and there are non-fungible tokens. Of all these, NFTs stand out for one cool reason: each token is different and can be uniquely identified. Let’s contrast them with currencies – a dollar bill can be exchanged for another dollar bill to put this into perspective. But it wouldn’t be that straightforward exchanging a diamond ring with another. 

Crypto Tokens Primer

Before diving deep into NFTs and their promising future, let’s first review cryptocurrency tokens from a wider perspective. 

Generally, a crypto token is a digital representation of an asset or a specific utility. For instance, such a token could represent redeemable loyalty points. Typically, these tokens can be exchanged for cryptocurrencies, fiat currency, or some special privileges. Like all other cryptocurrencies, they reside on the blockchain – which allows them to leverage all the benefits of distributed ledgers.

NFT Applications

One of the things that make the NFT market potentially explosive is its increasing adoption in various applications. Within the last few years, developers have come up with NFT-based solutions for different use cases. Let’s look at a few of these:

  • Crypto art – This emerging concept is a blend of art and blockchain technology. The idea has been used to help artists claim ownership of their works, create currencies specifically for buying artworks, and verify artwork’s authenticity, among other uses. Judging by the number of startups, there is growing interest in the use of NFTs in art. 
  • Digital collectibles – Collectibles such as trading cards have been developed based on NFTs. The Rare Pepes and Age of Chains projects are good examples of how NFTs have inspired the generation and distribution of digital collectibles. 
  • Gaming – The gaming industry is undoubtedly seeing unprecedented disruption levels, thanks to the invention of NFTs. There are already a myriad of NFT use cases within the gaming sector, and this list is growing. To understand the weight of NFTs’ potential in gaming, note that gaming activity on Cryptokitties (an Ethereum-based game that allows players to purchase, collect, breed, and sell virtual cats) once caused a traffic jam on the Ethereum blockchain. 

Why NFT Is set for Exponential Growth

As of June 2020, the total sales of NFTs had reached $100 million. The 1-year market performance of NFTs (between November 2019 and November 2020) has not been characterized by dramatic rises and falls – as has been the case with some of the major cryptocurrencies. Even so, the NFT market has shown a slow but steady growth within that period. Developments in the sector suggest that NFTs could only grow faster. Below are the top five reasons why you should think so too.

#1: Scarcity 

NFTs are designed with scarcity at the very core of their philosophy. Tokens such as trading cards and in-game assets exist in minimal quantities. For instance, each virtual cat on Cryptokitties is unique. This means that if you fancy the cat and really want to have it, you must be willing to spend some coins. This would not be the case if you could duplicate the cat or if all cats were equal.

As crazy as the idea sounds, the game’s logic’s psychological aspects make it work just as intended. The idea that there is only one unit of a certain item drives its demand.

#2: Fun and Simplicity

Compared to cryptocurrencies, NFTs are fun and simple to understand. These two features make it easy to learn and adopt NFTs for different uses. There is a multitude of NFT users who don’t even know they are enjoying the fruits of blockchain. In contrast, most cryptocurrency users are forced to learn some of the hard stuff about how crypto’s work is like picking a good wallet, avoiding scams, etc. In short, NFTs were invented (or have been adapted) majorly for fun use. 

Needless to say, the increasing use of NFTs in gaming will promote its adoption. Games have been used to promote the adoption of computers, health interventions, learning activities, and much more. These are all indications that the use of NFTs in gaming will give its adoption a power boost and ultimately contribute to this market’s growth.

#3: High Acceptance in Asia

Asia plays a crucial role in the gaming world. Even before cryptos came into existence, South Korea’s gaming industry had already invented the concept of redeemable in-house currencies, something that could allow you to convert in-house currencies to South Korean Won. Many fun, cute little characters (including many of the emojis we know today) were born in Japan.

The fact that most NFT projects (games in particular) target the Asian market means that they are likely to fit naturally into the region’s cultural context, and this will organically drive up the growth of the NFT market. 

#4: Attractive Investment

NFTs present themselves as equally attractive (if not more) as cryptocurrencies. Part of this high appeal comes from their simple nature. NFTs also highly resemble real-world valuables, which investors are already familiar with. An example is rare artworks whose valuation is widely criticized for being arbitrary. Factors such as who previously owned an artwork, the reputation of the gallery where it is curated, its provenance, etc., can exponentially drive up the artwork’s value. 

Back to NFTs – developers can easily create crypto artworks, such as game characters, and assign them these “special attributes.” In case you’re wondering why everyone won’t just create their characters and make money, well, it all boils down to scarcity. And this heavily depends on developer’s/investor’s creativity.  

#5: Mainstream Adoption 

NFTs are making their debuts in different sectors of the mainstream economy, and they are already creating a frenzy. Nike, for example, has filed a patent for its proposed CryptoKicks – physical shoes with digital identities. CryptoKicks will allow Nike’s customers to set apart genuine sneakers from knock-offs. Since it will be possible to trace a pair of sneakers’ ownership history, we might start seeing high-stake auctions and the like. The bottom line is, NFTs have officially entered the mainstream economy, and it won’t be the same again. 

Final Thoughts

NFTs are among the latest inventions on the blockchain. While they have been adapted for several utilities, their use in gaming is particularly notable. To date, NFTs worth $100 million have been traded – which is a sign of investor confidence in the relatively new concept. Also, 2020 has been a fairly good year for the sector, which has so far recorded a slow but steady growth. NFTs are easy to learn and use, which gives them an edge when it comes to quick adoption among user communities. Coupled with scarcity, high adoption in Asia, its attractiveness to investors, and increasing mainstream adoption, the future of NFTs is highly promising. Naturally, the next thing to look out for is how to take advantage of this promising future. 

Categories
Forex Fundamental Analysis

GBP/USD Global Macro Analysis – Part 3

Introduction

The exogenous analysis will cover international aspects that impact both the UK and the US and how they influence the GBP/USD price. These factors include:

  • Good trade balance
  • Interest rate differential
  • GDP growth differential

GBP/USD Exogenous Analysis – Summary 

The score for the exogenous analysis of the GBP/USD pair is -3. This deflationary score implies that we should expect that the pair will adopt a bearish trend in the near term.

Goods trade balance

The goods trade balance is the difference between the value of goods a country imports and its exports. When the balance is negative, it means that the country is importing more than it exports. If the goods trade balance is a surplus, it means that a country’s value of exports is more than its imports.

In September 2020, the UK’s goods trade deficit increased to £9.35 billion while that of the US increased to $80.29 billion. Based on the correlation between t goods trade balance and the price of GBP/USD, we assign it an inflationary score of 2. It means if the goods trade balance keeps widening between the two countries, we can expect that the GBP/USD pair will continue being bullish.

The UK and the US Interest rate differential

This is the difference between the interest rate set by the Bank of England and the interest rate fixed by the US Federal Reserve. Capital tends to flow towards the economy with a higher interest rate since investors are bound to earn higher returns.

The BOE has set the interest rate at 0.1%, while the FED has it at 0.25%. therefore, the interest rate differential for the GBP/USD pair is 0.1% – 0.25% = -0.15%. Based on the interest rate differential, the GBP/USD pair should have a bearish trend. Therefore, we assign it a score of -3.

GDP growth differential

The actual size of the GDP varies from country to country. However, we can compare the rate at which they grow and analyse the impact of this growth rate on the exchange rate.

In the third quarter of September 2020, the UK GDP expanded by 15.5% while that of the US expanded by 33.1%. Over the years, we can observe that the US GDP growth has been at a faster rate than that of the UK. In this case, we assign a deflationary score of -2 on the UK and the US GDP growth rate differential. That means if the US economy keeps expanding at a faster rate, we can expect a bearish GBP/USD in the near term.

Our technical analysis also supports the forecasted bearish trend in the near term. Note that the GBP/USD pair has failed to breach the upper Bollinger band forming a resistance level for the past two years.

We hope you found this analysis useful and informative. Let us know if you have any questions by commenting below. All the best.

Categories
Forex Fundamental Analysis

GBP/USD Global Macro Analysis – Part 1 & 2

Introduction

To properly understand the dynamics of the price of the GBP/USD pair, we’ll conduct endogenous and exogenous analyses of the UK and the US economies.

The endogenous analysis will focus on the significant fundamental economic indicators that drive economic growth in either country. The exogenous analysis will dig deeper into how both the US and the UK economies interact with each other in terms of international trade that impact the currency exchange.

Ranking Scale

Both the endogenous and the exogenous factors that we will analyse will be ranked on a sliding scale from -10 to +10. A negative score means that the indicator resulted in currency depreciation, while a positive score implies that it led to currency appreciation.

USD Endogenous Analysis – Summary

The USD endogenous factors recorded a score of -19.1, implying a deflationary effect on the USD. This essentially means that according to these indicators, the USD has lost its value since the beginning of this year.

You can find the complete USD Endogenous Analysis here.

GBP Endogenous Analysis – Summary

The endogenous analysis of the UK economy results in an expansionary score of 2. Therefore, we could expect the GBP increased in 2020.

Markit Manufacturing PMI

This is a survey done on about 600 purchasing managers in the manufacturing industry, who rate the level of the business environment such as prices, new orders, inventories, supply deliveries, labour conditions, and production levels.

This is a leading indicator for the economy because businesses react almost instantly to the changing operating environment, and the purchasing managers have the most relevant insight. In November 202, the UK Manufacturing PMI was 55.2, showing that the economy is undergoing a sustained recovery. Due to its low correlation with the GDP, we assign an inflationary score of 3.

UK inflation

The CPI is based on a monthly survey done by the Office for National Statistics. This is done by comparing the current average of sample consumer items by the previous month’s prices. The BOE uses the data to adjust interest rates and QE levels to set inflation targets for the economy.

Rising inflation levels lead to higher interest rates, which makes CPI a vital currency valuation indicator. The UK inflation rate increased by 0.7% in October 2020 but is still lower than the rate in the pre-pandemic period. Based on our correlation analysis. We assign it a score of -4.

Manufacturing Production

It measures the change in the total value of inflation-adjusted output by the manufacturers in the whole economy. It is a leading indicator of the economy’s performance since production levels adjust quickly to the business cycles and heavily dependent on consumer conditions like employment changes and earning levels.

Manufacturing contributes about 80% of the UK’s industrial output and accounts for up to 42.4% of GDP changes. The year-on-year manufacturing production change in September 2020 was -7.9%. This marks the smallest decline since the onset of the coronavirus pandemic. Due to its high correlation with GDP, we assign it an inflationary score of 6.

Claimant count change

It measures the change in the number of people who are seeking unemployment benefits. Hence, it is the primary indicator of unemployment levels, which makes it a vital signal of consumer expenditure levels and labour market conditions. In the UK, claimant count change is considered the best measure of the employment situation, and it accounts for 30% of changes in the GDP.

In September 2020, the number of people in the UK who claimed unemployment benefits dropped by 29800. However, the unemployment rate remains at yearly highs of 4.8%. For this reason, we assign a score of -5.

Industrial Production

It measures the change in output from the mines, manufacturers, and utilities, adjusted for inflation. While manufacturing makes up 80% of the industrial production, mines and utilities make up 20%, and their effects on the real economy are thus overshadowed.

It is a significant leading indicator of the economy’s health since industrial activities correspond to labour market conditions and sensitive to business cycles. In September 2020, the UK industrial MoM production increased by 0.5%. However, on a YoY basis, it is down 6.3% from September 2019. In this case, we assign industrial production a score of -3.

Retail Sales

It measures the change in the inflation-adjusted value of all sales at the retail level in the whole economy. It is the primary measure of how much consumer expenditure accounts for most of the country’s economic activity.

In October 2020, the UK MoM retail sales increased by 1.2%, which is the 6th consecutive increase in retail sales from the slump recorded at the height of the coronavirus pandemic. Based on its correlation with GDP, we assign retail sales an inflationary score of 4.

Markit Services PMI

This is a survey on about 400 purchasing managers in the services industry, who rate the business environment using factors such as employment, new orders, pricing, inventories, and supplier deliveries. A score of above 50 signifies an expansion, while below 50 indicates a contraction in the services industry.

In November 2020, the Marking UK Services PMI was 45.8 – a significant drop from 51.4 in October. Although the Services PMI has increased from the April lows, it is still lower than in January 2020. Combined with its low correlation with the UK GDP, we assign a deflationary score of -3.

United Kingdom Public Sector Net Debt to GDP

This is also called Government Debt to GDP Ratio. Most investors, bilateral and multilateral lenders use this ratio to determine a country’s ability to service any debt they take on. Naturally, when the ratio is higher, it means that the government is piling on more debt, but the GDP is not increasing at the same rate. Since higher GDP would mean higher sources of revenue, if the GDP is not increasing at the same pace as the amount of debt, it implies that the government might struggle with debt repayment.

In 2020, the UK Public Sector Net Debt to GDP is projected to reach historic highs of 96.6%. This increase is mainly attributed to governments’ efforts to prop up the economy through aggressive expansionary policies during the pandemic. Based on our correlation analysis, the increase in the United Kingdom Public Sector Net Debt to GDP in 2020 served its purpose to avoid irreversible recessions. We, therefore, assign an inflationary score of 4.

In our next article, we will analyze the Exogenous factors of both USD and GBP to come to an appropriate conclusion.

Categories
Forex Fundamental Analysis

Understanding ‘US TIC Net Long-Term Transactions’ Fundamental Forex Driver

Introduction

When foreign investors prefer investing in the domestic economy, they strongly believe that they can get better returns than in any other market. The US is considered the leading economy in the world; therefore, hence US securities are highly trusted by most investors. Similarly, since the USD is the most traded currency in the international market, its value would fluctuate depending on investors’ optimism in the capital and money market of the US.

Understanding US TIC Net Long-Term Transactions

As an economic indicator, the US TIC Net Long-Term Transactions measures the net flow of financial securities in the US economy. The financial securities under consideration include; Treasury and agency securities, corporate bonds, and equities.

Therefore, the ‘net’ in the US TIC Net Long-term Transactions means the difference between US financial securities’ gross purchases and sales by foreign investors. This data provides a vivid overview of the participation of foreigners in the US capital and money markets. When the US TIC net long-term transactions data is positive, it means that more foreigners are buying into the US economy than those selling. Similarly, when the US TIC net long-term transactions data is negative, it means more foreigners are exiting the US economy compared to those buying into the economy.

So, what is TIC? TIC stands for Treasury International Capital, a financial report from the US Department of Treasury. It shows the flow of capital into and out of the US in both the short and long term. The TIC report is published monthly and quarterly; it details the flow of capital explicitly in the sale and purchase of US financial securities.

According to the TIC reports, the classification of foreigners does not necessarily mean individuals and institutions from abroad. Foreigners in this context also include foreign branches of US institutions. For example, if a US bank has a branch in London, that branch is considered a foreigner.

Using US TIC Net Long-Term Transactions in Analysis

The main point of the US TIC Net Long-Term Transactions Report is it shows the demand for USD stocks and investors’ sentiment towards the US economy. Let’s break down the US TIC Net Long-Term Transactions depending on the market.

If the US TIC net long-term transactions, it could signal that the US treasuries and bonds are in high demand. First, you should know why investors would demand more of US treasuries. The US treasuries and bonds are considered to be risk-free. The reason for this is because investors are guaranteed to receive a fixed amount of coupon rate until maturity.

More so, the US treasuries also come with an inherent guarantee that the US government will not default the interest payment and that investors will receive their principal upon maturity. Furthermore, the US’s interest rates are relatively higher than other developed nations; this means that investors in the US government securities stand to profit more by investing in the US.

The level of purchase of the US TIC net long-term transactions also says a lot about the expected inflation. In the long term, most investors worry that if the rate of inflation increases rapidly, it will reduce their profits. Thus, any investor would prefer to invest in a country with stable inflation, which would ensure that their returns are not severely affected.

Therefore, when the US TIC net long-term transactions are positively increasing, it means that foreign investors expect the US economy to be relatively stable over the long term. It is taken as confidence that the Federal Reserve will keep long term inflation in check.

Source: St. Louis FRED

Conversely, if the US TIC net long-term transactions are negative, it implies that there are more sellers than buyers. This scenario could imply that foreign investors believe that the long-term inflation rate will exceed the rate of returns they will receive from their investments. Since their expected real returns will be diminished, they prefer to invest their money in other economies.

The US TIC net long-term transactions can also be used to show impending recessions and optimism about economic recoveries. Let’s use the recent coronavirus pandemic as an example. In the first quarter of 2020, the US TIC net long-term transactions plunged to historic lows. It means that more foreign investors were exiting the US capital and money markets and presumably investing their funds elsewhere. This net outflow was a result of the uncertainty of what the pandemic might bring.

 Source: Trading Economics

In the second quarter of 2020, the US TIC net long-term transactions jumped back to positive territory, implying that foreign investors were pouring back into the US capital and money markets. Note that this net inflow coincides with the passing of the $2 trillion stimulus package. Therefore, we can argue that the net inflow of US TIC net long-term transactions was a vote of confidence by foreign investors that in the long term, the US economy will rebound from the pandemic-induced recession.

Impact of US TIC Net Long-Term Transactions on Currency

The impact of the US TIC net long-term transactions on the USD is pretty straightforward. In the international market, foreigners are obliged to convert their currencies into the USD. Therefore, an increase in the US TIC net long-term transactions means that the demand for the USD increases as well. Consequently, the increase in the demand for the USD makes it appreciate relative to other currencies.

Conversely, when US TIC net long-term transactions show net outflows, the USD will depreciate relative to other currencies. This is because when foreigners sell the US financial securities, they will convert the USD to their domestic currencies when repatriating their money.

Data Sources

The US Department Of The Treasury is responsible for collating and publishing the monthly and quarterly US TIC net long-term transactions. Trading Economics has detailed historical data on the US TIC net long-term transactions.

How US TIC Net Long-Term Transactions Release Affects The Forex Price Charts

The latest monthly publication of the US TIC net long-term transactions was on October 16, 2020, at 4.00 PM EST. The release can be accessed at Investing.com. Moderate volatility on the USD can be expected when the US TIC net long-term transactions report is released.

In August 2020, the US TIC net long-term transactions were $27.8 billion compared to $11.3 billion in July 2020. In theory, this increase should be positive for the USD.

Let’s see how this release impacted the GBP/USD pair.

GBP/USD: Before US TIC Net Long-Term Transactions Release on October 16, 2020, 
just before 4.00 PM EST

Before the publication of the US TIC net long-term transactions, the GBP/USD pair was trading in a subdued uptrend. The 20-period MA was almost flattened with candles forming just above it.

GBP/USD: After US TIC Net Long-Term Transactions Release on October 16, 2020, 
at 4.00 PM EST

After the publication of the US TIC net long-term transactions, the pair formed a 5-minute bearish candle. Subsequently, GBP/USD adopted a bearish trend showing that the USD significantly strengthened against the GBP. The 20-period MA steeply fell as candles formed further below it.

Bottom Line

From this analysis, it is evident that the US TIC net long-term transactions release has a significant impact on the forex market. The report shows the confidence of investors in the US economy and the demand for the US Dollar.

Categories
Chart Patterns Forex Daily Topic

Chart Patterns: Ascending Triangles

Of all the bullish continuation patterns that exist, few are as sought after as the ascending triangle. Like all triangle patterns, their development and construction are dependent on two trendlines that intersect and form an apex. The two primary identifying conditions of an ascending triangle I a flat, horizontal top and an upward sloping trendline.

Ascending Triangle
Ascending Triangle

In addition to the two trendlines, there is a specific kind of behavior that the candlesticks must perform. The upper trendline and the lower trendline must be touched at least twice. Ideally, and according to Bulkowski, there should not be much open space inside the triangle. The same volume behavior that occurs in other triangles occurs here in the ascending triangle: price often breaks out in the final 2/3rds of the triangle, and volume decreases before the breakout. The psychology behind the formation of the ascending triangle is essential to understand. The pattern represents an apparent battle between longs and shorts. Short traders are under the impression that because the resistance level has been tested and has held, it will remain stronger. Long traders are under the impression that prices will move higher because of the formation of higher lows and an upward sloping trendline. Ultimately, shorts cover very quickly, just before or immediately after the breakout of the upper resistance.

Bulkowski recorded that, in equity markets, the breakout direction of an ascending triangle is upwards 64% of the time. Dahlquist and Kirkpatrick recorded that upwards breakouts occur 77% of the time. Interestingly, the performance of this pattern is roughly average across all patterns – this is contrary to the belief of many traders who self-report a high positive expectancy of upwards breakouts. Dahlquist and Kirkpatrick did warn that there are many false breakouts and that failure rates are between 11% and 13%.

As with any pattern, it is essential to pay attention to price action first and then find tools to help you filter whether an entry at the breakout is appropriate. Additionally, be wary of throwbacks as they are frequent over 50% of the time – many conservative traders wait for a retest of the breakout to confirm a valid break from the ascending triangle.


Sources:

Kirkpatrick, C. D., & Dahlquist, J. R. (2016). Technical analysis: the complete resource for financial market technicians. Upper Saddle River: Financial Times/Prentice Hall.

Bulkowski, T. N. (2013). Visual guide to chart patterns. New York, NY: Bloomberg Press.

Bulkowski, T. N. (2008). Encyclopedia of candlestick charts. Hoboken, NJ: J. Wiley & Sons.

Bulkowski, T. N. (2002). Trading classic chart patterns. New York: Wiley.

Categories
Crypto Daily Topic Cryptocurrencies

How to Mine Litecoin: No One Will Ever Tell You This

Litecoin is one of the most popular cryptocurrencies today. The currency is a clone of Bitcoin and appears to ride on the popularity of the pioneer cryptocurrency. However, the crypto has its own merits – like being a ‘lighter’ version of Bitcoin and thus being used in day-to-day transactions. Litecoin is faster than Bitcoin – having a block time of 2.5 minutes compared to Bitcoin’s 10 minutes, meaning it’s quicker and easier for Litecoin miners to make money. 

Litecoin was created in 2011 by Charlie Lee, a former Google engineer. He modeled it after Bitcoin but with certain modifications intended to help it scale compared to Bitcoin. At the time of writing, the currency has a per-token value of $69.54 and a market rank of #7 with a market capitalization of 4.59 billion. 

In this piece, we’ll take a look into the nitty gritties of mining Litecoin.  

#1. Mining equipment

In the early days of Litecoin, the cryptocurrency could be mined using CPUs and GPUs. Litecoin uses the Scrypt hashing protocol – the first successful cryptocurrency to use it. Lee opted for Scrypt instead of Bitcoin’s SHA-256 due to the former being lighter and also because”using Scrypt allows one to mine Litecoin while also mining Bitcoin.” 

However, it’s no longer possible to turn a profit when mining Litecoin with CPUs and GPUs. This is because as competition has ramped up for the currency, mining difficulty has increased, requiring miners to use application-specific integrated circuits (ASICs) developed specifically for the currency. One of the most popular ASICs for Litecoin include Bitmain’s Antminer and LTCMaster. ASICs tend to go for around $1,000 for older models and around $2,000 for newer models. It’s best to go for the newer models, which are more effective. 

 #2. Should you join a mining pool? 

Once you’ve identified which hardware to use, the next decision will be to mine solo or join a mining pool. A mining pool is a group of miners who share computing power to multiply the chances of finding a block and earn mining rewards. Mining alone means you will get to keep all the mining rewards plus a fraction of the transaction fees. (The current mining rewards are 12.5 LTC per block. This will be halved in the next Litecoin halving, which will happen in 2023). And even then, this will require that you have massive hash power (multiple ASIC machines). Mining with a single ASIC is almost guaranteed never to turn a profit. 

By contrast, concentrated computing power in pool mining makes it many times easier for the pool to discover new blocks and attain a reward. The reward is then distributed according to the contribution of each miner. Bear in mind pool mining itself is not guaranteed to turn a profit since it depends on chance, but earnings via a pool are more steady than solo mining. 

Before you join a mining pool, make sure to investigate it thoroughly. Some pools out there are outright scams, while others are just plain shady. Also, it’s not uncommon for a mining pool to fall victim to hacks. So always check a pool’s security history and how they handled any breaches, reputation, member reviews, and management team. Also, try not to keep large amounts of your proceeds with the pool. It’s good practice to transfer proceeds to your wallet as soon as possible. 

Some of the most trusted and popular Litecoin pools out there include F2Pool, LitecoinPool.org, ViaBTC, and ProHashing.

Litecoin: Cloud Mining 

ASICs and pools are not for everyone. Maybe you want to mine Litecoin and don’t have the means or desire to splurge on expensive hardware. Well, you’re in luck because there’s an option of cloud mining that allows you to pay a remote data center to do the mining for you.

With this option, you will be required to put up a certain amount of money – but not nearly as much as you would for an ASIC – to get access to the cloud mining platform. The more you invest, the more you stand to gain from the platform. 

We can’t stress this enough – cloud mining is even more susceptible to scams than mining pools. There are individuals out there who are happy enough to take strangers’ money without an actual mining operation going on on their side. This behooves you to do serious research before getting entangled with any cloud miner. One of the most reputable cloud mining sites is Scotland-based Hashflare, which also has data centers in Estonia and Iceland. Hashflare has been around since 2014 – demonstrating its credibility and staying power. 

Wallets 

The last thing you need to consider is where to store your Litecoin. You have a variety of options starting with the Litecoin Core Client. This is a wallet by the Litecoin Foundation and is open-source, feature-packed, and updated regularly to make it more robust and easier to use. With the Litecoin Core Client, you can store, send, and receive Litecoin as well as view the transaction history of the blockchain. To use this wallet, you have to download the full blockchain on your computer. Of course, it will take up a lot of space, but it pays a lot of security dividends in the long run. The wallet supports Windows, MacOS, and Linux. By using Litecoin Core, you also contribute to the network’s security and decentralization since you’re running a ‘full node.’ 

You also have the option of a cold storage wallet. A cold wallet is one that’s not connected to the internet. This means it is unhackable, and hence very safe. If you have a large sum of Litecoin, a cold storage wallet is your best go-to option. There are also paper wallets that constitute a physical paper in the form of a QR code or a string of alphanumerics. A paper wallet is safer than an online wallet, but it’s vulnerable to theft and damage through fire, water, and wear and tear. You can increase your paper wallet security by laminating it and putting it in a safe place that only you know about. These days, people even strongly advocate for ‘brain wallets,’ which constitute memorizing a seed phrase that you can use to recreate your private key. Obviously, a brain wallet is the most secure of all these options.

Other people choose to keep their crypto funds on exchanges. Exchanges have the advantage of quickly swapping your crypto for fiat. However, this option is not recommended. That’s because exchanges are famously the target of hacking, and you can lose your money in the case of a security breach. Also, you have limited control over your Litecoin in such a wallet. 

Final Thoughts 

Litecoin is one of the most relevant cryptocurrencies, and investing in it through mining is a savvy move. Of course, there are risks to every profitable endeavor, so make sure to do your due diligence before you go all in.