Introduction
Some authors label this topic as Money Management or Risk Management, but this misses the point. Money Management doesn’t tell much about what it does, and Risk Management seems more related to risk, which has been discussed on the subject of cutting losses short and let profits run.
However, Van K. Tharp has hit the point: He calls it position sizing, and it tells us how much to trade on every trade and how this is related to our goal settings and objectives.
1. Risk and R
In his well-known book Trade your Way to your Financial Freedom, Van K. Tharp says that a key principle to success in trading is that the investor should always know his initial risk before entering a position.
He suggests that this risk should be normalized, and he calls it R. Your profits must also be normalized to a multiple of R, our initial risk.
The risk on one unit is a direct calculation of the difference in points, ticks, pips, or cents from the entry point to the stop-loss multiplied by the value of the minimum allowed lot or pip.
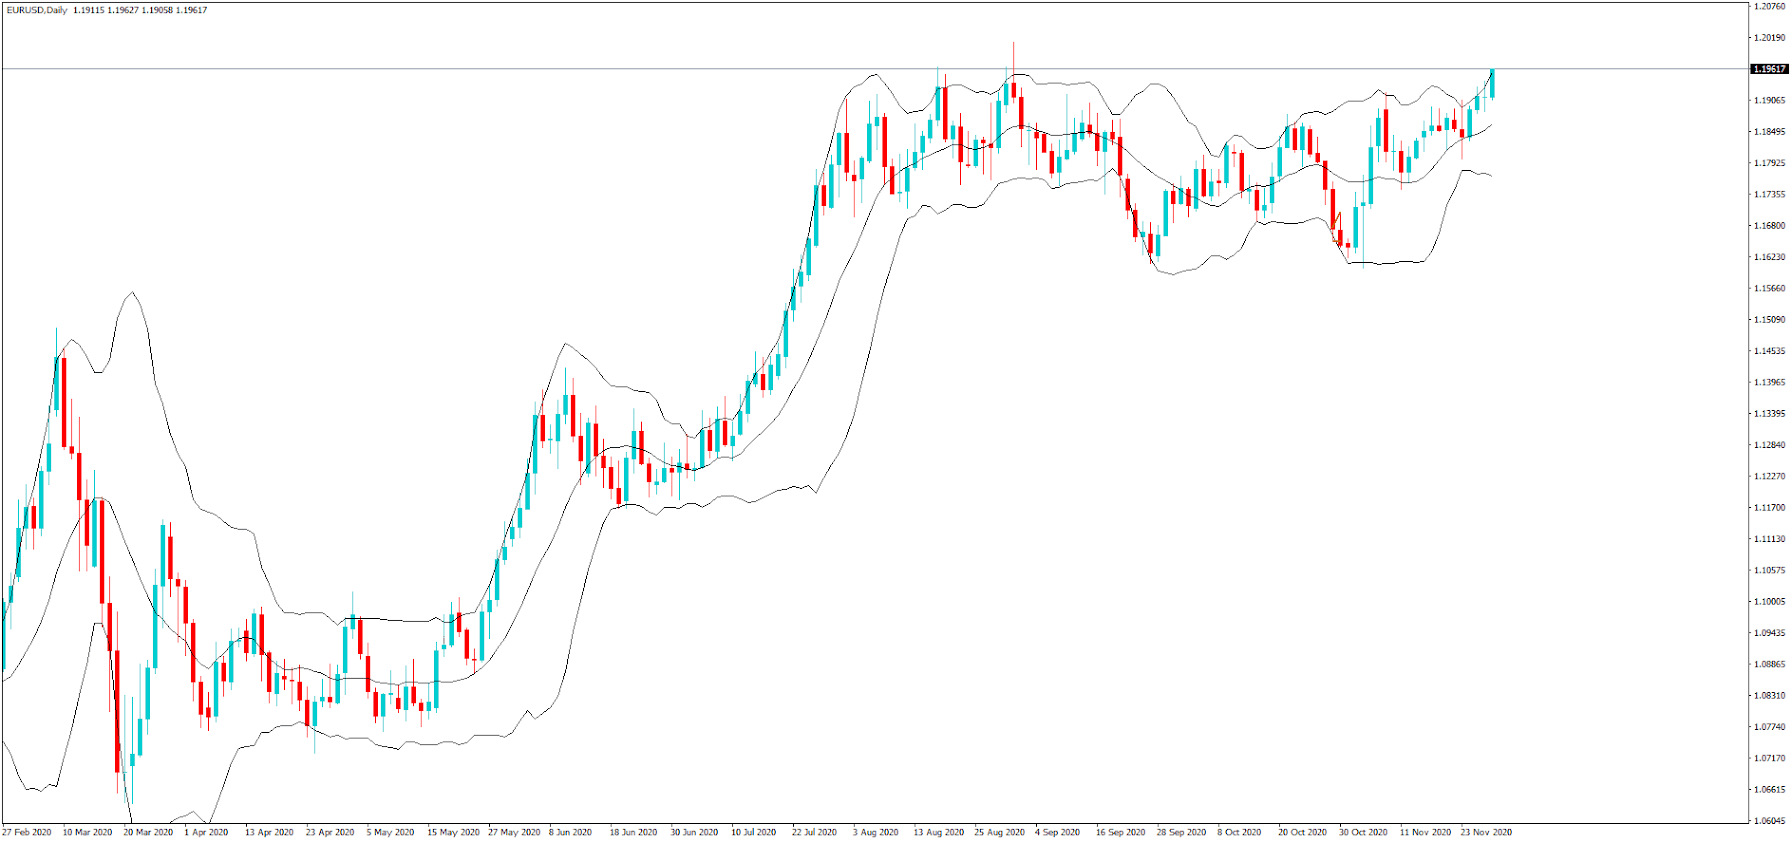
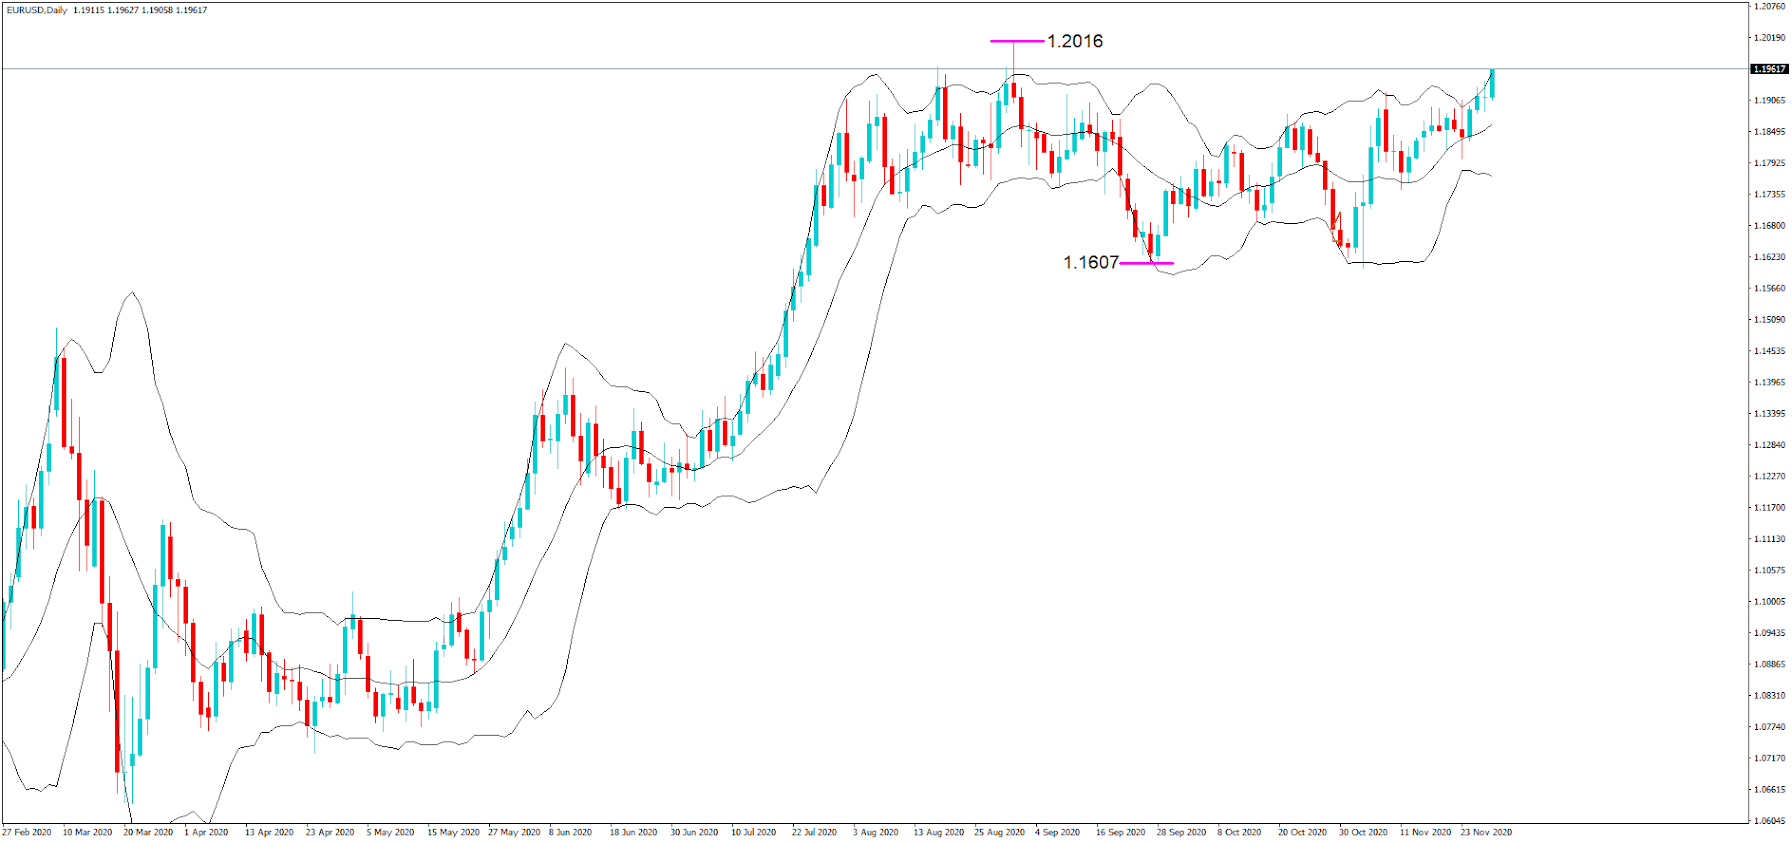
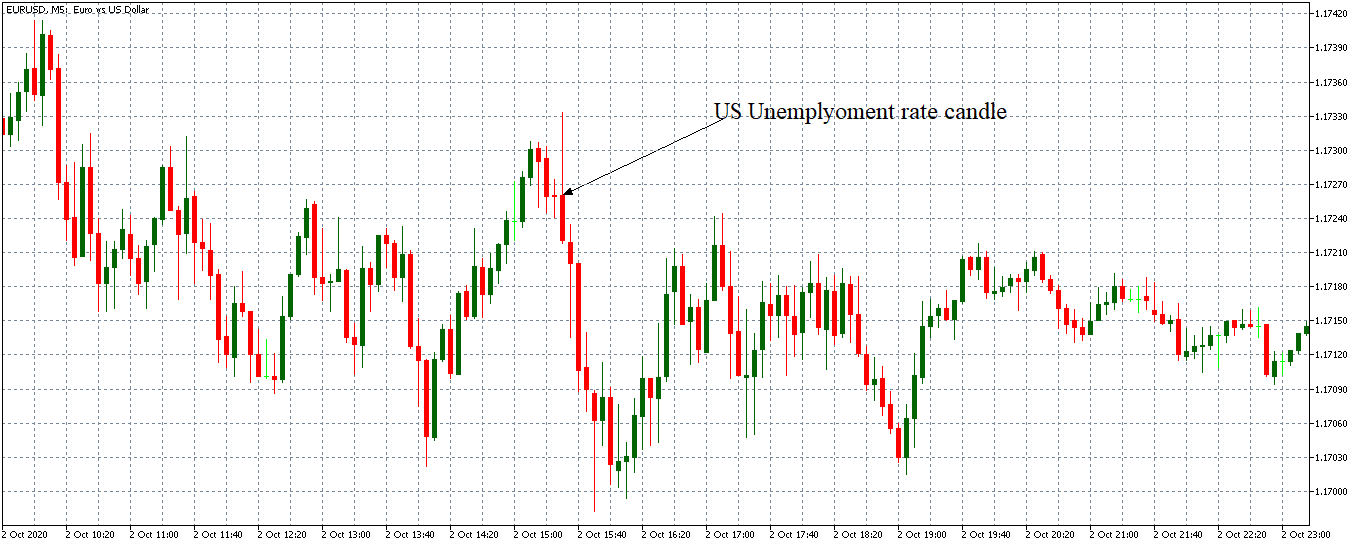
Consider, for example, the risk of a micro-lot of the EUR/USD pair in the following short entry:
        Size of a micro-lot: 1,000 units
                Entry point: 1.19344
                  Stop loss: 1.19621
Entry to stop-loss distance: 0.00277
Dollar Risk for one micro-lot: 0.00277 * 1,000 = $ 2.77
In this case, if the trader had set his $R risk – the amount he intends to risk on a trade – to be $100, what should be his position size?
Position size: $100/$2.77= -36 micro-lots (it’s a short trade)
Using this concept, we can standardize our position size according to the particular risk. For instance, if the unit risk in the previous example were $5 instead, the position size would be:
$100/5 = 20 micro-lots.
We would enter a position with a standard and controlled risk independent of the distance from entry to stop.
2. Profit targets as multiples of R
Our profits can be normalized as multiples of the initial risk R. It doesn’t matter if we change our dollar risk from $100 to $150. If you keep our records using R multiples, you’ll get a normalized track record of your system.
With enough results, you’ll be able to understand how your system performs and, also, able to measure its statistical characteristics and its quality.
Values such as Expectancy (E), mean reward to risk ratio(RR), % of gainers, the number of R gains a system delivers (R multiple) in a day, week, month or year.
Knowing these numbers is very critical because it will help us to achieve our objectives.
You already know what Expectancy (E) is. But the beauty of this number is that, together with the average number of trades, it tells you the R multiple your system delivers in a time interval.
For example, let’s say you’ve got a system that takes six trades a day, and its E is 0.45R. This means it makes $0.45 per dollar risked.
That means that the system also delivers an average of 0.45×6R=2.7R per day and that, on average, you’d expect, monthly, 54R.
Let’s say you wanted to use this system, and your monthly goal is $6,000. What would your risk per trade be?
To answer this, you need to equate 54R = $6000
So your risk per trade should be set to:
R= 6000/60 = $111.
Now you know, for instance, that you could achieve $12,000/month by doubling our risk to $222 per trade and $24,000 if you can raise your risk to $444 per trade. You have converted a system into an exponential money-making machine, but with a risk-controlled attitude.
3. Variability of the results
As traders, we would like to know, also, what to expect from the system concerning drawdowns.
Is it normal to have 6, 10, 15, or 20 consecutive losses? And, what are the chances of a string of them to happen? Is your system misbehaving, or is it on track?
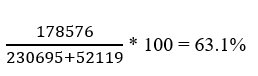
That can be answered, too, using the % of losers (PL).
Let’s consider, as an example, that we have a system with 50% winners and losers.
We know that the probability of an event A and an event B happening together is the probability of A happening times the probability of B happening:
ProbAB = ProbA * ProbB
For a string of losses, we have to multiply the probability of a loss by itself the number of times the streak duration.
So for a n streak:
Prob_Streak_n = PL to the power of n = PLn
As an example, the probability of 2 consecutive losses for the system of our example is:
Prob_Streak_2 = 0.52
= 0.25 or 25%
And the probability of suffering 4 consecutive losses will be:
Prob_Streak_4 = 0.54
= 0.0625 or 6.25%
For a string of six losses is:
Prob_Streak_6 = 0.56
= 0.015625, or 1.5625%
And so on.
This result is in direct relation to the probability of ruin. If your R is such that a string of six losses wipes 100% of your capital, there is a probability of 1.56% for that to happen under this system.
Now we learned that we must set our dollar risk R to an amount such that a string of losses doesn’t bring the account beyond the maximum percent drawdown that is tolerable to the trader.
What happens if the system has 40% winners and 60% losers, as is usual on reward/risk systems? Let’s see:
Prob_Streak_2 = 0.62 = 36%
Prob_Streak_4 = 0.64 = 12.96%
Prob_Streak:6 = 0.66 = 4,66%
Prob_Streak_8 = 0.68 = 1.68%
We observe that the probability of consecutive streaks of the same magnitude increases, so now the likelihood of eight straight losses in this system has the same probability as six in the former one.
This means that with systems with a lower percentage of winners, we should be more careful and reduce our maximum risk compared to a system with higher winning ratios.
As an example, let’s do an exercise to compute the maximum dollar risk for this system on a $10,000 account and a maximum tolerable drawdown of 30%. And assuming we wanted to withstand eight consecutive losses (a 1.68% probability of it to happen, but with a 100% probability of that to occur throughout a trader’s life).
According to this, we will assume a streak of eight consecutive losses, or 8R.
30% of $10,000 is $3,000
then 8R = $3,000, and
max R allowed is: 3000/8 = $375 or 3.75% of the account balance.
As a final caveat, to get an accurate enough measure of the percentage of losers, we should have more than 100 samples on our system history (forward tested, if possible, since back-tests usually presents unrealistic results). With just 30 points, the data is not representative enough to get any fair result.
You could do the same computations for winning streaks, using the percent of winners instead, and multiplying by the average reward (R multiple).
1. Key points and conclusions
- Position sizing is the part of the system that tells us how much to risk on a trade and is directly relevant to fulfilling our goals
- The unit of risk R is a normalized symbol for dollar risk
- You should measure, register, and be aware of the main statistical parameters of your systems: Expectancy, Percent winners and losers, reward to risk ratio, and the mean monthly-R (the average number of R your system achieves in one month)
- You should compute the maximum R allowed by your system and account size for the max drawdown bearable for you, and not bet more than that amount.
©Forex.Academy


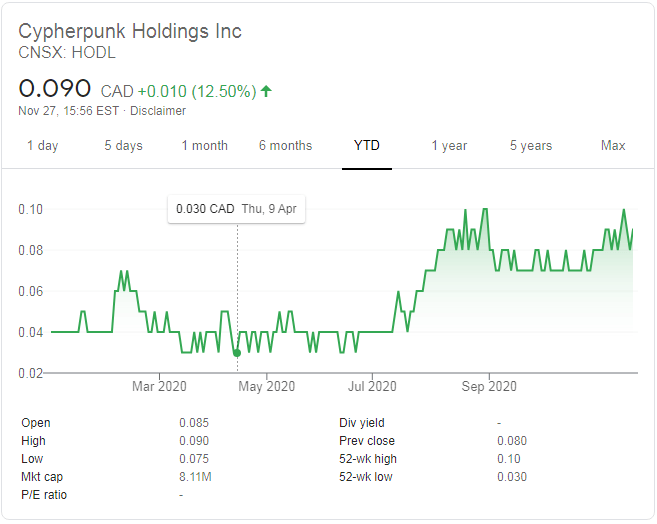
 Cypherpunk Holdings is run by Antanas Guoga, also known as Tony G, a Lithuanian businessman, politician, and former professional-level poker player. He currently serves as an elected member of the Seimas, a legislative branch of the Lithuanian government. Prior to this, he served as a member of the European Parliament for Lithuania.


