
Introduction
It has long been posited that in any economy, the first people to experience growth or contraction are those who provide basic-everyday services to the households. These service providers are considered to be “in touch” with the realities of the economy since they directly interact with their customers. While most people do not pay close attention to this index, its fluctuations could provide valuable insights into the economy.
Understanding Economy Watchers Current Index
For this analysis, we will focus on the Japanese Economy Watchers Current Index. This index attempts to measure the present economic conditions in Japan, especially from the perspective of households. From its name ‘economy watchers,’ it directly measures the mood of businesses who are in constant touch with the final consumers.
The index is compiled by surveying about 2050 employees in every sector of the economy. Here is the list of the sectors surveyed in the economy.
- In household activity related sectors
- Retail establishments like supermarkets and automobile sellers
- Food and beverage establishments like restaurants
- Services to households such as transportation, telecommunication, and leisure facility operators
- Housing services
- Corporate activity related sectors, including:
- Operators in the manufacturing sectors
- Employees and operators in the nonmanufacturing sector
- Employees in the primary sectors like agriculture, mining, and fishing
- Employee-related sectors such as;
- Temporary labour placement agents
- Job magazine editors
- Staffing agencies
- Professionals who understand labour market trends
In all the above sectors, the data is compiled as per the regions in which it was collected. It is to say that the survey is divided based on the area being surveyed in japan. It covers the 11 regions in Japan.
The people who are surveyed are well-placed in positions that enable them to observe first-hand the changes in economic activities. These are the questions that the survey asks.
- How they assess the current economic conditions and detailed reasons for their answer
- Their assessment of future economic conditions and their reasons for this assessment
The survey is conducted monthly from the 25th to the end of that month. Note that the Japanese Cabinet Office selects regional research organisations to administer these surveys. Based on the responses obtained, a ‘diffusion index’ is compiled. This diffusion index is then converted into a percentage to give the Japanese Economy Watchers Current Index. Here’s how the responses are weighted in the diffusion index.
- Better is +1
- Slightly better is +0.75
- Unchanged is +0.5
- Slightly worse is +0.25
- Worse is 0
Using Economy Watchers Current Index in Analysis
Any value above 50 indicates that respondents are optimistic about the future, while values below 50 show that they are pessimistic. Now, note that a rise in the Economy Watchers Current Index doesn’t mean that all sectors of the economy are optimistic. It just means that majority of the sectors in the economy are optimistic.
For example, economy watchers in every other sector might be optimistic, but those in the nonmanufacturing sectors are pessimistic. This scenario means that majority of economy watchers are optimistic. Similarly, when the Economy Watchers Current Index shows pessimism about the economy, it doesn’t mean that every sector in the economy shows pessimism. Some economy watchers could be optimistic.
When the economy watchers are optimistic about the future, it means that they expect the economy to grow. Remember that these economy watchers are sampled from virtually every sector of the economy in every region of Japan. For example, let’s say that economy watchers in the manufacturing sector are optimistic about the economy.
This means that they expect the manufacturing sector to expand, which means that the output from the sector will increase. Going back to the basic knowledge of the economy, we know that suppliers and producers take their cue from consumers. Therefore, an increase in production in the manufacturing sector, or any other sector, means that consumer demand has also increased.
Let’s think of the factors that drive an increase in consumer demand. The primary factor is the increase in money supply in the economy, which is driven by easy access to cheap finance or an increase in the employment rate. Here, consumers have increased disposable income, which means that the economy is expanding.
Conversely, when the Economic Watchers Current Index is decreasing and showing increased pessimism, it could mean that the economy is contracting. Let’s use the example of household activity related sectors. When they are pessimistic, it means that they are experiencing a shortfall in demand for their goods and services. Since we have established that household demand drives these sectors, a decrease in demand could mean that households are cutting back on their expenditures.
This reduction in consumption is a direct consequence of lower disposable income in the economy. When households have reduced disposable income, they will prioritise expenditure on only the most essential goods and services. It means that consumer discretionary industries will take a hit, as will the overall economy – GDP will fall as the economy contracts.
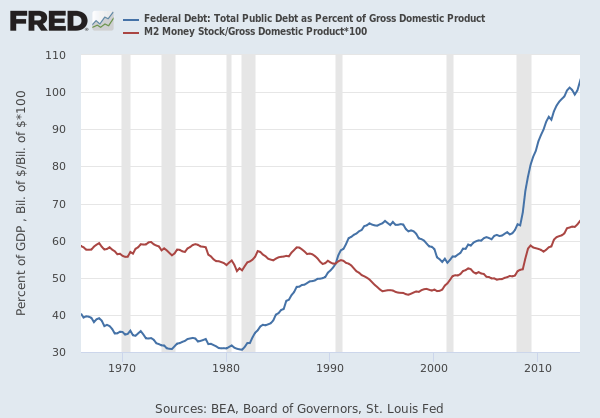
Observe in the graphs below that the fall in the Japanese Economy Watchers Current Index corresponds to the drop in Japanese GDP in Q1 2020.

Source: Trading Economics
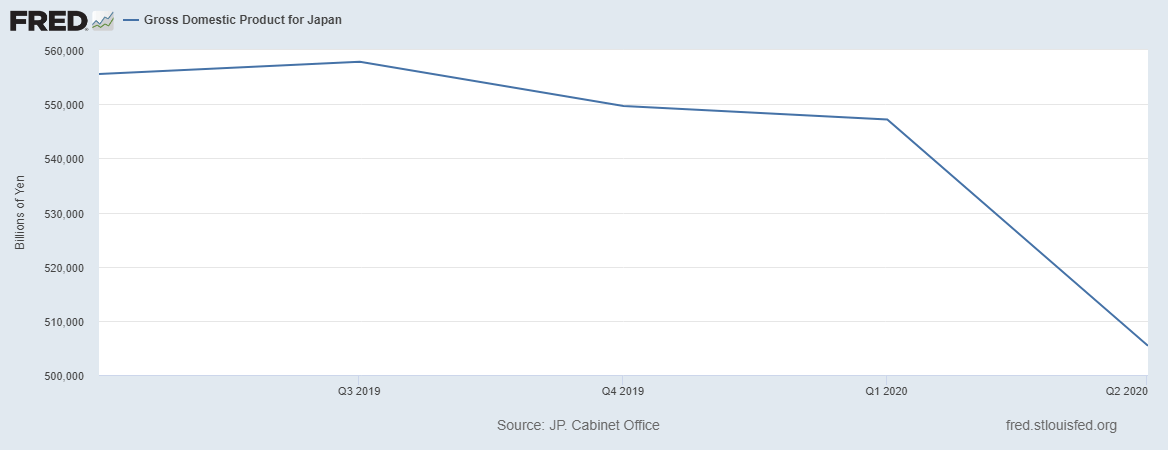
Source: St. Louis FRED
Impact of the Japanese Economy Watchers Current Index on the JPY
We have seen that the Economy Watchers Current Index can directly be linked to the money supply in the economy.; which means it can also be used as a leading indicator of inflation.
When the Economy Watchers Current Index is continually rising, it can be taken as a sign that there is increasingly more money supply in the economy. In this case, governments and central banks might step in to implement contractionary policies like hiking interest rates. In the forex market, this will increase the value of JPY. Conversely, when the Economy Watchers Current Index steadily drops, it might trigger expansionary policies, which will make the JPY depreciate.
Data Sources
The Cabinet Office of Japan is responsible for the survey and publication of the Japanese Economy Watchers Current Index. In-depth and historical data is also available at Trading Economics.
How the Japanese Economy Watchers Current Index Affects The Forex Price Charts
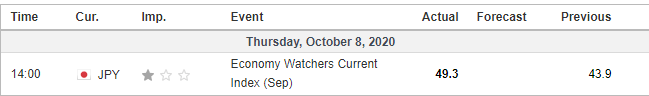
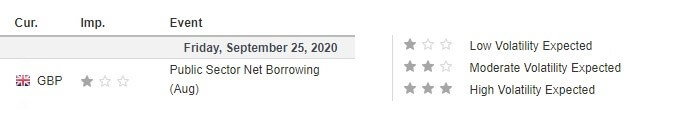
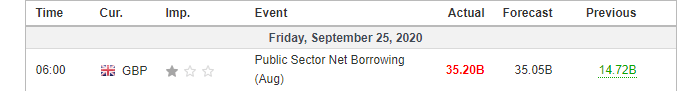
The recent publication from the Cabinet Office of Japan was on October 8, 2020, at 2.00 PM JST. The release is available at Investing.com. The publication of the Japanese Economy Watchers Current Index is expected to have a low impact on the JPY.
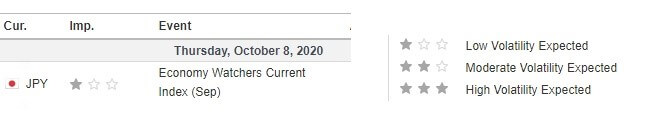
In September 2020, the Japanese Economy Watchers Current Index was 49.3 compared to 43.9 in August 2020.
Let’s find out how this release impacted the JPY.
AUD/JPY: Before Japanese Economy Watchers Current Index Release on
October 8, 2020, just before 2.00 PM JST
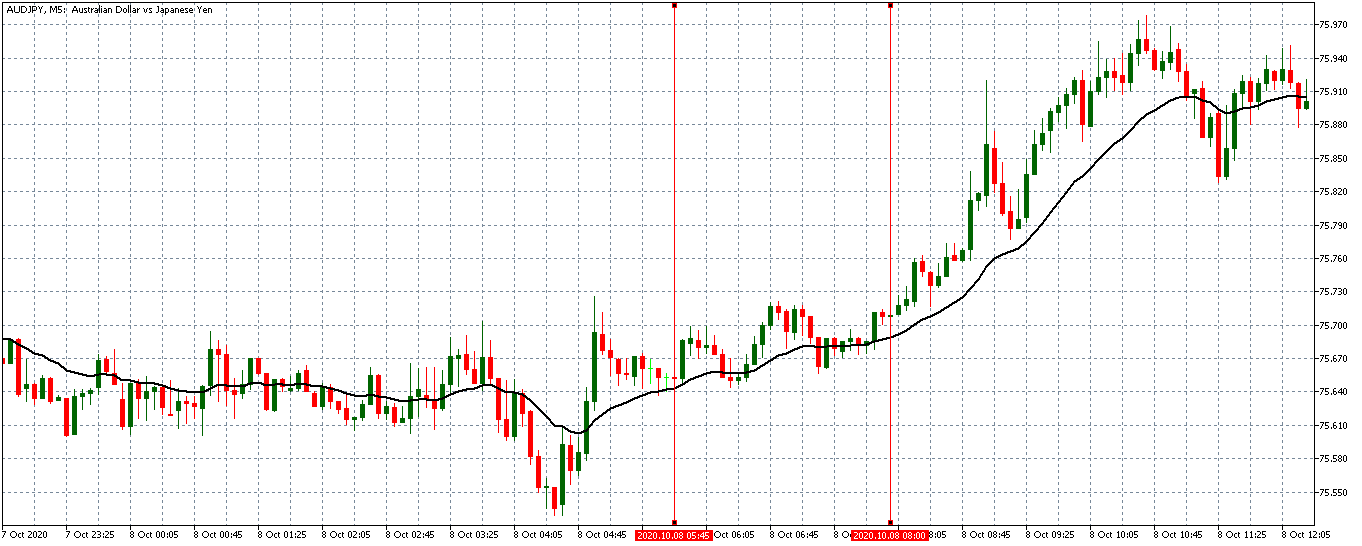
The AUD/JPY pair was trading in a weak uptrend before the publications of the Japanese Economy Watchers Current Index. The 20-period MA was merely slightly rising with candles forming just above it.
AUD/JPY: After Japanese Economy Watchers Current Index Release on
October 8, 2020, at 2.00 PM JST
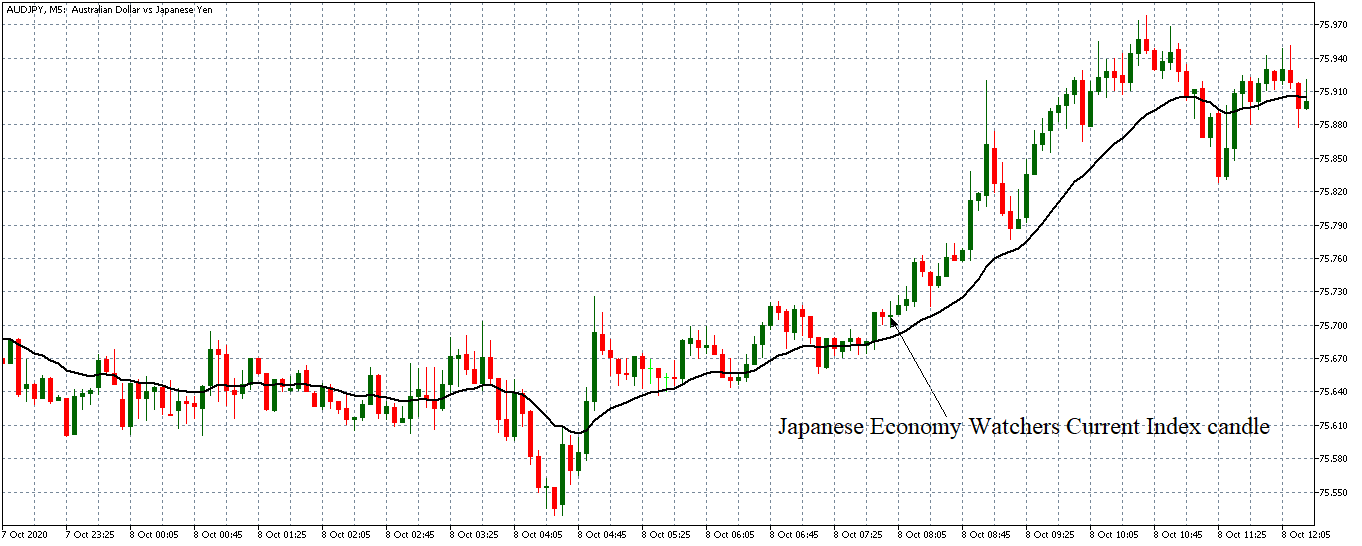
The pair formed a 5-minute “Doji” candles immediately after the publications of the index. Since the index showed pessimism in the Japanese economy, the JPY is expected to be weaker compared to the AUD. As expected, the pair subsequently traded in a renewed uptrend with the 20-period MA steeply rising and candles forming further above it.
Bottom Line
The article has shown the importance of the Economy Watchers Current Index in the Japanese economy. More so, the significance of the index has been evidenced by the price chart analysis. Note that although the index is usually a low-impact indicator. However, its significance is observed in the current coronavirus pandemic since it can be used as a leading indicator of economic recovery.

