Categories
Forex Fundamental Analysis

USD/CAD Global Macro Analysis – Part 3

Introduction

The exogenous analysis for the USD/CAD pair will involve analyzing factors that significantly contribute to these two currencies’ interaction. Remember, when trading forex, you are trading a currency pair, which means you buy one currency and sell the other. With exogenous analysis, you get the bigger picture regarding the currency pair as a whole. In a sense, the exogenous analysis compares how the endogenous factors between the US and Canadian economies net against each other.

For the exogenous analysis, we’ll focus on:

US and Canadian Interest rate differential

Interest rate differential is the difference between the interest rates in the US and Canadian. When the interest rate in one country s higher than the other, investors will pull their funds from the country with the lower interest rate to invest in high yielding securities in the country with the higher interest rate.

Canada’s interest rate has for most of the year been higher than that in the US. We, therefore, expect that from March 2020, the USD weakened against the CAD. However, since the current interest rate differential is 0%, going forward, we do not expect that it will play a significant role in determining the value of the USD/CAD pair. Hence, we assign it a neutral score of 0.

GDP Growth Differential

A country’s GDP growth is mainly propelled by growth in international trade. Therefore, when the GDP expands, we can expect that the country is becoming a net exporter. That means the demand for its currency increases in the international market, which also increases its value.

Over the years, the Canadian GDP growth rate has outpaced that of the US. However, in the third quarter of 2020, the US GDP growth rate outpaced Canada by 23.1%. Based on our correlation analysis between the GDP differential and the USD/CAD pair, we assign an inflationary score of 2. If this trend continues, we expect a future strengthening of the USD against CAD.

Differences in Trade Balance

The balance of trade helps to show the trade deficits that a country operates in the international market. The trade deficit widens as the country consistently becomes a net importer. Furthermore, the trade deficit can also widen if the value of the goods exported by a country drops while the value of imports increases.

From April 2020, the Canadian trade deficit has been widening as compared to that of the US. In October 2020 data release, the Canadian trade deficit widened by CAD 3.25 billion while the US trade deficit widened by $3.1 billion. Due to its high correlation with the USD/CAD pair, we assign the difference in trade deficit an inflationary score of 3. If this trend persists, we expect it to result in bullish USD/CAD.

Conclusion

Based on the exogenous analysis, the USD/CAD gets an inflationary score of 5. It implies that if the current trend of the exogenous factors persists, we can expect a bullish trend for the USD/CAD pair in the near term.  Now that we know the trend, we can use technical analysis to find accurate entries and exits in this currency pair while keeping the bullish trend in mind.

From the exogenous analysis of the USD/CAD pair, we have observed that the pair is expected to adopt a bullish trend in the near term. Let’s see if this is supported by technical analysis. In the below weekly chart, we can see the pair bouncing off a 2-year support line and from the oversold territory of the Bollinger Bands. This indicates a clear bullish trend in the near future. 

We hope you found this analysis informative. Please let us know if you have any questions in the comments below, and we would love to address them. Cheers.

Categories
Forex Fundamental Analysis

USD/CAD Global Macro Analysis – Part 2

CAD Endogenous Analysis – Summary

The Canadian endogenous factors recorded a score of -11.5, implying a deflationary effect in the CAD as well. This means that according to the Fundamental indicators, the CAD has also lost its value since the year began, but not as much as the USD.

Unemployment Rate

The unemployment rate measures the number of people who do not have jobs and are actively seeking gainful employment. The unemployment rate is used to show business cycles and economic growth because when businesses expand, the demand for labor is higher when the economy is undergoing a contraction, the demand for labor decreases, and the unemployment rate increases.

In October 2020, the Canadian unemployment rate was 8.9% down from the historic highs of 13.7% registered in May 2020. The rate is still higher than the 5.6% average before the onset of the coronavirus pandemic.

Based on our correlation analyses, the Canadian unemployment rate gets a score of -6. It means that in 2020 the unemployment rate has a deflationary impact on the CAD.

Canadian Rate of Inflation

The Canadian CPI is a weighted average of the following categories: Shelter 27.5%, Transportation 9.3%, Food 16.1%, household operations 11.8%, education and recreation 11.8%, clothing 5.7%, health and personal care 5%, and alcohol and tobacco 3%.

The CPI target in Canada is 2%. The Bank of Canada uses monetary policy to maintain inflation within the target range of 2%. An increasing rate of inflation is positive for the CAD.

In October 2020, the annual inflation rate in Canada rose to 0.7 from lows of -0.4 in May 2020, but still below the 2.4 recorded in January.

We assign the Canadian rate of inflation a score of -7, meaning it had a negative impact on the CAD.

Canada Industrial production

Industrial production is used to measure the output from manufacturing, mining, and the utility sectors in Canada.

In August 2020, the industrial production in Canada declined by 9.04%. Based on our correlation analysis of the Canadian industrial production and GDP, we assign it a deflationary score of -5.

Manufacturing sales

The Canadian manufacturing sales measure the value changes in the output from the manufacturing goods in the economy. It can be used to measure the short-term health of the manufacturing sector and, by extension, the health of the overall economy.

In September 2020, the manufacturing sales were worth CAD 53.8 billion, representing a 1.4% increase from August. However, manufacturing sales are still 3.6% below the pre-coronavirus period.

Based on the correlation analysis with the Canadian GDP, we assign an inflationary score of 3 to the manufacturing sales.

Retail sales

The Canadian retail sales data measures the total value that households spend on purchasing goods and services for direct consumption. This value is adjusted for inflation.

Consumption by households accounts for up to 78% of the Canadian GDP. Changes in the retail sales data can be used as a leading indicator of the welfare of households. Higher retail sales imply increased demand in the economy hence higher manufacturing and lower unemployment rates.

The retail sales in September 2020 steadily increased by 1.1% from lows of -26.4% in April. Based on the correlation analysis with the GDP, we assign retail sales a score of 6.

Government debt to GDP ratio

In 2019, Canada’s public debt to GDP was 88.6, representing a 1.26% decline from 89.7 registered in 2018.

In 2020 the government debt to GDP in Canada is expected to rise due to the various stimulus packages necessitated by the coronavirus pandemic. However, based on the past correlation analysis with GDP, we assign a marginal deflationary score of -2 on Canada’s government debt to GDP ratio.

Canada housing starts

The housing starts indicators track the number of new residential buildings that begin construction. It is used as a leading indicator of the demand in the real estate market and demand in the housing market.

In October 2020, the housing starts in Canada were 214,875 units. Based on the correlation analysis with the GDP, we assign Canadian housing starts an inflationary score of 2.5.

Canada Government Budget Value

This indicator measures the value of the Canadian budget in terms of surplus or deficit. It takes into account the difference between revenues collected and the expenditures by the government. The government budget value doesn’t include public debt.

As of August 2020, the Canadian budget deficit was CAD 21.94 billion. Revenue collected by the government during the month dropped by CAD 1.3 billion, while expenditures increased by CAD 42.92 billion due to COVID-19 response measures.

Based on its high correlation with the GDP, we assign a deflationary score of -6.

Business confidence

In Canada, business confidence is measured by the Ivey Purchasing Managers’ Index (PMI). It measures the business expectations and operating environment from the perspective of an operating panel of purchasing managers from both private and public sectors across Canada.

The Ivey PMI focuses on supplier deliveries, purchases, employment, inventories, and prices. Values over 50 imply expansion while below 50 implies contraction.

The Ivey PMI reading for October 2020 was 54.5, indicating expansion. From our correlation analysis, we assign Canadian business confidence an inflationary score of 3.

In our next article, we will analyze the Exogenous factors of both USD and CAD to come to an appropriate conclusion.

Categories
Crypto Daily Topic

Top DeFi Tokens of 2020: Check Out Number 5

Which are the best DeFi tokens of 2020? DeFi tokens have had a great year. It’s not an exaggeration to say they could very well eclipse ‘normal’ cryptocurrencies in the future. As DeFi continues to explode and the year nears a close, it helps look at the tokens that have defined 2020 and will probably continue to do so in the coming year.

This list doesn’t just follow the tokens that are the highest in market cap. It also looks at the most promising and exciting tokens. 

#1. Chainlink 

Chainlink is a decentralized oracle for connecting blockchains to external data and information. The Chainlink protocol, which includes the LINK token, allows smart contracts to operate without relying on permissioned or centralized information. For instance, a developer can run a sports betting contract that relies on an external oracle for sports scores. Chainlink has proved especially popular, with countless DeFi protocols including Aave, Ampleforth, Celcius, Arbol, yearn.finance, Nexus Mutual, and Synthetix all utilizing its smart oracles function. This popularity has catapulted it to the top ten in market cap, sitting at #5 at the time of writing. The LINK token, which began the year going for $2, already hit $12. 

#2. Maker (MKR)

Maker is one of the earliest stablecoins in the DeFi space and one of the most resilient. Despite (and probably because) of its low total supply of slightly more than a million, the token is a huge hit in  DeFi, judging by its current per-token value of $513. And this is a climbdown from the highs of $1,700 in 2018 before the token plummeted during the 2018/2019 crypto winter. In 2020, it got a reprieve after reaching $600 this year. With its MKR token, the protocol makes up what is probably the best example of a stablecoin system: a collateralized debt position powered by its  stablecoin – DAI, which maintains stability for the protocol by using various economic incentives. MKR will be one of the tokens driving the DeFi space in the near future and beyond. 

 #3. Aave (LEND)

Aave is an open-source, decentralized protocol that allows users to create money markets, earn interest on their deposits, and borrow funds through the LEND token. With a market cap of $859 million, Aave is currently the 4th biggest DeFi token. Aave has had an incredible year. It started off at a mere $0.009 in  January but has now clocked $73 per token, which is remarkable even in crypto. 

#4. Synthetix Network Token (SNX)

Synthetix is a blockchain protocol that lets anyone gain exposure to a wide array of assets. The platform is credited for introducing yield farming in DeFi, though it’s now been overrun by platforms like Compound and Aave. Still, the token continues to ‘hold the line,’ as manifested by its current position of #9 among  DeFi tokens and #40 among all cryptocurrencies. With a market cap of nearly $500 million, SNX demonstrates its resiliency. Synthetix supports a smart contract infrastructure and incentivization system that will continue to propel it upwards. 

 #5. Dai (DAI)

Part of the Maker ecosystem, DAI isn’t a token that you buy to HODL. Still, it’s an excellent idea to buy the token and hedge your portfolio against volatility. Dai is probably the most elegantly designed stablecoin in the world today, with an ingenious incentivization and collateralization system that securely puts its value at a 1:1 ratio against the US dollar. While other stablecoins achieve stability by using clumsy ways like holding US dollars in the bank, Dai uses a more accurate and flexible tech-based system. Anyone can also create their own Dai if they put up collateral. 

#6 Compound (COMP)

Compound is a DeFi protocol that allows anyone to lend, borrow, and provide liquidity and earn returns. Comp exploded after it started distributing its native token, COMP, in June this year. It’s definitely one of the hottest tokens in DeFi right now, featuring a market cap of $526 million and a per-token value of $124 at the time of writing. COMP is an Ethereum-based mechanism used as a governance mechanism of the Compound ecosystem. As the Compound platform continues to expand, we’re sure to see the value of COMP following the lead. 

#7. 0x (ZRX)

0x is a decentralized exchange protocol that allows developers to create their own exchanges. The project’s founder calls it the “Craigslist for cryptocurrencies” in that anyone can build an exchange and post it online. Despite its promising value proposition, the 0x token, ZRX, has had the slowest growth this year. In January, you could buy the token for around $0.20, and it’s now sitting at $0.36 at the time of writing, with a market cap of $273,926,375. But the dismal growth of the token does not discount its potential to break through in the future. The 0x token is one to keep sights on. 

#8. Ampleforth (AMPL)

Ampleforth kicked off the year trading at around $1, went to rise to $4 in July, before sharply clamping down to around $1 again. Ampleforth calls itself a cryptocurrency “like Bitcoin,” but with a daily change in supply, insuring against market shocks.  Ampleforth wishes to solve what it calls the “dangerously correlated” crypto market by adding diversity to the ecosystem. While most cryptocurrencies follow the Bitcoin price pattern, the AMPL token matches to its own beat. This could prove an excellent hedge for your crypto portfolio. 

#9. Augur (REP)

Augur started the year sitting at around $9, and if now trades at $14 in November, a dip from around $20 in August. Based on Ethereum, Augur, via its native token – REP, aims to power a prediction market where users can earn money if they predict winning outcomes. Augur also acts as a decentralized oracle for verifying real-world events. These events could be anything – from natural events to election results to football matches’ outcomes. At the time of writing, Augur is at position #75 in the market and continues to be one of the DeFi’s best.

#10. Terra (LUNA)

Terra is a DeFi protocol that wants to expand everyone’s financial  inclusivity through its native token, LUNA. The Tetra team wants to “set money free” by building an open, global financial infrastructure. This infrastructure constitutes a family of stablecoins that allow users to earn mining rewards, giving people an incentive to participate in the network. Terra launched its mainnet in April 2019. It currently offers stablecoins pegged to the US dollar, South Korean Won, the Mongolian tugrik, and the IMF’s Special Drawing Rights basket of currencies. Users can trade LUNA as well as stake it and earn interest. LUNA token holders can also participate in the platform’s governance. After kicking off the year at $0.24, LUNA’s price nearly doubled around July before cooling down to around $0.33 in November. With its value proposition, Terra is set to be one of the most important DeFi presences in the future. 

Closing Thoughts

Ten years ago, the crypto space was talking about Bitcoin and decentralized currencies. Now, we’re talking of decentralizing the entire finance space. The above tokens represent some of the most exciting decentralized finance projects and their tokens in 2020. With a rapidly evolving DeFi space, you can expect anything in the coming year, but for now, these are among its biggest stars. 

Categories
Forex Fundamental Analysis

Exploring The ‘US Baker Hughes Oil Rig Count’ Macro Economic Indicator

Introduction

Countries like the US and Canada, whose economies largely depend on oil, knowing if oil production is increasing or decreasing can offer valuable insight into the economy. The changes in production not only serve as a leading indicator of demand for oil and its products but also of the labor market.

Understanding US Baker Hughes Oil Rig Count

Baker Hughes is an American energy technology company providing oil field services. The company specializes in the oil and gas industry, providing services from exploration, formation evaluation, oil drilling, production, and reservoir consulting. Baker Hughes is operational in over 120 countries. Other services provided by the company include turbomachinery and process solutions, software and analytics, and measurements, testing, and control, throughout the oil and gas industry.

The US Baker Hughes Oil Rig Count reports the number of oil and gas rigs operating in the US. The report is published every Friday at noon EST. The report details the rig count based on location, i.e., the number of rigs operational on land, inland waters, and offshore. It also contains a section on “US Breakout Information,” which has subsections on oil, gas, and miscellaneous.

This section of the report also shows the number of directional, horizontal, or vertical rigs. Furthermore, the report also shows the ‘Major State Variances.’ A different section of the US Baker Hughes Oil Rig Count report also breaks down the Rotary oil and gas rigs operations by State and location.

Suffice to say, the US Baker Hughes Oil Rig Count report provides a comprehensive look into the oil and gas weekly operations. The report shows the rigs that are operational during the current reporting period and the change from the previous reported period. It also shows the current change from a year ago.

Using US Baker Hughes Oil Rig Count in Analysis

The US Baker Hughes Oil Rig Count can show the demand for oil and oil products. Furthermore, the report is a leading indicator of the demand for products and services offered by the oil service industry.

When the oil rig count increases, more oil rigs have become operational during the reporting period. In the labor industry, this increase has two implications – an increase in direct and indirect labor. Direct labor increases since the workers in these rigs become active. Indirect labor is in the form of workers who will provide ancillary services to the operational oil rigs. In cities where these rigs are operational, they form an integral part of the economy. Therefore, when they are operational, the economies in these regions flourish, and the unemployment levels decline.

Furthermore, the consumer discretionary sectors also expand due to an increase in household demand. Conversely, when the count reduces, it means that the oil rigs are shutting down. The consequence of this is layoffs, which eventually depresses the demand in the economy. It is essential to know that while oil production in the US is not the major employer in the labor market, the effects of massive job losses on the broader economy cannot be ignored.

The increase in the US Baker Hughes Oil Rig Count means that there is an increasing oil demand.  To better understand the oil demand, we first need to understand the top consumers of oil in the economy. According to the US Energy Information Administration, the top consumers of oil in the US are; transportation 68%, industries 26%, residential 3%, commercial 2%, and electric power less than 1%. Therefore, we can safely conclude that whenever oil production increases, the increase in demand is primarily driven by transportation and industrial sectors.

Here is the implication to the economy, when oil demand by these two industries increases, demand for goods and services offered by these two sectors has also increased. In the transportation sector, whenever the demand for oil increases, it means that more people are purchasing cars. In the industrial sector, the increase in demand for oil implies an expansion in operations. An increase follows the expansion in employment opportunities and increased economic output. In both these instances, it is implied that the economy is growing.

Conversely, when the rigs are shutting down, it is usually to avoid overproduction, which might grossly distort the oil prices. This reduction in oil supply could be taken as a sign of a decrease in demand. Based on the top consumers of oil in the US, a decline in the oil demand implies that the economy is contracting.

The US Baker Hughes Oil Rig Count can also be used to show periods of economic recession and recovery. Take the example of the recent coronavirus pandemic. The pandemic resulted in nationwide lockdowns and social distancing. Virtually, transportation was halted as the majority of the population opted to work from home. Industries were shut down to depressed demand. This implied that the oil demand plummeted, which was followed by a recession of the US economy.

Source: Trading Economics

When the US economy started resuming some sense of normalcy, we can notice the US Baker Hughes Oil Rig Count increasing. This showed that the oil demand was picking up again, which means that transportations and industrial sectors were upping their operations.

Source: Trading Economics

Impact of US Baker Hughes Oil Rig Count on the USD

The value of a country’s currency depends on the fundamentals of its economy. Since the US Baker Hughes Oil Rig Count can be used as a leading indicator of the US economy, the change in the count impacts the USD.

Theoretically, an increase in the US Baker Hughes Oil Rig Count should be accompanied by an appreciating USD. The increasing count signifies that the US economy is expanding. Conversely, a decline in the count means that the US economy is contracting; hence the USD should be expected to depreciate.

Sources of Data

Baker Hughes publishes the US Baker Hughes Oil Rig Count report at the end of every working week. Trading Economics has a historical time series data of the US Baker Hughes Oil Rig Count.

How US Baker Hughes Oil Rig Count Release Affects The Forex Price Charts

The most recent publication was on October 23, 2020, at 1.00 PM EST and accessed at Investing.com. The USD is expected to experience moderate volatility when this report is published.

In the week to October 23, 2020, the number of oil rigs operating in the US was 211, increasing from 205 a week earlier.

Let’s find out how this increase impacted the USD.

GBP/USD: Before US Baker Hughes Oil Rig Count Release on October 23, 2020, 
just before 1.00 PM EST

Before the release of the US Baker Hughes Oil Rig Count, the GBP/USD pair was trading in a weak downtrend. From the above 5-minute chart, we can observe that the 20-period MA was only slightly dropping.

GBP/USD: After US Baker Hughes Oil Rig Count Release on October 23, 2020, 
at 1.00 PM EST

After the release, the pair formed a 5-minute bearish “hammer” candle. Subsequently, the pair traded in a weaker downtrend as the 20-period MA was flattening with candles forming just around it.

Bottom Line

The US Baker Hughes Oil Rig Count plays a vital role as a leading indicator of the demand for oil and oil products. As shown by the above analyses, the US Baker Hughes Oil Rig Count doesn’t significantly impact the Forex price action.

Categories
Cryptocurrencies

MIRkey Hardware Wallet Review: How Safe Is MIRKey Hardware

MIRkey is a Bitcoin hardware wallet designed and introduced to the crypto world by Ellipticsecure, a crypto-security company that specializes in the manufacture of Hardware Security Modules (HSM). According to its developers, MIRkey is a security-focused hardware wallet that embraces a host of security features, including a FIDO2 certification. But unlike most other hardware wallets that have their focus set on ease of use, especially with a large OLED display, MIRkey doesn’t have a display screen. 

In this MIRkey hardware wallet review, we will be vetting the wallet by looking at such factors as its key features, ease of use, pros and cons, and a step-by-step guide on how to interact with MIRkey, and compare it with other Bitcoin only wallets. 

MIRkey wallet key features:

Sleek design: MIRkey hardware wallet embraces a sleek USB-like design. This implies that the wallet is both ultra-light and highly portable. The wallet also features a single button that is used to authorize outbound crypto transfers. 

Integrates software wallets: You get to control the MIRkey hardware wallet via the MIRkey software wallet. This software is versatile and compatible with virtually all computer operating systems, including Windows, macOS, and Linux.

Integrates Electrum wallet: MIRkey hardware wallet will also integrate software crypto wallets like the Electrum Bitcoin wallet that plays a key role in making the hardware wallet easy to use and interact with. 

Security features:

Password: Like any other software or hardware crypto wallet, MIRkey is secured with a password that you set when activating the wallet and creating a user account. This prevents unauthorized access to the wallet and the private keys and serves as the hardware wallet’s encryption tool. 

Two-factor authentication: All outbound crypto transfers from your MIRkey hardware wallet must be subjected to two-factor authentication. On the hardware wallet device is a button that you have to press to authorize the transfer implying that even if a hacker were to gain access to your passwords, they must have physical access to the device to initiate the transfer. 

FIDO2-certified: MIRkey hardware wallet received FIDO2 certification in September 2019. This implies that the wallet meets the international standards in security and safety and can, therefore, be used to store the security phrases and passcodes for registries, systems, and such web services like Google, Facebook, Netflix, GitHub, Amazon, etc. 

VPN access: Another unique security measure that sets the MIRkey hardware wallet apart from most other hardware wallets is that it is accessible via a VPN.

Cold storage: MIRkey is a noncustodial wallet implying that your private keys and all other personal data stored in the wallet are stored therein is highly encrypted and stored in hardware devices offline. None of your information is stored on the Ellipticsecure company servers, plus all communications between the wallet, the company, and other third party systems are subjected to end-to-end encryption. 

Hierarchical deterministic: Sensitive information like wallet addresses and the recovery seed are generated by the hardware device offline. The wallet address generation process is also hierarchically deterministic in a process meant to throw off crypto trackers. 

Recovery seed: When activating the hardware wallet and creating a user password, you will also be presented with a 24-word backup and recovery seed. It comes in handy should you want to recover lost private keys. 

How to set and activate the MIRkey wallet

Step 1: Start by ordering your copy of a MIRkey hardware wallet on the Ellipticsecure.com website.

Step 2: Download the MIRkey desktop app that is compatible with your computer. 

Step 3: Install and upon launching the app, click the ‘Create a new wallet’ tab

Step 4: Create a password for the wallet

Step 5: Insert the MIRkey hardware wallet device. 

Step 6: Choose a username and create a passcode for the wallet.

Step 7: The wallet will now present you with a 24-word recovery seed. Write it down on a piece of paper and keep it safe offline. 

Step 8: The wallet is now active and ready for use 

How to add/receive crypto into your MIRkey wallet 

Step 1: Log in to the MIRkey desktop wallet app and click on the “Receive” tab on the user dashboard.

Step 2: On the wallet address and forward it to the person sending you Bitcoins

Step 3: Alternatively, have them scan the wallet’s QR code

Step 4: Wait for your funds to reflect in your account.

How to send crypto from your MIRkey wallet

Step 1: Log in to the MIRkey desktop wallet app, and on the user dashboard, click “Send.” 

Step 2: Select the account from which you want to send Bitcoins 

Step 3: On the transfer window that pops up, enter the recipient’s wallet address and the number of Bitcoins you want to send

Step 4: Insert the MIRkey hardware wallet device into the computer

Step 5: Confirm that the transaction details are correct and press the on-device button on the MIRkey wallet to authorize the transfer.

MIRkey wallet ease of use

The MIRkey hardware wallet is relatively easy to use. The onboarding process is quite easy and straightforward. And while one might find fault that they don’t include the wallet activation guide in the wallet’s package, you don’t need expert help to activate the wallet.

The processes of sending and receiving Bitcoins in and out of the MIRkey wallet is also quite straightforward. We must, however, observe that the lack of an on-device screen complicates the transaction verification process. 

MIRkey wallet supported currencies

MIRkey is a bitcoin-only wallet, but you can always integrate it with such software wallets as the Electrum that help increase the number of supported crypto coins. 

MIRkey wallet cost and fees

The MIRkey hardware wallet costs $49 on the Ellipticsecure.com website. But you can buy a double pack hardware wallet for $79 with a 30-day money-back guarantee. 

The desktop wallet app is nevertheless free. And so is storing your digital assets here. However, you will have to part with the Bitcoin blockchain network fee every time you want to send coins to another wallet or exchange. How much you pay is largely dependent on the number of coins you want to send. 

MIRkey wallet customer support

EllipticSecure, the MIRkey hardware wallet developers, has one of the most responsive aftersales service and customer support team. You can contact them via the phone number on their website, send them an email, or raise a support ticket on their ‘Contact Us’ page. 

You can also consult their blog, documentation, and how-to guides on the website’s ‘Resources’ page. 

What are the pros and cons of using the MIRkey Wallet?

Pros:

  • It embraces some of the most innovative security features
  • MIRkey is relatively inexpensive when compared to most other hardware wallets
  • The wallet is highly intuitive and beginner-friendly
  • It has a highly responsive customer support team that is also available on the phone
  • It is compatible with the electrum software wallet 

Cons:

  • It will only support Bitcoins
  • It doesn’t have an on-device screen, and this complicates transaction verification

Comparing MIRkey wallet with other hardware wallets

MIRkey wallet vs. Ledger Nano S wallet

MIRkey and Ledger Nano S are both security-focused hardware wallets. They also rank highly among the most affordable hardware wallets. Other similarities between the two include storing your coins in cold storage, their sleek and ultra-lightweight design, and ease of use. 

However, while MIRkey will only support Bitcoins. Ledger Nano S, however, is a multicurrency hardware wallet that supports 1000+ cryptocurrencies and tokens. Similarly, Ledger features both the on-device button and OLED screen. Further, unlike MIRkey that is only compatible with the Electrum software wallet, Ledger Nano S integrates numerous software and mobile app crypto wallets. 

Verdict: Is MIRkey wallet safe?

Yes, the hardware cryptocurrency wallet has put in place several highly advanced security and privacy measures. These have seen the wallet earn the coveted FIDO2 certification, and they include the fact that your wallets are stored in cold storage. The process of generating wallet addresses is also hierarchically deterministic, you can boost wallet security with two-factor authentication, and it also provides you with a backup and recovery seed. You only have to part with $49 and deal with the fact that it is a Bitcoin-only wallet.  

Categories
Forex Course

178. Decoding The COT Report

In the previous lesson, we learned how, where, and when you can access the Commitment of Traders report. In this lesson, we will discuss the elements contained in the COT report. The CFTC prepares four COT report types: the Legacy Report, the Supplemental Report, the Disaggregated Report, and the Traders in Financial Futures report. For forex traders, the Legacy and the Traders in Financial Futures reports are of most importance.

The Legacy Report
The Legacy report is categorized by different exchanges. Forex traders pay attention to the reports from the Chicago Mercantile Exchange. The Legacy reports have categories for only futures report and a combination of both futures’ and options report. The open interest positions that are reportable are categorized into two: non-commercial and commercial traders.
The Traders in Financial Futures (TFF) Report

This report contains financial contracts, including the US Treasuries, currencies, the VIX, and Eurodollars. Like the Legacy report, it has two categories; only futures report and a combination of both futures’ and options report. The open interest positions in the TFF report are categorized into four: leveraged funds; dealer/intermediary; asset manager/institutional; and other reportable.

Understanding Terms used in the COT Report

Open Interest: The totality of all futures and options contracts that have not yet been executed but are yet to be offset by exercise, delivery, or transaction.

Reportable Positions: these are open interests that are equal to or exceed the reporting level set by the CFTC. These positions are reported to the CFTC by foreign exchange brokers, futures commission merchants, and clearing members. The reportable positions account for about 70% to 90% of all open interests in a given market.

Nonreportable positions: are calculated by subtracting the reportable positions from the total open interests in a given market. The traders involved in nonreportable positions are unknown, as is their classification on whether they are commercial or non-commercial. These are mainly small-scale retail traders.

Commercial Traders: are traders who participate in the futures and options market to hedge their core business activities. In forex futures, commercial traders seek to offset the risks of the spot market. The CFTC has set the definition that qualifies a commercial trader under Regulation 1.3 (z). Commercial traders do not seek to take possession of the assets underlying a futures contract.

Non-commercial Traders: are also known as large speculators. These traders participate in the futures market primarily as an investment by speculating on price movements. They have no intentions of taking ownership of the underlying asset to profit from the price difference.

Changes in commitments from previous reports: shows the difference between the data in the current and the immediate previous publication of the report.

Number of Traders: show the reportable traders in each category. For each category, a trader is counted if they have an open position. The number of traders in each category can exceed the total number of traders because a single trader can have open positions in different categories.

[wp_quiz id=”89679″]
Categories
Forex Market Analysis

Watchout the Potential Next Rally of GBPAUD

GBPAUD advances on Monday’s trading session in the bullish sentiment zone, testing the resistance level at 1.82688, which corresponds to the extreme bullish zone’s resistance.

Technical Overview

The following 12-hour chart illustrates the price that reached a new peak in the 90-day range at 1.85272. The cross began to retrace towards the neutral zone at level 1.80104, where the price found support and began to move mainly sideways on the bullish sentiment zone, finding resistance at level 1.82688.

Likewise, it highlights the support’s confirmation in the neutral level of the 90-day range, which leads to the observation of the upward pressure it shows the cross short term. In this context, the GBPAUD cross could experience a new rally that could lead to a test of the psychological resistance level located on 1.8500.

Short-term Technical Outlook

The short-term Elliott Wave graph of the GBPAUD cross unfolded in the following 12-hour chart shows the price action moving in an incomplete wave ((c)) of Minute degree labeled in black, which belong to the fourth wave of Minor degree identified in green.

The big picture reveals the cross is moving in an impulsive descending structure of Minor degree, in green, progressing in its fourth wave. This corrective structural series began last September 11th when the GBPAUD found fresh buyers at 1.74935.

The completion of the internal wave ((a)) at 1.85272 on October 21st and wave ((b)) at 1.79378 on November 09th leads to the anticipation of further upward movements in a five-wave internal sequence corresponding to wave ((c)) identified in black. In this regard, the previous chart shows the price starting to develop its third wave (iii) of Minuette degree, labeled in blue.

In this context, the current upward sequence in development has two potential targets as follows.

  • The first potential target is found in the supply zone between 1.84295 and 1.85272. If the price starts to decline from this zone, this could indicate a dominant bearish pressure that could drag the price toward the last September’s lows zone on 1.7500.
  • The second potential target zone is between 1.87353 and 1.89667, which corresponds with the ascending channel’s upper line. If the GBPAUD cross reaches this zone, this could indicate a dominant bullish pressure, and a correction could likely drive the price to the end of wave ((b)) on 1.7937, where the cross could find fresh buyers.

For the active intraday bullish scenario, the short-term invalidation level is located at 1.79378, which corresponds to the origin of wave ((c)).

Categories
Crypto Videos

Millionaires are Rushing to Buy Crypto According To This Survey! Do You Hold Any Bitcoin?


Millionaires are Rushing to Buy Crypto! Do YOU Hold Any Bitcoin?


A survey of over 700 high net-worth individuals has found that almost three-quarters of respondents that are worth more than $1 million either already own or are looking to put a part of their wealth in cryptocurrencies before the end of 2022.
The survey was conducted by financial advisory organization DeVere Group and revealed that 73% of respondents are currently bullish toward cryptocurrencies, which is an increase from 68% back in 2019.

Participants were individuals whose net worth equated to more than 1 million British pounds, equating to approximately $1.32 million. The participants were selected from a wide variety of regions that include the United States, the United Kingdom, Africa, Asia, the Middle East, Australia, as well as Latin America.

deVere Group CEO and founder Nigel Green stated in the survey that Bitcoin had once again shown its worth by being one of the best-performing assets in 2020, with a year-to-date increase of 125%. He then added:

“As the survey shows us, this impressive performance is drawing the attention of high net-worth investors who increasingly understand that cryptocurrencies are the future of money, and they don’t want to be left behind.”

Green noted that the respondents eyeing Bitcoin included some of the biggest Wall Street companies and attributed their warming sentiment to crypto adoption by large firms such as PayPal and Square:

“There is no doubt that many high net-worth individuals who were polled have seen that a major price surge driver is the growing interest being shown by institutional investors who are capitalizing on the extremely high returns that the crypto asset class is currently offering.”

Even former Bitcoin skeptics coming from Wall Street are now warming up to digital currencies. During a recent New York Times conference, Chairman and CEO of JPMorgan and Chase Jamie Dimon said he’s a “believer” in blockchain technology, as well as in “properly backed, properly regulated” cryptocurrencies.


Taking a look back, Dimon made headlines in 2017 when he referred to Bitcoin and other cryptocurrencies as a fraud, although JPMorgan has since embraced cryptocurrencies.


Billionaire hedge fund manager and Bitcoin bear Ray Dalio still has plenty of doubts about Bitcoin. Still, he has recently questioned his own skepticism, tweeting that he might be missing something about Bitcoin and that he’d love to be corrected.

Dalio had suggested that Bitcoin will fall down as a store of value and that governments may just “outlaw it and make it too dangerous to use.” He also stated that he couldn’t imagine central banks, big institutional investors, and multinational companies using it.

The millionaires’ survey was revealed to the public the same day that Bitcoin’s total market capitalization hit a new all-time high of an astonishing $336 billion, and its price rallied to above $18,000 and just shy of the $19,763 high that it reached in December 2017.

Categories
Forex Basic Strategies

Combining The ‘Rail Road’ Trading Pattern With Pivot Points To Generate Accurate Trading Signals

Introduction

In the previous set of articles, we discussed strategies based on most of the technical indicators in forex. But there is one technical indicator that was not covered extensively and, i.e., the ‘Pivot Points’ indicator. Traders do not use it extensively because they don’t know the right way of using it and are not aware of their strength.

Today, we solve this problem by discussing a mostly based strategy on the Pivot Points indicator. By now, we all know that a technical indicator should never be in isolation. Therefore, the ‘Pivot Points’ indicator is combined with some very powerful chart patterns and key technical levels to improve the probability of successful trades.

‘Pivot Points’ are nothing but potential support and resistance levels that will help us determine the same, even it is established. The pivot point’s parameters are usually taken from the previous day’s trading range to calculate today’s pivot points. The simplest way of plotting the pivot point indicator on the chart is by selecting the indicator from the broker’s charting software.

The main pivot point (PP) is the central pivot based on which all other pivot levels are calculated. Calculating the central pivot point is pretty simple. We just have to add yesterday’s high, low, and close and then divide that by 3, a simple average of the high, low, and close. We don’t have to worry about the calculations as the software does all that for us and gives it readymade.

The only thing we have to remember is that if the price is trading above the central pivot point, it signals a bullish trend. If the price is below the central line, it is considered a bearish trend.

Time Frame

The strategy works well on small time frames such as 15 minutes, 3 minutes, and 1 minute. It would not be wrong to classify the above strategy as a ‘Scalping Strategy.’

Indicators

We use just one technical indicator for the strategy and, i.e., ‘Pivot Points.’ We could also use the Simple Moving Average (SMA) to get a clear idea about the market trend.

Currency Pairs

The strategy is only applicable to major currency pairs of the forex market. EUR/USD, USD/JPY, GBP/USD, GBP/JPY, AUD/USD, EUR/GBP, and NZD/USD are preferred currency pairs.

Strategy Concept

The ‘Pivot Point’ strategy is based on the concept that when price respects any of the support and resistance levels of the ‘Pivot Point’ indicator, they tend to become ‘true’ S/R levels that can be relied upon. When price re-tests these ‘true’ support and resistance levels, it moves in the direction as anticipated. The above logic works greatly in favor of traders and thus increases the probability of making a profit. However, there are some rules we need to follow to execute the above strategy successfully. Let’s discuss these rules in detail.

Trade Setup

To explain the strategy, we will be executing a ‘long’ trade in EUR/USD currency pair using the strategy’s rules. Here are the steps to execute the strategy.

Step 1: Firstly, we have to plot the pivot point indicator on the chart with its default settings. As this is mostly an intraday strategy, we start each day as fresh using the partitions made by the pivot point indicator. The below image exactly shows how the beginning of a new day would look like on the pivot points.

Step 2: Next, we need to wait for the price to touch any support and resistance levels as plotted on the chart by the pivot point indicator. Not all touches are going to be important to us. Only the price touches that cause major price movement in the market will be considered as significant. For instance, if the price touches R1, R2, R3, R4, or R5 and goes down to the central line (PP), this shall be considered ‘true’ resistance. Likewise, if the price touches S1, S2, S3, S4, and S5 and goes back up to the central line, this shall be considered ‘true’ support.

The below image shows how price touches S1 and travels close to the central line. Hence, this can be considered as ‘true’ support. The further price travels, the stronger is going to be the ‘support.’

Step 3: After establishing ‘true’ support and resistance levels, we wait for the price to return to this level and show a suitable price action pattern before we can actually enter into a trade. Once the price touches established ‘support’ or ‘resistance,’ we need to watch for the formation of the ‘Rail-Road Track’ candlestick pattern on the chart. The ‘Rail-Road Track’ is essential because it confirms the respective level. We still don’t enter for a trade. The next step explains the rule of ‘entry.’

Step 4: To be sure that the support or resistance is holding, we enter only after the price starts moving in the direction we expect to move. For example, in the case of ‘true’ support, we enter ‘long’ when the price moves a further higher from the ‘support.’ Similarly, in the case of ‘true’ resistance, we enter ‘short’ when the price moves further lower from the ‘resistance.’

Step 5: In this step, we define the take-profit and stop-loss levels for the trade. The stop-loss is placed below the ‘support’ from where the price had bounced off, in case of a ‘long’ position. On the other hand, it is placed above the ‘resistance’ from where the price had collapsed. The ‘take-profit’ is set at the opposing ‘support’ and ‘resistance’ level as indicated by the pivot point indicator.

Strategy Roundup

The pivot point strategy is like a complementary tool to the traditional S/R strategy that can be used to improve the results. Since we are dealing with really small time frames, the probability of ‘successful trades’ can be ‘low.’ However, that shouldn’t be a concern for us as the risk to reward (RR) of trades executed using the above strategy is above average. This will ultimately put us in a profitable position.

Categories
Crypto Videos

Pantera Capital Are Raising $134,000,000 – why?


Crypto Hedge Fund Pantera Capital Raising $134 Million


In a filing with the SEC on Nov 21, Bitcoin hedge fund giant Pantera Capital has announced an equity offering of up to a whopping $134 million, one of the largest capital fundraising campaigns in the seven-year history of the firm.

Founded in 2013 as the first-ever Bitcoin fund in the US, Pantera Capital initially raised $13 million, which is less than 10% of the current offering. It raised another $25 million later on, according to the firm’s public records.

However, in 2018, the fund redirected its efforts towards a larger raise that ultimately resulted in the formation of a third investment fund, now called Venture Fund III. This new fund raised $164 million from 2018-2020, with the majority of the capital inflows bookending crypto’s dreadful 2019 year.

Nowadays, as crypto seems like it has entered yet another raging bull market, the SEC filing tells us that Pantera has big plans ahead. 

Pantera didn’t state the reason for this new raise, and if the raise will result in a new fund or if it will simply be used to expand the scope of Venture Fund III. However, the company’s latest investments and executive comments actually might offer hints at its strategy for the future.


Pantera CEO Dan Morehead said that he believes the growth of decentralized finance, or DeFi for short, has the potential to outpace Bitcoin’s rise, and that the firm is focusing its new bets on the emerging financial vertical. In addition to this, Pantera seems to have its eye on the quickly expanding crypto derivatives market, as shown by its recent investment in Globe, a well-known derivatives trading platform.

Bitcoin bulls shouldn’t be negatively affected by the interest in DeFi and derivatives, however. In fact, Morehead has also previously made a moonshot target for the largest cryptocurrency, as he called for a Bitcoin price of $350,000.


Categories
Crypto Daily Topic

8 Ways to Earn Passive Income with Crypto They Will Never Talk About!

Most people, when asked about ways to make money off crypto, will say trading. Trading is one of the most straightforward and probably the most popular ways to make money with crypto. But there are several other ways to make money with crypto, and most of them are surer bets than trading – by far. 

And the good part? You only need to take action and sit back and watch your money grow with some of the ways. And get this: with some ways like staking, the returns are substantially higher than you could ever get with the traditional finance system. Others, like blockchain-based content creation, may require a more hands-on approach but still can be done alongside your daily job or business. 

 With that, let’s get straight to it!

#1. Mining 

In cryptoverse, mining is the process of using computing power to make guesses until you arrive at the correct hash, which then unlocks the next block in a blockchain network. Crypto miners receive crypto rewards for finding blocks and recording them on the blockchain network. You do not have to have crypto holdings to mine crypto. Miners can choose to convert their block rewards to Fiat immediately, HODL them, or plow those earnings back to their mining system. 

When Bitcoin was starting, anyone could mine from the home computer. But as the mining difficulty increased, the average daily computer could no longer hack it. We moved from CPUs to GPUs (some cryptocurrencies can still be mined with GPUs) to ASICs (Application-specific Integrated Circuits). ASICs utilize specific chips tailor-made for a particular cryptocurrency. Some of the most popular cryptocurrencies, i.e., Bitcoin and Ethereum, are mined with ASICs. 

Today, you can find an ASIC miner for an average of $1,000. If you plan to mine crypto, it’s best to join a mining pool. A mining pool is a team of miners who combine their computational resources to stand a better chance of finding new blocks. The block reward is then shared among the participants, depending on their contribution. Due to the combined computational power, miners in a mining pool are more likely to discover new blocks than individual miners. 

Tip: Join a mining pool for better profitability. 

#2. Staking 

One of the more easy-going ways to earn passive crypto income, staking, involves depositing crypto funds to get staking rewards. Staking networks utilize proof-of-stake or related consensus mechanisms, e.g., delegated proof of stake. With staking, mostly what’s required is just holding tokens in your wallet. In other cases, you need to add or delegate the funds to a staking pool. In DeFi pools, staking similarly involves putting up supported cryptos and earning interest.

When you stake in a network, you’re contributing to that network’s security and resilience, hence the reward. Staking is one of the simple ways to multiply your crypto holdings with minimal effort. 

#3. Lending 

Lending is another hands-off method to make money with crypto. There are multiple peer-to-peer lending platforms (Coin Loan, Nexo, BlockFi, Celcius, EthLend, etc.) that allow you to lock up crypto and earn interest in return. Usually, the interest rate is set by the platform or by you based on prevailing market trends. The more you lend, the more you stand to reap. 

#4. Lightning nodes 

The Lightning Network is a layer 2 solution for blockchains such as Bitcoin. It’s an off-chain payment channel that facilitates the processing of transactions without them being transferred to the underlying blockchain. 

When you use the Lightning Network to conduct a transaction, it’s quicker than if done on the blockchain. A network like Bitcoin only allows one-directional transactions. For instance, if Alice sends Bob one bitcoin, Bob cannot use the same channel to send it back to Alice. On the other hand, the Lightning Network utilizes bi-directional channels that require the involvement of both parties. This makes transactions quicker. 

When you run a Lightning node, you have the ability to process a lot of transactions quickly and get rewarded with transactions’ fees. 

#5. Affiliate programs 

Some crypto projects, especially new ones, will usually reward existing participants for bringing new ones to the platform. If you have, let’s say, a huge social media following, affiliate and referral programs can be a great way to earn passive income. Bear in mind that it behooves you to carry out research on any project you promote. 

#6. Masternodes 

A masternode is like a server, except it runs on a decentralized network. Typically, network participants have to put up sizable amounts of investment to become masternodes. Due to the significant investment, masternodes have a big incentive to maintain and secure the network. 

Crypto projects usually give special privileges to participants who have a considerable stake in their networks, in addition to rewarding them with return rates. 

#7. Airdrops

Airdrops are tokens given away for free by crypto projects in an effort to publicize or market themselves by getting people to talk about it. All you need is a wallet address of a particular crypto when the airdrop is taking place. For other projects, you’ll need to register on the project’s website and do things like retweeting posts, leaving comments on social media posts, sharing posts on platforms like WhatsApp, Telegram, and so forth. Also, some exchanges will conduct airdrops for the users occasionally. 

To have a heads up on upcoming airdrops, you should register sites dedicated to spreading the word about the exact matter. Such sites include Airdropaddict, Icodrops, etc. 

Note that receiving an airdrop will never require the sharing of private keys – a condition that is a telltale sign of a scam.

#8. Creating blockchain and crypto-based content 

With the advent of blockchain, previously unexplored modes of content creation and sharing are now possible. Blockchain-powered content platforms like Steemit allow content owners to monetize their work in various ways – and without intrusive ads popping all over. In such platforms, content creators get to own the rights and ownership of their work. Once you create a substantial portfolio of work, you can monetize it over time. 

Final Thoughts 

What’s better than earning passive income is doing so in a safe and secure environment, and that’s what you get with the activities on this list. Whether it’s staking, mining, running a masternode, you can make money from crypto with minimal effort. Of course, always make sure to do your own research before putting your money anywhere. Good luck! 

Categories
Forex Basic Strategies

The Best Tools to Trade Pullbacks Effectively

A Pullback is a pause, retracement, or consolidation of a price from the most recent peak during an ongoing trend. The pullback is widely seen as a trading opportunity after the underlying asset experienced a large upside or downside move. For example – Any forex pair is in a strong uptrend, and some healthy news came, and price action dropped back to the most recent support area that indicates the professional traders are booking the profits.

Pullbacks happen all the time, and if you learn how to trade them successfully, it can be a great skill as a trader. Trading the pullback is the easiest way to trade the market, sometimes you will recognize the high probability pullback trades and sometimes extreme volatile pullbacks, and you can enhance your repertoire and find many higher probability trades. If you are new in the market, then pullback trading is a fantastic and easy way to find superior risk-to-reward ratio trades. In this article, we will explore five trading strategies that provide excellent pullback trades.

Pullback Trading Strategies

Two-Legged Pullback To The MA 

Al Brooks popularized the concept of two legs pullback in his price action books. He explained most of the time, price action print two legs to reach the moving average. We backtested his strategy and found out that his techniques work very well in the trending market, but sometimes in the strong trending market, you will only witness one leg.

This is because most market operators are in a hurry to move the market; this may be because of any fundamental news. To filter out all the low probability trades, it is advisable to find a trending market and then wait for the price action to print the two legs towards the moving average, and when all the moves complete, take the buy entry.

The image below represents the buying trade in the EURGBP forex pair. The moving average indicates the buying trend in the currency. Price action pulled back to the moving average, prices responded from the moving average and goes a bit higher and end up printing the second leg. The second leg goes down to the moving average, but the strong buyers smack back up and close above the moving average. Furthermore, the price slows down a bit, and we took buying entry with the stops below the entry, and for taking profit, we choose the brand new higher high.

Candlestick Pattern + MA

This method will use the bullish engulfing candlestick pattern with a moving average to successfully trade the market.

Here we need two ingredients.

  1. Price action pullback to the moving average.
  2. The market forms a bullish engulfing pattern.

First of all, look for the strong trending market and wait for price action to approach the moving average. At this stage, if the price action prints the engulfing pattern,  it’s the right time for you to go for a buy entry. Otherwise, no entries are allowed for you. An  Engulfing Pattern indicates the sellers try to print the brand new lower low, but because of dynamic support of moving average prices pulled back and buyers end up eating all the sellers. As a result, we witnessed the Bullish Engulfing pattern.

The image below represents the buying trade in the EURNZD forex pair. As you can see, at the end of the downtrend, price action goes above the moving average, and we witnessed the engulfing pattern. The trading pattern closed above the moving average, which was a confirmation of buyers came back to the show and were expecting the brand new higher high.

Trendlines + Channel Trading

This one is the simple trading approach, which is not much popular, but it often generates wonderful trading results. First of all, you must draw the trend line to the ongoing trend, and when the price action pulls back enough, then draw the price channel to identify the oversold and overbought area. When price action approaches the trend line as well as the lower line of the price channel, it is an indication to go long.

The image below represents the buying entry in the AUDCHF forex pair. The trend line was the indication that the buyers are leading the show. During the pullback phase, when enough sellers approach the trend line and the lower channel line, it gave the strong buying candle. The reason we got the strong candle is because for the support and resistance trader, the zone was a dynamic support area to go long.

RSI + Stochastic Indicator

In this approach, we are using the two oscillators to trade the pullbacks. Stochastic and RSI both are oscillators, and they both oscillate between the significant levels. In an uptrend, wait for the price action to pull back. When the stochastic and RSI gave the oversold signal, it is a perfect time to go for a brand new higher high.

The image below indicates the buying trade in the AUDCHF forex pair. The pair was overall in an uptrend, and during the pullback, both of the indicators were showing the oversold signals, and the reversal at the oversold area was a great sign to go long. When both oscillators indicate the same sign, there is no point in going for more significant stops. When both oscillators gave the reversal signal at the significant resistance level, that’s a perfect time to close your trade.

Conclusion

All the pullback strategies share the same goal, which is to time the market. The better you master the skill of timing before the take-off, the more profits you will make. If you are a newbie trader, then master these strategies first on the demo and then apply to the live market because trying any of these strategies in the live market is dangerous without having any experience.

So never try anything on the live account. Instead, practice them on demo first and then make a profit on a live account. When you master these strategies, then you can very easily design a pullback strategy for yourself. Whichever strategy fits nicely into your trading approach, master it.

Categories
Cryptocurrencies

Xapo Wallet Review: Is Xapo The Most Secure Custodial Wallet?

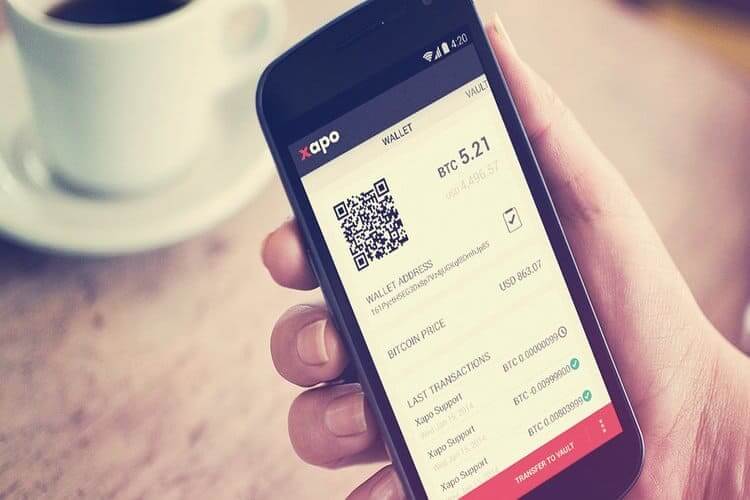
Xapo is an app-based crypto wallet that seeks to provide the most accessible and highly secure platform for Bitcoin users. It was founded by Wences Cesares – an international entrepreneur and financial technology expert – and it is registered and incorporated in Gibraltar. On their website, the Xapo crypto app is described as a ‘secure alternative platform’ that goes beyond the industry standards in helping you protect your livelihood and digital assets.

Some of the factors that set it apart from the competition include the fact that it is a Bitcoin-only wallet app. Further, it is a custodial wallet that stores your private keys in highly advanced and ultra-secure storage vaults that are never connected to the internet. In this Xapo wallet review, we vet the wallet’s security, ease of use, look at its pros and cons, and provide you with a step-by-step guide on how to use the Xapo app.

Xapo Crypto app key features:

Mobile wallet: Xapo is a mobile crypto app available to Android and iOS phone users.

Purchase Crypto with Fiat: Xapo has collaborated with numerous payment processing service providers that you can use to buy Bitcoins off the platform. These include direct wire transfers as well as credit and debit card purchases.

Inbuilt exchange: Xapo has also come up with a peer-to-peer exchange platform where users can exchange Bitcoins for fiat currencies. These in-app exchanges are free.

Portfolio tracker: On the Xapo user interface is the balance tab that lets you view your wallet balances in real-time, as well as the activity tab that keeps a record of all your transaction history. The two play a key role in helping you keep tabs on your expenses and help with budgeting by monitoring your crypto inflows and outflows.

Automated notifications: Xapo makes it possible to set automated notifications for different wallet functions. For instance, you can have the wallet send you a notification every time you receive crypto when cryptos are drawn from the wallet, and Bitcoin price alerts.

Multisignature wallet: The multisignature functionality of the Xapo crypto app makes it possible for you to share the app with family and segregate everyone’s funds.

Integrates debit card: Xapo recently launched the prepaid Xapo debit card that you can integrate with your Xapo crypto wallet and use it to pay for goods and services on the different crypto-friendly point of sale or withdraw funds from Bitcoin ATMs.

Libra member: Xapo is one of the founding members of the Libra blockchain network put together by Facebook. According to the Xapo website, the app’s development team provides technical expertise to help the association launch and run the Libra global currency sustainably.

Security features:

Password: Like most other crypto wallet apps, the Xapo crypto vault is secured with a password.

Two-factor authentication: All outbound transfers from the Xapo wallet app must be subjected to two-factor authentication. You have the option of receiving the verification code via email, SMS, or google authenticator.  

Cold storage: Unlike most other wallets that give you absolute control of your wallets by saving the private key in your phone, Xapo keeps the private keys safe on your behalf. According to the crypto security company, all your private keys are stored in ultra-secure vaults in the Swiss Alps and other parts of the world. They further add these vaults don’t connect to the internet, and they are largely made from demilitarized bunkers.

Highly encrypted: All your data, including the private keys, is shared with and stored in Xapo servers and is highly encrypted using proprietary encryption technology. And so are Xapo’s communication with third party systems like payment processors and third-party exchanges.

How to set and activate the Xapo wallet:

Step 1: Start by downloading the Xapo crypto mobile app from Google Play Store or Apple App Store.

Step 2: Install and launch the app, choose your country of residence, and enter your phone number.

Step 3: Verify the number by entering the 6-digit code received via SMS

Step 4: Enter your email address

Step 5: Complete the user profile by completing the registration form

Step 6: Choose your country of origin/citizenship from the drop-down menu

Step 7: Read and agree to Xapo wallet’s terms of use

Step 8: Create a 4-digit passcode for your Xapo wallet app

Step 9: Verify identity by uploading a photo of yourself and that of a government-issued identification document as well as a proof of address

Step 10: The app will now send a verification link to the email provided. Open the link to activate the account.

Step 11: Your Xapo wallet app account is now active and ready for use

How to add/ receive crypto into your Xapo wallet 

Step 1: Log in to your Xapo app, and on the dashboard, click on ‘My Money.’

Step 2: Tap on the ‘Add Money’ on the next window

Step 3: Follow the prompts to add Bitcoins using one of the provided account funding options.

How to send crypto from your Xapo wallet

Step 1: Log in to your Xapo wallet app and click on the ‘Payments’ tab.

Step 2: If you wish to send funds to an individual on your contact list, click on the “Transfer to a contact” tab, and select “Allow access.”

Step 3: Select the recipient and click on the “$” sign to initiate a transfer.

Step 4: Choose the account you wish to send the funds from, the amount you wish to send, the currency type, and click “Send.”

Step 5: Review the transactions and check the accuracy of the details before hitting “Confirm.”

Step 6: Enter the PIN code to authorize the pay

Xapo wallet ease of use

Xapo wallet has a highly intuitive and beginner-friendly user interface. It only has a few tabs that are carefully placed on the user dashboard to ease your in-app navigation and how you interact with the wallet.

The app’s onboarding process, though lengthy, is quite straightforward. And so are the processes of adding funds, receiving and sending Bitcoins and other Fiat currencies in and out of the wallet.

Xapo wallet supported currencies and countries.

Xapo is a Bitcoin-only crypto wallet app. Interestingly, and unlike most other Bitcoin-only wallets that extend their support to Bitcoin forks, Xapo does not support any other crypto, including such Bitcoin forks as Bitcoin Gold and Bitcoin Cash.

However, the integrated peer-to-peer exchange makes it possible for users to exchange Bitcoin with over 150 Fiat currencies.

Currently, the Xapo crypto wallet app is available in about 30 countries across the world.

Xapo wallet cost and fees 

Downloading and installing the Xapo crypto wallet app as well as storing your Bitcoins therein is free. You also won’t be charged for using their in-app peer to peer exchange or transferring funds from one Xapo wallet to another.

Outbound Bitcoin transfers to other wallets or exchange will, however, attract a network fee charged by Bitcoin miners and not Xapo. The fee is nevertheless dynamic, and you have the option of choosing either the standard fee for normal confirmation speeds or priority fee for trades you wish processed and confirmed urgently.

Xapo wallet customer support

Xapo’s customer support has a rather elaborate FAQ guide on the company website that addresses Xapo wallet users’ common challenges and provides troubleshooting guides. There also are tutorials that try to explain how you interact with the Xapo app.

You can also contact them via email, the live chat feature on both the website and the app, or direct message them on such social media platforms as Twitter, Facebook, and Instagram.

What are the pros and cons of using the Xapo wallet?

Pros:

  • Transfers from one Xapo wallet to another are free
  • It stores your private keys in cold storages and ultra-secure offline vaults
  • It allows you to buy Bitcoin with Fiat currency
  • It features an inbuilt peer-to-peer exchange
  • It integrates the Xapo Debit that you can use to pay for goods and services or withdraw at Bitcoin ATMs

Cons:

  • It will only support Bitcoins
  • It doesn’t support anonymous crypto transactions as all users must be subjected to KYC and AML procedures
  • It has an unnecessarily lengthy registration process

Comparing Xapo wallet with other Bitcoin-only wallets

Xapo wallet vs. BTC.com wallet

Xapo and BTC.com are both Bitcoin-only wallets. But unlike Xapo, which is a mobile crypto app, BTC.com is a web-based wallet. BTC.com is a lot easier to use and interact with as it not only features a friendly user interface but also has an easier onboarding process.

Xapo, however, carries the day when it comes to the security of client funds. Plus, while BTC.com’s online nature exposes its inherent threats associated with hot wallets, Xapo is a custodial wallet that stores client private keys in highly decentralized and ultra-secure cold storage.

Verdict: Is the Xapo wallet safe?

Xarpo is a custodial wallet that stores client funds in decentralized cold storages spread across the world. It has also put in additional client-side security features that deter unauthorized access to these keys, like securing the app with a passcode, two-factor authentication, and automated alerts on transfers and changes in digital asset balances. One might consider such security measures adequate, but we must observe that these don’t necessarily make you and your wallet immune from such social engineering threats as phishing.

Categories
Crypto Daily Topic

8 Great Tricks to Maximize Your Mining Profits: Number 7 will Amaze you!

Cryptocurrency has opened up so many opportunities to make money. Whether it’s HODLing, staking, or mining, there’s always an opportunity to make money with crypto. Now, some of these are pretty straightforward. You deposit your crypto and sit and watch your money grow. Or you HODL and move in one day when the market is particularly bullish. But other ways, such as mining, are not as straightforward. 

Making money via crypto mining takes more than buying hardware and starting to mine right away. You want your investment in hardware, electricity, and time to count. These 8 tricks will show you how to maximize your crypto mining profit to get the best returns on investment. 

#1. Do your homework

Doing background research is one of the first things you should do before you engage with crypto mining in any capacity. Crypto mining is already complicated, and the same way you can gain lucratively is the same way you can lose.

Start with mining equipment. Check whether the type of equipment you intend to acquire and deploy is outdated. Study whether the market is currently favorable – you may find that it’s more profitable to buy the crypto rather than invest to mine it.

#2. Check whether it’s a good time to enter 

Just like with everything, there are good and bad times to jump into crypto mining. For instance, during the crypto market’s incredible bull run in 2017, crypto mining hardware from manufacturers was pretty much sold out. Most of the profitable equipment could only be found in second-hand marketplaces selling it at exorbitant prices. These hiked prices virtually made any projected profits not worth it. 

This time may have seemed a good time to start mining, but with hardware speculators milking the market as much as possible, the conditions were not the most favorable. 

On the other hand, when cryptos are trading at a much-reduced rate, you may get mining hardware at much better prices both from the manufacturer and second-hand marketplaces. This way, you stand actually to profit from the equipment rebounds. 

#3. Switch to low hash rate cryptocurrencies

This is one of the best-kept secrets of the crypto mining world. Unlike popular belief, it’s possible to find a smaller cryptocurrency with a higher return on investment than a ‘mainstream’ cryptocurrency. Smaller currencies also usually have a lower hash rate, meaning you can contribute a larger hash rate and reap a bigger mining reward. 

This means keeping an eye out on all the other markets, not just the ones you’re currently mining. If you’re using a GPU, you have even better chances. GPUs, unlike ASICs, have the flexibility of being able to mine different cryptocurrencies. 

#4. Mine brand new cryptocurrencies

Mining a new cryptocurrency can be very profitable – sometimes. When a new crypto enters the market, there’s a phase of euphoria as the creators crank up the hype, creating interest in the currency. As a result, the currency in question might have considerable value in the first few days, weeks, or even months. 

What you need to do is be there at the very start. Depending on the currency, you can mine with GPUs, as ASIC manufacturers have not yet had time to develop an algorithm for the particular currency. Due to the unpredictable nature of cryptocurrencies and especially brand new ones, you want to quickly exchange the earnings for more reliant cryptos or Fiat. 

#5. Start small

This is universal wisdom for getting into any kind of business endeavor. It’s much truer for a market as volatile as cryptocurrency, isn’t it? When you’re new in the space, there’s so much you need to learn, and any rushed moves are highly discouraged. 

When you start small, any losses are also less painful. You also build the right skill set as you learn what works and what doesn’t. After you’ve figured out how crypto mining works, you can scale up. 

#6. Explore various scaling choices 

There are so many ways you can scale your crypto mining operation. This can be replacing aging equipment – which will lead to an increased heart rate while maintaining low expenditures and increasing your return on investment (ROI). 

You can also scale by buying mining capability from hash rate marketplaces. There’s also the option of cloud mining, where you purchase high amounts of hash rate for your favorite crypto or algorithm from companies that specialize in such. Whichever scaling method you choose, be sure to avoid third-party risk by doing appropriate research beforehand. 

#7. Find cheap energy

We can’t overemphasize the importance of inexpensive energy when it comes to crypto mining. Electricity is usually the largest expenditure involved in crypto mining. So when you save on energy costs, that’s more money for your bottom line. 

Also, depending on the region and electricity cost, your equipment may be profitable or not. In some parts of the world, energy prices tend to fluctuate instead of being constant. Some professional miners actually migrate in pursuit of cheap energy. 

The point is, you can increase your ROI if you find cheaper energy. You can even talk to your utility provider and see what’s the best rates they can provide. Again, this depends on your locale. 

#8. Join a mining pool

Now, we’d be remiss if we didn’t include joining a mining pool in this list. A mining pool is a group of miners who combine their computational power so as to discover new blocks faster. If the pool succeeds in finding a blog, the block reward is shared proportionally to each contributor’s processing power.

Why should you join a mining pool? Because the more the computational power, the more the likelihood for discovering and processing new blocks. As you can see, an individual miner would have a big challenge – financially and otherwise, assembling that kind of power. While going it alone doesn’t mean you’ll never see profits, it means they will be few and very far between. On the other hand, you stand a better chance to earn smaller but more frequent rewards with a mining pool. 

Final Thoughts 

Crypto mining is a great way to make money. Whether you’re a veteran in the scene or just getting started, these tips will help you make the best of your mining endeavor. Good luck! 

Categories
Forex Fundamental Analysis

US 10-Year TIPS Auction – Everything About This Macro Economic Indicator

Introduction

For any long-term investment, taking the future rate of inflation into account is paramount. The reason for this is because inflation eats into the expected returns. Thus, if you could find a way to insulate your investments from this, you most definitely will. The goal of any inflation-protected investment is to ensure that you are cushioned from the reduction in the purchasing power.

Understanding the US 10-Year TIPS Auction

TIPS refers to Treasury Inflation-Protected Securities. As the name suggests, these are US government-issued securities meant to provide investors with protection against the effects of inflation.

US 10-Year TIPS are Inflation-Protected treasury bonds issued by the US Department of the Treasury. The principal on these bonds is meant to finance spending activities by the US government and is redeemable after ten years.

TIPS auction refers to the sale of the inflation-protected treasury bonds by the US Department of Treasury. Originally, the 10-Year US TIPS are auctioned twice a year – in January and July. The reopening auctions are done in March, May, September, and November. Thus, these auctions are scheduled every two months.

Discount rate: The percentage difference between the price at which the TIPS is bought at auction and the one at which it can be redeemed.

Maturity: For the US Treasury Inflation-Protected Securities, the maturity period refers to the maximum time an investor can hold the bonds before redemption. These bonds are usually issued with a maturity period of 5, 10, and 30 years from the auction date. Usually, the minimum duration of ownership is 45 days. Therefore, one can choose to sell their TIPS before maturity or hold them until maturity.

How to Buy TIPS

TIPS can only be bought in electronic form. The minimum amount of TIPS one can purchase is $100 and increments of $100 after that. The maximum amount that a bidder can purchase in a single auction is $5 million. During the auction, the interest rate on the TIPS is determined by the competitive buyers.

The competitive bidders usually specify the yield that they are willing to accept. The competitive bidders for TIPS are large buyers such as brokerage firms, investment firms, and banks. The competitive bidders set the yield for the TIPS, which requires one to have an in-depth knowledge of the money markets. Competitive bidders are required to submit the number of TIPS they intend to buy and the return on investment they seek. This return is the discount rate.

Not all competitive bids are accepted at the auction. When the competitive bid is equal to the high yield, less than the full amount wanted by an investor might be accepted. The bid might be entirely rejected if it is higher than the yield accepted during the auction. The non-competitive bidders are regarded as “takers” of the yield set by the winning competitive bidders.

Once the bidding process is over, the treasury distributes the issuance. Let’s say, for example, that in an auction, the US Department of Treasury is auctioning $20 billion worth of TIPS. If the non-competitive bids are worth $5 billion, they are all accepted. The remaining $15 billion is then distributed among the competitive bidders. The lower competitive bids are filled first until the $15 billion is exhausted.

Using the US 10-Year TIPS Auction for Analysis

Since the TIPS’s primary goal is to safeguard against the effects of inflation, the interest rate paid on them can be used as an indicator of possible inflation rates in the future.

Before we explain how the US 10-year TIPS auctions can be used for analysis, here are two things you need to keep in mind.

  • TIPS’s interest rate is paid semi-annually at a fixed rate, which is usually based on the adjusted principal.
  • Whenever inflation rises, the interest rate rises, and when there is deflation, the interest rate drops.

Once TIPS have been auctioned and traded in the secondary market, when inflation in the economy rises, the principal on TIPS increases as well. Thus, the interest rate payable on these TIPS increases as well. During the TIPS’ subsequent issues, the interest rate payable will reflect the prevailing rate of inflation. Furthermore, the discount rate set at the auctions can be used to gauge the level of confidence that investors have in the US economy. The lower discount rate shows that the current investment atmosphere in the economy is risky; hence, investors are willing to take lower returns than risk losing their principal in other markets.

On the other hand, when investors can get better returns in other markets within the economy, they would demand a higher discount rate. Furthermore, when there is deflation in the economy, the principal on the TIPS falls along with the interest rates payable.

Impact on Currency

Theoretically, the auction of the US 10-year TIPS can impact the currency in two ways. By showing the confidence level in the economy and by showing the prevailing rates of inflation.

When the interest rate payable on the TIPS increases, it shows that the levels are increasing. This increase shows that the economy is growing, which is good for the currency. Furthermore, the higher discount rate at auctions implies that investors can get better rates elsewhere in the economy.

Conversely, the currency will depreciate relative to others when TIPS’s interest rate decreases, which implies that there is deflation in the economy. This instance can also play out if discount rates at the auction are at historical lows. It shows that the economy is performing poorly and that investors may not get better returns elsewhere.

Sources of Data

US Department of Treasury is responsible for the auction of the US 10-year TIPS. The data of the latest TIPS auction can be accessed from Treasury Direct. Treasury Direct also publishes data on the upcoming TIPS auction, which can be accessed here.

St. Louis FRED publishes an in-depth series of the US 10-year TIPS.

Source: St. Louis FRED

How US 10-Year TIPS Auction Affects the Forex Price Charts

The most recent auction of the US 10-year TIPS was on September 17, 2020, at 1.00 PM EST. The data on the auction can be accessed at Investing.com. The US 10-Year TIPS auction is expected to have a low impact on the USD, as shown by the screengrab below.

During the recent auction, the rate for the 10-year TIPS was -0.996% compared to -0.930% on the July auction.

Let’s see what impact this release had on the USD.

EUR/USD: Before US 10-Year TIPS Auction on September 17, 2020, 
Just Before 1.00 PM EST  

Before the auction, the EUR/USD pair went from trading in a steady uptrend to a subdued uptrend. The 20-period MA can be seen going from a steep rise to almost flattening as the candles formed just above it.

EUR/USD: After US 10-Year TIPS Auction on September 17, 2020, at 1.00 PM EST

Immediately after the release of the auction data, the pair formed a 5-minute “Doji” candle. Subsequently, the EUR/USD pair continued to trade in the subdued uptrend with candles forming just above an almost flattened 20-period MA.

Bottom Line

From these analyses, we can establish that the US 10-year tips auction has no significant impact on the forex price charts. The reason for this could be because most forex traders do not keep an eye on bond auctions but instead focus on more mainstream indicators like the CPI and GDP.

Categories
Forex Course

177. Simple Guide To Find the ‘Commitment of Traders’ Report

Introduction

The previous lesson covered what the Commitment of Traders report is. In this lesson, we will focus on how and where you can retrieve the COT report. The COT report is prepared and published every Friday at 3.30 PM ET by the US Commodity Futures Trading Commission. However, you can access the latest report and those from previous issues at the CFTC website.

The CFTC publishes beforehand the release schedule for the COT report. This schedule can be accessed here. The commission also keeps an archive of all past reports. The historical Commitment of Traders reports can be accessed here.

For forex traders, reading through the COT report might seem cumbersome. If you are interested in trading the forex market using the COT report, some economic calendars make available relevant snippets of select speculative net positions from the report. Below is a screenshot from Investing.com showing the latest release of the COT report on September 18, 2020, at 3.30 PM ET.

If you are interested in an in-depth review of the latest Commitment of Traders report, below is a step by step procedure of how to access it.

Step 1: to view the latest COT report, go to the CFTC website.

Step 2: After accessing the CFTC website, the next step is to find the right report for the forex market. The CFTC published multiple Commitment of Traders reports. These reports include markets other than the Chicago Mercantile Exchange that also contain other non-futures derivative contracts.

The COT report that has data on the forex market is the ‘Current Legacy Reports.’ Under the ‘Current Legacy Reports,’ select the formats belonging to the Chicago Mercantile Exchange.  Below is a screengrab of the from the CFTC website.

To access the COT report, select ‘Short Format’ under the ‘Futures Only’ tab.

Alternatively, if you want a more comprehensive report on the future positioning of traders in the financial sector, you should look at the ‘Current Traders in Financial Futures Report.’ Below is a screengrab from the CFTC website showing this section.

Step 3: After opening the ‘ Short Format’ of Chicago Mercantile Exchange section of the COT, the next step is to identify which currency you are interested in.

Although it looks disorganized, searching through the report is relatively easy. Use the ‘search function’ of your browser to bring up the ‘search box.’ Type the currency you want to analyze. In this case, we searched for the CAD. The search results will appear, as shown in the screengrab below.

I hope you found this guide informative. Please let us know if you have any questions in the comments below. Don’t forget to take the below quiz before you go. Cheers!

[wp_quiz id=”89672″]
Categories
Cryptocurrencies

BitBox02 Hardware wallet Review: How Safe Is The Bitbox Hardware Wallet?

Bitbox02 is a hardware crypto wallet developed by Shift Cryptosecurity AG, a technology company based in Zurich, Switzerland. It has a minimalistic design but packs a wide range of highly effective security features. And this falls in line with its mission of providing users with a secure and independent hardware wallet. According to the Shift Crypto website, the hardware wallet was developed by an international team of programming and crypto security specialists as an improvement of BitBox01.

Some of this wallet’s key features include an OLED display and invisible touch sensors for ease of navigation and a secure element, multi-signature support, and enterprise-grade encryption. In this review, we will be vetting BitBox02’s safety and ease of use by detailing its key security features, its step-by-step activation guide, number of supported currencies, and its pros and cons:

Key features:

Solid architecture: BitBox02 is ultralight, weighing only 12g. It is also made from a highly durable polycarbonate that can resist such elements as heat and water.

OLED display: BitBox02 features a white and 128*64 pixels OLED display. It plays a key role in easing in-wallet navigation and is large enough to fit a wallet address.

Invisible touch sensors: In addition to the OLED display is a range of invisible touch sensors that line up the sides of the wallet device. These also play a key role in navigating the wallet and approving outbound crypto transactions.

Desktop and mobile app compatible: BitBox02 is a cross-platform hardware wallet. It has a compatible desktop app for all the popular desktop operating systems like Windows, macOS, and Linux. Their website also hints at an upcoming mobile crypto wallet.

Multi-wallet: The wallet’s software is available in two downloadable data sheets; the BitBox02 multi and BitBox02 BTC. BitBox02 BTC ensures that the wallet will only support Bitcoin Cryptocurrency, while BitBox02 Multi supports popular cryptos.

Security features:

Password: Both the BitBox02 hardware wallet and compatible BitBox02 apps have a password as their primary deterrence against unauthorized access. You get to set both when activating the wallet and creating a user account.

Open-sourced: BitBox02 hardware wallet is highly transparent in that it is built on a fully open-sourced technology. This implies that both the app and the wallet firmware are open for viewing and auditing by wallet users and crypto security experts.

Secure element: BitBox02 wallet’s secure element is made up of dual chips that are used to store your encrypted private keys. The dual-chip architecture is designed using proprietary technology. They are also reinforced with a monotonic counter technology that limits the number of login attempts and a password stretcher that extends the amount of time required between login attempts while erasing the wallet contents after 15 unsuccessful attempts.

Instant backup: The BitBox02 hardware wallet comes with an SD card that you can use to back up your private keys. Unlike most other hardware wallets that provide you with an easy-to-forget recovery seed, the BitBox02 hardware wallet presents you with an SD card that you can use to back up your recovery seed instantaneously.

Enterprise-grade encryption: Your private keys, passwords, personal data held in your BitBox02 wallet is highly encrypted using the AES-256-CBC technology. Your wallet’s communications with other third party websites and systems are also subjected to end-to-end encryption.

Two-factor authentication: Outbound crypto transfers must also be subjected to two-factor verification processes.

Cold storage: Your private keys and any other personal data held in the wallet is held in offline cold storage. This gives you absolute control over your private keys and their backup.

FIDO-certified: BitBox02 wallet is FIDO certified as a Universal two-factor authenticator.

How to set and activate the BitBox Hardware wallet

Step 1: Start by ordering your BitBox hardware wallet on the Shift Crypto website.

Step 2: Download the BitBox02 desktop wallet app that’s compatible with your computer operating system.

Step 3: Plugin the hardware device (ensure the SD card is inserted)

Step 4: Chose a name for the wallet and create a unique wallet password.

Step 5: You will now have access to the BitBox02 wallet dashboard. Start by agreeing to the security information displayed to proceed.

Step 6:  On the ‘create a new wallet’ tab, enter your preferred wallet name, and create a password

Step 7: Remove the SD Card and keep it safe.

Step 8: The wallet is now active and ready to use

How to add/ receive crypto into your BitBox Hardware wallet

Step 1: Start by logging in to the BitBox02 wallet.

Step 2: If you are operating the multi-crypto wallet, select the coin you would like to receive

Step 3: Copy the wallet address or QR code and forward it to the party sending you crypto.

Step 4: Wait for the funds to reflect in your account.

How to send Crypto from your BitBox Hardware wallet

Step 1: Log in to your BitBox02 wallet

Step 2: If you are operating a multi-cryptocurrency wallet, select the coin you wish to send

Step 3: Enter the recipient’s wallet address and the amount of crypto you wish to send

Step 4: Insert the BitBox0 hardware wallet

Step 5: Confirm the transaction details on the hardware device and authorize the transfer by pressing the invisible touch sensors on the device.

BitBox Hardware wallet ease of use

The BitBox02 hardware wallet package doesn’t give you a manual/user guide, just a link to their website printed on the packaging box’s underside. It, however, is quite easy to use. Setting up the wallet, linking it with the desktop app, and creating a user account is quite straightforward.

Interacting with the app by sending or receiving crypto into the wallet or backing up your digital assets is also quite easy. And all these play a key role in making BitBox02 the most user-friendly hardware wallet.

BitBox Hardware wallet supported currencies and countries.

The number of cryptocurrencies supported by the BitBox02 hardware wallet depends on the firmware installed. You can choose BitBox02 BTC that will only support Bitcoin and Litecoin or BitBox02 multi that supports a wider range of cryptocurrencies.

You can also integrate the app with MyEtherWallet that makes it possible for you to support BTC, LTC, ETH, and 1000+ tokens.

BitBox02 wallet can be shipped to virtually every crypto-friendly country in the world.

BitBox Hardware wallet cost and fees

BitBox02 hardware wallet retails at €99.

You will only have to pay the variable crypto transaction fee when sending cryptocurrencies and tokens to another wallet or exchange.

BitBox Hardware wallet customer support

BitBox02 hardware wallet distributors have a highly responsive customer support team accessible via email or such Shift Crypto official social media pages on Facebook, Twitter, Instagram, Telegram, and follow their blogs on Medium.

What are the pros and cons of using the BitBox Hardware Wallet?

Pros:

  • BitBox02 hardware wallet has a strong emphasis on security.
  • It is easy to backup and recover your wallet using the SD card.
  • It is compatible with both desktop and mobile apps for easy navigation.
  • You can integrate MyEtherWallet that expands the number of supported currencies.
  • It is easy to use.

Cons:

  • Will only support a limited number of coins and tokens.
  • The screen is really small.
  • One may consider their €99 price tag restrictive.

Comparing BitBox Hardware wallet with other hardware wallets

BitBox Hardware wallet vs. Ledger Nano S wallet

Bitbox02 and Ledger Nano are both crypto hardware wallets that take pride in the number and effectiveness of integrated security features. Some of their similarities include integrating two-factor authentication, sleek design, and the fact that they both store your private keys in offline cold storage.

But unlike Ledger Nano S that supports 1000+ cryptocurrencies and tokens, the BitBox02 hardware wallet will only support a handful of crypto assets. Plus, while Ledger Nano S presents you with a set or recovery seed that you can use to backup your private keys. Unlike Ledger Nano S, however, BitBox02 has a simpler setup guide and supports multi-signature functionality.

Verdict: Is the BitBox02 Hardware Wallet safe?

Yes, BitBox02 hardware wallet embraces some of the most effective security measures. These include the fact that the wallet is open-sourced, is FIDO certified to serve as a Universal two-factor authenticator, two-step verification for outbound transfers, and backing up your wallet in an SD card. But these aren’t the only factors endearing BitBox02 to its users. Others include its rather straightforward setup process and its intuitive user interface.

Categories
Crypto Market Analysis

BTC/USD Weekly Chart Analysis + Possible Outcomes

In this weekly BTC/USD analysis, we will be taking a brief look at the most recent events, current chart technical formations, as well as the possible BTC short-term price outcomes.

Overview

Bitcoin has spent the week constantly pushing towards the upside, with its price moving from around $16,500 on Monday all the way up to $19,000 at one point on Saturday. This left Bitcoin holders in a dilemma: should they hold or hedge their investments. Most holders are already satisfied with the BTC movement and don’t want to invest at such a high price, while some are hedging or even selling their funds to take a profit. On the other hand, such a large rally has “invited” the retail market to join in, and they are the majority of the buy force, alongside institutional investors that do not care about the current price and just want to invest every time they have funds available.

While many analysts called for a stronger pullback long before the most recent push, all significant bear-related signals were false.

Technical factors


Bitcoin has continued moving up, supported by the 50-period MA, which has proven as great support, as well as by the ascending (pink dotted) line. On top of that, the largest cryptocurrency by market cap has done a great job pushing through its previous highs and making higher highs/higher lows. If we consider the year-to-date Bitcoin balance on exchanges dropping 18% and institutions being more and more involved, we can almost certainly expect a long-term price increase.

The hash ribbons indicator is showing miner capitulation (ever since Oct 29), sending out a major buy/accumulation signal.

Likely Outcomes

Bitcoin has one main scenario, as well as one supporting scenario that is likely to play out.

1: If Bitcoin manages to hold the so-called pivot zone (18,250-$18,450), it is almost certain to bounce and reach the all-time high level, and possibly even pass it. In that case, longing Bitcoin after it confirms its position above the pivot zone is a great trade, as it has defined targets (target 1 = Bitcoin’s ATH; target 2 = ride the bull wave and continuously take profit until volume dies out) as well as a defined stop-loss target (right below the pivot zone).

If the first scenario plays out, it will most likely play out on the Nov 23rd, as this is when the pivot zone is meeting the ascending support line and (most likely) the 50-period moving average.

2: The second (and a bit less likely) scenario happens when Bitcoin fails to hold the pivot zone, in which case we can expect a price drop to $17,260.

A move that will end up below $17,260 is highly unlikely, simply due to the overall sentiment currently surrounding Bitcoin.

Categories
Forex Assets

Analysing The Costs Involved While Trading The AUD/MXN Exotic Pair

Introduction

In this exotic forex pair, the AUD represents the Australian dollar, while the MXN – the Mexican Peso. Exotic currency pairs have higher volatility in the forex market when compared to the other major pairs. Here, AUD is the base currency, where MXN is the quote currency. It means that the AUD/MXN exchange rate shows the amount that 1 AUD can buy in terms of MXN. Let’s say that the exchange rate for the AUD/MXN is 15.0346; it means that 1 AUD can be exchanged for 15.0346 MXN.

AUD/HUF Specification

Spread

When you go long in the forex market, you buy the currency pair from your broker at a higher price than when you sell it. The spread in forex is the difference between these two. The spread for the AUD/MXN pair is – ECN: 2 pips | STP: 7 pips

Fees

Some forex brokers charge a commission for every trade on ECN type accounts, depending on the value of the trade. STP accounts do not incur any trading fees.

Slippage

Sometimes when you place a market order, your broker will fill it in with a different price. This is slippage in forex trading; it is caused by increased volatility and the speed at which your broker executes the trade.

Trading Range in the AUD/MXN Pair

The trading range analyzes the spread between the highest and the lowest price movements across multiple timeframes. The trading range analysis ranges from the minimum, average, to the maximum volatility across all timeframes. It is used to assess the potential profitability of a currency pair across all timeframes.

The Procedure to assess Pip Ranges

  1. Add the ATR indicator to your chart
  2. Set the period to 1
  3. Add a 200-period SMA to this indicator
  4. Shrink the chart so you can determine a larger period
  5. Select your desired timeframe
  6. Measure the floor level and set this value as the min
  7. Measure the level of the 200-period SMA and set this as the average
  8. Measure the peak levels and set this as Max.

AUD/MXN Cost as a Percentage of the Trading Range

Further analysis of profitability can be aided by analyzing the percentage of the total cost to the volatility. These costs are put in terms of percentages of the volatility on all timeframes.

ECN Model Account costs

Spread = 2 | Slippage = 2 | Trading fee = 1 | Total cost = 5

STP Model Account

Spread = 7 | Slippage = 2 | Trading fee = 0 | Total cost = 9

The Ideal Timeframe to Trade  AUD/MXN Pair

For the AUD/MXN pair, the ideal trading timeframe appears to be the longer timeframes since trading costs are at their lowest here. We notice that the trading costs for the AUD/MXN pair decrease as the timeframes become longer. Also, note that at longer timeframes, the volatility is higher.

For traders wishing to trade the AUD/MXN pair for the shorter-term, timing their trades with when the volatility increases towards the maximum can help. More so, adopting the use of forex limit orders will lower the trading costs by ensuring there are no slippages.

ECN Account Using Limit Model Account

Total cost = Slippage + Spread + Trading fee = 0 + 2 + 1 = 3

Notice how using the forex limit order types reduces the overall trading costs across all timeframes. The maximum trading cost of the AUD/MXN pair, for instance, decreased from 84.75% of the trading range to 50.85%.

Categories
Forex Basic Strategies Forex Daily Topic

Trading The Forex Market Like A Pro Using The Williams %R Indicator

Introduction

In the forex market, the Relative Strength Index (RSI) is the most sought after technical indicator for measuring overbought and oversold conditions in the market. However, there are times when RSI can give misleading signals. To overcome some of these limitations of RSI, we use William’s %R (Williams Percentage Range) to help us identify when an asset is oversold or overbought.

Having determined that the asset has moved too much in one direction, we can position ourselves on the other side of the market after suitable confirmation. In today’s article, let’s discuss a strategy based on William’s %R indicator to identify when the market has become overbought or oversold. Let us first get into the specifications of the strategy.

Time Frame

The strategy works well on higher time frames such as ‘Weekly’ and ‘Daily.’ Therefore, the strategy is suitable for swing and long-term traders.

Indicators

We use the following indicators in the strategy:

  • William’s %R
  • Simple Moving Average (standard setting)

Currency Pairs

The strategy applies to all currency pairs listed on the broker’s platform, including major, minor, and exotic pairs. This is one of the distinguishing features of the strategy.

Strategy Concept

The William’s %R indicator usually ranges between 0 to -100, where a reading of 0 to -20 tells us that the asset is overbought. On the other hand, if %R falls in the range of -80 and -100, the asset is said to be oversold. As with other technical indicators, %R generates accurate trading signals when used in conjunction with other analytical tools such as chart patterns and systems.

Just because an asset may appear overbought and oversold based on the %R, this doesn’t necessarily mean that the price will reverse. Hence, we include a few concepts of the chart pattern and price action to confirm that the reversal is real. The more we wait, the higher the confirmation. But this reduces the risk-to-reward (RR) ratio moderately. This depends more on the type of trader if he is more conservative or aggressive.

In the strategy, we firstly establish a trend that is mostly in the overbought or oversold situation. This means William’s %R should indicate an overbought situation of the market for a major part of the trend during an uptrend. On the other hand, in a downtrend, William’s %R should indicate an oversold market situation for a major part of the trend. When the trend remains in the overbought or oversold condition for most of the time, the reversal tends to be sharp in nature.

This is why the above condition is important for the strategy. Next, we wait for the ‘Bullish Engulfing’ pattern to appear on the price chart, in a reversal of a downtrend. Likewise, in a reversal of an uptrend, we wait for the ‘Bearish Engulfing’ pattern to appear on the chart. This is the first sign of reversal. The reversal is confirmed when the price starts moving above the moving average, in a downtrend, and below the moving average, in an uptrend.

Stop-loss for the trade will be placed below the ‘engulfing’ pattern in a ‘long’ position and above the ‘engulfing’ pattern in a ‘short’ position.

Trade Setup

In order to explain the strategy, we will be executing a ‘long’ trade in EUR/USD currency pair using the below-mentioned rules. Here are the steps to execute the strategy.

Step 1: The first step of the strategy is to identify the major trend of the trend. An easy to determine trend is if the price is below the simple moving average, the market is in a downtrend, and if the price is above the simple moving average, the market is in an uptrend. Here we need to make sure that William’s %R indicates an overbought/oversold market situation for the major part of the trend.

The below image shows an example of a downtrend that is oversold.

Step 2: The next step is to wait for the market to present the ‘Engulfing’ pattern on the chart. In a downtrend, the ‘Bullish Engulfing’ pattern indicates a reversal of the trend, while in an uptrend, the ‘Bearish Engulfing’ pattern indicates a reversal of the trend. If the second of the engulfing pattern closes above the MA in a reversal of the downtrend, the reversal will be more prominent. Similarly, if the second candle closes below the MA in a reversal of the uptrend, the reversal can be resilient.

Step 3: The rule of entering the trade is fairly simple. We enter ‘long’ when the price starts moving further above the moving average after the occurrence of an ‘engulfing’ pattern. Similarly, we enter ‘short’ when the price starts moving further below the moving average after the occurrence of the ‘engulfing’ pattern.

Step 4: Lastly, we need to determine the stop-loss and take-profit for the trade. In a ‘long’ position, stop-loss is placed below the ‘Bullish Engulfing’ pattern. In a ‘short’ position, it is placed above the ‘Bearish Engulfing’ pattern. The take-profit is set at a point where the resultant risk-to-reward (RR) ratio of the trade will be 1.5. However, partial profits can be taken at the opposing ‘support’ and ‘resistance’ levels that might be a hurdle for the price.

In our example, the risk-to-reward (RR) ratio of 1.5 was achieved after a period of one month since traded on the ‘Daily’ time frame.

Strategy Roundup

William’s %R is a very powerful indicator that helps us identify opportunities during a reversal phase of the market. It is important to note that %R should never be used in isolation. Combining the %R indicator with chart pattern, price action, and market trend gives us an edge in the market, which is difficult to get when applied individually. Trade executed using the above strategy can longer than expected to give desirable results since it is based on a higher time frame.

Categories
Crypto Daily Topic Cryptocurrencies

What’s Injective Protocol All About? 

In this age of DeFi, project after project is competing to provide users all over the world with the most innovative products. Injective Protocol, a layer 2 decentralized exchange, is one of them. Injective wants to unleash the potential of crypto derivatives and borderless decentralized finance. 

The protocol supports cross-chain derivatives trading for multiple crypto products such as perpetual swaps, futures, CDFs, and more. In 2018, the protocol made it to the winner’s list of projects selected for incubation by Binance Labs. Injective wants to solve high latency, inefficiencies, and poor liquidity encountered by most exchanges today. 

Understanding the Injective Protocol

Launched in 2018, the Injective Protocol is a DeFi project that wants to enable decentralized and cross-chain spot trading and derivative trading of financial products, from perpetual swaps to CDFs, to futures and more. The platform utilizes ‘peg zones’ to realize a cross-chain trading infrastructure. This environment is also trustless, censorship-resistant, transparent, and with low fees. 

Highlights of the Injective Protocol

The Injective Protocol features the following highlights: 

#1 Layer 2 decentralized derivatives trading: Injective can support fast, autonomous and transparent trading 

#2. Trading opportunities: On Injective, anyone can create and trade on a derivative market of their choice by utilizing only a price feed. This increases opportunities for trading that are not found on other exchanges.

#3. Cross-chain trading: Injective supports a wide range of trading and yield generation activities across a variety of networks

#4. Community governance: The Injective Protocol will be governed by the community – in a true decentralization fashion. Any changes or updates to the protocol will be determined through a vote based on a decentralized autonomous organization (DAO) structure.

#5. Liquidity mining incentives: Injective users will have the ability to earn value through a variety of liquidity mining pools

Injective: Products and Technical Infrastructure

The Injective protocol is made of four key components: 

  • Injective Chain
  • Smart Contracts on Ethereum
  • API nodes
  • Front-end interface

Let’s take a close look at each: 

#1. Injective Chain

This is a decentralized sidechain solution that powers derivatives trading and supports a Trade Execution Coordinator (TEC) and a decentralized order book. The Injective Chain utilizes a Tendermint consensus mechanism to confirm and validate transactions. 

On the Chain, users can build derivatives through two ways: the Injective Futures Protocol and smart contracts. The Injective Futures Protocol allows traders to create, enter into, and execute decentralized perpetual swaps and CFDs. 

#2. Smart Contracts on Ethereum

As a token-based protocol, Injective is intricately linked with INJ, its native token. For that reason, major protocol interactions and token economics are implemented through various smart contracts, which are as follows: 

  • Injective Coordinator Contract: Implements orders and Injective’s derivative transactions both on Ethereum and the Injective Chain
  • Staking Contract: Manages core functions like token rewards, choosing delegates, and governance
  • Injective Futures Contracts: Smart contracts that allow traders to create and trade perpetual swap contracts on the market
  • Injective Bridge Contracts: A suite of smart contracts that manage the flow of info between the Injective Chain and the Ethereum network
  • Injective Token Contract: An ERC-20 contract for INJ token

#3. Injective API Nodes

Injective’s API nodes are responsible for two things: supporting transaction relay services and being the data layer of the protocol. 

  • Transaction Relay Service – This is a tool that formulates transactions and relays them to the Injective Chain. It also simplifies functionalities such as staking, voting, and governance.
  • Data layer – The API nodes also act as a data layer through which external clients can interact with the protocol. 

#4. Front-end interface

The Injective protocol is fully decentralized, meaning individuals and companies can use it in a permissionless manner. Injective has enabled a friendly front-end interface through which they can do so. 

The INJ Token

INJ is the native token for the Injective network. It plays several roles, which include the following: 

  • Protocol governance: The INJ token will be used as a governance mechanism. Token holders will be able to vote on the future of the project, network parameters, and protocol upgrades through a DAO structure.
  • Deflationary mechanism: The INJ token will be periodically bought back and burned so that it doesn’t flood the market – as a deflationary measure
  • Collateral backing: INJ can be used as an alternative to stablecoins in the protocol’s derivatives trading, as well as a collateral backing when users lock up tokens so as to earn interest
  • Incentive mechanism: The INJ token is used to reward participants for taking part in the network’s consensus
  • Proof of Security (PoS): When nodes stake in INJ and get the right to take part in the network consensus, which secures the network, they will be rewarded with block rewards

INJ Token Distribution

The INJ token was distributed in the following fashion: 

  • Binance launchpad sale tokens: 9%
  • Seed sale tokens: 6%
  • Private sale tokens: 16.67%
  • Team tokens: 20%
  • Advisors’ tokens: 2%
  • Ecosystem development tokens: 36.33%
  • Community growth tokens: 10%

INJ: Tokenomics

As of Oct 31st, 2020, the INJ token traded at $0.776922, with a market cap of $10,456,039, which places it at #470 per Coinmarketcap. The token’s 24-hour volume is $2,431,311, with a circulating and total supply of 13,458,281 and 100 million, respectively. INJ’s all-time high was $1.22 (Oct 23, 2020), while its all-time low is $0.662174 (Oct 29, 2020). 

Buy and Storing INJ

You can find the INJ token listed on several exchanges, including but not limited to Binance, HotBit, Poloniex, DCoin, Uniswap (V2), VCC Exchange, and Pancake Swap. The token is listed as a market pair with USDT, BTC, BNB, BUSD, and WBNB. 

Categories
Cryptocurrencies

MyStar wallet Review: How Safe Is This Multi-Blockchain Crypto Wallet?

MyStar Wallet is a mobile phone-based crypto vault designed and developed by Stargram Global, a Korean IT company specializing in Blockchain and entertainment products. On the MyStarWallet website, the crypto vault app is described as a “Multipurpose asset management (and) one-stop platform” for all your cryptocurrency needs. The site further refers to the wallet as a digital asset management tool focused on helping you store, send/receive, and secure your cryptocurrencies.

Though MyStarWallet is still relatively new to the crypto world, it stacks a host of operational and security features that set it apart from the competition. For instance, it is built on the Ethereum Network, which means that it provides users with access to the decentralized network and such amenities as the Dapp browser and the app builder tools.

In this MyStarWallet review, we will be vetting these features by looking at its commitment to safety, outlining the setup by step guide on using the wallet app, and telling you its pros and cons.

MyStar Wallet Key features:

Mobile app: MyStarWallet is a mobile-based app vault. It can be downloaded from either the Google Play Store or Apple App Store.

Multi-asset: My Start Wallet is also a multi-asset app vault. It hosts a significant number of cryptocurrencies and tokens, and that there is no limit to the number of private keys that you can store within the wallet.

Inbuilt exchange: MyStarwallet features an inbuilt crypto exchange where users can buy, sell, or exchange cryptocurrencies and tokens. The exchange is relatively secure, and transaction processing reliably fast.

Blockchain explorer: MyStarwallet also features the blockchain explorer that lets you keep tabs on the Ethereum network. It helps you monitor network events, news, important announcements like upcoming ICOs, and political and economic events or changes that may impact the crypto world.

Portfolio Tracker: Within the MyStarwallet app’s dashboard is the balance and transaction history tabs that help monitor your crypto activity. For instance, the history tab outlines your crypto inflows and outflows, and these go a long way in helping you create a crypto budget.

Address book: MyStarwallet also features an address book that integrates your phone’s contact list that simplifies how you send and receive Crypto. This effectively means that you can simply send Crypto to a contact address on your phone regardless of whether they have Mystarwallet installed or not.

Send Crypto via messenger: MyStar wallet also features a proprietary messaging platform, the Startalk Messenger platform that you can use to “Instantly send money while you talk.” This features messaging and video chatting and the remittance functionality that allows you to transfer cryptocurrencies and tokens via StarTalk.

Dapp browser: MyStarWallet integrates a Dapp browser, a decentralized browser that allows you to surf the web anonymously.

Create Tokens: In addition to the Dapp browser, MyStarWallet users now have access to the app builder tools that make it possible for them to create and successfully launch both decentralized token and ERC-20 tokens.

Mystarwallet security features

Password: Like most other mobile phone-based crypto wallet apps, MyStarWallet is password secured. The password deters unauthorized access to your private keys and serves as the crypto app encryption tool.

Recovery seed: When creating a user account on your MyStarWallet app, you will be presented with a 12-word backup seed. You will need this seed to recover lost private keys or restore the MyStarWallet on another device.

Two-factor authentication: Outbound transfers from the MyStarWallet app must be subjected to two-factor authentication. You have the option of adding your phone number when creating a user account for MyStarWallet that you can use to authorize outbound transfers or use the Authenticator apps.

How to set and activate the MyStar wallet

Step 1: Start by downloading the MystartWallet crypto app for your Android or iOS smartphone.

Step 2: Install and upon launching the app, click on the ‘Create a new wallet” icon

Step 3: Create a password for the wallet

Step 4: You will now receive the 12-word backup/recovery seed for the crypto wallet. Write it down on a piece of paper and keep it safe offline.

Step 5: Your wallet is now active and ready for use

How to add/receive Crypto into your MyStar wallet 

Step 1: Log in to your MyStarWallet app, and on the user dashboard, click on the ‘Receive’ tab.

Step 2: On the deposit window that pops up, copy your wallet address or the QR Code and forward it to the party sending you cryptos

Step 3: Wait for the deposit to reflect in your wallet.

How to send Crypto from your MyStar wallet

Step 1: Start by logging into the MyStarWallet app and clicking the “Send” icon on the user dashboard.

Step 2: If you have more than one types of cryptos stored in here, select the crypto coin you wish to send

Step 3: On the transfer window, key in the recipient’s wallet address and the number of coins/tokens you want to transfer

Step 4: Confirm the accuracy of the transaction details and authorize the transfer.

MyStar wallet ease of use

MyStarWallet is highly intuitive and very beginner-friendly. The processes of creating a user account are simple and quite straightforward. The user interface is very clean, with just a few carefully placed tabs that ensure you don’t need any expert help to teach you how to interact with the app. The processes of sending and receiving cryptos/tokens in and out of the wallet are also quite easy and straightforward.

MyStar wallet supported currencies and countries

MyStarWalet is eth-based and will only support Ethereum and such eth-network based tokens as the ERC-20 tokens.

MyStar wallet cost and fees

Downloading MyStar wallet, installing it on your phone, and storing cryptos and tokens therein is free. However, you will have to part with variable transaction processing fees (GAS) every time you wish to send cryptocurrencies and tokens from one wallet to another.

MyStar wallet customer support

You can always consult the MyStarWallet Blog or Wallet Guide sections of the wallet’s website to learn how to interact with the wallet app. This website also features an extensive range of video tutorials that outline everything related to MyStar, including the different troubleshooting techniques.

You may also want to reach out to the MyStarWallet customer support team by raising a support ticket, emailing them, or direct messaging them on social media platforms such as Facebook, Instagram, and Twitter.

What are the pros and cons of using MyStarWallet?

Pros:

  • It supports a wide range of eth-based cryptos and tokens
  • It is highly intuitive ad beginner-friendly
  • MyStarwallet is feature-rich and even integrates an inbuilt exchange
  • It makes it possible for users to send cryptos to a phone number or via Startalk messenger
  • It features a Dapp browser and Dapp builder that lets you create and launch ERC-20 tokens

Cons:

  • It only hosts basic security features
  • It will only support Eth-cryptos and tokens
  • It is not a regulated wallet

Comparing MyStar wallet with other multipurpose crypto wallets

MyStarWallet vs. eToro wallet 

Mystar and eToro are both multipurpose and multi-feature wallets that host a wide range of operational tools. And some of the common features hosted on both MyStar and eToro wallets include an inbuilt exchange and portfolio tracker. Both wallets are also beginner-friendly and feature highly intuitive user interfaces.

However, while eToro is a multi-blockchain wallet hosting cryptocurrencies built using different blockchains, MyStarWallet will only host eth-based altcoins. Further, eToro has a friendlier and highly responsive customer support team compared MyStarWallet. MyStarWallet nevertheless carries the day with the number of supported altcoins that include all ERC-20 tokens against eToro that will only support less than 20 popular cryptos. Moreover, they have made it possible for you to send Crypto to phone numbers and through messenger.

Verdict: Is MyStar wallet safe?

Well, the mobile crypto app has embraced several effective security and privacy measures around the vault aimed at keeping your private keys private and highly secure. These include securing the app with a password and enabling two-factor authentication, as well as providing you with a backup and recovery seed. However, we must mention that the online nature of the wallet plus the fact that it stores your keys in your phone, not cold storage, exposes it to such threats as hacking and malicious viruses.

Categories
Cryptocurrencies

How to Take Advantage of PayPal’s Crypto Adoption

Cryptocurrencies are officially becoming mainstream. PayPal recently announced that its users would soon be able to send and receive Bitcoin and other cryptocurrencies on the platform, and the news created some frenzy among crypto enthusiasts. Considering the high volume of transactions that PayPal facilitates, the introduction of crypto capabilities will certainly change things significantly. Bitcoin investors are already speculating how this move will affect BTC prices and what new opportunities could be in the offing. 

This article will explain how PayPal’s crypto adoption is likely to affect Bitcoin and other cryptos. We will also look at what early-bird opportunities this move presents.

What Is It All About?

On 21 Oct 2020, PayPal announced that plans are in place to allow its users to buy, hold and sell cryptocurrencies straight from their account. ‘…it will enable cryptocurrency as a funding source for digital commerce for its 26 million merchants,’ read the statement in part. 

For a long time, cryptocurrencies have struggled to enter mainstream payment platforms with little success. Part of the slow adoption is due to crypto’s high volatility. Also, regulators have been slow and hesitant in providing the necessary approvals for mainstreaming cryptos. 

The New York State Department of Financial Services (NYDFS) has granted PayPal a BitLicense, which will essentially allow the company to conduct any virtual currency activities. Although this license applies only in limited jurisdictions, it’s likely to pave the way for other regulators to give companies approvals for conducting cryptocurrency activities.

That aside, PayPal’s new service will serve US residents for a start and feature only Bitcoin. Although no dates have been given on when users outside the US can expect the services or when altcoins will be supported, this could be pretty soon given the whole idea’s ingenuity. Even so, smart investors do not wait for opportunities; opportunities find them ready!

How the New Service Will Affect Bitcoin and other Cryptos

Before preparing to take advantage of this latest integration, it is important to know how Bitcoin and other cryptos might be affected. 

First, Bitcoin has been performing well, especially in the second half of 2020. Generally, there has been positive news about Bitcoin and most altcoins. The news about PayPal’s crypto integration can only add to the basket of favors Bitcoin is already enjoying, and this is likely to spur the growth of cryptocurrencies. Some of these impacts are already being felt way before the service is active. Within a few days of the announcement, Bitcoin’s prices shot up by 8% to reach $12,800. PayPal’s share prices also rose by 5.55 immediately following the announcement. These outcomes are a clear reflection of investors’ desire to see virtual currencies in the mainstream economy. So, the question is, what opportunities are these investors and speculators seeing? Let’s take a look at some of them.

#1. Merchants

Unquestionably, merchants will be the biggest beneficiaries of this move. The service will allow merchants to receive payments in Bitcoin. Serious traders know that this is a gate of opportunities only limited by their imagination. By accepting payments in crypto, merchants will encourage buyers to try their services. 

A merchant accepting crypto can give them an edge over their competitors – perhaps from the touch of sophistication that crypto will introduce or because users will have an extra payment option. In either case, it would be folly for a merchant to not accept crypto with such convenience in their way. As a bonus, PayPal will do the conversions for merchants who still want their payments to be settled in fiat money. 

If you are a merchant, this is the best time to learn how the service is expected to work and how you can align your business to leverage the full potential of the new service. Waiting to see how the market responds is not a clever idea as it will always leave you admiring trailblazers. 

#2. PayPal Users

There are many PayPal users who, hitherto, have never bothered to care how Bitcoin can change their lives. Part of this indifference is a result of the (perceived) complexity of cryptocurrencies. Many people have yet to try out cryptocurrencies because they simply don’t understand what this concept is all about. This is about to change. 

PayPal’s crypto integration means that PayPal users, even those with only scant knowledge of crypto, will be able to buy, hold, sell or pay with cryptocurrencies on the first day, and without having to learn anything new. PayPal said that users would not need new wallets. So, in essence, it’s like PayPal users will have their wallets upgraded to hold crypto.

Even more interesting is that PayPal users will have a “mini forex market” due to the new capabilities that will allow them to buy and sell crypto within the platform. Considering how easy it will be to move crypto around, PayPal users should already be learning how to trade crypto, as crypto-trading will become easier and more accessible than ever before. 

#3. Bitcoin Users

Bitcoin users will enjoy advantages never seen before. The currency will now seem like a medium of value exchange more than ever before. Currently, only about 1% of the top 500 retailers accept crypto. People have been treating Bitcoin more like an asset than a currency. Ironically, the coin was developed to facilitate payments. Low online acceptance and perceived complexity of use have ensured this irony remains the reality. However, this integration will force merchants to embrace crypto or face the inevitable – extinction. In the end, Bitcoin users will discover new and exciting possibilities for using their coins. 

#4. Expanded Crypto Acceptance

Expanded crypto acceptance is a win for the entire crypto community and beyond. Cryptocurrencies will become a reality for laypersons as they are bound to experience crypto like never before. International trade, remittances – you name it, it’s all bound to change. 

Peer-to-peer trade is one of the areas of commerce that’s likely to experience tremendous transformation due to PayPal’s latest offering. Global peer-to-peer markets are bound to grow partly due to the extra payment alternative and the hype that PayPal’s integration will generate. 

If you consider yourself a layperson when it comes to cryptocurrencies, it’s about time you paid some attention to them. PayPal’s crypto integration is not the first, but it will inevitably change how we make and receive payments, given the platform’s global acceptance and penetration.

Final Thoughts

PayPal’s integration with cryptocurrencies is a long-overdue solution to an age-old problem. This feature will introduce new possibilities for end-users and merchants alike. Laypersons will also have a chance to take part in crypto without the hassle of learning its intricacies. As early-bird investors always enjoy the pioneer advantage, this is the best time to explore the possibilities that will arise from PayPal’s integration with cryptocurrencies.

Categories
Forex Videos

How To Make Easy Profits Trading Forex Using Bollinger Bands & Trend Lines!

Forex Tips For Beginners – Stacking The Odds In Your Favour!

Thank you for joining this Forex academy educational video.

In this session, we will be looking at how to tilt the odds in your favour by showing you some cool tips to keep you out of trouble and tilt the odds in your favour of making successful trades.

The forex market runs 24-hours a day, 5 days a week, but typically, the busiest times, where you might expect a spike in volatility and larger price movements, is during the first hour of the beginning of a particular regional session. So, for example, at around 7:30-8:30 AM GMT, the European and UK session starts, and the FX market will usually become more active as more cash volume flows into the market. The same applies to the US session and then the Asia session as led by Sydney and followed by Japan.
Often trends will finish in one region and turn in the direction as the new region opens. This is down to differences of opinion, economic data releases, sentiment, and profit-taking as one region retires for the night. Wait until such times as the new trading session is well underway and until you can identify a potential trend.

Become a master of Bollinger bands. This technical analysis tool was invented by John Bollinger in the 1980s.

It is a chart tool that calculates two standard deviations on either side of the exchange rate, but it’s used in many different asset classes such as stocks and shares because of its success and the fact that it is highly regarded by the trading community.

One of the key components that traders look for when trading Bollinger bands is that 95% of trading activity will remain within the bands. And shown here on this one hour chart of the USDJPY pair where we have highlighted a few examples of what has happened when the price has a move outside of the bands, traders push the pair back inside, and this often results in a price action reversal.

Another major tool traders use are trendlines. A trendline is typically manually drawn onto a chart to identify price action direction. Again, using the 1-hour chart of the USDJPY pair, we have drawn in some trendlines.
An area of support and resistance, which forms the basis of a trend, is officially recognised when price action has reverted to either the support or resistance trendline on a minimum of two occasions. Here on the left side of the chart, this is clearly the case.
Three distinct trends become apparent using this technical analysis feature.

In this diagram, we have overlaid the Bollinger bands with our trendlines. Again, this is the same USDJPY pair and 1-hour time frame.

Now we can wait until a trend has been confirmed, where price action has hit either the support or resistance line on two occasions, and then we can also wait for the price action to breach the Bollinger band to increase our odds of the price action being driven back into the bands.

At position A, we have a confirmed downtrend, but where price action does not breach the Bollinger, yet it still moves higher.
At position B, we have a change in trend direction as confirmed here on the chart, but where the resistance line breach and also the breach of the Bollinger band cannot be considered as a confirmation of a reversal until such time as price action has fallen underneath the resistance line, which it clearly does. This is the time to short the pair. And, at the bottom of this move, we have a breach of the Bollinger band and where price action finds support before moving higher, which is the time to cut the short position and buy the pair.

In conclusion, use the trendlines and Bollinger bands together in this fashion to increase your odds of a successful winning trade.

Categories
Crypto Videos

Bank Of England Deputy Governor Jon Cunliffe Says Banks Must Keep Up With Crypto! The Race For CBDC!

Banks Will Need to Adjust to Crypto – Bank of England Deputy Governor Speaks Up

Jon Cunliffe has, as one of the leaders of England’s central bank, talked about crypto and digital assets as well as how banks will have to adapt to the changes brought by the crypto sector. His public statement is a testament to how blockchain technology and cryptocurrencies are changing the world as we speak.

Blockchain and digital assets offer their users the ability to store their own assets. By providing this service, they are possibly threatening the solutions that banks offer. Making sure that banks remain relevant on the playfield is not on the to-do list of England’s, or any country’s, central bank. Bank of England deputy governor Jon Cunliffe said that their job does include protecting various bank’s business models, but that banks will have to adjust. “Our job is to make sure that if bank business models change, the central bank manages the financial and macro-economic consequences of that” – Cunliffe said.

Cunliffe also spoke about central bank digital currencies, or CBDCs, and the “race” to be the first country to digitize its currency. He said that CBDCs also pose a threat to the solutions that commercial banks provide, as they are essentially cutting them out as middlemen. Crypto, on the other hand, is much broader and presents users with the option of self-custody, which presents a challenge to banks. However, in the case of crypto, banks will still function as fiat currency on-ramps as no cryptocurrency is even close to becoming a unit of account.

China seemingly leads the race to roll out its own CBDC, as it is already testing its digital yuan in some parts of the country. CBDCs hold far-reaching implications. Cunliffe said that “They need to go up the political agenda very fast before the political side starts to discover that there are developments in the private sector that don’t fit with policy.” This was said with an implication that governments across the globe have to prioritize conversations around digital assets due to the changes they may bring.
In contrast to many nations sprinting toward the CBDC finish line, United States financial regulators came out with a statement that they do not need or want to be the first to come out with their own CBDC, but that they rather want to do it right.

Categories
Cryptocurrencies

Is This a Good Time to Invest in Ripple?

When selecting a good crypto investment (actually any investment), even seasoned investors can never be too sure. Ripple is one of the several offerings investors can choose from, and no doubt, it has its fair share of both risks and prospects, just like all other crypto investments. 

Ripple’s (XRP) 2020 performance has shown fluctuations similar to Bitcoin and Ethereum. While part of this performance trend may be attributed to Bitcoin’s overall influence on the crypto market, there are XRP-specific forces attributed to the trend. As an investor, it is worth looking at these forces and XRP’s overall outlook to establish whether this is a good time to buy Ripple. 

This article will look at how XRP has been performing over the last 12 months and the factors that might shape its outcomes in the next several months. 

A Brief Background on Ripple

Ripple was introduced in 2012 as a real-time gross settlement (RTGS) solution. It enables financial institutions to send money instantly in a secure manner across the globe and at cheaper rates than previously possible. Besides the payment infrastructure, Ripple has the XRP currency, which can be used for trading and investment. 

2020’s Performance

XRP started the year at $0.92, and within two months, it had gone to a low of $0.34. In the next month of March, the currency fell to its lowest, exchanging at $0.14. During this period, both Bitcoin and Ethereum were also struggling to fetch competitive rates against the dollar. As such, it is safe to assume that XRP’s performance up to this point was largely a reflection of the economic outlook of the cryptocurrency economy.

From mid-March, XRP grew slightly and seemed to avoid fluctuations until August, when it shot up to $0.31. Again, this spike closely resembles trends observed on Bitcoin and Ethereum, where the two showed some of the highest figures in 2020. From August onwards, XRP has maintained an average of $0.25. 

From XRP’s 2020 financial performance, we can conclude that external forces heavily influence the currency’s outlook in the cryptocurrency economy. Nonetheless, there are unique aspects that either make XRP a good choice for investment or make it a matter that should be put on the shelf in the meantime.

Partnerships and Approvals

Besides the fair financial performance, Ripple has had a lot else going on – 2020 is the year RippleNet made numerous partnerships with banks and other financial institutions. The aim was to help these organizations achieve cheaper, faster, and more secure money transfers worldwide. Notable industry players such as Bank of America, HSBC, and Western Union have tested the solution giving it their vote of confidence. 

Ripple is also increasingly being loved by regulators. The UK Financial Conduct Authority acknowledges XRP as a utility token – a privilege only previously granted to Bitcoin and Ethereum. In the US, Ripple is in good standing with the Securities and Exchange Commission. The currency is also available on all major exchanges, which further strengthens its brand. Positive news about Ripple has also contributed to an increase in the crypto’s appeal among the investor community. 

2021 Outlook

2020 has been quite eventful for Ripple. 2021 might see an increase in activity considering that many of the partnerships the company announced will be maturing in 2021. When these partnerships finally take shape, we’re likely to see FOMO buying due to increased positive news about the currency. In such a case, prices will certainly surge, and predictions of XRP/US exchanges at $1 are not far-fetched.

We have also seen how Ripple’s performance follows Bitcoin’s trend. At the moment, Bitcoin is on the upward projectile, and this growth is likely to continue for several months. There have been substantial fluctuations between resistance and support, but each cycle since July sets a new high. Based on this history, it might take some time before Bitcoin reaches its ultimate resistance and prices start to crash. Since XRP trails Bitcoin’s performance, its investors might have even more time to decide if they need to jump out. 

Advantages of Buying Ripple

#1: It Solves Real-World Problems – Financial institutions have long struggled with transferring money fast and cheaply across the world. Currently, most cross-border money transfers are powered by SWIFT. But this messaging technology is slow and expensive. Ripple’s alternative solves these two age-old problems and thus, makes for a good competitor. The best way to create value, they say, is by solving people’s problems. As Ripple continues to address these challenges, we can only expect its value to grow. 

#2: It Is Currently Affordable – Well, it’s not really affordable considering that it is not a commodity. However, the idea that you can get several hundred XPRs for just $100 is refreshing. As an investor, high volumes are usually satisfying. While XRP currently seems affordable, this might not be the case in the next year or so. Based on the analysis in this article, XRP prices are likely to shoot next year. Come 2022, and your $100 might only afford you 100 XRP.

#3: It’s Got a Huge Market Capitalization – So what does it matter? Market cap is a good indicator of the stability of a company. It does not guarantee anything, but a huge market cap suggests that the market is conservative. This is a good thing for investors with a low-risk appetite because they fancy markets that seem stable, albeit this comes with the promise to oneself that they will not expect anything more than modest returns. Ripple has the third-largest market cap (after Bitcoin and Ethereum). 

#4: Ripple Has Professional Support – While hardcore crypto-enthusiasts think this is undesirable interference, it actually has many benefits. For instance, Ripple’s engineers always ensure the platform is stable. But perhaps, the greatest benefit of this “interference” is that Ripple Labs Inc. can promote the product to financial organizations. These marketing efforts will certainly promote the adoption of Ripple among financial organizations. The result will be a steady growth of the platform, including the XRP currency.

Ripple’s Challenges

There are many sweet things we can say about Ripple. On the flip side, Ripple has some challenges that are worth highlighting. 

  • No new XRPs are being mined, and nearly half of the existing ones are in the hands of, well, the wallets of the company’s directors. If they decide to dump their share, XRP might be badly devalued. This is just a hypothetical situation, and willing investors must assume the company has a future such that the directors will see no need to dump their coins. 
  • Financial institutions are conservative. This means that, despite the promotion efforts the company is making, it may take a long time for the platform to be fully adopted. 

Final Thoughts

Ripple has had a fairly impressive outlook so far. It has shown slow but steady growth in 2020. Although its price remains low compared to previous performance, there are all indications that the currency will become stronger in the coming year. There are several projects in the pipeline, as well as promote efforts to boost the platform’s adoption. It might take long before these results are realized. But all factors considered, there is good reason to believe that this is a good time to invest in Ripple.

Categories
Cryptocurrencies

Dharma Smart Wallet Review: How Smart Is The Defi-Focused Dharma Wallet?

Dharma smart wallet website refers to this crypto vault as ‘Your portal to DeFi’ and the ‘easiest and most secure way to invest and manage your money in DeFi.’ This mobile-based crypto wallet was created by Dharma Labs, a San Francisco based crypto technology company, and launched in April 2017. At the time of going public, Dharma was not a fully-fledged crypto wallet but an income-generating platform created on the compound protocol that individuals used to borrow and lend crypto.

In the months that followed, the protocol was subjected to numerous upgrades that saw it grow into a mobile crypto wallet that integrates such additional features as a Dapp browser. Similarly, this period saw the wallet onboard more DeFi programs, increase the number of supported tokens, and integrate advanced security measures.

This Dharma smart wallet review will help you understand how this mobile crypto vault works by detailing its key operational and security features, the step-by-step guide on how to activate the wallet, and highlighting its pros and cons. We also compare it with other mobile crypto wallets before telling you if Dharma is the safest DeFi wallet.

Key features

Mobile wallet: Dharma smart wallet is mobile-based and available in Android and iOS versions. Both have a highly intuitive and beginner-friendly user interface.

Auto upgrades: Unlike most other crypto wallets that require you to download and install their software or firmware upgrades manually, Dharma smart wallet upgrades are automatic and instantaneous. This ensures that a bug or vulnerability is patched at the same time for all wallet users.

Integrates DeFi apps: Note that Dharma smart wallet started as a Compound (a DeFi app) protocol before its eventual upgrade into a smart wallet app. During the upgrade, Dharma labs increased the number of supported DeFi apps, which effectively increased the revenue-generating screams.

Earn interest: The integration of numerous DeFi apps within the wallet makes Dharma an income-generating wallet. You start earning fixed interest as soon as you deposit your fiat or cryptocurrencies into the Dharma wallet. And the longer you let your cash sit in there, the higher the earnings.

Inbuilt exchange: Dharma mobile wallet features an in-built crypto exchange – Uniswap – where users can exchange and trade 2000+tokens seamlessly.

Deposit FIAT: Dharma processes both crypto deposits and is one of the few wallets that accept debit card deposits. You can, however, only deposit a maximum of $1000 via a debit card. You nevertheless are free to set up an automated recurrent deposit scheme.

Integrated Dapp browser: In addition to the income-generating apps, Dharma wallet also integrates Dapp browsers. This comes in handy to wallet users as they can use it to search and explore the Ethereum blockchain.

Automated updates: Dharma allows you to automate wallet notifications. These include notifications for token price changes as well as blockchain news.

Security features

Password: When installing Dharma smart wallet app and creating a user account, you will be required to set a unique password. It deters unauthorized access to your mobile wallet vault and serves as its encryption tool.

Open source: Dharma smart wallet is built on an open-sourced technology. This makes Dharma highly transparent and auditable by both the wallet users and crypto security experts.

Non-custodial wallet: Dharma is a non-custodial wallet in that it doesn’t store your private keys in their servers. Instead, the encrypted private keys are stored within your device, giving you absolute control over your private keys.

Multisig: Dharma wallet has enabled multi-signature functionality that, in turn, gives it multi-user capabilities whereby a transaction has to be verified by several parties before it is executed.

How to set and activate the Dharma Smart wallet

Step 1: Start by downloading the Dharma Smart wallet from either Google play store or Apple App Store.

Step 2: Install the app and click on the ‘Create a new wallet’ tab.

Step 3: Create a unique password for the wallet

Step 4: The wallet will now present you with a 24-word backup and recovery seed. Write it down on a piece of paper and keep it safe offline.

Step 5: You will want to verify your identity if you hope to deposit fiat or buy crypto with a debit card

Step 6: Your Dharma smart wallet app is now active and ready for use

How to add/receive crypto into your Dharma Smart wallet 

Step 1: Log in to your Dharma smart wallet and click ‘Receive” in the user dashboard.

Step 2: On the deposit window, copy the wallet’s address or QR code and send it to the party sending you coins

Step 3: Wait for the coins to reflect in your wallet.

How to send crypto from your Dharma Smart wallet

Step 1: Log in to your Dharma smart wallet app and click ‘Send’ on the user dashboard.

Step 2: If you have multiple digital assets stored therein, select the coin or token you wish to send

Step 3: On the transfer window, enter the receiver’s wallet address or QR code and the number of coins/tokens you wish to send

Step 4: Confirm that the transaction details are okay and hit send.

How does Dharma Smart wallet work?

Dharma smart wallet is a DeFi focused crypto platform that allows you to earn interest on your crypto or FIAT deposits. You start by creating a user account on the Dharma smart wallet app and depositing either fiat or cryptocurrencies.

You can then choose to stake it all or a part of it in one of the income-generating DeFi protocols, such as Compound. In here, you will find numerous other DeFi apps that present you with numerous other ways of earning from your deposits, like lending your crypto to other Dharma wallet or compound protocol users.

Dharma smart wallet ease of use

Dharma Smart Wallet’s dashboard stands out because of its simplicity and ease of use. Creating a user account for Dharma smart wallet is easy and quite straightforward. The highly intuitive and relatively clean user interface makes in-app navigation easy for both experienced and beginner crypto traders.

The processes of depositing and sending cryptos or cash in and out of the wallet and moving crypto and accumulated interests in and out of the income-generating platforms are also easy and straightforward.

Dharma Smart wallet supported currencies and countries

According to Dharma labs, the Dharma Smart Wallet app can support Ethereum, Ethereum classic, and 2000+ eth-based tokens.

The mobile wallet app is also available to residents of 100+ crypto-friendly countries.

Dharma Smart wallet cost and fees

One of Dharma Smart Wallet’s most interesting features is the Zero-fee policy for in-app transactions. You will not be charged any fees to swap tokens, send or withdraw crypto in and out of the DeFi apps. You will only have to pay GAS fees when you send crypto tokens to another wallet or exchange.

Dharma Smart wallet customer support

You can contact Dharma Smart wallet’s customer support team via the Live Chat button on the website and mobile app. Alternatively, send them an email or engage them on such social media platforms as Twitter or Discord.

What are the pros and cons of using the Dharma Smart Wallet?

Pros:

  • It provides you with multiple income-generating opportunities
  • It supports both fiat and crypto deposits
  • Dharma smart wallet is quite beginner-friendly
  • Dharma is highly secure as it embraces some highly effective security features
  • It is open-sourced and beginner-friendly

Cons:

  • Dharma will only support Eth-based cryptos and tokens
  • It is not immune to the inherent limitation facing online-based crypto wallets

Verdict: Is Dharma Smart wallet safe?

The smart wallet app has embraced several security measures to make the mobile crypto app the safest DeFi focused platform. Key among them is the password that locks and encrypts wallet contents, a recovery seed for backup, smart contracts that secure all crypto transactions, and the multi-signature functionality. However, we must mention that the fact that Dharma Smart wallet is online-based exposes you to inherent threats facing the mobile crypto apps like hacking and malicious virus.

Categories
Crypto Daily Topic

Here is how to make a kill investing in Altcoins in 2021

As the bulls continue to run the Bitcoin market, investors have squarely focused their attention on this crypto. Meanwhile, many seem to not care about altcoins. 

Just like BTC, altcoins provide investors with a good opportunity to make money, both now and in the near future. Making money in the near future is the interest of this article. If you wonder why not just invest in BTC amid the current boom, your answer is right below. If you want to explore something different (from Bitcoin), your guide is down below as well. And for those who are curious to know how profitable altcoins can be, read on. 

This article will look at why investing in Bitcoin might be riskier than investing in altcoins, why you should consider altcoins, and what should be your next steps in that course. 

Why Not Bitcoin? It’s Currently the Talk of Investors 

Bitcoin is undoubtedly performing impressively. Since July, BTC investors have enjoyed a stable and significant growth of their assets. At the moment, it is the most enviable crypto. However, we cannot ignore the fact that the bulls will eventually run out of energy. Price falls after periods of booming growth are a natural part of market cycles. So, it is only logical to expect Bitcoin to start declining. 

What makes Bitcoin particularly risky at the moment is that there is a high chance that it will rapidly devalue when that descent begins. To be honest, $16K (which is still growing) is not a stable price for Bitcoin. While we might disagree on what is a good average for Bitcoin, historical figures show that BTC has an affinity for $10K. The point is when the hype dies down, speculations are confirmed as either true or false, and investor sentiment switches to pessimism, BTC will shed value until it finds some semblance of stability.

But altcoins go through the same cycle, so what’s the difference? Of course, all crypto inevitably cycle through the bear and bull markets. The difference is that Bitcoin is already in the bull market, and this favors those who jumped in about four months ago (that’s July). If you are not one of them, you may as well consider yourself late to the party and look in the direction of altcoins.

Can You Make Profits Investing in Altcoins?

The simple answer is, it’s complicated. Some altcoins are performing okay while others are struggling. But to be fair, altcoins are still profitable. 

Two things make crypto investments lucrative:

1. The margins you get through buying and selling coins, tokens, and other crypto-assets

— If you’re in the business of buying when prices are hiking and disposing of just before the descent begins, you can make profits trading any crypto. And if the price movements for an altcoin are significant enough and you get your timing right, you can make as much profit as you would with BTC. 

2. The gradual increase in the value of A crypto

— Some cryptos experience sustained growth against the dollar over the course of their lifetime. This growth is usually attributed to the usefulness of the project/idea on which the crypto is pegged. Gradual value growth makes sense, particularly to long-term investors. Just as Bitcoin solved the problem of having money controlled by central authorities, different altcoins solve different problems, which gives them the potential for gradual long-term growth. 

As you see, altcoins can be just as good as BTC. You only need to identify an investment ‘style’ that suits your needs and a good altcoin to match that.

Why You Should Consider Altcoins

#1: They are cheap

Actually, they’re not any cheaper than Bitcoin. Altcoins give you the chance to own more coins for the same amount of dollars. Whether this is any good is debatable, but the feeling you get by having a mind-boggling number of crypto coins to your name is satisfying. If you’re satisfied with your investment progress, you are likely to pursue the course further. That’s simply the logic. 

#2. The most profitable venture is not necessarily the most suitable for you

High margins can be irresistibly tempting. But on the flip side, the risks associated with high-margin investments are proportionately scary. 

We can safely assume that Bitcoin has had the highest growth in value within the last four months. However, we can also assume that the crypto will experience a slump when the bears come calling. Just because we don’t know when this will happen, we should not assume that it’s too far away. When choosing an investment, the amount of risk you’re willing to take matters a great deal. So, if you’re not into high-adrenaline crypto investments, you might want to consider altcoins for now.

#3. It would help if you diversified your investment

Investment wisdom dictates that one should never put all their investment capital into one asset. This is because no matter how lucrative an investment may appear, there is none without risk. 

There is no guarantee that Bitcoin will not face some unforeseeable calamity that would shatter its prices. Thus, in the interest of spreading your investment risk, it is worth considering altcoins. If you’re already a Bitcoin investor, that’s good. But what’s better is channeling some of your capital to altcoins to balance off the potential risks of a catastrophic BTC crash. 

Next Steps

If you are beginning to see altcoins as a good investment alternative in 2021, you are on the right path. Here are some steps to help steer you through that course.

#1. Research which altcoins are currently performing well 

All altcoins are not equal, and so are their investment prospects. Look at the price history of the coin, evaluate the concept’s soundness, and find out what experts are saying about the crypto. This information will help you eliminate investments that might not work for you and narrow down to a crypto that’s suitable for your needs. 

#2. Find out the altcoin’s growth potential 

You create value by solving people’s problems, and that’s the philosophy behind most successful cryptocurrencies. There are many altcoins for which crypto analysts are still struggling to find their usefulness. However, for the successful bunch, their ability to solve different financial problems has already been demonstrated. 

If you want to know that an altcoin will grow in the future, determine whether it has life-saving real-world use cases. Ethereum demonstrated the potential of smart contracts, and Ripple has shown how blockchain can disrupt real-time cross-border payments, and both have experienced sustained growth. As long as the crypto has a meaningful real-world utility, it is bound to grow, of course, unless something really wrong happens.

Final Thoughts

Altcoins are as good an investment as Bitcoin. Although BTC is currently booming, it is not the only worthy crypto investment. In fact, some investors may find altcoins a better alternative as some have yet to enter their bull markets. If you do your analysis properly and find a suitable altcoin, you can make reasonable profits when the market booms. Due to Bitcoin’s current hype and associated risk of entering the bear market, altcoins are a good option for spreading out the risk. Today is certainly a good day to think about altcoins. 

Categories
Crypto Videos

A Bitcoin Whale Shorted $100M BTC – Bitcoin Still Climbing!

A Bitcoin Whale Shorted $100M BTC: Why are Whales Selling at $16,000?

According to the pseudonyms trader CL, a Bitcoin whale has placed a short position worth $100 million on the Bybit exchange. This information came after various on-chain data pointed toward a whale-driven sell-off that occurred throughout the past week.
Even though the overall sentiment around Bitcoin remains strongly bullish, many reasons make $16,000 a very attractive area for sellers.

The $16,000 level provides significant liquidity, primarily due to it being a heavy resistance level. The level has seen quite a high buyer demand, as stablecoin inflows show. However, buyer demand is significantly lower at higher levels at the moment. Due to the clash of buyers and sellers at this level, this area of high liquidity makes it even more compelling for sellers.

Whales are taking profits

An unknown seller aggressively sold Bitcoin on Bybit on Nov 15. Order flows show that they sold approximately $100 million worth of Bitcoin in $3.5 million increments. These increments showed up in the order books on average consecutively over a couple of hours.

Based on the abrupt, though seemingly incremental, large-scale sell order, CL suggested that this could result in two possible scenarios.
The seller could get engulfed, thus causing a squeeze, which might cause the Bitcoin price to increase. The sell orders could continue to apply selling pressure on BTC even after the seller finishes selling his portion of Bitcoin.
“Someone aggressive sold almost $100 million on Bybit, a 3rd of the sell positions are open; personally, I’m pretty curious to see what happens if the seller does get engulfed, or if he will be let free,” – said CL.
Meanwhile, other major exchanges have spotted several large deposits during the time of the short-selling. United States-based crypto exchange Gemini saw a 9,000 Bitcoin deposit, according to the data coming from CryptoQuant.


Whales typically choose exchanges with strict compliance and strong regulatory measures, such as Coinbase and Gemini. Considering the large Bitcoin deposit to Gemini, which is worth around $143 million, a pseudonymous researcher better-known as “Blackbeard” said this is the time to be cautious.

Perhaps… Just Weekend Volatility?

As CL stated, Bitcoin’s current market structure is quite different from the previous cycle. As an example, when Bitcoin was at $16,000 in 2017, the market was more than just a bit overheated and experienced extreme volatility.

He said: “Back in 2017, when Bitcoin pumped from 10k, 15, into 20k, we had OKEx’s weekly futures trade in 1000$ contangos. Now we’re here with quarterly futures trading only 100$ above.”
This time around, the rally seems to be more sustainable and gradual. Bitcoin has continued to see, with a few minor setbacks, a staircase-like rally over the past six months. This kind of rally has allowed it to evolve into a prolonged uptrend. On top of that, rather than sudden spikes and no consolidation, Bitcoin has seen upside followed by consolidation, which is a much healthier way of gaining ground.

One thing to note is that, while it is true that institutions are getting into crypto at the moment, data such as Google Trends show that there is still little interest from retail investors, a complete opposite from late 2017.
There is a very strong argument to be made that the ongoing rally is fundamentally different from the one in 2017 despite the current market sentiment, which is reaching “extreme greed.” The available supply has decreased due to the 2020 halving, and the reserves on exchanges over the past year have reduced drastically.


The Bitcoin futures funding rates are also neutral, coming at around 0.01%, meaning that the market is not as overheated or overcrowded as it was in 2017. This trend could make the downside potential limited, especially in the medium term. Market maturity is certainly one thing that has changed since 2017, and whether Bitcoin goes up or down in the short-term, its upside potential, in the long run, is tremendous and very likely.

Categories
Crypto Videos

JP Morgan – Institutions Ditching Gold ETFs For Bitcoin!

Institutions Ditching Gold ETFs For Bitcoin – JP Morgan Opens Up

The demand for Grayscale’s Bitcoin Trust has increased so much lately that it has surpassed all gold ETFs combined, according to JPMorgan Chase, the largest bank in the US.
JPMorgan noted that Bitcoin is eating away at gold ETFs demand very quickly. The news came out in a report shared by Michael Sonnenshein, who is currently the managing director of Grayscale Investments.

More and more institutional investors, such as family offices, are now viewing the world’s largest cryptocurrency as an alternative to the yellow metal used to be a hedge and the go-to safe-haven.
The Grayscale’s Bitcoin Trust flow trajectory in October became significantly steeper, while all gold ETFs remained basically flat. “The contrast between gold ETFs and Grayscale Bitcoin Trust lends support to the idea that investors that invested in gold ETFs previously, such as family offices, maybe looking into Bitcoin and seeing it as an alternative to gold.”


Bloomberg’s report dating from September showed Grayscale’s Bitcoin Trust is outperforming 97% of all US ETFs. The bullish report regarding Bitcoin’s adoption caps off an amazing week for the crypto asset management firm. Sonnenshein stated that his company had recorded the largest raise across its suite of products, totaling $237 million.
While GBTC remains the most popular investment vehicle for Grayscale, the Ethereum Trust is also gaining a lot more traction lately, with a record-shattering $58 million.

Last month, Grayscale’s Ethereum Trust became an SEC-reporting company, which means that it now has to file quarterly as well as annual disclosures with the US securities regulator. The company had over $1 billion worth of inflows in its third quarter of 2020. Its inflows in 2020 are now nearing a whopping $3 billion. Overall, Grayscale has over $9.1 billion worth of assets under management.

All in all, the trend of crypto surpassing traditional asset classes in terms of performance is becoming a trend, which is certainly bringing more and more investments to the sector. With so many institutions joining the movement lately, cryptocurrency is poised to receive the attention of the broader masses in the short future.

Categories
Forex Assets

Trading The AUD/TRY Forex Exotic Currency Pair and Analysing The Costs Involved

Introduction

AUD/TRY is an exotic currency pair in the forex market. The AUD is the short form of the Australian Dollar and the TRY for Turkish Lira. Forex traders interested in such exotic pairs should be aware that trading them comes with high volatility compared to trading major forex pairs. In this exotic currency pair, the AUD is the base currency, while the TRY is the quote currency. Thus, the AUD/TRY price represents the amount of TRY that 1 AUD can buy. For instance, if the AUD/TRY pair’s price is 5.8362, it means that 1 AUD can buy 5.8362 TRY.

AUD/TRY Specification

Spread

In the forex market, your broker sells a currency pair to you at a higher price and buys it from you at a lower price. The value difference between these two prices is the spread. It is the primary way in which forex brokers earn their revenue.

The spread for the AUD/TRY pair is – ECN: 3 pips | STP: 8 pips

Fees

Forex traders with ECN account normally pay a trading fee to their broker whenever they open a position. This commission depends on the size of the trade, and not all forex brokers levy it. STP accounts do not have commissions.

Slippage

In forex trading, slippage refers to the price you expect your market order to be filled at and the price at which it is executed. The difference is a result of delays by your forex broker or high volatility.

Trading Range in the AUD/TRY Pair

The trading range refers to the analysis of the price fluctuation of a currency pair across various timeframes. The trading range shows the volatility in pips for a currency pair throughout the trading period ranging from minimum to maximum.

The Procedure to assess Pip Ranges

  1. Add the ATR indicator to your chart
  2. Set the period to 1
  3. Add a 200-period SMA to this indicator
  4. Shrink the chart so you can determine a larger period
  5. Select your desired timeframe
  6. Measure the floor level and set this value as the min
  7. Measure the level of the 200-period SMA and set this as the average
  8. Measure the peak levels and set this as Max.

AUD/TRY Cost as a Percentage of the Trading Range

After determining the trading range, we can then determine the trading costs associated with these trading ranges. The total trading cost is expressed as a percentage of the pip volatility. Here are the trading costs for the AUD/TRY pair on both ECN and STP accounts.

ECN Model Account costs

Spread = 3 | Slippage = 2 | Trading fee = 1

Total cost = 6

STP Model Account

Spread = 8 | Slippage = 2 | Trading fee = 0

Total cost = 10

The Ideal Timeframe to Trade  AUD/TRY Pair

From these analyses, we have established that longer timeframes have lower trading costs while the shorter timeframes attract higher trading costs. Note that the highest trading costs coincide with periods of lower volatility.

Therefore, the ideal timeframe to trade the AUD/TRY pair would be on longer timeframes when volatility is the highest. For shorter-term traders, opening positions when volatility is above the average can potentially lower the trading costs. Furthermore, traders across all timeframes can lower their trading costs by using the forex limit order types. With these types of orders, the cost of slippage is removed.

Below is an example using the ECN account.

ECN Account Using Limit Model Account

Total cost = Slippage + Spread + Trading fee

= 0 + 3 + 1 = 4

Using the forex limit order types has lowered the trading costs across all timeframes. You can notice that the highest cost has reduced from 101.69% to 67.8%.

Categories
Forex Fundamental Analysis

Everything About ‘Germany Ifo Business Climate Index’ Forex Fundamental Indicator

Introduction

Although government expenditures play an important role in the economy, investments by the private sector can be said to be the backbone of any economy. Therefore, when the private sector businesses have a rosy outlook on the economy, it can be expected that they will increase their investments. For governments, economists, financial analysts, and forex traders, tracking investors’ expectations can help understand and even predict the future economy.

Understanding Germany Ifo Business Climate Index

The Ifo business climate index is used to rate the current business climate in Germany and also rates the expectations of businesses for the next six months. Thus, we can say that the Ifo Business Climate is a leading indicator of economic development in Germany.

Source: Ifo Institute

Since Germany is the largest economy in the Euro area, this index plays a vital role in influencing the E.U’s overall economic activity.

Calculating the Germany Ifo Business Climate Index

The Ifo Institute for Economic Research conducts a monthly survey of about 9000 businesses operating in Germany. The businesses operate in the construction, wholesaling and retailing, manufacturing, and service sectors – i.e., the survey covers the entirety of the German economy.

In the survey, the respondents are required to give their assessments of the current business environment and what they expect over the coming six months. In their responses, they can say that the current business environment is “good,” “satisfactorily,” or “poor.” For their expectations, they can respond as either “more favorable,” “unchanged,” or “more unfavorable.”

The Ifo then weighs these responses. The weight attached is based on the importance of the industry’s contribution to the overall economy. Their importance is gauged by the percentage of employees they have and their contribution to the GDP.

The balance in the current business situation is determined by the difference between the percentage of “good” and “poor” responses. Similarly, the balance business expectations are the difference between the percentage of the “more favorable” and “more unfavorable” responses. The business climate is calculated by taking the average of the balances of the current business situation and the expectations.

The Ifo index is seasonally adjusted to ensure that some of the recurring patterns are eliminated from the time series. To seasonally adjust the data, the Ifo Institute employs the X-13ARIMA-SEATS procedure developed by the U.S. Census Bureau.

Using the Germany Ifo Business Climate Index in Analysis

There are several ways in which this index can be used to show how the German economy is progressing.

When the index increases over time, it shows that the businesses are more inclined to increase their capital expenditure and investments in various projects in the economy. In doing so, they effectively ensure that the economic output will increase, which leads to higher GDP. Similarly, an increase in investments into economic projects and capital expenditures leads to an increase in production activities, which leads to higher employment levels.

Therefore, we can say that when the Ifo business climate index increases, it is expected that the rate of unemployment will reduce. Conversely, the rate of unemployment should be expected to rise when the Ifo business climate index drops. This is because the drop in the index implies that businesses expect business conditions will be more favorable. They will be prompted to cut back on investments and scale down core operations to mitigate losses. The resultant effect is lower levels of GDP and a higher unemployment rate.

Over the long term, the Ifo business climate index may be used to show the trends in business cycles and even used to predict recessions and economic recoveries. One of the primary drivers of any business is profiteering, which comes from their products’ demand. When businesses anticipate the demand to fall, their expectations are “more unfavorable.”

We know that the aggregate demand depends on the households’ demand. Therefore, when the demand is expected to fall, households are expected to have lesser disposable income, which could result from low wages and prevalent job losses; these are characteristics of a contraction. Therefore, when the Ifo business climate is continuously dropping, we can expect that the economy might go through bouts of recession.

On the other hand, if the Ifo business climate is steadily rising, it shows that the economy will undergo a steady period of expansion. This expansion comes from the fact that businesses will expect the demand for their goods and services to increase. This instance implies that households have more disposable income, which means wages have increased or employment increased.

Furthermore, when the economy has been through depression or recession, an improvement in the Ifo business climate index shows that the future is “more favorable.” It means that businesses do not expect the ongoing stage of recessions or depression to persist into the future. These expectations imply that businesses expect to increase their investments, a clear sign of economic recoveries.


Source: Ifo Institute

Impact of Germany Ifo Business Climate Index on the Euro

Germany is the largest economy in the E.U.; therefore, its economic outlook is bound to significantly impact the Euro since the EUR fluctuates depending on the economic performance of its member countries.

When the Germany Ifo Business Climate Index rises, it means that the German economy is expected to grow. Furthermore, the benefits of the resultant expansion of business operations in Germany might spill over to other countries in the E.U. in terms of job creation. As a result, the EUR will appreciate relative to other currencies.

Conversely, the EUR is expected to depreciate relative to other currencies when the Germany Ifo Business Climate Index continually drops. This drop signifies a potential contraction of the German economy, which may affect other EU-member countries.

Sources of Data

The Ifo Institute for Economic Research is responsible for conducting the surveys, aggregating data, and publishing the Germany Ifo Business Climate Index. Trading Economics has a historical time-series data of the Germany Ifo Business Climate Index.

How Germany Ifo Business Climate Index Release Affects The Forex Price Charts

The Ifo Institute for Economic Research published the latest business climate index on September 24, 2020, at 8.00 AM GMT. The release can be accessed at Investing.com. From the screengrab below, we can see that the German Ifo business climate index is a high-impact indicator.

In September 2020, the German Ifo business climate index was 93.4, lower than the analysts’ expectation of 93.8.

Let’s see how this lower than expected release impacted the EUR/GBP price action.

EUR/GBP: Before Germany Ifo Business Climate Index Release on 
September 24, 2020, just before 8.00 AM GMT

Before the release of the index, the EURGBP pair was trading in a weak uptrend. The 20-period M.A. was almost flattening. They adopted a weak downtrend moment before the release.

EUR/GBP: After Germany Ifo Business Climate Index Release on 
September 24, 2020, at 8.00 AM GMT

After the release of the Germany Ifo Business Climate Index, the pair formed a 15-minute bullish candle but adopted a strong downtrend afterward. The 20-period M.A. steeply fell with candles forming further below it. This trend shows that the EUR weakened against the GBP since the Germany Ifo Business Climate Index was weaker than expected.

As shown by the above analyses, the Germany Ifo Business Climate Index has a significant impact on forex price actions.

Categories
Forex Course Forex Daily Topic

176. Introduction To The Commitment of Traders Report (CoT)

Introduction

In the previous lesson, we discussed market sentiment in Forex. Since you already know how the sentiment comes along, in this lesson, we will discuss how the forex market sentiment is measured.

What is the Commitment of Traders Report?

The commitment of traders (COT) report is how you measure forex market sentiment. One of the primary determinants of market sentiment in forex is the demand for a currency. The COT report tracks how commercial and non-commercial traders are positioned in the forex market.

As the name suggests, the COT report gives data about commitments made by big players in the forex market to conduct future trades. The report shows the totality of futures and options contacts in the forex market, which have not yet been settled. Thus, these future transactions can impact the price movement of the currency pairs in the spot market where most retail traders participate.

How does the Commitment of Traders Report work?

The COT report is published by the US Commodity Futures Trading Commission (CFTC). The publication is released every Friday at 3.30 PM ET. This report shows the total outstanding open positions in the forex futures market as of Tuesday of that week. The data in the COT report includes futures of the major currencies and most of the minor currencies.

According to the CFTC, the COT report is a breakdown of the futures and options market positioning of at least 20 traders. These are traders whose futures and options positions in the forex market are above or equal to the reporting levels set by the CFTC. In our subsequent lessons, we will further explain the type of traders included in the COT reports and the reporting levels.

It is worth noting that the majority of the transactions in the interbank forex market are private and are not made public. For this reason, the retail traders do not have a lot of knowledge about the significant transactions that occur daily in the forex market. Therefore, the COT reports play a significant role in publicizing the futures positioning in the forex market.

Conclusion

The forex market portion of the COT report shows the totality of the long and short futures position adopted by traders. These are speculative traders; whose primary objective is to anticipate future price changes and place their bets regarding a currency. Therefore, monitoring how these market players have positioned their future trades might increase your analysis of future trends in the forex market.

[wp_quiz id=”89646″]
Categories
Crypto Daily Topic Cryptocurrencies

Peach wallet Review: Is Peach The Safest Wallet For The Lightning Network?

Lightning Peach Wallet is an enterprise-focused crypto vault that’s specially designed to help you process micro-payments done on the lightning network. It is developed and maintained by the BitFury Lightning Network team and aims to help your business become crypto-ready. To this end, the wallet has incorporated several key features, including a fee-free payment processing service for all transactions carried on the lightning network and the integration of eCommerce plugins. The Lightning Peach wallet website also claims that the branded wallet is highly customizable, allowing you to scale up and feature more products and services for your business.

According to BitFury, Lightning Peach wallet was created to help any business increase user engagement and satisfaction, reach out to new audiences, and incentivize in-store spending. And achieve all this in a safe and cost-effective manner.

But does it live to these expectations? Is it safe for your business and your private keys? We answer these questions and more in this Lightning Peach Wallet review by looking at its key operational and security features, outlining the step-by-step guide on using the wallet, its pros, cons, and everything in between.

Key features

Cross-platform: Lightning Peach Wallet is a cross-platform wallet available in both desktop and mobile app versions. It is also available in both the standard and extended modes, whose only difference is the number of supported features.

Address book: Lightning peach wallet features an address book that integrates your phone’s contact list or allows you to save the wallet addresses for parties you interact with regularly. It simplifies back and forth crypto engagements by speeding up the time it takes to initiate a transaction while minimizing errors.

Pay with card: The wallet also integrates several payment processing options, including debit and credit card. Therefore, you can buy crypto from the lighting wallet or withdraw funds to a card or bank.

Integrates third party exchanges: Peach wallet also integrates such third party exchanges as Coinbase, Binance, and Bittrex, where users can buy, sell, and exchange cryptocurrencies and tokens.

Fee-free processing: Lightning peach wallet will not charge you a transaction-processing fee for all payments transacted on the Lightning network.

Full-node client: Peach Wallet is a full node client that requires you to download the Lightning Network. The node is inbuilt when you download the desktop client, but you will need to personalize one if you decide to use the mobile app. A recent upgrade to the Peach wallet has, however, made it possible for users to link their desktop wallet with the mobile app using a QR code.

Security features

Password: Lighting Peach wallet, like most other crypto vaults, is password secured to prevent and minimize cases of unauthorized access to your digital assets.

Recovery seed: Lightning Peach wallet will also provide you with a backup phrase that comes in handy when you need to recover lost private keys.

Open sourced: BitFury has also open-sourced the Lightning Peach Wallet design and availed it for viewing and auditing by both users and the entire crypto community. You can download this source code from the BitFury Peach website or GitHub.

Non-custodial: Peach Wallet is non-custodial and will, therefore, not store your private keys in the BitFury servers. Rather, it encrypts them and stores them within your mobile phone or computer.

Enterprise-grade encryption: BitFury has embraced end-to-end enterprise-grade encryption for all Peach Wallet communications. The wallet developer argues that not even their company servers can view the wallet’s communication with other wallets or third party software/systems.

Opt-in Improvements: One of Lightning Peach Wallet’s most controversial features is the opt-in service for data collection. The wallet developer claim that they will, by default, not collect any information from your wallet but adds that users can opt-in and allow BitFury to collect non-sensitive information anonymously to help improve wallet functions and user engagement. The crypto-security community has, however, expressed concerns with the fact that BitFury doesn’t explicitly state the type of data it collects for opt-in users or how the data is held and used.

How to set and activate the Peach wallet

Step 1: Start by downloading Lightning Peach Wallet on the BitFuryPeach.com website or GitHub

Step 2: Install the wallet and upon launching, click on the ‘Create a new wallet’ tab

Step 3: Read and agree to the wallet terms & conditions and privacy policy statements

Step 4: On the next window, click on the ‘Sign up’ tab

Step 5: Choose a unique username and create a password for the wallet

Step 6:  The wallet will now present you with a set of words that form the backup and recovery seed. Write them down, or choose to download them and save the copy offline.

Step 7: Verify that you have copied them right and click next

Step 8: Log in to your new wallet using the chosen username and password

Step 9: The wallet is now active and ready to use

How to add/ receive crypto into your Peach wallet

Step 1: Log in to the Peach wallet and click on the “receive” icon

Step 2: Copy the Wallet address or QR code displayed and forward to the person sending you Bitcoins

Step 3: Wait for the funds to reflect in your account

How to send Crypto from your Peach wallet

Step 1: Log in to the Peach wallet (extended) and click on the Lightning tab

Step 2: Choose the create payment option and specify if it is a one-time or recurrent payment

Step 3: Enter the transaction specifics like the name (optional), Recipient of the payment (enter their Lightning I.D, choose from the address book or their wallet address)

Step 4: Enter the amount of coins you want to send

Step 5: Confirm that the transaction details are correct and authorize the transfer

Peach wallet ease of use

Creating a Lightning Peach Wallet user account follows a fast and straightforward setup process. The wallet features a relatively clean user dashboard. The fact that it is also available in extended and standard modes for both mobile and desktop versions ensures that the lighting wallet caters for both experienced and beginner crypto traders/investors.  

Both the wallet and the BitFury website are also multi-lingual and available in several languages.

Peach wallet supported currencies

The lightning Peach wallet will only support Bitcoins. But you are free to send and receive such Bitcoin denominations as Bitcoin Satoshi.

Peach wallet cost and fees

Lightning network transactions are free. Regular Bitcoin network fees charged by miners will, however, apply when you send cryptos to other wallets or a crypto exchange.

Peach wallet customer support

There are three primary ways of contacting the Lightning Peach wallet support team. You can start by raising a support ticket on the BitFuryPeach.com website or engage them via the live chat features on both the website and wallet.

Alternatively, you can direct message this team directly on their official pages on such social media platforms as Instagram, Facebook, Twitter, or Telegram.

What are the pros and cons of using the Peach Wallet?

Pros:

  • Caters for both beginner and experienced Lightning Peach wallet users with their standard and Extended wallets
  • The wallet is feature-rich and hosts a wide range of operational features
  • The wallet is designed and maintained by BitFury, effectively minimizing your operational costs
  • The lightning Peach wallet features highly advanced security features
  • Sending Bitcoins within the Lightning network is free

Cons:

  • It will only support Bitcoin cryptocurrencies
  • Installing and running a full node business wallet eats up a lot of storage space

Verdict: Is Peach wallet safe?

Well, Lightning Peach Wallet has embraced several highly effective and advanced security measures. The developers are especially committed to transparency, as evidenced by the fact that they built the wallet on an open-sourced architecture. Other advanced security features integrated within the platform include enterprise-grade encryption, it is non-custodial, and the wallet’s anonymous data collection is optional. However, it would be great if BitFury were more forthcoming on how they collect and use this data. 

Categories
Forex Videos

Forex – How To Trade The USDJPY Pair!

How to trade the USDJPY pair


Thank you for joining this forex academy educational video.

How to trade the US dollar Japanese yen pair?
The US dollar Japanese yen is one of the so-called major pairs, and accounted for 13.2% of all the daily forex transactions settled during 2019. And the yen is the most frequently traded currency in Asia.
The United States is seen as the largest economy on the planet, albeit battered and bruised by the Covid pandemic, and Japan also has a strong economy, largely export-driven, and many things in common with the United States, including large stock markets. The relationship between the two countries is ever improving and has evolved significantly since the post-world war II era.

The pair can be extremely volatile at times and prone to large swings, but the basic rule of thumb is that when the United States was pre covid and its economy was strong, traders preferred dollars over yen. And since the United States has been in the grip of the pandemic, and even though the economy still massively outweighs that of Japan, traders prefer to buy the Japanese yen in times of uncertainty. It is seen as a safe-haven currency.

Let’s take a look at some price action on this monthly chart, where we see an A, B, C, D price swing since August 2006 of almost 13,000 pips. This is not a pair to be traded without caution and tight stop losses by retail traders.

This weekly chart highlights two periods A and B between 2018 and 2020, where the difference between the top and bottom of both ranges is approximately 1000 pips. Again, these are account busting moves if you are on the wrong side of the trade and without a cautious stop loss in place.

And yet, the overall trend as seen clearly here, again, on the weekly chart, which shows a snapshot of the pair since April 2017, is a downtrend. The yen is stronger overall.

Here we are still looking at the weekly chart. However, we have highlighted a couple of stages in the price action for this pair. Firstly, we must note the high at position A, with an exchange rate of 112.17, and the low at 101.17, which came just a couple of weeks later, where the yen was being bought as a safe-haven asset against the US dollar as the pandemic began to take hold. This was a significant swing in the exchange rate.
Now take a look at the bear channel shown at position C. Institutions look at the higher time frames and, as they hold all the aces in terms of their ability to move the markets with the size of their forex transaction, this is where retail traders need to focus their attention with regard to likely price action moves for the longer term.


Of course, retail traders should never trade on weekly or monthly timeframes because they would need to incorporate huge stop losses. We have already demonstrated with this pair moves of over 1000 pics is simply nothing here.

But they can and should use the information to try and establish the overall trend that institutional traders are looking at.
And here, we have brought the timeframe down to an hourly one, and we can see that since the 10th of November 2020, we have two peaks forming a line of resistance. Two areas forming a line of support and the grey circle, which clearly shows a breach of that support line, and with all of the uncertainty going on with regard to a new United States president, the worsening situation with regard to the pandemic in America with 150,000 new cases reported just a few days ago; we can only surmise that with all of this information that traders may continue to push the pair and to the previous low of 101.00 which we saw earlier on the monthly chart while favoring the safe-haven stats of the yen over the US dollar.

In conclusion, traders should be looking for potential signs of a weakening or pullbacks to get on board to short this pair. As we have clearly seen, the pair is subject to huge price swings, and tight stops should be incorporated.

Categories
Forex Daily Topic Forex Videos

Secret Techniques For Profitable Forex Trading Part 1!

Secret Techniques for Profitable Forex Trading I


Profitable Forex trading is an elusive goal for many traders. According to most statistics, over 75 percent of traders lose money. This comes for several reasons. There are well-known causes of this unfortunate outcome. Most traders get blown out because they bet too much and lose all when the market turns against them. Another source of failure is their psychological bias to let losses grow and cut their profits short. But today, we will focus on one key factor: How to assess entries and exits properly.

The States of a Market

Many people classify market action into over six states: Bul, Bear, Sideways with high or low volatility. Although this is usually correct, it does not offer enough simplicity to make decisions. The best way to look at market action is similar to what the Elliott Wave Theory states: Elliott stated that the market had impulsive phases and corrections of this primary impulse. We don’t need to be a genius to see that it is logical. Waves need to swing for it to form. But impulses and corrections have different properties. What works on one, it does not work on the other. Thus, the secret to master the trade is to
Assess which state the market is on
Apply the proper tools for entries and exits.

Impulse Properties

Impulses are characterized by directional movement. Bull or bear, we can see a steady price movement toward a new equilibrium, as impulses are created by an imbalance between supply and demand. The volatility on impulses is directional, and the tools to apply are moving averages and superior form of them such as instant trend, MAMA, MESA, and similars.

Chart 1 – Bitcoin 4H chart impulsive Phase

In chart 1, we show Bitcoin moving in its latest impulsive phase, although we can also see a glimpse of corrective structures. The main idea here is to follow the trend. The chart shows a ribbon formed by Ehlers Instant trend, an advanced indicator freely available on Tradingview but also MT4 and MT5 platforms.
We see that the indicator is right at delivering timely entries and exits. The chart also shows its 50 and 200 simple moving averages, heading up and supporting the trend. We can see that the touching of the 50-SMA line could be used as well to enter or add to the position, although the instant trendline seems to lead the 50-SMA. Tradingview’s Instant Trendline Indicator colorizes the candles’ body so the upward phases can be spotted with ease.

Corrective Properties

Corrective phases come at the end of an impulse. We have to realize that impulses come from a lack of equilibrium between buyers and sellers due to actions to find a new fair value. The fair price is unknown; thus, usually, the impulse creates overbought or oversold conditions. When some savvy traders spot this, they start to unload their positions in a profit-taking activity. That lowers the price to a level where it finds new buyers. The price moves up now, but the memory of traders who lost near the top makes more selling pressure ahead of this level, lowering the price and creating a cyclic path. Thus, the main characteristic of corrective phases is its cyclic characteristic, whereas the main feature of impulses is their lack or decline of cycles.

Since the cycle is the main component of corrections, The best way to time them is by using an oscillator, such as the Stochastic, RSI, or an advanced wave oscillator. If you’re price-action oriented, you may use support-resistance levels and breakouts to spot the right entries and exits.


Chart 2 – Bitcoin 1H chart Corrective Phase with Ehlers Stochastic CCI, Stochastic, and AutoCorr Angles.

As an example, we show on chart 2 the corrective phase of Bitcoin that started after a move up to $15,000 from the last consolidation of $13,500.
The image shows the stochastic oscillator( third curve) and two advanced oscillators buy the innovator of this century, John Ehlers, The Stochastic CCI, and Autocorrelation Angle. These two can also be found on Tradingview.com and MT4 and MT5 platforms.
We see that the Ehler’s Stochastic CCI (second curve, following the price) can precisely time the cycles on the chart with razor-sharp precision. However, the Stochastic oscillator is not far behind and can be used to profit from these cycles or confirm a reversal candle.

The bottom image shows the Autocorrelation angles indicator.
Autocorrelation is an advanced way to spot the short-term memory of the markets. A sharp move on the angle will show a transition from bear to bullish and bullish to bearish phases. This indicator is harder to handle, though.

There are many others, such as the Even better Sinewave indicator, shown in the third chart. The Even Better Sinewave is designed to find the dominant cycle of the price action. Sometimes, the market loses its pace, as happens in the whipsaw (amber) shown. But most of the time, this advanced indicator can time the cycle changes accurately.


Chart 3 – Bitcoin 1H chart Corrective Phase with Even Better Sinewave Indicator

To conclude
Markets have two phases: Impulsive and corrective.
Each needs the right tools to find suitable entries and exits.
Traders need to spot first the state of the market.
If Impulsive, apply Averages or advanced versions of moving averages and follow the trend.
If corrective, use oscillators to spot turning points.
Don’t be conformist. Look for advanced tools and learn to use them. They will give you a better edge.

Categories
Forex Fundamental Analysis

The Impact Of The ‘US Redbook’ News Release On The Forex Market

Introduction

The growth in any economy is primarily driven by the growth of retail sales to households. For this reason, monitoring retail sales data can be the most suitable way of gauging if the economy is expanding or not. In most national retail sales data, the data is collected through surveys. However, having an index solely based on the growth of same-store sales can help provide a more accurate sense of growth in the retail industry.

Understanding US Redbook

Redbook Research Inc. is an American company primarily dealing with market research on the momentum of retail sales, macro and quantitative analysis, and consumer demand factors in public and private retail sectors. The company publishes the Johnson Redbook Retail Sales Index, also known as the US Redbook, which is considered one of the most respected proprietary indicators on retail sales in the US.

The Redbook index measures the growth in the US retail sector. The index uses a sales-weighted of the year-over-year growth in sales of the same store. About 9000 large general merchandise stores primarily operating in the US retail sector are sampled. When these sampled stores’ monetary value is measured, their combined output accounts for about 80% of the national retail sales. Note that in the US, the official government retail sales data is compiled and released by the Department of Commerce.

The Redbook index is published weekly. In this publication, the report extensively analyses and explains the current trends in retail sales and the economy. Since households’ demand is highly elastic, the weekly US Redbook publication can capture the most recent trends in consumer demand. Thus, the Johnson Redbook Retail Sales Index provides advance data on the trends in retail sales in the US.

In this report, the comprehensive analysis covers the sales in the current month, the quarterly sales, year-on-year and annual sales, company rankings, and data on historical sales. The 9000 retailers are categorized into; Apparel Specialty, Sporting Goods, Home Improvement, Home Furnishings, Books, Toy & Hobby, Department, Discount, Footwear, Furniture, Drug, Electronic, Jewellery, and Miscellaneous.

Using US Redbook in Analysis

We have already established that the US Redbook’s retail index provides a comprehensive and advance trend in household consumption patterns.

When the weekly US Redbook retail index increases, it means that households’ consumption is on the rise. At its core, higher levels of consumption are driven by increased disposable income in the economy. An increase in household consumption means that there is a general increase in demand in the economy. When households’ demand increases, it could mean that the economy’s unemployment levels have reduced. Since more people are gainfully employed, there is increased disposable income for households, hence the increase in consumption represented by the rise in the Redbook index. Similarly, it could also mean that wages received by households are increasing, which increases disposable income.

Conversely, when the weekly Redbook retail index drops, it means that households have reduced disposable income. The reduction in disposable income could directly result from increasing levels of unemployment or a reduction in wages received by households. With less disposable income, people will be forced to cut back on their consumption. In both these cases, the US Redbook retail index increase implies that the economy is expanding; conversely, a drop in the index shows that the economy is contracting.

Source: Trading Economics

The US Redbook retail index can also be used as a precursor to economic recessions and recoveries. We already know that the majority of growth in the economy is driven by consumer demand. It is estimated that household consumption accounts for up to 70% of economic growth. Now, picture this. When the consumer demand is consistently dropping, suffice to say the GDP should also be expected to drop significantly. This period will be marked by a reduction in production and increased unemployment levels. Note that recession is described as a consistent drop in GDP for two successive quarters.

Source: St. Louis FRED

At the onset of the 2020 coronavirus pandemic, the weekly US Redbook retail index continuously dropped. From the period between March to May, the index dropped steadily. This period coincided with a drop in the US GDP. Due to the nationwide imposed lockdowns and social distancing rules, unemployment surged to historic highs of 14.7%. Naturally, demand in the economy was depressed.

In times of recessions, the US Redbook retail index can be handy in changes in household consumption. Policymakers can implement several expansionary policies meant to stimulate the economy. Since the official government retail sales data is published monthly, the US Redbook can be used to show any immediate response by households. The US Redbook index can therefore be used to show if the expansionary policies are working as they are expected to. One such instance can be seen after the US government implemented the 2020 stimulus package worth $2 trillion. The US Redbook retail index can be seen to be rising from the lowest points of May 2020.

Impact of US Redbook on USD

When the US Redbook retail index increases, we can expect the USD to appreciate relative to other currencies in the Forex market. A consistently rising index implies that the economy is steadily expanding, the unemployment rate is falling, and there is a general increase in money in the economy. In such a situation, governments and central banks might step in with contractionary fiscal and monetary policies. These policies are meant to prevent the economy from overheating and avoid unsustainable inflation levels due to the increase in the money supply. Such policies make domestic currency appreciate.

Conversely, a dropping US Redbook retail index shows that the general economy might be contracting. Consequently, expansionary fiscal and monetary policies like lowering interest rates might be implemented to stimulate the economy. Such policies make the domestic depreciate relative to others.

Sources of Data

Redbook Research Inc. published the weekly, monthly, and annual US Redbook Retail Sales Index. In-depth and historical data on the US Redbook Index is available at Trading Economics.

How US Redbook Index Release Affects The Forex Price Charts

Redbook Research Inc. published Retail Sales Index the latest data on October 20, 2020, at 8.55 AM EST. The news release can be accessed at Investing.com. This release is expected to have a low impact on the USD.

The MoM index increased by 1.0% in the latest publication compared to 0.4% in the previous reading. Similarly, the YoY index showed an increase of 2.5% compared to the previous 1.2%.

Let’s find out if this release has an impact on the USD.

EUR/USD: Before US Redbook Release on October 20, 2020, just before 8.55 AM EST

Before the release of the US Redbook data, the EUR/USD pair was trading in an almost neutral trend. The 20-period MA is seen to be flattening with candles forming just around it.

EUR/USD: After US Redbook Release on October 20, 2020, at 8.55 AM EST

The EUR/USD pair formed a 5-minute bearish candle immediately after the publication of the US Redbook report. Subsequently, the pair continued trading in the earlier observed subdued uptrend.

Bottom Line

This article has established that the US Redbook report is a crucial leading indicator of retail sales and consumer demand. However, in the forex market, its significance is diminished since most traders pay close attention to the US Department of Commerce’s monthly retail sales data.

Categories
Forex Assets

Exploring The Costs Involved While Trading The AUD/HUF Forex Exotic Pair

Introduction

The AUD/HUF pair is an exotic forex pair with the AUD representing the Australian Dollar and the HUF representing the Hungarian Forint. When trading in such an exotic currency pair, forex traders should anticipate higher volatility. The base currency in this pair is the AUD, while the HUF is the quote currency. Hence, the exchange rate of the AUD/HUF represents the amount of HUF that a single AUD can purchase. If the exchange rate of AUD/HUF is 221.51, it means that you can buy 221.51 HUF using 1 AUD.

AUD/HUF Specification

Spread

One of the ways forex brokers earn their revenue is through the spread. This is the difference in value between the price they sell a currency pair to you and the price at which they buy the same pair from you.

The spread for the AUD/HUF pair is – ECN: 22 pips | STP: 27 pips

Fees

For traders with the ECN account, they get charged a fee for opening positions. Note that not all brokers charge this commission. Forex brokers do not charge a fee on STP accounts.

Slippage

Every forex broker has different execution speeds. In times of high volatility, your order may be executed at a price other than the one you requested. This difference is slippage.

Trading Range in the AUD/HUF Pair

The trading range in forex trading is used to analyse the fluctuation in the price of a currency pair across multiple timeframes. The volatility, as measured with the trading range, is pips from the minimum, average, to the maximum for all timeframes. With this information, you can deduce the most profitable timeframes to trade.

The Procedure to assess Pip Ranges

  1. Add the ATR indicator to your chart
  2. Set the period to 1
  3. Add a 200-period SMA to this indicator
  4. Shrink the chart so you can determine a larger period
  5. Select your desired timeframe
  6. Measure the floor level and set this value as the min
  7. Measure the level of the 200-period SMA and set this as the average
  8. Measure the peak levels and set this as Max.

AUD/HUF Cost as a Percentage of the Trading Range

Now that we’ve established the volatility,  we can proceed to calculate the trading costs incurred when trading these timeframes. The trading cost is expressed as a percentage of total costs to the volatility.

Below are the trading costs of the AUD/HUF pair for both ECN and STP accounts.

ECN Model Account costs

Spread = 22 | Slippage = 2 | Trading fee = 1

Total cost = 25

STP Model Account

Spread = 27 | Slippage = 2 | Trading fee = 0

Total cost = 29

The Ideal Timeframe to Trade  AUD/HUF Pair

From the above analyses, we can see that the trading cost of the AUD/HUF pair decreases with an increase in volatility. Since the volatility also increases with the timeframe, trading the AUD/HUF over longer timeframes incurs lower costs.

Although the lower timeframes have higher trading costs, these costs can be reduced by timing trades when volatility approaches the maximum. Furthermore, slippage costs can be avoided if traders use forex limit order types. With the forex limit orders, trades are executed at precise price points, avoiding the impact of slippage. Let’s look at an example of this using the ECN account.

ECN Account Using Limit Model Account

Total cost = Slippage + Spread + Trading fee

= 0 + 22 + 1 = 23

Notice that the trading costs have been reduced in all timeframes. For example, the highest cost has been lowered from 423.73% to 389.83%.

Categories
Cryptocurrencies

Gnosis Safe Smart Wallet Review: Is Gnosis The Most Secure Smart Contract Wallet?

Gnosis safe is a cryptocurrency wallet specially designed for the Ethereum network to host eth-based cryptos and tokens. The wallet was developed by GNOSIS – an internet technology company in Gibraltar – and is among the first smart contract-based mobile apps. It is available as both a desktop/mobile app as well as a browser extension. This, according to its developers, doesn’t just ensure that the wallet is safer but also gives it the capability to handle a wider range of functions not offered by the traditional blockchain wallets.

The Gnosis safe website refers to the wallet app as “The most trusted platform to manage digital assets on Ethereum for companies/investors/developers/hodlers and DAOs.” It also refers to it as a “Safe Multisig mobile” wallet that helps users monitor their crypto portfolio on the go. It is further described as a transparency and security-focused eth-wallet that seeks to provide wallet users with a balance between safety and ease of use. In this Gnosis Safe smart wallet review, we look at everything you need to know about the eth-based crypto vault while helping you determine if it indeed is the most secure smart contract wallet.

Gnosis safe key features:

Cross-platform: Gnosis Safe is a cross-platform wallet. It is available as a mobile app (for both Android and iOS), desktop app (for both Windows, macOS, and Linux), and an in-browser extension. 

Multi-user: Gnosis Safe smart wallet is also a multi-user wallet that provides multiple safes within the wallet. They have separate login credentials and work best for family members, acquaintances, or companies that want to maintain all their crypto assets in one vault.

DeFi focused: Gnosis also integrates some of the most popular decentralized finance apps and protocols maintained on the Ethereum Network.

Address book: Gnosis wallet also features an address book that allows you to either integrate the wallet with your phone’s contact list or save the contact information such as the wallet addresses of individuals you engage regularly.

Integrate Dapps: The fact that Gnosis Safe Smart wallet is built on the Ethereum ecosystem makes it possible to explore the blockchain and interact with different Dapps maintained here.

Gnosis safe security features:

Password: Like most other wallets, Gnosis Safe Smart wallet is password-secured, and you get to set this unique key when creating a user account.

Two-factor authentication: You can always use the Gnosis Safe Authenticator or the Status Keycard to activate the wallet’s 2-factor authentication feature for all outbound transfers.

Recovery seed: During the wallet activation and account creation process, you will be presented with a backup/recovery seed for the wallet. Write it down and keep it safe offline.

Open source: Gnosis Safe Smart wallet is fully open-sourced and users, as well as crypto security experts, are free to view and audit source code for vulnerabilities. Gnosis Labs has also continuously run a bug bounty program for the wallet, and no critical bug or vulnerability has ever been discovered.

Multi-signature: Gnosis Safe Smart wallet is a multi-signature crypto vault. You can activate this feature for the entire wallet if you only run one safe or any number of safes hosted by the wallet.

How to activate/setup the Gnosis Safe Smart Wallet?

Step 1: Start by downloading the Gnosis Safe Smart wallet from either the website or the app store

Step 2: Install and launch the app. Click on the “Create a new wallet” icon

Step 3: Read through and agree to the Gnosis privacy policy and terms of use

Step 4: Create a unique password for the Gnosis Safe wallet

Step 5: Proceed to create the first safe for the wallet. This requires you to deposit Eth or any of the supported tokens, and you will be charged a small fee (about 0.005 ETH) as the cost of deploying the wallet

Step 6: Confirm that you are ready to create a wallet on the pop-up window

Step 7: You will be required to download the web extension that serves as your wallet’s two-factor authenticator. It is also referred to as a Safe Authenticator.

Step 8: Install the browser extension app and upon launching, create a user password. This has to be different from the mobile app password.

Step 9: In the next window, click on the ‘Show QR Code’ icon and scan the QR code with your phone to connect the Safe Authenticator with Gnosis Safe Smart wallet

Step 10: Write down the recovery phrase provided and store it in a safe offline environment. Verify that you have copied it correctly.

Step 11: Pay the wallet deployment fees

Step 12: You will receive a notification via the in-browser app, informing you that the safe wallet has been successfully created and deployed.

Step 13: Your Gnosis Safe Smart wallet is now active and ready to use

How to add/ receive Crypto into Gnosis safe smart wallet:

Step 1: Log in to your Gnosis safe mobile app wallet and click on the ‘Receive” icon

Step 2:  If you have multiple safes created, select the safe into which you want to receive the crypto

Step 3:  Copy the wallet address or the QR code for the safe and forward it to parties ending you crypto

Step 4: Wait for the funds to reflect in your wallet

How to send crypto from Gnosis safe wallet:

Step 1: Log in to your Gnosis safe Mobile wallet app and click on the “Send” icon

Step 2: Select the safe from which you want to send crypto

Step 3: Select the digital asset you want to send

Step 4: Enter the recipient’s address and the number of coins you wish to send in the transfer window

Step 5: Check that the details of the transaction are correct and click the send button

Step 6: Log in to the Safe Authenticator (in-app browser) to review and authorize the transaction. Click the ‘Submit’ button if satisfied with the accuracy of the transaction details

Step 7: Return to the Gnosis safe smart mobile wallet to initiate the transfer.

Gnosis Safe smart wallet ease of use:

Though one may consider the setup and activation process for the Gnosis Safe Smart wallet app to be too lengthy, it is still quite straightforward. The setup guide is easy to follow, and you do not even need expert help to set up the mobile wallet or link it with the Safe authenticator. The Gnosis Safe wallet website features a wide range of guides that explain how to activate and interact with the Ethereum wallet.

Gnosis Safe smart wallet supported currencies:

Gnosis Safe is an Eth-focused wallet. It will, therefore, only feature Ethereum, Ethereum Classic, ERC-20 tokens, and such collectibles as the ERC-721 tokens.

Gnosis Safe smart wallet cost and fees:

Gnosis Safe wallet is free to download and install. However, you will be required to pay a small wallet deployment fee of ETH 0.005 when creating a wallet. Other fees include the transaction fees charged by the Ethereum network when you send cryptos/tokens to other wallets or exchanges.

What are the pros and cons of using Gnosis Safe smart wallet?

Pros:

  • It embraces highly advanced security features
  • It makes it possible for you to invest and earn digital assets
  • Gnosis wallet has a highly responsive customer support team
  • The wallet provides you with a demo version that you can use to test the vault

Cons:

  • It will only support Eth based cryptos and tokens
  • The wallet is exposed to inherent threats facing hot wallets
  • It imposes a ‘wallet deployment’ fee

Verdict: Is Gnosis Safe Wallet secure?

Well, Gnosis Safe Smart wallet embraces several highly effective security measures that its developers believe will play a key role in boosting the wallet’s safety and privacy. The wallet is password secured, outbound transfers from the Gnosis Safe smart wallet must be subjected to two-factor authentication, it is a multi-signature vault, and has also been formally verified by the Ethereum network. Our only concern with the Gnosis Safe Smart wallet is that both the Gnosis safe mobile app and Gnosis Safe Authenticator are online-based and, therefore, exposed to the inherent threats facing hot wallets. 

Categories
Forex Course

175. Understanding ‘Market Sentiment’ In The Forex Market

Introduction

By now, you have come across terms like bear markets, bull markets, and neutral markets. At their core, these terms represent market sentiment. In this lesson, we will learn about market sentiment in forex and what brings it about.

What Is Market Sentiment?

Forex traders execute their trades based on how they think the market will move. If you are a forex trader, for whatever your reasons, you must have thought at some point, “…I think the price for the GBP/USD will rise, let me go long on the pair.” This decision was your sentiment about that particular currency pair. By making that trade, you have expressed your sentiment about the currency pair.

However, not every other forex trader would have agreed with you that the price for the GBP/USD would rise. Some forex traders thought the pair would fall and go short. Hence, at any given moment, some traders will hold the assertion that a given currency pair will rise while others claim that the pair will drop. Therefore, at any given moment, there will always be traders favoring going either long or short. Those who are in the majority form the market sentiment.

Therefore, market sentiment is the overall belief of the majority of traders. In the forex market, the market sentiment is the dominant consensus by active traders about a particular currency.

Types of Forex Market Sentiment

Bullish market sentiment occurs when most traders believe that the price for a particular currency pair will rise, and they go long.

Bearish market sentiment occurs when more forex traders short a currency pair because they believe that the price will fall.

Neutral market sentiment occurs when an equal number of traders are going long and short on the same currency pair.

What brings about market sentiment in forex?

In the forex market, sentiments express the outlook of traders about a particular currency or currency pair. Thus, the two main drivers of market sentiment in the forex markets are geopolitical developments and fundamental economic indicators.

Geopolitics

Unexpected political events may impact the future of a country’s economic prospects. In the current climate, some of the significant geopolitical developments that affect market sentiment in forex include; Brexit, the Sino-American trade war, and the 2020 US presidential elections.

Let’s look at Brexit, for instance. In September 2020, there has been increased pessimism about Brexit negotiations with the UK threatening not to honor an earlier agreement with the EU. To forex traders, this increases the chance that the UK will not secure favorable trade deals and also ruin its reputation globally. Since this poses a risk for the UK economy, market sentiment was bearish on the GBP.

Fundamental Economic Indicators

These indicators show how the economy has fared. They show if the economic condition of a country has been growing, stagnating, or worsening. Forex traders base their market sentiments by making their judgments about the economy’s future, depending on how they interpret the publication of these indicators.

If an economic indicator, say unemployment rate, is better than what analysts predicted, it shows that the economy is expanding hence better prospects. When the fundamental indicators are positive, forex traders will adopt a bullish stance on that country’s currency. Conversely, negative fundamental data leads to a bearish sentiment on the currency.

[wp_quiz id=”89638″]
Categories
Crypto Videos

Should You Trade Forex With A Smart Phone Or Tablet? Our Free Signals App In The Description!

Should you trade forex with a smartphone or tablet app?


In this session, we will be looking at whether or not new traders, in particular, should trade with a mobile phone or tablet app only?

Regulated brokers in the United Kingdom must display the following message on their website, giving the updated statistics on the percentage of retail investor accounts, which lose money when trading spread bets or contracts for difference.

This is one we copied from IG index.
‘’Spread bets and CFDs are complex instruments and come with a high risk of losing money rapidly due to leverage. 76% of retail investor accounts lose money when trading spread bets and CFDs with this provider. You should consider whether you understand how spread bets and CFDs work and whether you can afford to take the high risk of losing your money.’’
The message is stark; three-quarters of retail traders burning their accounts is huge. And so most brokers rely on a revolving door of new traders coming in, while others bow out having lost their funds.
The reason is simple, a lack of knowledge by retail traders, the majority of whom are not much more than gamblers, and the house always wins in the end.

Let’s get back to the topic headline, should you trade forex with a smartphone or tablet app only.
More and more people are downloading trading apps as provided by brokers, trading, often on the go, maybe at work in an unrelated industry, or while at the gym or going for a walk or perhaps shopping, and spot a trade on their app and have a punt.

Now they might get lucky, occasionally, and think they have picked up a great new secondary source of income. Still, the whole thing about trading is that it is not like gambling, if you go into a casino and have a punt on the roulette wheel, maybe you will pick the right number, or maybe you will pick black, and the ball falls on the right black number, and you’ll be lucky, and that will be: all it is luck. However, with trading, it’s all about learning about fundamental analysis, learning about technical analysis, keeping abreast of economic data releases, speeches by key policymakers, and considering market analysis by professional traders and economists. Now traders are stacking the odds in their favor in order to have much more chance of a successful outcome.

And so, 25% of traders who are not losing money are highly likely those who do not trade on mobile phones or tablet apps. They will probably have at least two decent size computer screens for analysis purposes, perhaps also a tablet to keep them up to speed with economic news, where they are constantly juggling between technical analysis setups and market-related information in order to be informed.
A mechanic would not work on a car engine with only a screwdriver, and a surgeon would not operate on a person with only a scalpel to hand.
In conclusion, the more tools a trader has at his or her disposal, the better chance they will have of being on the 25% side of the above statistic.

Categories
Forex Videos

Has Time Run Out For The BrexitFuture Trade Deal? GBP On The Ropes!

Has time run out for the Brexit future trade deal? Where next for the Pound?

Thank you for joining this forex academy educational video.

The British government set itself a deadline of 15th of October with which to had a formal future, a tariff-free trade deal with the EU by the 15th October 2020.
That deadline came and went and was subsequently extended to the 13th of November, where, at the time of writing, no such agreement is in place. The United Kingdom is set to leave the European Union transition period on the last day of 2020. With both the European Union chief negotiator Michael Barnier, and the UK’s chief negotiator on this issue, David frost, both proclaiming that the other side needs to move on key issues such as fisheries, I need a so-called level playing field, it is highly unlikely that a deal can be reached in time I’m for the legal framework to be set in place whereby any such new tariff 3 agreement can be implemented on the 1st day of January 2021.
So, what are the options? The UK government cannot extend the negotiation period because the end of the transition period date is set into law. And so if they will not budge on the requirements and terms of a future trading partnership with the EU, it will appear that the British will be leaving on WTO, or world trade organization, terms, and it is perceived that this would be bad for the British economy, whereby a tariff-free arrangement with the European Union would be in the best interests of both sides because it would offer a smoother, future, trading arrangement.
Let’s have a look at how this is being played out in the forex market, where the most widely traded British pound pair is the GBPUSD.

This is a daily chart for the pair. And we note and expansive bull channel, which has been conforming since the middle of May 2020. This tells us that price action has been fuelled by the potential of a future tariff-free trade deal with the EU. The overall price action has been to the upside. Although this has been waning since early September, such as position ‘A’ and the most recent high was at 1.33.

However, if we bring that daily time frame down to the 4-hour chart, we now see that although price action was waning to the upside at position A on the 1-hour chance, price action for that period has been conforming to an expanding bearish channel on the 4-hour chart.

Now let’s look at what has been happening for the pair are on a 1-hour chart over the last 8 days. Here we can see that price action has been conforming to this triangle where initially we have a bull run up to a peak of just above 1.3300. Since then, price action has been falling lower, to just above 1.3100, and where price action is now conforming to the fundamentals with regard to the potential of a no tariff future trading arrangement deal Brexit.

As time runs out, with no sides giving up any grounds in order to compromise for the sake of a future tariff-free trading relationship, the pair will continue to come under pressure to the downside, in which case the pound is likely to lose value against its counterparts and especially with the United States dollar, notwithstanding the fact that the US economy is suffering because of the covid pandemic and where 150,000 cases were reported in a single day this week, heaping more pressure on the federal government to find fiscal solutions to this problem, which is not going away anytime soon.

Categories
Forex Fundamental Analysis

What Is Long Government Bond Auction and What Should You Know About It?

Introduction

Every government must finance its expenditures with a mixture of debt and revenue. Through debts, governments issue a mixture of short-term and long-term debt instruments to the public. When these debt instruments are being issued, they have an interest rate, one which government will pay the debt holders until maturity. For economists and financial market analysts, the interest rate paid can be used to analyze the government’s creditworthiness and the expected rate of inflation.

Understanding Long Term Bond Auction

A bond in finance is a fixed-income asset issued by an entity to borrow money from investors. Investors get to receive a fixed interest depending on the quantity they purchase. This fixed interest, called a coupon,  is usually paid at predetermined intervals until the bond reaches maturity.

Maturity is the duration in which an investor must hold the bond before they can redeem and get their principal back. It is the bond’s maturity that determines whether it is categorized as a short-term or long-term bond.

Long-term bonds are bonds that have maturities of more than one year.

On the other hand, long bonds are bonds with the longest possible maturity that the issuer can issue. For most governments, long bonds usually have a maturity of up to 30 years.

Long bond auction refers to when bond issuers offer the sale of long bonds to the public. It is at these actions where the rate is fixed. This rate is what bondholders will receive for holding the long bonds until maturity.

Bond yield is the return an investor can expect to receive from buying a bond. The bond yield usually comes into consideration when the bond starts trading in the secondary market. We will later see how this yield can be used for analysis.

Here is a list of long government bonds for the developed economies.

  • Austria 10-year bonds
  • The US 30-year bonds
  • Dutch 10-year bonds
  • Portugal 10-year bonds
  • Spain 50-year Obligation
  • France 30-year OAT
  • UK 30-year Treasury Gilts
  • Germany 30-year Bunds
  • Italy 30-year BTPs

The rate attached to these long bonds during auctions can tell us a lot about investor sentiment of these economies.

Using Government Long Bond Auction in Analysis

The rate ascribed to the bond at auction is what bondholders will expect to receive at predetermined intervals until maturity. Comparing this rate with the rates on past auctions, we can form an opinion about the debt situation of the country and the expected rate of inflation by the investors.

For investors, buying a bond is the equivalent of owning an asset that has a predetermined future cash flow. Since it is virtually unheard of for governments to default on interest rate payments or the repayment of principal upon maturity, long government bonds can be said to be risk-free. With this in mind, the only potential risk that bondholder faces is inflation. In fact, inflation has been called the “bond’s worst enemy.”

You see, a rise in inflation means that some percentage will erode the future purchasing power of money. This erosion of the value of future cash flows means that investors must demand a higher interest rate at long bond auctions. At the back of their minds, investors envision that the rate they demand at bond auctions must also include the expected inflation rate. Effectively, higher rates on bonds help mitigate the erosion in purchasing power of their future cash flows.

Source: St. Louis FRED

At the auction, the bond buyers would feel the need to bid for higher rates if they believe that the rate of inflation will remain relatively stable. In this scenario, they can be assured that the purchasing power of their expected cash flows won’t be eroded. So, what does long bind auction tell us about inflation? The rate at an auction will increase compared to the previous auction if investors believe that future inflation will rise. Conversely, the rate at the auction will decrease when investors hold the conviction that future inflation will remain relatively stable.

The other way government long bond auction can be used for analysis is by using the bond yield. For most economists and financial analysts, the yield is the most closely monitored aspect of a bond. The reason for this is because bond yield offers broad information about a country’s debt situation. Here’s the formula for calculation the bond yield.

Let’s use some simple calculations to illustrate how this works.

Say when the bond is being issued, it has a price of $1000 with an annual coupon payment of $50. Remember that the coupon payments are fixed and cannot change; investors can expect to receive this $50 until maturity.

In this case, the bond yield is 50/1000 * 100 = 5%

Now, imagine that the economic situation of a country is worsening, and it becomes increasingly indebted. In this case, the price of the bond will decrease, let’s say to $900, which means that the yield on the bond increases to 5.56%. Conversely, if the country’s economic performance improves, the bond prices will increase, meaning that the yield will fall. In our example, if the price increased to $1050, the yield will decrease to 4.76%.

Impact of Government Long Bond Auction on Currency

Using the yield on the long government bonds published during an auction, we can determine the economic performance. Therefore, when the yield increases, it means that economic performance in the country is worsening. To forex traders, this can be taken as a deep-seated economic contraction, which will make the domestic currency depreciate relative to others. On the other hand, if the yield falls during an auction, it could be considered a sign of economic prosperity. In this case, the domestic currency will appreciate.

Sources of Data

Globally, the central banks are responsible for auctioning long government bonds. Trading Economics has an exhaustive list of global government bonds and their yields. The United States Department of the Treasury, through TreasuryDirect, publishes the data on the US bond auctions.

How Government Long Bond Auction Affects The Forex Price Charts

The recent auction of the US 30-Year Bond was on October 8, 2020, at 1.00 PM EST and accessed at Investing.com. Low volatility is expected upon the release of the auction date.

In the October 8, 2020, auction, the yield on the US 30-year bond auction was 1.578% higher than the 1.473% of the previous auction.

Let’s see if this auction impacted the USD.

EUR/USD: Before Government Long Bond Auction on October 8, 2020, 
just before 1.00 PM EST

The EUR/USD pair was trading in a steady uptrend before releasing the US 30-Year Bond Auction yield. The 20-period MA can be seen rising with candles forming above it.

EUR/USD: After Government Long Bond Auction on October 8, 2020, at 1.00 PM EST

The pair formed a 5-minute bearish “hammer” candle immediately after the publication of the US 30-year bond yield. Subsequently, the pair traded in a subdued uptrend. The release of the data had no impact on the USD.

The auction of long government bonds serves a vital role in the economy. However, as we have observed in the above analyses, their impact on the forex market is not significant.

Categories
Crypto Guides

Will Audius be the Next Spotify?

Introduction

Nowadays, advanced technology has made it possible for everyone to showcase their talent in front of the whole world without hassle. The Internet also provides you with a platform where you can gain fame and recognition within no time. For both these purposes, you just need three basic things: incomparable talent, correct stage, and proper strategy. While skill and strategy rely entirely on you, finding the right platform has become easy with Audius.

Don’t worry if you haven’t heard the name Audius before. We have collected all the information about this new title in the music industry. So you will be able to see how it can change your life. Let’s get into the details.

What Is Audius?

If you are aware of the concept of Ethereum, that runs the cryptocurrency Ether, it will be convenient for you to understand Audius. Ethereum has used its blockchain-based set up to provide this music streaming service to everyone in the world. Audius promotes its motto that states, “We give everyone the freedom to share and listen.”

Basically, Audius is a music streaming platform that runs on blockchain and provides ample opportunities to everyone who wishes to share their music with the world. This means it has eliminated the hassle and process of indulging with major labels and corporations for music production. Therefore, artists can share their music with their intended audience without any middlemen.

How Does Audius Work?

Audius seems to work the same way as Spotify or SoundCloud. A few steps involved in using this platform include:

Buying Tokens: There is a concept of Audius Tokens that both artists and listeners should be aware of. Being a user, you can either spend money to buy these tokens or earn them just by listening to the ads.

Spend and Listen: Once you have tokens in your wallet, you can use them to listen to your favorite music. For each song that you listen to, a fraction of a cent will get cut from the total amount.

That was from the perspective of the listeners. When we talk about the artists, they will get approximately 85% of the entire money earned on their music. This percentage is higher than almost all similar apps that offer a maximum of 70% cut.

The remaining 15% of the amount will be given to the following people:

  • Song host
  • Audius developers
  • Other associated people

What Is The Benefit Of Audius?

The primary benefit of Audius is that artists can conveniently showcase their talent to the world, while listeners can get a chance to explore more diverse music. However, this isn’t the only perk of this platform.

When we talk about the music industry, most artists often get stuck between corporations and big labels. Most of the earnings on music are taken by these middlemen, leaving a minimal cut for the artists. But with the help of Audius, they can get almost 85% of the total revenue generated by their song. Hence, they will get paid well for their efforts and talent.

All in all, Audius is an excellent initiative by Ethereum because it will be beneficial for both artists and listeners. So there won’t be any hassle or complications associated with producing some quality music.

Categories
Forex Assets

Costs Involved While Trading The AUD/PHP Forex Exotic Pair

Introduction

In this exotic forex pair, the AUD is the Australian Dollar, and the PHP is the Philippine Peso. Note that trading with such exotic pairs is accompanied by periods of high volatility compared to major forex pairs. The AUD is the base currency, while the PHP is the quote currency. Therefore, in forex trading, the price of the AUD/PHP represents the amount of PHP you can purchase using 1AUD. Say that the price of AUD/PHP is 34.057. It means that with 1 AUD, you can buy 34.057 PHP.

AUD/PHP Specification

Spread

In the forex market, when going long, you buy a currency pair from the broker at a “bid” price. When you go short, you sell the currency pair to the broker at the “ask” price. The difference between the two prices is the spread.

The spread for the AUD/PHP pair is – ECN: 10 pips | STP: 15 pips

Fees

Forex traders using ECN type accounts get charged a trading fee by their brokers depending on the size of their position. STP type accounts rarely attract any trading fees from the brokers.

Slippage

If you have ever opened a trade during periods of increased volatility, you will notice that your order price differs from the execution price. This difference is slippage. It can also be caused when your broker is slow to execute your order.

Trading Range in the AUD/PHP Pair

The trading range refers to the analysis of the fluctuation of a currency pair over various timeframes. With the trading range, we can determine volatilities from minimum to the maximum across all timeframes. This information will be useful in deciding profitability across these timeframes.

The Procedure to assess Pip Ranges

  1. Add the ATR indicator to your chart
  2. Set the period to 1
  3. Add a 200-period SMA to this indicator
  4. Shrink the chart so you can determine a larger period
  5. Select your desired timeframe
  6. Measure the floor level and set this value as the min
  7. Measure the level of the 200-period SMA and set this as the average
  8. Measure the peak levels and set this as Max.

AUD/PHP Cost as a Percentage of the Trading Range

The percentage of the trading range is when we take the total costs associated with trading a particular pair and express it as a percentage of the volatility. Below are the percentage of the trading range for ECN and STP accounts.

ECN Model Account costs

Spread = 10 | Slippage = 2 | Trading fee = 1

Total cost = 13

STP Model Account

Spread = 15 | Slippage = 2 | Trading fee = 0

Total cost = 17

The Ideal Timeframe to Trade  AUD/PHP Pair

We can observe from the above analyses that longer timeframes produce higher volatilities. More so, as the volatility increases, the trading costs decrease. Therefore, shorter-term traders of the AUD/PHP pair experience higher trading costs than longer-term traders.

However, trading costs can be reduced if traders were to open their positions when the volatility is approaching the maximum. Notice that across all timeframes, the trading costs are lower when volatility changes towards the maximum. Furthermore, using forex limit order types can be used to lower trading costs. Such order types eliminate the slippage costs. Here’s a demonstration.

ECN Account Using Limit Model Account

Total cost = Slippage + Spread + Trading fee

= 0 + 10 + 1 = 11

By getting rid of the slippage costs, we have effectively lowered trading costs across all timeframes.

Categories
Forex Course

174. Summary – Multiple Timeframe Analysis

Introduction  

This lesson is basically an overview of what we have covered so far in the Multiple Timeframe series. Multiple timeframe analysis in forex is observing the price action of a selected currency pair under different timeframes. Most forex brokers will provide you with several timeframes. These timeframes are categorized in minutes from 1-minute timeframe to 30-minute timeframe, hourly timeframes from 1-hour timeframe to 12-hour timeframe, the daily timeframe, weekly timeframe, and the 1-month timeframe.

Everything we learned so far!

As we discussed in our first lesson, multiple timeframe analysis involves using at least three timeframes to make a trade. A longer timeframe is used to establish the dominant market trend. Depending on your forex trading style, this dominant trend is used as the prevailing primary trend to anchor your trades. The rationale behind using the longer timeframe to establish the primary trend is because longer timeframes take long to be formed and are not susceptible to the micro fluctuations in price.

The dominant trend is broken down using a medium timeframe to establish the magnitude of the trend. Finally, a shorter timeframe is used as a trigger timeframe by finding the best points to enter and exit a trade. The most common technique of trading multiple timeframes in the forex market is trading three timeframes.

Trading multiple timeframes in forex, therefore, means using multiple timeframe analysis to inform your trading decision. The choice of timeframes used in your analysis entirely depends on the type of forex trader you are.

The table below summarises the type of forex trader and the preferred timeframes.

Note that the above table is merely a guideline. We recommend selecting your desired timeframes for analysis based on your trading style and comfort of analysis. Therefore, the best timeframes to trade in forex will depend on factors such as market volatility and your trading style.

Some of the importance of multiple timeframe analysis in forex include:

  • The ability to determine the magnitude and significance of economic indicators;
  • Identifying support and resistance levels which aid to execute various forex orders and in setting ‘take profit’ and ‘stop-loss’ levels;
  • Helps to identify market trends and their magnitude at a glance quickly; and
  • Helps in forex forecasting by eliminating the lagging effects of most technical forex indicators.
[wp_quiz id=”89204″]
Categories
Cryptocurrencies

JWallet Review: Is JWallet The Most Secure Wallet For Ethereum Tokens?

Jwallet is a multi-coin cryptocurrency wallet developed by Jibrel Network and introduced to the crypto community as one of the safest token wallets. It is Eth-specific and specially designed to host ERC-20 tokens, collectibles like ERC-721 tokens, Non-Fungible tokens, and custom tokens.

Jibrel website describes Jwallet as an institutional-grade crypto vault that seeks to provide users with an all-in-one platform to store, interact with, and exchange eth tokens. It has since incorporated a wide variety of operational and security features that make it the next generation token-wallet you can use to secure and easily manage your digital assets.

But is Jwallet as safe and easy to use as the Jibrel website claims? We will be answering these issues by looking at the wallet’s key features, the number of supported currencies, vetting its ease of use, and outlining the step-by-step guide on how to activate and use this Jibrel crypto wallet.

JWallet key features:

Cross-platform: Jwallet is a multi-device and cross-platform wallet. It is available both as a mobile app for both Android and iOS devices. It is also a web wallet that’s accessible via the computer and phone web browsers.

BYOT: JWallet features the Bring Your Own Token (BYOT) service that allows you to import custom tokens and add them to your wallet. The tokens don’t have to be publicly listed, plus the process of importing tokens to the wallet and adding them to the wallet is easy and straightforward.

Portfolio tracker: The Jibrel network website refers to the crypto vault as an enterprise-grade wallet with banking-grade tracking tools. These allow you to view your transaction history and monitor your crypto balances in real-time.

Address book: JWallet also features an address book that integrates your contact list. This contact feature makes it possible for wallet users to integrate their phone’s address book with the wallet and save more contacts and wallet addresses of the parties you interact with regularly.

Inbuilt exchange (JCash): JWallet features an inbuilt decentralized exchange where wallet users can buy, sell, and exchange eth-tokens for other tokens or stable tokens. The value of these stable tokens is pegged on either fiat currencies or commodities using smart contracts. The exchange service is powered by J Cash, a proprietary currency conversion tool by Jibrel Network.

Integrates DeFi apps: JWallet is built on the Ethereum network and integrates the Decentralized Finance apps and protocols like MakerDAO that wallet users can leverage and use to generate incomes.

JWallet security features:

Passcode + Biometrics: Jwallet is passcode-secured, which you get to set when creating a user account. You can also reinforce this with such Biometrics as the Face or fingerprint I.D.

Non-custodial: JWallet does not collect any user data. It also won’t store your private keys or copies of it on the company servers. Rather, all your sensitive wallet data, especially the private keys and such other sensitive information like wallet passwords, are encrypted and stored locally – in your phone or computer device.

Recovery seed: The crypto wallet also makes it possible for you to backup your private keys and wallet data. You will receive a set of 12 phrases that form the wallet’s recovery seed during installation. Write these down on a piece of paper and keep it safe offline. You will need this backup seed to recover lost keys or open the wallet on a new device.

Highly regulated: Unlike most other crypto wallet apps, JWallet is highly regulated. To use some of the wallet’s core features and interact with its fundamental services, like J Cash, you will be required to first verify your identity by completing the KYC and AML procedures.

Client-side encryption: JWallet also embraces client-side crypto encryption. This implies that all your wallet data and any communication with the Jibrel company servers or third party systems are encrypted before they leave the wallet.

How to activate/ setup the JWallet

Step 1: Start by downloading your JWallet cryptocurrency app compatible with your device on either Google Play Store or Apple App Store.

Step 2: Install and launch the wallet app. Click on the “Create a new wallet” icon on the wallets installation page.

Step 3: Agree to the Jibrel wallet’s terms of use and privacy policy.

Step 4: Create and verify the wallet password, and create a hint for the password

Step 5: You now have access to the Jwallet user interface

Step 6: Click on the “settings” icon on the bottom left corner of the wallet and select “Manage wallets.”

Step 7: Select your wallet, click on the three dots on the right side of the wallet, and tap on the ‘Backup’ option to generate the wallet’s recovery seed.

Step 8: You can then use the settings icon and manage wallets option to personalize your Jwallet, like converting it to a multi-address wallet or activating biometric security features

Step 9: Your JWallet is now active and ready for use

How to add/receive Crypto into JWallet:

Step 1: Log in to your JWallet crypto vault and click the “Receive” icon on the user dashboard.

Step 2: Select the wallet address to which you wish to add tokens

Step 3: Copy this wallet address or its QR code and forward either to the person sending you tokens.

Step 4: Wait for the funds to reflect in your JWallet

How to send crypto from JWallet wallet:

Step 1: Log in to your JWallet app, and on the user dashboard, click “Send.”

Step 2: Select the wallet address from which you wish to draw funds

Step 3: If you have multiple tokens store in here, select the currency you wish to send

Step 4: Enter the recipient’s address and amount to send on the ensuing transfer window.

Step 5: Confirm the details of this transaction before hitting send

JWallet ease of use:

Activating the JWallet app or the JWallet web wallet and creating a user account takes less than five minutes. Interacting with most of the JWallet features and services is quite straightforward. The processes of sending and receiving crypto into your JWallet is also easy and straightforward.

More importantly, both the wallet app and web wallet are multilingual and available in both English and Korean languages.

JWallet supported currencies:

JWallet is a multi-coin wallet that supports 1000+ crypto tokens and collectibles. These include ERC-20 tokens, custom wallets, stable coins like J Stable coin, and other Eth-based crypto tokens.

JWallet cost and fees:

Jwallet is a fee-free wallet. You will not be charged for downloading and installing the app, and neither will you be charged for transfers within the Ethereum network.

JWallet customer support:

JWallet maintains a highly responsive customer support team. Both the web wallet and crypto wallet app maintain elaborate FAQ sections that address most user concerns, how-to guides, and troubleshooting guides.

For personalized queries, you can contact the wallet’s customer support team by raising a support ticket on the Jibrel network website or by direct messaging them on such social media platforms as Telegram, Twitter, Kakaotalk, Reddit, and Bitcointalk.

What are the pros and cons of using JWallet?

Pros:

  • It is a fee-free Ethereum wallet.
  • JWallet maintains one of the easiest set and account activation guides.
  • It has a highly responsive customer support team.
  • It is feature-rich and hosts such highly advanced crypto security guides as the proprietary JCash

Cons:

  • It is a hot wallet that’s prone to online threats like phishing attacks.
  • Jwallet will only support eth-based cryptos and tokens.

Comparing JWallet with other Ethereum wallets

JWallet vs. MyEtherwallet

Jwallet and Myetherwallet are bothEthereum-specific crypto wallets. They both are easy to use and host numerous eth-based crypto tokens. Both integrate DeFi apps and protocols that allow their users to earn interest on digital assets and integrate the address book that allows the wallet user to send funds to a username and not necessarily a wallet address.

But while Jwallet will only support Eth-based tokens, Myetherwallet is more versatile and hosts such popular non-Ethereum cryptos as Bitcoins. Similarly, MyEtherwallet hosts an even larger set of features that include integrating third party exchanges like Changelly and Shapeshift that have simpler fiat-to-crypto conversion processes and even allow you to purchase crypto with a card. We nevertheless like Jwallet’s revolutionary stable tokens.

Verdict: Is JWallet safe?

Well, Jwallet has put in place several effective security and privacy measures for both the wallet app and web wallet. Some of these include securing your wallet with a password and fingerprint, client-side encryption tool for the wallet communications with third parties systems, it is non-custodial, and also provides you with a backup and recovery seed. The only downside to this is that both the web wallet and mobile apps are hot wallets and that you need to pass the KYC and AML requirements before using their J Cash feature.

Categories
Forex Elliott Wave Forex Market Analysis

Is the EURJPY Ready to Develop a New Decline?

The EURJPY cross advances in a long-term consolidation structure, which began in early December 2016. The short-term Elliott wave view predicts a limited decline in the following trading sessions.

Market Sentiment

The EURJPY cross closed the last trading week, cutting Monday’s session gains when the cross jumped from 122.835 until 125.136, mainly supported by the stock market’s post-election rally.

The following figure shows the EURJPY in its daily timeframe, revealing the mid-term big-market participants’ sentiment exposed by the 90-day high and low range. In this context, the cross is entering into the bearish sentiment zone. However, the 60-day weighted moving average still doesn’t confirm the short-term bearish bias.

After a rally that carried the cross to advance over 11% since May 07th (when the EURJPY bottomed on 114.397 and then soared, reaching the highest level of the year at 127.075 on September 01st), the cross began to retrace, turning its mid-term market sentiment from extremely bullish to bearish.

Nevertheless, the price action still doesn’t confirm the bearish sentiment. In this regard, the short-term sentiment remains neutral until the price confirms the bias.

Technical Overview

The big picture of EURJPY illustrated in the following daily chart exposes a long-tailed yearly candlestick mostly bullish. However, the upper shadow hints at a bearish pressure near the psychological barrier of 127. Moreover, the next resistance is placed at 127.502, which corresponds to the high of 2019.

The EUJPY long-term trend under the Dow Theory perspective and exposed in the next log scale weekly chart reveals the primary trend identified in blue that remains slightly bullish.

At the same time, the secondary trend exposes the sideways movement developing as a pennant pattern, which began in early December 2016 when the price found resistance at 149.787 and could break soon.

According to the classic chartist theory, the pennant pattern is a technical figure that calls for the continuation of the previous movement. In this case, the pennant could resume the rally developed since late July 2012 at 94.114 ended at 149.787 in early December 2014.

Short-term Technical Outlook

The short-term Elliott wave view for EURJPY shows in its 12-hour chart advancing in an incomplete corrective sequence that began on May 06th at 114.397, where it completed its wave A of Minor degree labeled in green.

Once the price found fresh sellers at the highest level of the year, the cross started to advance in its wave B, still in progress. In this context, the previous chart unveils the intraday upward sequence corresponding to the incomplete wave ((b)) of Minute degree identified in black.

The price action could boost the cross until the next supply zone, located between 125.285 and 126.123, where the EURJPY could start to decline in an internal five-wave sequence corresponding to wave ((c)), in black, that may drop to 120.271, though, the price could extend its drops until 117.124.

The short-term bearish scenario’s invalidation level locates above the end of wave A in green at 127.075.

Categories
Crypto Guides

What Should You Know About Bitcoin Miner Capitulation?

Introduction

If you have dealt with cryptocurrencies like Bitcoin, you must know how uncertain they can be. While they can make you a millionaire within a day, they can also snatch away all your money in a short period. People who mine their money in Bitcoin have to keep a close eye on these fluctuations and ensure they take themselves out while there is still time. The same may be happening with Bitcoin.

You may have heard the experts talk about Bitcoin Miner Capitulation. Some of those also try to explain the concept in their own words. However, there is still a major confusion around the term “Miner Capitulation.” If you also want to learn more about the concept, you have come to the right place. We have collected all the crucial information on the topic to understand what exactly is happening with Bitcoin. So let’s begin.

What Is Bitcoin Miner Capitulation?

Bitcoin mining refers to the completion of verified transactions’ blocks that get appended to the blockchain. For these transactions, miners earn a reward in the form of cryptocurrency. If the miner isn’t able to manage to make out their operational costs from the Bitcoin mining process, they sell a significant amount of their mined Bitcoins. This leads to Bitcoin Miner Capitulation.

On the other hand, Miner Capitulation can also result from sudden drops in the Bitcoin market as this makes miners sell their coins. Hence, we can say that Bitcoin Miner Capitulation is when small miners can’t profit from their mining, and they back out. It creates selling stress in the market, leading to further drops in the price and a lack of buyers.

Is This First Bitcoin Miner Capitulation?

Many people dealing with Bitcoin assume this is the first time Bitcoin is experiencing a Miner Capitulation. But the facts state something different. Miner Capitulation has been seen twice in the history of Bitcoin:

  • 2016: When Bitcoin Halving took place this year, it was seen that miners began selling a significant amount of their Bitcoins.
  • 2018: Bitcoin again crashed by 50%, getting a value of $3,000 from $6,000. This led to low profits for small miners, and they again sold their Bitcoins in massive amounts.

Apart from these, the 2013 effect on Bitcoin’s price also brought in some Miner Capitulation. Therefore, this isn’t the first time Bitcoin is experiencing one such situation. It has happened whenever Bitcoin Halving takes place or the price drops down.

Is Bitcoin Miner Capitulation Something To Worry About?

It is usual for a big market like Bitcoin to host thousands or millions of transactions every day. So when some of the miners sell their coins, how does that make any difference? The answer to this question is simple, i.e., the tension of sale in the market.

With these small miners selling their coins, many other people also begin considering selling their coins. This stress rises with more sales. Moreover, it causes a lack of buyers in the market, and Bitcoin’s price falls further.

People are relating Bitcoin Miner Capitulation to more significant problems that may be seen in the upcoming times. That is why you must learn more about the current situation and take action while there is still time to save yourself from any bigger trouble.

Categories
Forex Fundamental Analysis

The Impact Of ‘Machinery Orders’ Fundamental Indicator News Release On The Forex Market

Introduction

Industrial and manufacturing productions are one of the pillars of any economy. Whenever policies are implemented, governments tend to focus on ways to improve or increase production in the country. The main significance of manufacturing and industrial production is that they create employment opportunities in the local economy and ensure value addition to domestic products, making them competitive in the international markets. Furthermore, they contribute majorly towards technological advancements, which is why data on machinery orders is vital.

Understanding Machinery Orders

As an economic indicator, machinery orders measures the change in the total value of new orders placed with machine manufacturers, excluding ships and utilities.

The data on machinery orders are categorized into orders by; the private sector, the manufacturing sector, governments, overseas orders, and orders made through agencies. All these orders exclude volatile orders from power companies and those of ships.

Source: Cabinet Office, Government of Japan

The machinery orders by electric companies and that of ships are considered too volatile. This volatility is thanks to the fact that ships and the machinery used by electric companies are extremely expensive. Furthermore, these orders usually are placed once over long periods. Therefore, including these orders might unfairly distort the value of the machinery orders data.

To get a clear picture of what machinery, in this case, means, here are some of the components that are included in the machinery orders data. They are metal cutting machines, rolling machines, boilers, power units, electronic and communication equipment, motor vehicles, and aircraft.

Machinery orders from the government are categorized into; transport, communication, ministry of defence, and national and local government orders.

In the industrial sector, machinery orders are categorized by the manufacturing and nonmanufacturing sectors. The nonmanufacturing orders include agriculture, forestry, fishing, construction, electric supply, real estate, finance and insurance, and transportation. Some of the categories of orders in the manufacturing sector include; food and beverages, textile, chemical and chemical production, electrical and telecommunication machinery, and shipbuilding.

Using Machinery Orders for Analysis

By now, you already understand that machinery orders data encompass every aspect of the economy. It ranges from domestic government orders, agriculture, manufacturing and production, services delivery, and even foreign orders. As a result, the monthly machinery orders data can offer a treasure of information not only about the domestic economy but also foreign economies as well.

Source: Cabinet Office, Government of Japan

When companies invest in new machinery, it is considered a capital investment. Capital expenditure is usually considered whenever there is an anticipation of increased demands and services provided by the company. In this case, companies must scale up their operations to increase supply to match the increased demand. In the general economy, an increase in aggregate demand can result from increased money supply in the economy. Thus, it can be taken as a sign that unemployment levels in the economy have reduced or that households are receiving higher wages. Both of these factors can be attributed to an expanding economy.

Note that machinery, in this case, means heavy-duty machinery. Typically, these types of machinery take long in the production and assembly lines. At times, orders have to be placed weeks or months in advance. Therefore, the machinery delivered now may have possibly taken months in the assembly line. When the machinery orders increase, we can deduce that these machinery producers and assembly plants have to employ more labor.

Consequently, an increase in machinery orders means that unemployment levels will reduce. In turn, households’ welfare will improve, and aggregate demand for consumer products will rise. In the end, discretionary consumer industries will also flourish. A decrease in the machinery orders will tend to have the opposite effect.

Suffice to say, the machinery in question here are not cheap. Most companies finance their capital expenditure using lines of credit. Therefore, an increase in machinery orders could imply the availability of cheap credit in the economy. Access to cheap financing by companies and households stimulates the economy by increasing consumption and investments. As a result, the increased aggregate demand leads to an increase in the GDP and expansion of the economy.

Machinery orders data can also be used as an indicator of the economic cycles and to predict upcoming recessions and economic recoveries. When firms anticipate that the economy will go through a rough patch and demand will fall, they cut back on production. Scaling down operations means that they won’t be ordering any more machinery to be used in the production. Conversely, when companies are optimistic that the economy will rebound from recession or a depression, they will order more machinery to scale up their production in anticipation of the increased demand. Furthermore, when the economy is going through an expansion, the aggregate demand tends to increase rapidly. This rapid increase forces companies to increase their machinery orders to enable them to keep up with the demand.

Impact on Currency

The machinery orders data is vital in showing the current and anticipated state of the economy. For the domestic currency, this information is crucial.

The currency will appreciate when the machinery orders increase. Machinery orders are seen as a leading indicator of industrial and manufacturing production. Therefore, when the orders increase, the economy can anticipate an increase in industrial production. And along with it, a decrease in the level of unemployment. Generally, the increase in machinery orders means that the economy is expanding.

Conversely, when machinery orders are on a continuous decline, it means that businesses expect a more challenging operating environment. They will scale down their operations in anticipation of a decline in the demand for their goods and services. In this scenario, higher levels of unemployment should be expected in the economy. Since the economy is contracting, the domestic currency can be expected to depreciate relative to others.

Sources of Data

In this analysis, we will focus on Japan since one of the world’s leading producers of heavy machinery. The Cabinet Office, Government of Japan, releases the monthly machinery orders data in Japan. Trading Economics publishes in-depth and historical data of the Japanese machinery orders.

How Machinery Orders Data Release Affects The Forex Price Charts

The Cabinet Office, Government of Japan, published the latest machinery orders data on October 12, 2020, at 8.50 AM JST. The release can be accessed at Investing.com. The release of this data is expected to have a low impact on the JPY.

In August 2020, the monthly core machinery orders in Japan increased by 0.2% compared to the 6.3% increase in July 2020. During the same period, the YoY core machinery orders were -15.2% compared to -16.2% in the previous reading. Both the MoM and YoY data were better than analysts’ expectations.

Let’s see how this release impacted the AUD/JPY forex charts.

AUD/JPY: Before the Machinery Orders Data Release on October 12, 2020, 
just before 8.50 AM JST

Before the release of Japan’s machinery orders data, the AUD/JPY pair was trading in a steady downtrend. The 20-period MA was falling with candles forming below it. Fifteen minutes before the news release, the pair formed three bullish 5-minute candles showing that the JPY was weakening against the AUD.

AUD/JPY: After the Machinery Orders Data Release on October 12, 2020, 
at 8.50 AM JST

As expected, the pair AUD/JPY pair formed a long 5-minute bearish candle. Subsequently, the pair traded in a renewed downtrend as the 20-period MA steeply fell with candles forming further below it.

Bottom Line

Although the machinery orders data is a low-impact economic indicator, its release had a significant impact on the forex price action. This is because better than expected data shows that the Japanese economy might be bouncing back from the coronavirus-induced recession.