
Introduction
Countries like the US and Canada, whose economies largely depend on oil, knowing if oil production is increasing or decreasing can offer valuable insight into the economy. The changes in production not only serve as a leading indicator of demand for oil and its products but also of the labor market.
Understanding US Baker Hughes Oil Rig Count
Baker Hughes is an American energy technology company providing oil field services. The company specializes in the oil and gas industry, providing services from exploration, formation evaluation, oil drilling, production, and reservoir consulting. Baker Hughes is operational in over 120 countries. Other services provided by the company include turbomachinery and process solutions, software and analytics, and measurements, testing, and control, throughout the oil and gas industry.
The US Baker Hughes Oil Rig Count reports the number of oil and gas rigs operating in the US. The report is published every Friday at noon EST. The report details the rig count based on location, i.e., the number of rigs operational on land, inland waters, and offshore. It also contains a section on “US Breakout Information,” which has subsections on oil, gas, and miscellaneous.
This section of the report also shows the number of directional, horizontal, or vertical rigs. Furthermore, the report also shows the ‘Major State Variances.’ A different section of the US Baker Hughes Oil Rig Count report also breaks down the Rotary oil and gas rigs operations by State and location.
Suffice to say, the US Baker Hughes Oil Rig Count report provides a comprehensive look into the oil and gas weekly operations. The report shows the rigs that are operational during the current reporting period and the change from the previous reported period. It also shows the current change from a year ago.
Using US Baker Hughes Oil Rig Count in Analysis
The US Baker Hughes Oil Rig Count can show the demand for oil and oil products. Furthermore, the report is a leading indicator of the demand for products and services offered by the oil service industry.
When the oil rig count increases, more oil rigs have become operational during the reporting period. In the labor industry, this increase has two implications – an increase in direct and indirect labor. Direct labor increases since the workers in these rigs become active. Indirect labor is in the form of workers who will provide ancillary services to the operational oil rigs. In cities where these rigs are operational, they form an integral part of the economy. Therefore, when they are operational, the economies in these regions flourish, and the unemployment levels decline.
Furthermore, the consumer discretionary sectors also expand due to an increase in household demand. Conversely, when the count reduces, it means that the oil rigs are shutting down. The consequence of this is layoffs, which eventually depresses the demand in the economy. It is essential to know that while oil production in the US is not the major employer in the labor market, the effects of massive job losses on the broader economy cannot be ignored.
The increase in the US Baker Hughes Oil Rig Count means that there is an increasing oil demand. To better understand the oil demand, we first need to understand the top consumers of oil in the economy. According to the US Energy Information Administration, the top consumers of oil in the US are; transportation 68%, industries 26%, residential 3%, commercial 2%, and electric power less than 1%. Therefore, we can safely conclude that whenever oil production increases, the increase in demand is primarily driven by transportation and industrial sectors.
Here is the implication to the economy, when oil demand by these two industries increases, demand for goods and services offered by these two sectors has also increased. In the transportation sector, whenever the demand for oil increases, it means that more people are purchasing cars. In the industrial sector, the increase in demand for oil implies an expansion in operations. An increase follows the expansion in employment opportunities and increased economic output. In both these instances, it is implied that the economy is growing.
Conversely, when the rigs are shutting down, it is usually to avoid overproduction, which might grossly distort the oil prices. This reduction in oil supply could be taken as a sign of a decrease in demand. Based on the top consumers of oil in the US, a decline in the oil demand implies that the economy is contracting.
The US Baker Hughes Oil Rig Count can also be used to show periods of economic recession and recovery. Take the example of the recent coronavirus pandemic. The pandemic resulted in nationwide lockdowns and social distancing. Virtually, transportation was halted as the majority of the population opted to work from home. Industries were shut down to depressed demand. This implied that the oil demand plummeted, which was followed by a recession of the US economy.
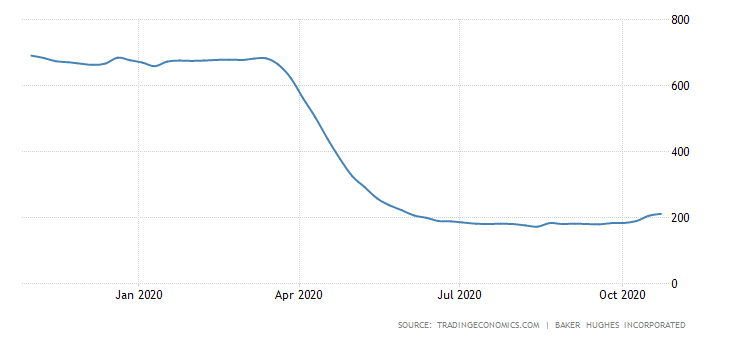
Source: Trading Economics
When the US economy started resuming some sense of normalcy, we can notice the US Baker Hughes Oil Rig Count increasing. This showed that the oil demand was picking up again, which means that transportations and industrial sectors were upping their operations.
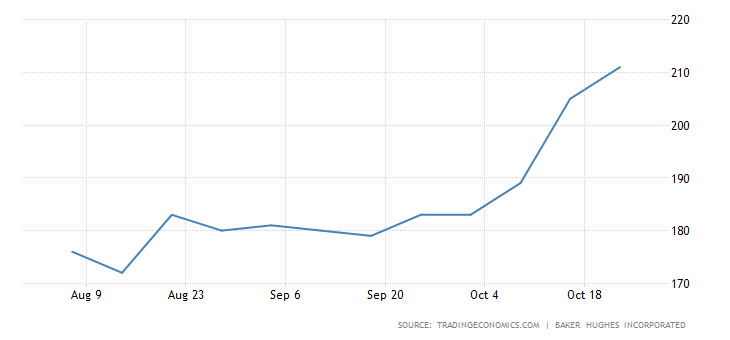
Source: Trading Economics
Impact of US Baker Hughes Oil Rig Count on the USD
The value of a country’s currency depends on the fundamentals of its economy. Since the US Baker Hughes Oil Rig Count can be used as a leading indicator of the US economy, the change in the count impacts the USD.
Theoretically, an increase in the US Baker Hughes Oil Rig Count should be accompanied by an appreciating USD. The increasing count signifies that the US economy is expanding. Conversely, a decline in the count means that the US economy is contracting; hence the USD should be expected to depreciate.
Sources of Data
Baker Hughes publishes the US Baker Hughes Oil Rig Count report at the end of every working week. Trading Economics has a historical time series data of the US Baker Hughes Oil Rig Count.
How US Baker Hughes Oil Rig Count Release Affects The Forex Price Charts
The most recent publication was on October 23, 2020, at 1.00 PM EST and accessed at Investing.com. The USD is expected to experience moderate volatility when this report is published.

In the week to October 23, 2020, the number of oil rigs operating in the US was 211, increasing from 205 a week earlier.

Let’s find out how this increase impacted the USD.
GBP/USD: Before US Baker Hughes Oil Rig Count Release on October 23, 2020,
just before 1.00 PM EST
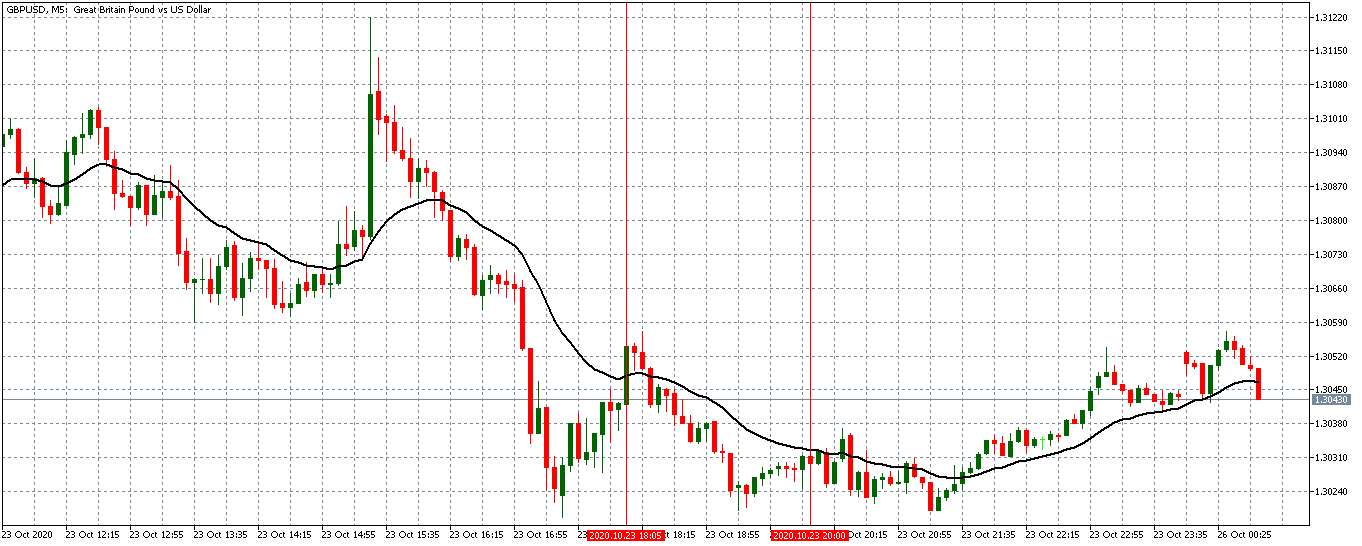
Before the release of the US Baker Hughes Oil Rig Count, the GBP/USD pair was trading in a weak downtrend. From the above 5-minute chart, we can observe that the 20-period MA was only slightly dropping.
GBP/USD: After US Baker Hughes Oil Rig Count Release on October 23, 2020,
at 1.00 PM EST
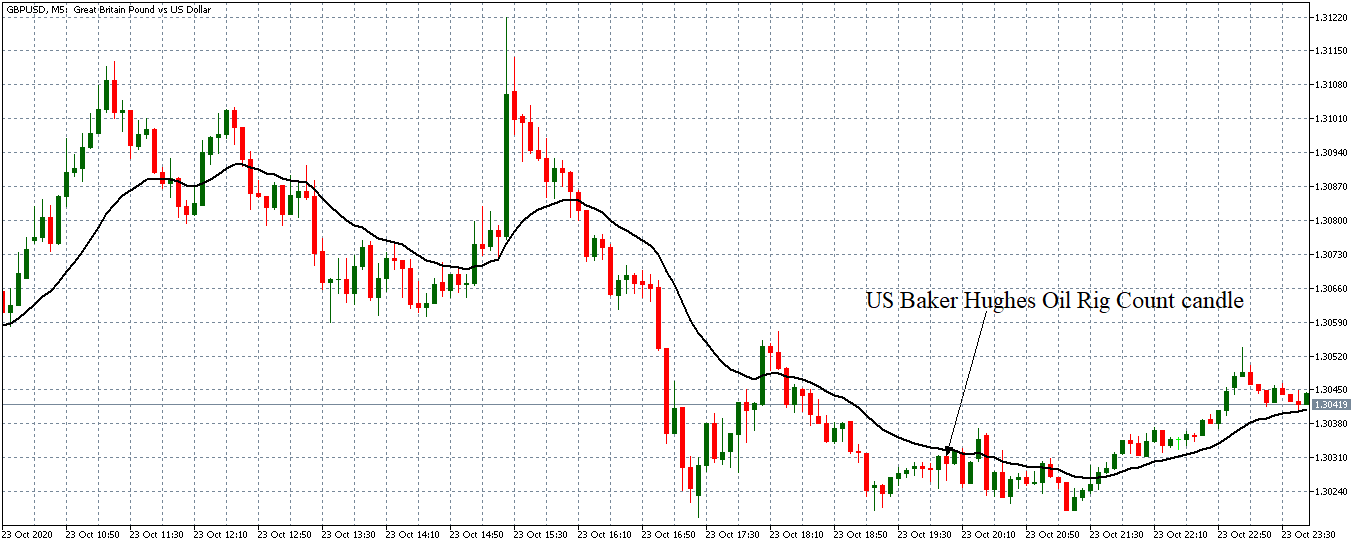
After the release, the pair formed a 5-minute bearish “hammer” candle. Subsequently, the pair traded in a weaker downtrend as the 20-period MA was flattening with candles forming just around it.
Bottom Line
The US Baker Hughes Oil Rig Count plays a vital role as a leading indicator of the demand for oil and oil products. As shown by the above analyses, the US Baker Hughes Oil Rig Count doesn’t significantly impact the Forex price action.