
How to take some risk out of currency trading – Beginners
Thank you for joining this Forex academy educational video.
One of the challenges for new traders, especially in the forex market, is the sheer volatility concerned with the most popular currency pairs, which typically tend to be the major pairs.
Very briefly, these are currencies such as the British pound, the Australian and New Zealand dollar, the euro, the Swiss franc, the Canadian dollar, and the Japanese yen, which are all traded against the United States dollar and commonly known as the major currency pairs. These currencies are associated with the biggest economies in the world and are the most widely traded in terms of volume, and this factor means that quite often you will see extreme volatility in the pairs, and this is where new traders find it difficult to get in and out of a trade successfully.
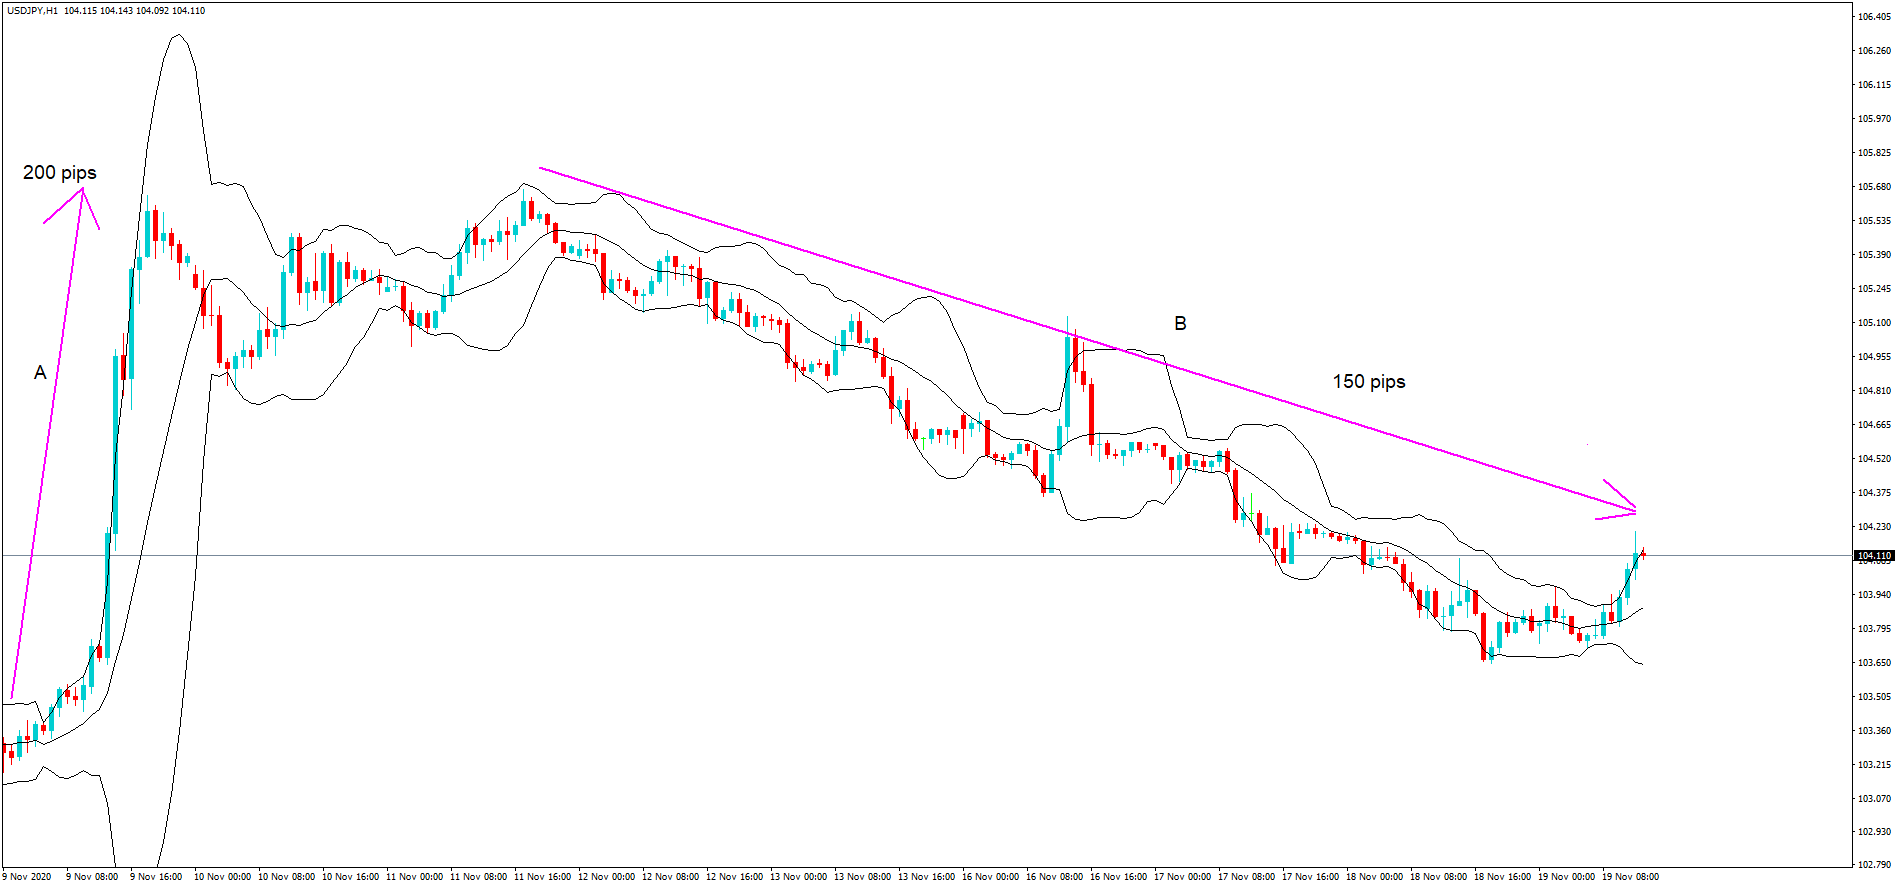
This is a 1-hour chart of one of the major pairs, the USD Japanese yen. We have highlighted two significant moves, one was a bullish breakout at position A of 200 pips, and the other relating to the overall move covered by the arrow at position B, was a bearish trend lower of 150 pips, thus giving back most of the previous move.
The issue here for new traders is that the move at position A was associated with a risk reversal event pertaining to covid vaccine developments, and the subsequent move at position B was the Japanese yen being bought because of its safe-haven status. This makes this currency pair difficult to trade and subject to volatility. These volatile moves can be large, as we can see, and happen without warning. These types of moves are usually detrimental to new traders.
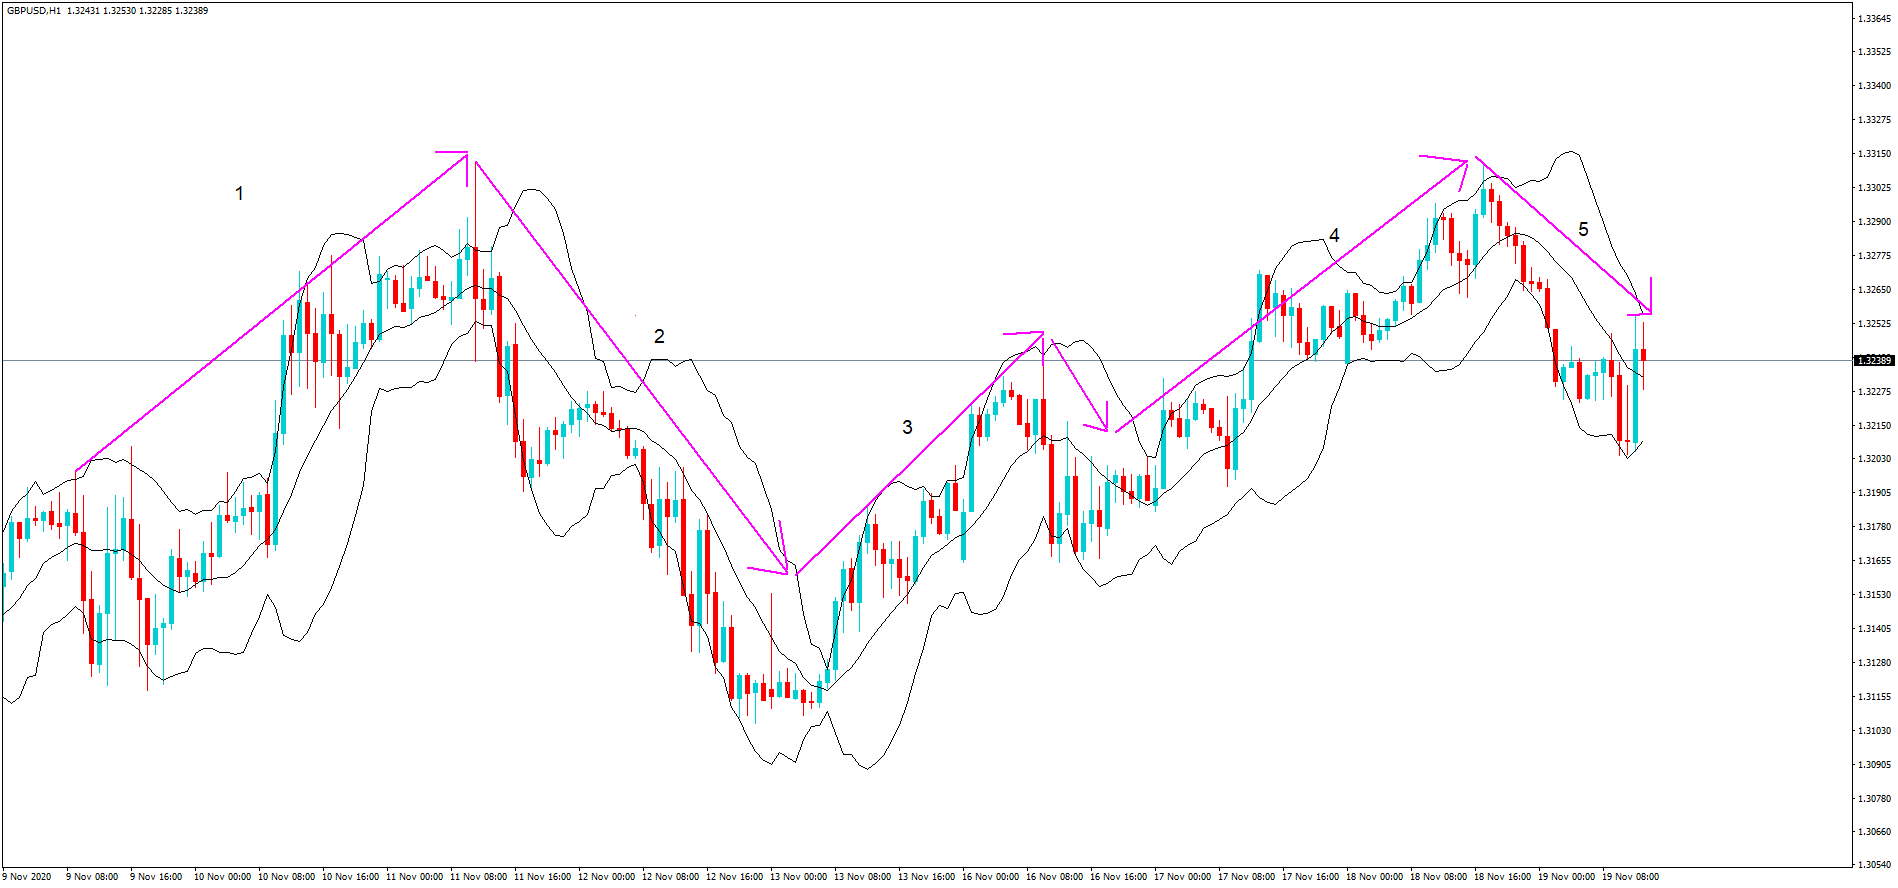
Here is a one hour chart of the British pound and US dollar over a 10 day trading period. The moves on the chart have been subject to rumours and speculation with regard to the ongoing future trade negotiation between the United Kingdom and the European Union. The tunes have been trying to best position themselves regarding any potential outcome that those negotiations might have and where they are currently at a critical stage with time running out.
The total amount of moves in pips from the five trends, as shown in the diagram, equals 700 pips. This is an extreme amount of volatility, and where price action can change unexpectedly, often after unscheduled news pertaining to the negotiations, and where rumours abound and affect the price action. This is not for the faint-hearted, and again this can catch out new traders as they try to gauge where to go long and short.
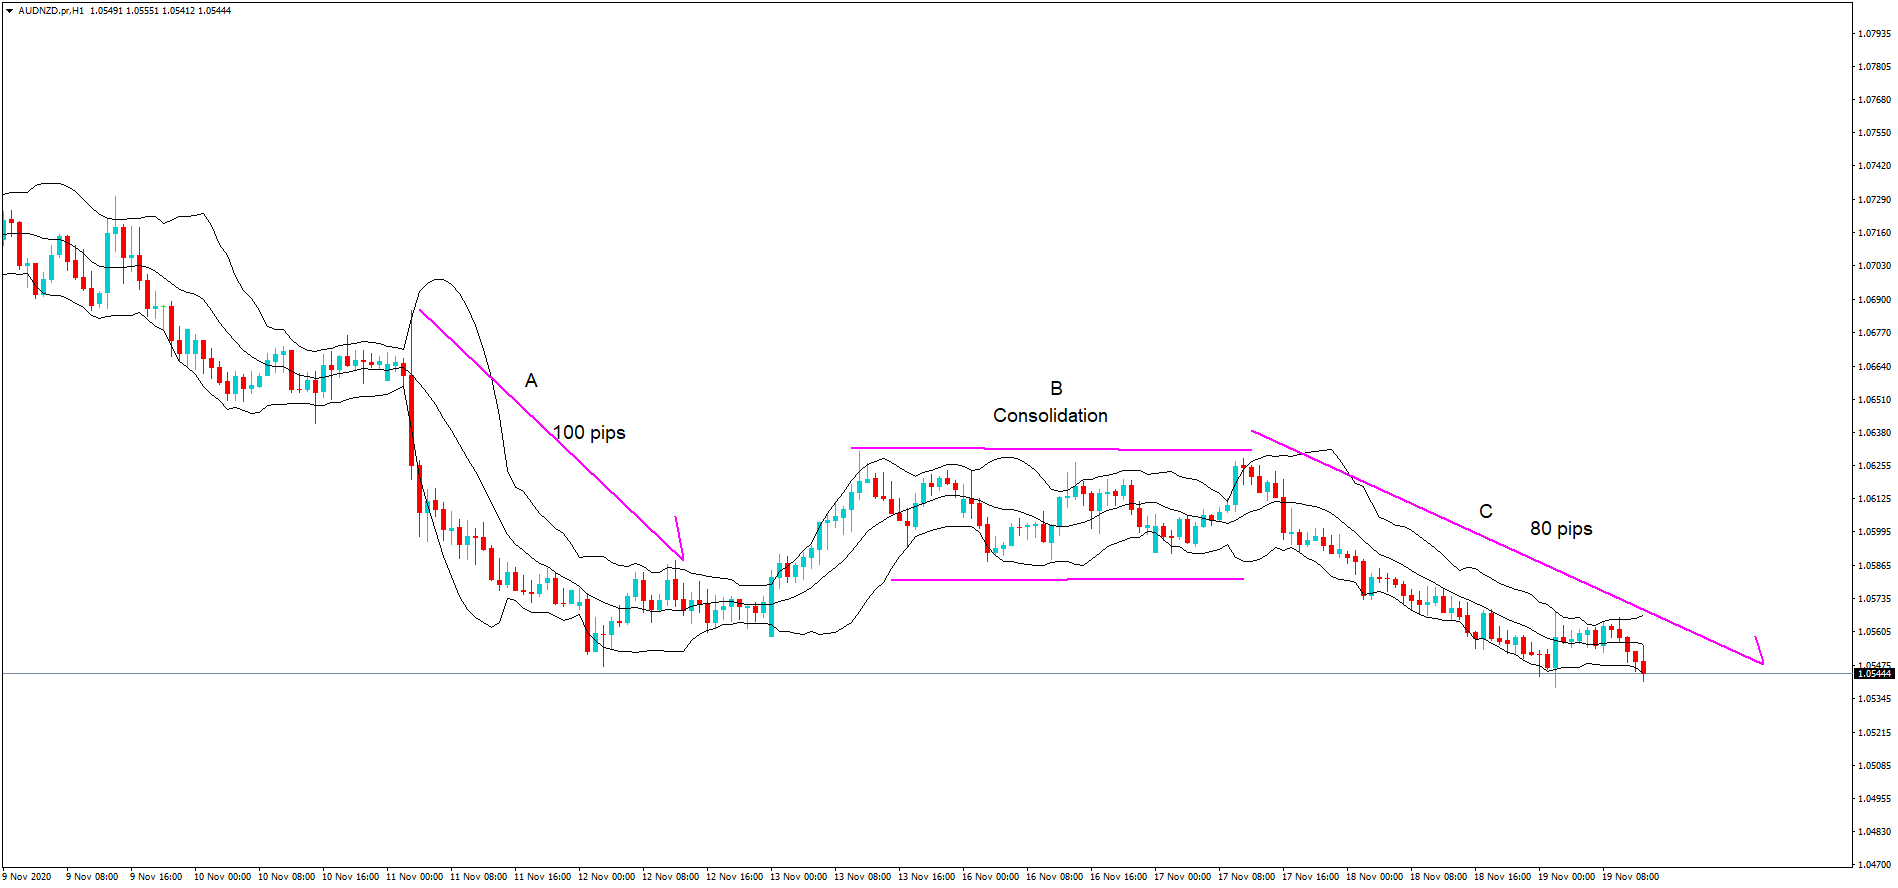
This could potentially be a solution for new traders who want to dip their toe in the water and trade currencies for the first time I’m without the risk of the major volatile currencies. This is a one-hour chance of the Australian and New Zealand dollar pair. This is not a major currency pair, yeah, because the dollar is not included, in which case it is classified as a cross-currency pair.
Because the Australian and New Zealand economies are extremely similar, and where the countries are in close proximity, and where both export largely to China, and because neither of these currencies is used as a safe-haven asset, such as the United States dollar, Japanese yen, or Swiss franc, for example, we tend to find smaller and less aggressive moves in this pair.
Here we can see one price action move to the downside at position A, gaining 100 pips, and at position B, a period of consolidation, followed by a further move lower at position C, of 80 pips. These moves are enough to make a living, yet not usually aggressive enough to catch traders out, especially during times when both countries are not active, i.e., during the European and US sessions, and where all the related economic data has been released to the market, and in times where no key policymaker speeches are due.
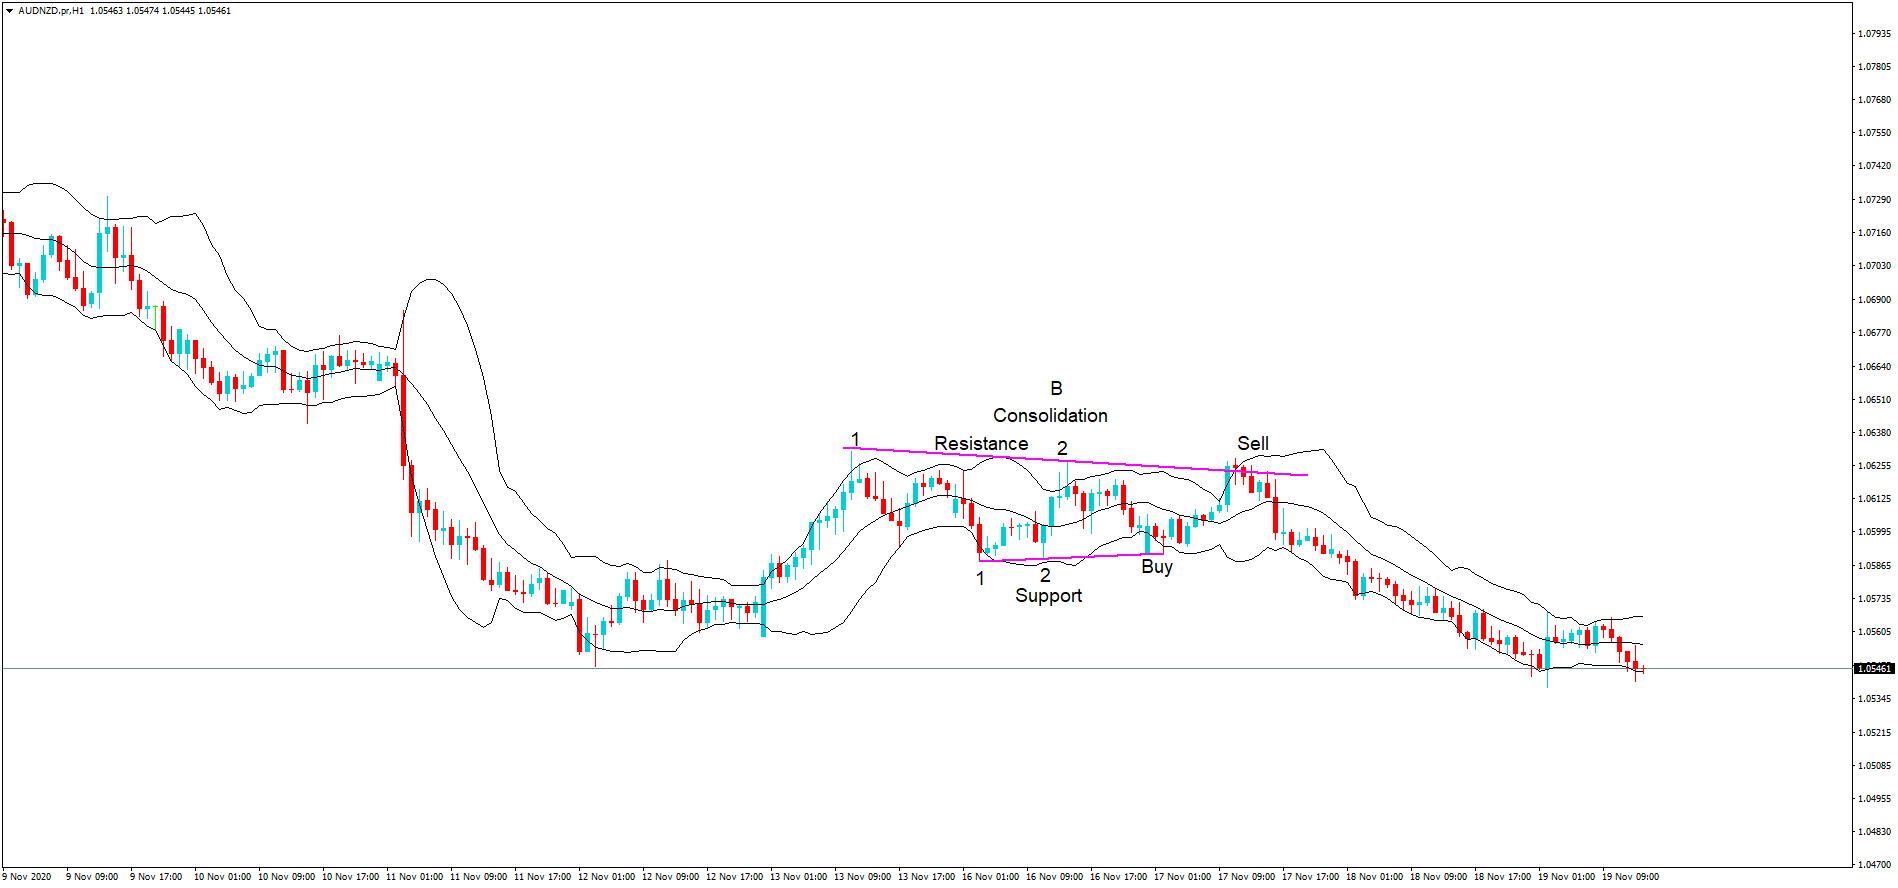
Let’s take a closer look at the consolidation period from the previous chart. We have a confirmed sideways price consolidation trend, as confirmed by two areas reversing lower from a clear line, which becomes a line of resistance, and where there are two reversals in price action from another straight line, such as shown on the chart, which becomes an area of support.
Any subsequent reversals from either the support or resistance line are good opportunities to go long or short, such as those as indicated on the chart. Incidentally, at these points, price-action has also spiked outside of the Bollinger bands, and when price action moves inside them, this is also an indication of a potential price action reversal.
In conclusion, if you are a new trader and adverse to market volatility and want to trade a less volatile pair, this will highly likely suit you.
Related posts
 Forex Trading Algorithms Part 3-Converting Trading Strategy To EA’s & Elements Of Computer Language!
 Forex For Beginners – How To Trade EURGBP! Buying The Euro With A No Brexit Trade Deal!
 No Bulls**t Guide to Forex! Why You Are Still Blowing Your Account!
 Forex Trading Algorithms Part 6 Elements Of Computer Languages For EA Design!