

Bitcoin – USD bull run collapses, what happened?
Thank you for joining this forex academy educational video.
In this session, we will be looking at the end of the most recent bull run for the BITUSD pair.
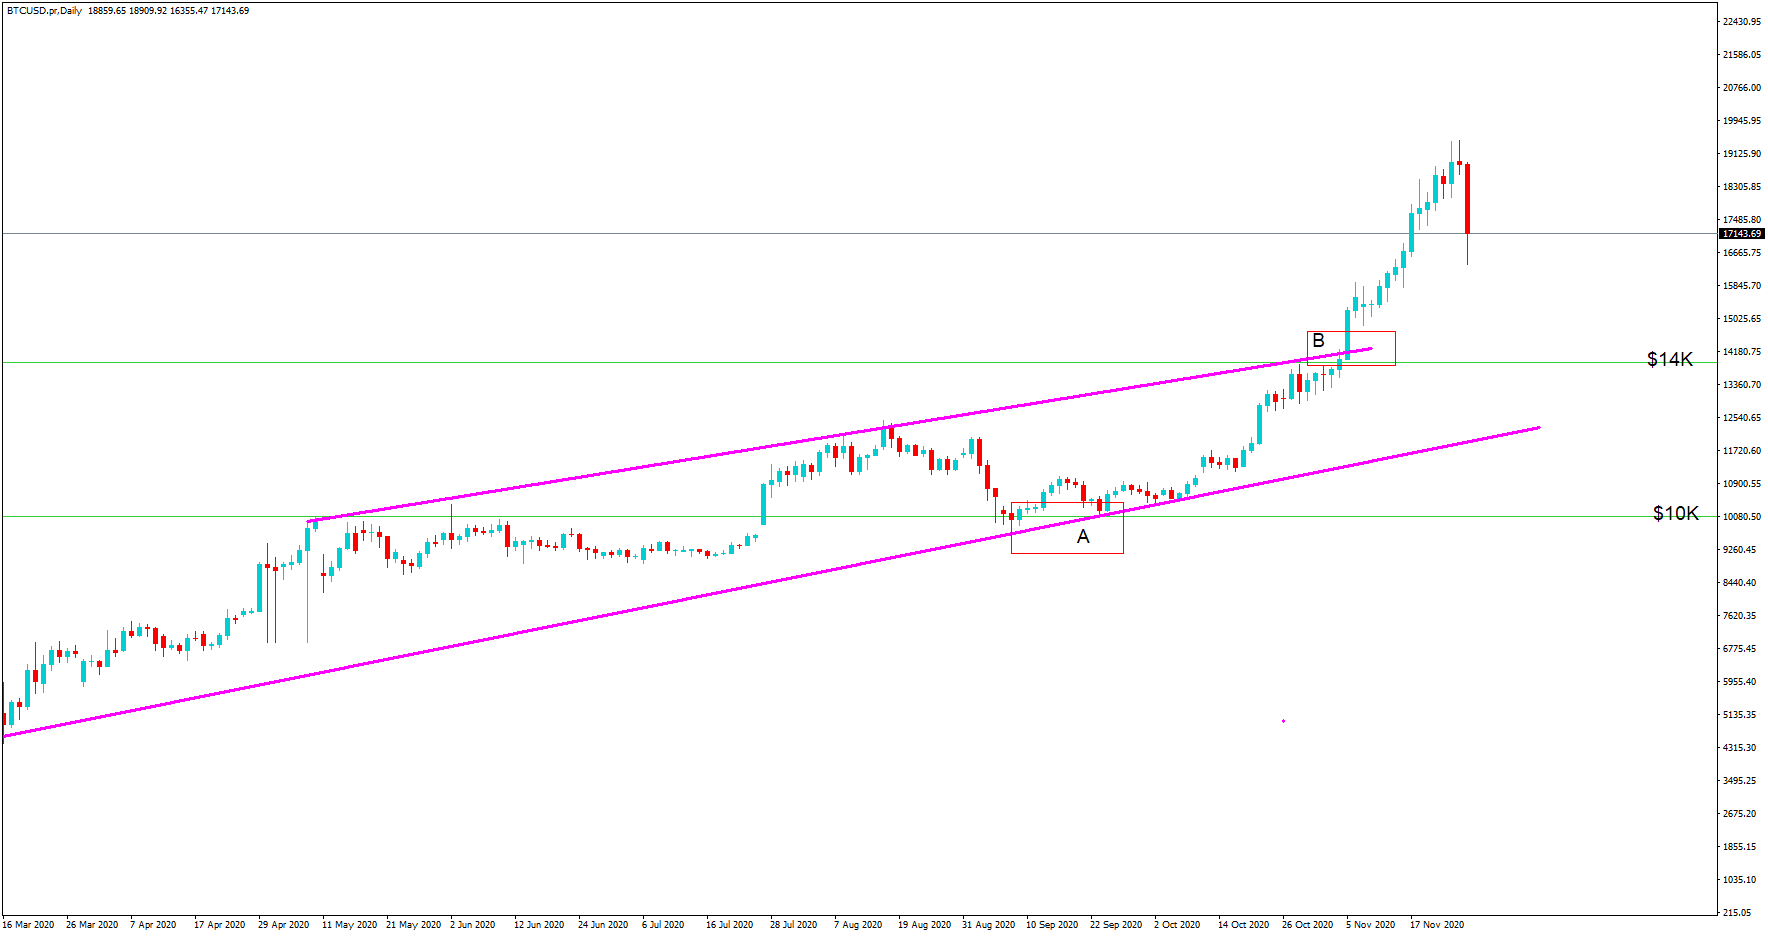
This is a daily chart for the pair. As we see here, the pair has been on a bull run and has been conforming to this upward trend line since April 2020. The price range found support at the all-important $10K level, which coincided with the support line at position A. The pair found a bid tone up to position B, where price action did not revert to the support line, preferring to fade up to the line of resistance where we see a breach above the $14 k line which coincides with the area of resistance at position B giving the pair one of the largest single-day moves to the upside for several months.
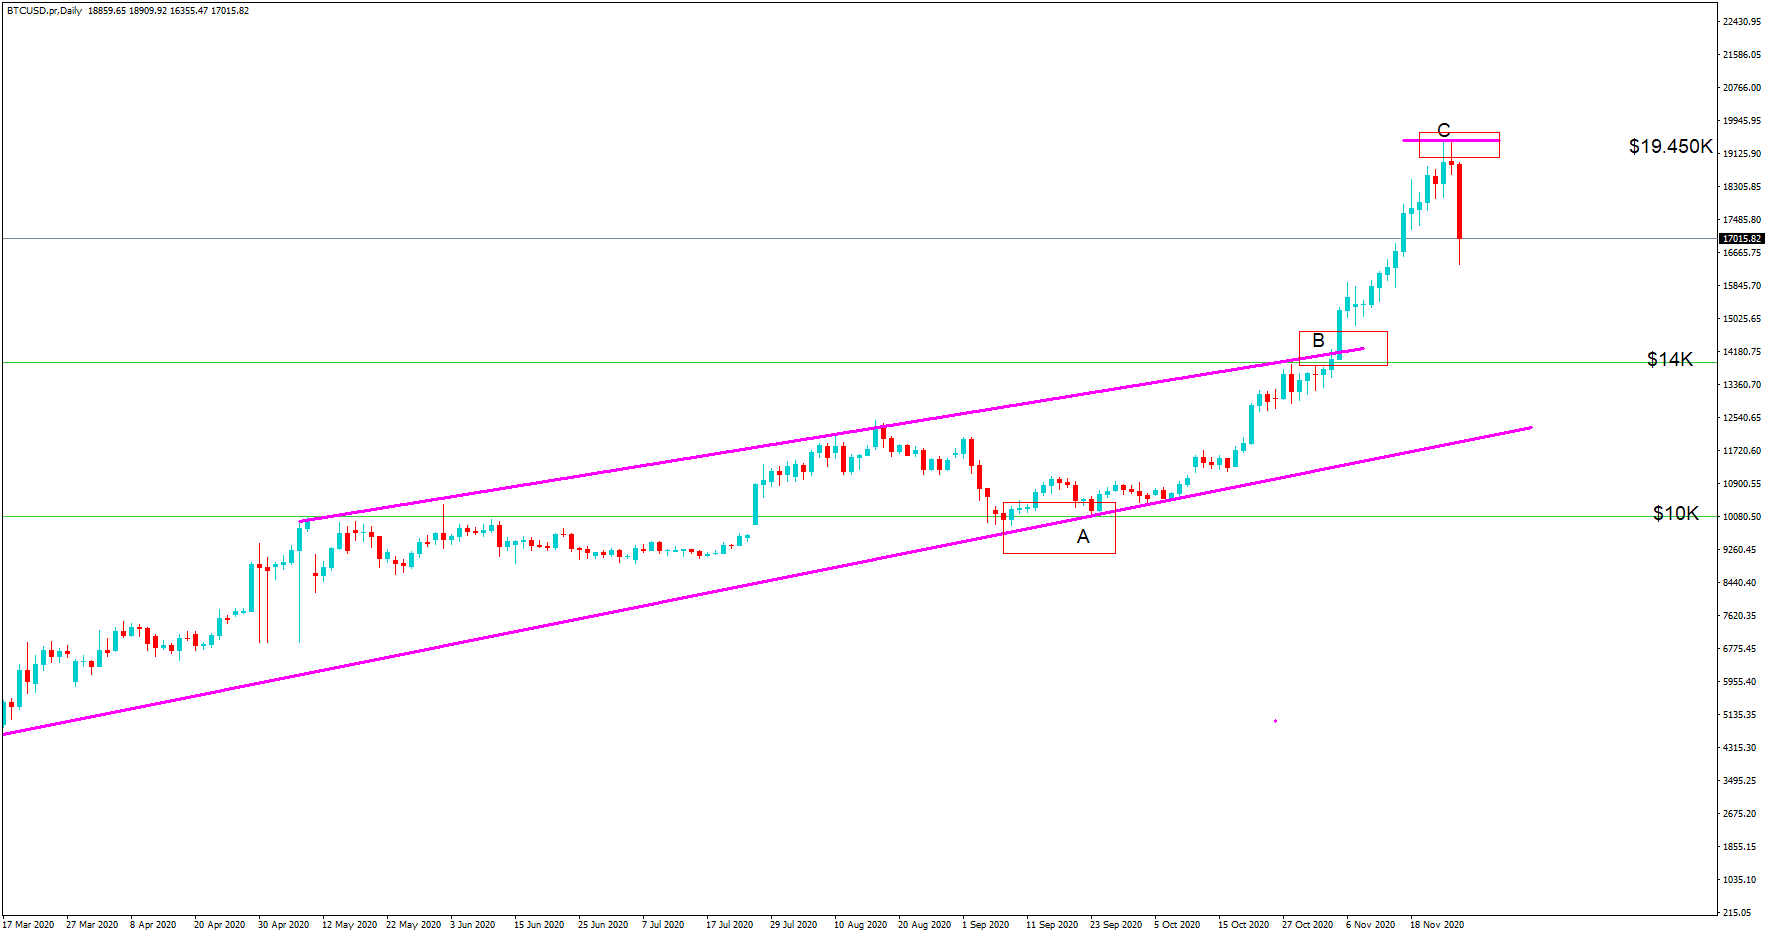
We then see an extended rally up to position C see at $19.450k before a major pullback. So, what caused this?
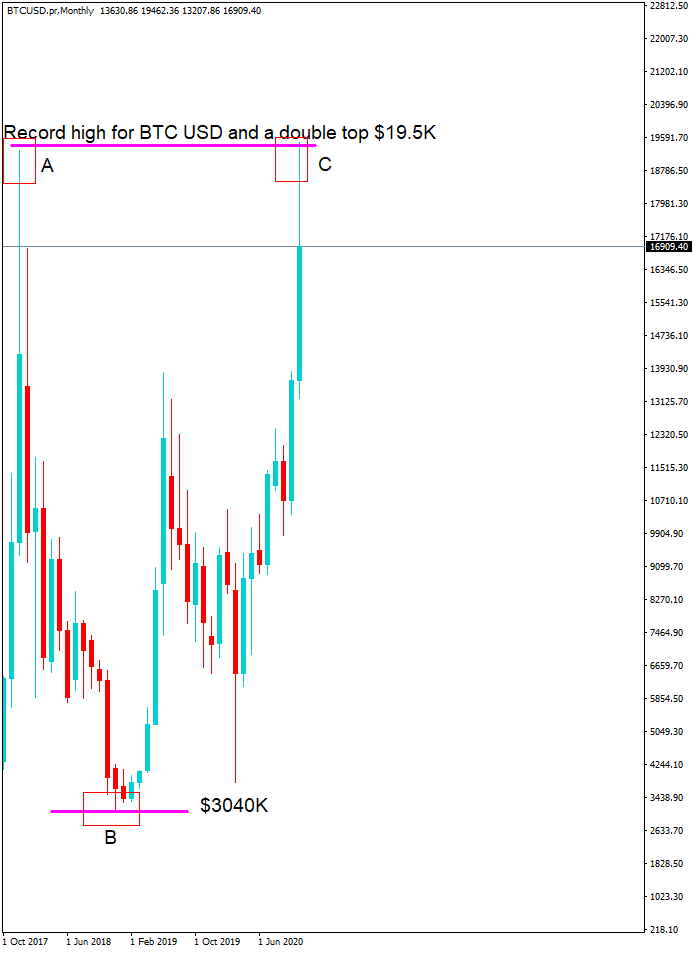
Firstly, we need to go back in time to 2017, shown here on the monthly chart, where bitcoin to the US dollar hit an all-time high hit around $19.5K, depending on the broker, shown here at position A, before crashing to $3K in the middle of 2018, at position B, and then taking 2 years to reach the $19.5K area as seen at position C. This is a double top formation, where smart money investors, saw the potential of a reversal in price action, while many traders were hoping for a continuation to $20K and beyond.
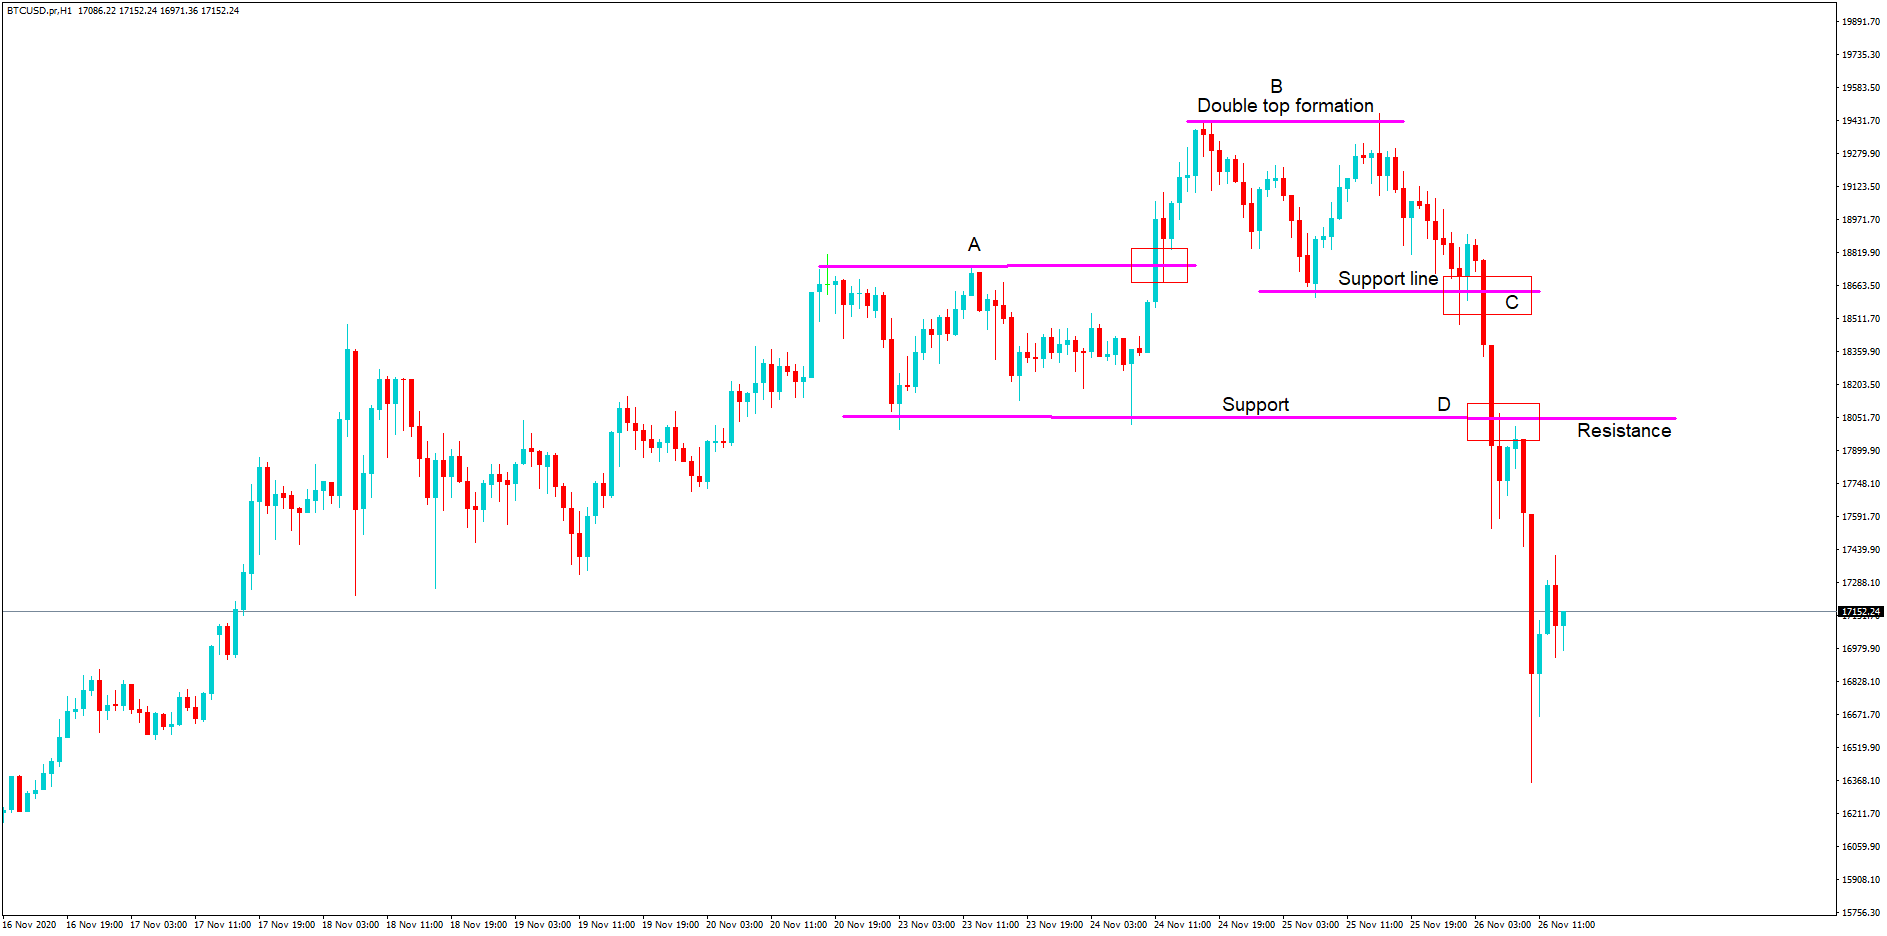
Now we need to drill down to the 1-hour chart. We have a classic area of support and resistance at position A, where the resistance line is breached to form a push up to $19.5K area, before a pullback to the support line and a second attempt to move higher, which forms a double top, and the price does not sustain the move higher and falls back to the support line at position C, before crashing lower with large candles suggesting extreme volatility through eventually punching through the support line at position D, which becomes an area of resistance, before the pair crashes to a low of $16.3K.
This move came about due to a series of important factors, including historic highs, followed by a crash, followed by another bull run, but where cautious traders would be reminded of the previous crash and were prepared to selling bitcoins and bitcoin futures, as we see on our charts, because of the nature of bitcoin which has no store value you other than the fact that it is of limited supply, and is predominantly a speculative instrument.
Thrown into the mix was the current bull run topping out just before the US Thanksgiving holiday, where traders will have decided to unwind their trades and take their profits.
Bitcoin proves again that it is a highly dangerous asset to trade. With one story of a $100 million loss in the press today, timing is critical. The main BTCUSD lost 11% in 24 hours and dragged other crypto assets lower in the panic. However, by using simple trend and support and resistance lines and dropping up and down in chart time frames, traders can gain a clear understanding of the risks and potential for turns in price action.