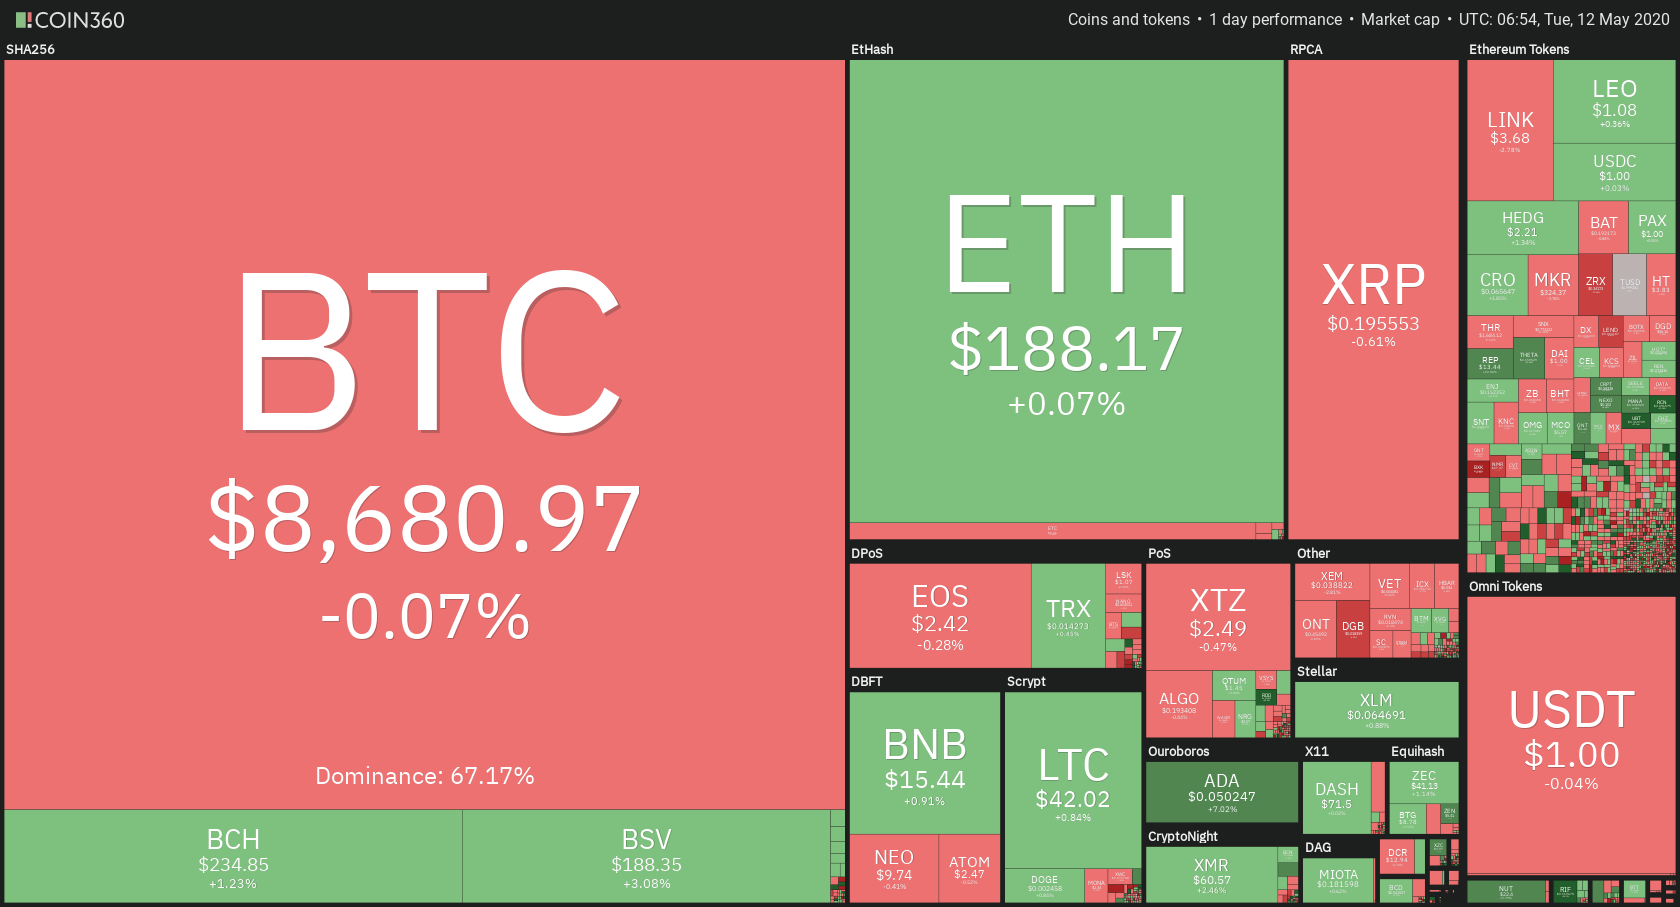
The latest economic figures from the United States raised expectations that the Federal Reserve will launch more monetary stimuli in the next meeting, and markets started to price in for a negative interest rate scenario. Donald Trump, while examining the state of Beijing amid coronavirus lockdown, warned about the US imposing new tariffs if China failed to purchase $200B worth U.S. farm goods. After that, trade delegates from both sides held a meeting via phone call and released a positive statement hence created optimism about the US-China relationship.
Economic Events to Watch Today
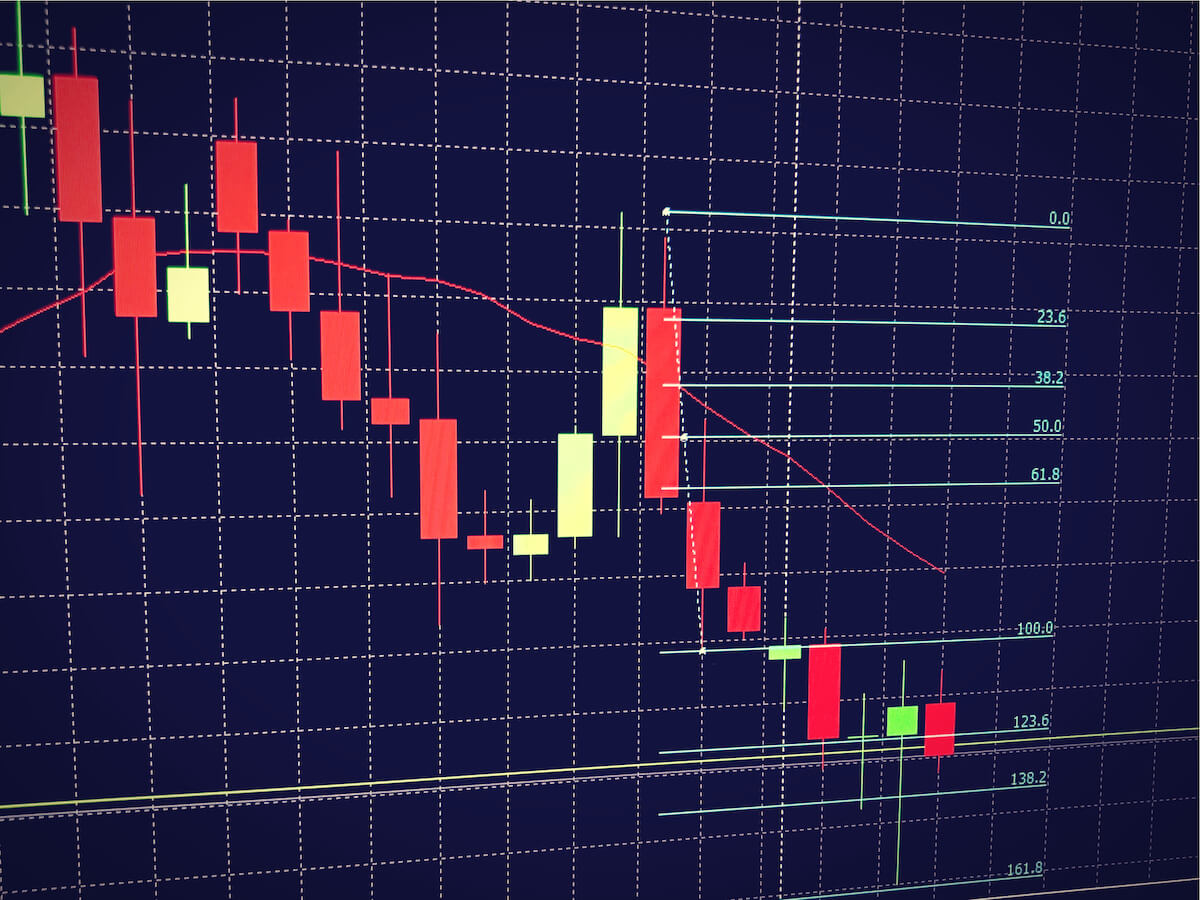
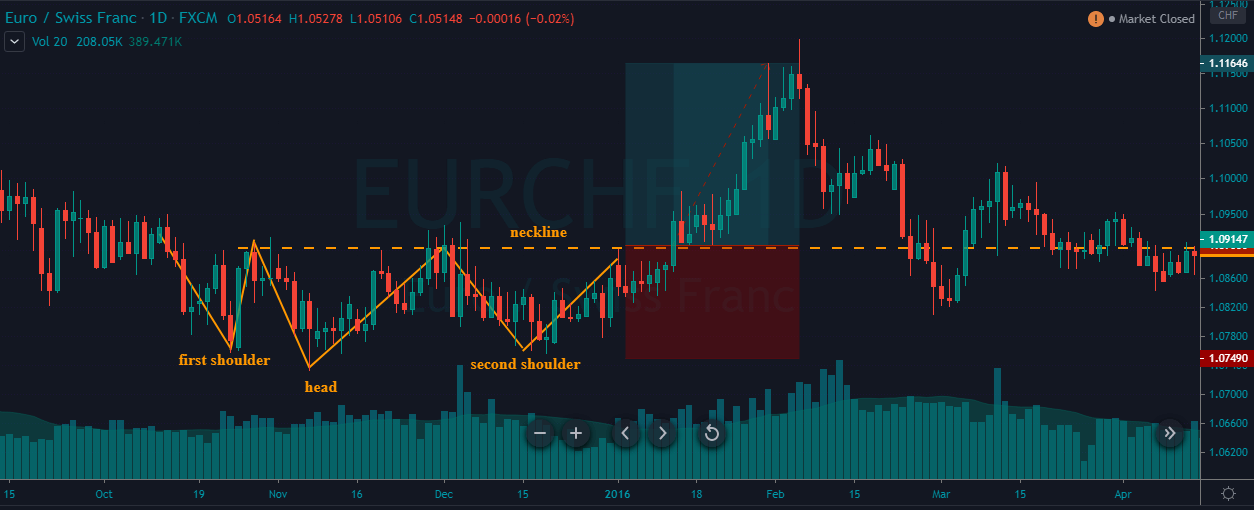
EUR/USD – Daily Analysis
The EUR/USD currency pair remained directionless around the 1.0850 as investors found on the waiting track and cautious about placing any strong position ahead of the Federal Reserve Chairman Jerome Powell’s speech on economic issues. The broad-based U.S. dollar flashing green and likely turned out to be one of the key factors that kept a lid on any gains in the pair, at least for now. As of writing, the EUR/USD currency pair is currently trading at 1.0850 and consolidates in the range between the 1.0843 – 1.0858.
As we all well aware that the investors expected the interest rate would be negative in June 2021. Whereas, the rate options market was putting in a 23% chance of the key federal funds rate falling below zero by end-December, As well as, the U.S. President Donald Trump also urged by the tweet that the negatives rate cuts would be considered good for the U.S.
On Wednesday, the European Commission will also recommend a phased approach to reopen borders with countries that have similar coronavirus risk profiles for tourists. Travel between similar risk profile countries will be recommended in the COVID-19 recovery plan.
The E.U. Foreign policy chief, Josep Borrell, said on Tuesday that coronavirus pandemic will likely deteriorate the security environment in years ahead and that countries should not slash their defensive spending in their budgets. He stressed the importance of security and defense funding in the challenging environment of a pandemic.
Meanwhile, due to the easing of lockdowns from countries across the globe, the new coronavirus cases were started being reported from many countries, including China, South Korea, and Germany. This weighed on markets as chances for second-wave of coronavirus could hurt the hopes of quick economic recovery. There was no economic data to be released from the European side, so the movement of pair EUR/USD followed the directions from U.S. dollar and market news.
Daily Support and Resistance
- R3 1.0995
- R2 1.094
- R1 1.0894
Pivot Point 1.0839
- S1 1.0793
- S2 1.0738
- S3 1.0691
EUR/USD– Trading Tips
The EUR/USD price dropped after testing the double top resistance level of 1.08770. The market is a bit slow today, which is why, the EUR/USD prices are consolidating above 1.0826, which is working as support that’s been extended by the 50 EMA. The bearish breakout of 1.0826 level can extend the selling trend until the next support level of 1.0777, while bullish breakout of 1.0850 can lead EUR/USD prices towards 61.8% Fibonacci retracement level of 1.0869 level. Consider taking selling trades below 1.0839 and buying above the same today.
GBP/USD – Daily Analysis
The GBP/USD currency pair stops its 2-day losing streak and hovering near the late-April low 1.2250 as traders are cautious to place any strong position ahead of critical U.K. macro releases. As we mentioned, the market participants are waiting for the key data while staying near April low, a continued break of a bullish sloping trend line from April 06 keeps sellers hopeful of targeting April month low near 1.2165 beneath 1.2250. At the press time, the GBP/USD currency pair is currently trading at 1.2271 and consolidates in the range between the 1.2251 – 1.2284.
At the data front, the U.K.’s heavy economic calendar is going to control the markets moves at 06:00 GMT with the first quarter (Q1) GDP figures for 2020. As well as, the March month Trade Balance and Industrial Production detail will also decorate the economic calendar.
According to the forecasted view about GDP, the United Kingdom GDP is expected to reach -8.0% MoM in March against -0.1% prior while the Index of Services (3M/3M) in the same timeframe is seen higher from 0.2% to 0.30%.
Broadbent said that risks were still to the downside and committee would do whatever will be necessary to recover.
Meanwhile, the Brexit talks were on board, and a little progress was made in the future fisheries agreement between E.U. & U.K. According to the MEP for CDU, it was only because of France and Netherland that U.K. was set to come to an agreement with E.U. on fisheries. U.K. did not want fisheries to be a part of economic agreement but number of member states including France & Netherland made very clear that they will not agree on any future economic partnership without long-term solution on fisheries.
Pound dropped on slow progress of post-Brexit deal with the E.U. and increased fears of second wave of coronavirus. However, The GDP data from U.K. will remain under high focus for GBP Traders on Wednesday.
Daily Support and Resistance
- R3 1.2577
- R2 1.2508
- R1 1.2422
Pivot Point 1.2353
- S1 1.2268
- S2 1.2198
- S3 1.2113
GBP/USD– Trading Tip
The GBP/USD sideways trading continues in between a narrow trading range of 1.2320 – 1.2245. The Cable is still holding below 50 EMA, which is extending resistance around 1.2370 level today. On the 4 hour chart, the GBP/USD is gaining support at 1.2285 level while the 50 EMA and horizontal resistance stay at 1.2365 level. Today, the Fed chair Powel speech may drive the selling trend in the GBP/USD pair to lead its prices towards an immediate support level of 1.2240 and 1.2190. Conversely, the worse than expected retail sales data will lead the GBP/USD pair towards 1.2360 and 1.2450.
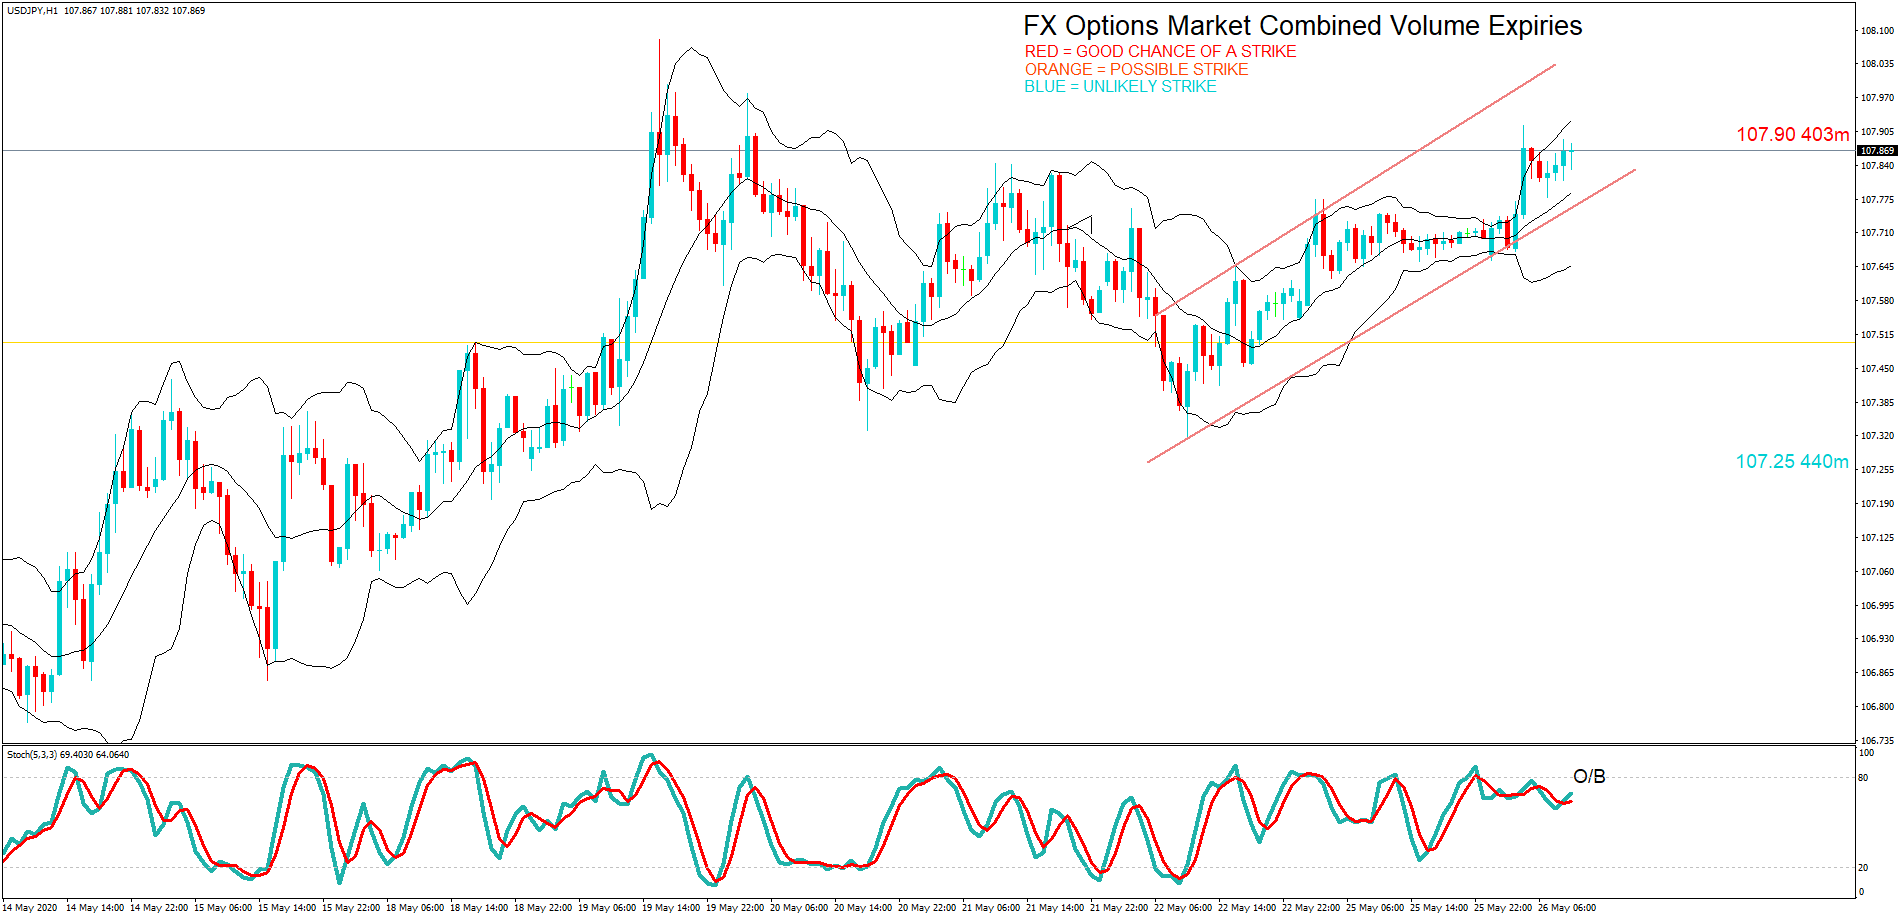
USD/JPY – Daily Analysis
The USD/JPY was closed at 107.147 after placing a high of 107.691 and a low of 107.120. Overall the movement of USD/JPY pair remained bearish throughout the day. The pair USD/JPY lost its previous day gains but managed to remain above the 107 territory on Tuesday. On the back of broad-based U.S. dollar weakness, the pair USD/JPY dropped about 0.5% on that day.
U.S. dollar was weak due to the poor than expected CPI data in the month of April. The U.S. Consumer Price Index fell and posted its biggest monthly decline since the 2008-2009 recession. The CPI dropped by -0.8% against the expected decline by -0.7% and weighed on U.S. dollar. The Core CPI dropped by -0.4% against the forecasted -0.2%.
Moreover, the tensions between China and the U.S. have increased the fears of renewed trade-war. There were reports suggesting that Chinese Officials revive the possibility of revoking the signed trade deal and negotiate a new deal which will tilt more to the Chinese side.
U.S. President, Donald Trump was asked about this possibility and in response to whether he would renegotiate a deal with China, he said, “No, not at all. Not even a little bit.” He was not interested in renegotiate the deal. He said that he also had heard about it that China wanted to reopen the trade talks to make it better deal for them but a deal has already been signed and he would not cancel it.
Apart from China-US trade war, another trade-war fears are emerging in the market between Australia and China. The announced duties on Aussie meat by China is being considered as a safe play against the action of Australian PM to favor the inquiry of China’s role in the origin of the virus.
All these renewed trade-war fears along with coronavirus pandemic have increased the risk in the market. The virus cases in Germany increased, and the Wuhan city in China reported fresh rise in number of coronavirus cases after easing of lockdown.
Furthermore, an ex-member of White House Coronavirus Task Force Team, Doctor Anthony Fauci warned that gradual restart of economy was dangerous because it could cause needless suffering and would slow down the economic recovery.
Additionally, the officials from Bank of Japan also cited negative impact of virus on Asian economy and stated the importance of acting quickly by central banks when needed. At 10:00 GMT, the Leading Indicators of economy from Bank of Japan came less than the expected 84.3% as 83.8% and weighed on JPY.
Daily Support and Resistance
- R3 109.37
- R2 108.57
- R1 108.12
Pivot Point 107.33
- S1 106.88
- S2 106.09
- S3 105.64
USD/JPY – Trading Tips
The USD/JPY pair is gaining support at 107 level which marks the 50% Fibonacci retracement level. At the same level, the 50 EMA is supporting the pair and it could drive a bounce off above 107 level. At the moment, the 4-hour candle seems to close above 107 support, but it’s not sufficient to go long on USD/JPY. We need to wait for couple of more candles to give us closing above this level.
The MACDis holding in selling , which is supporting the bearish trend in the USD/JPY pair. The violation of an immediate support level may extend selling until 106.600 level. Conversely, the closing of buying candles above 107 can trigger bullish bias until 107.50. By the way, bearish bias seems solid today. All the best for today!


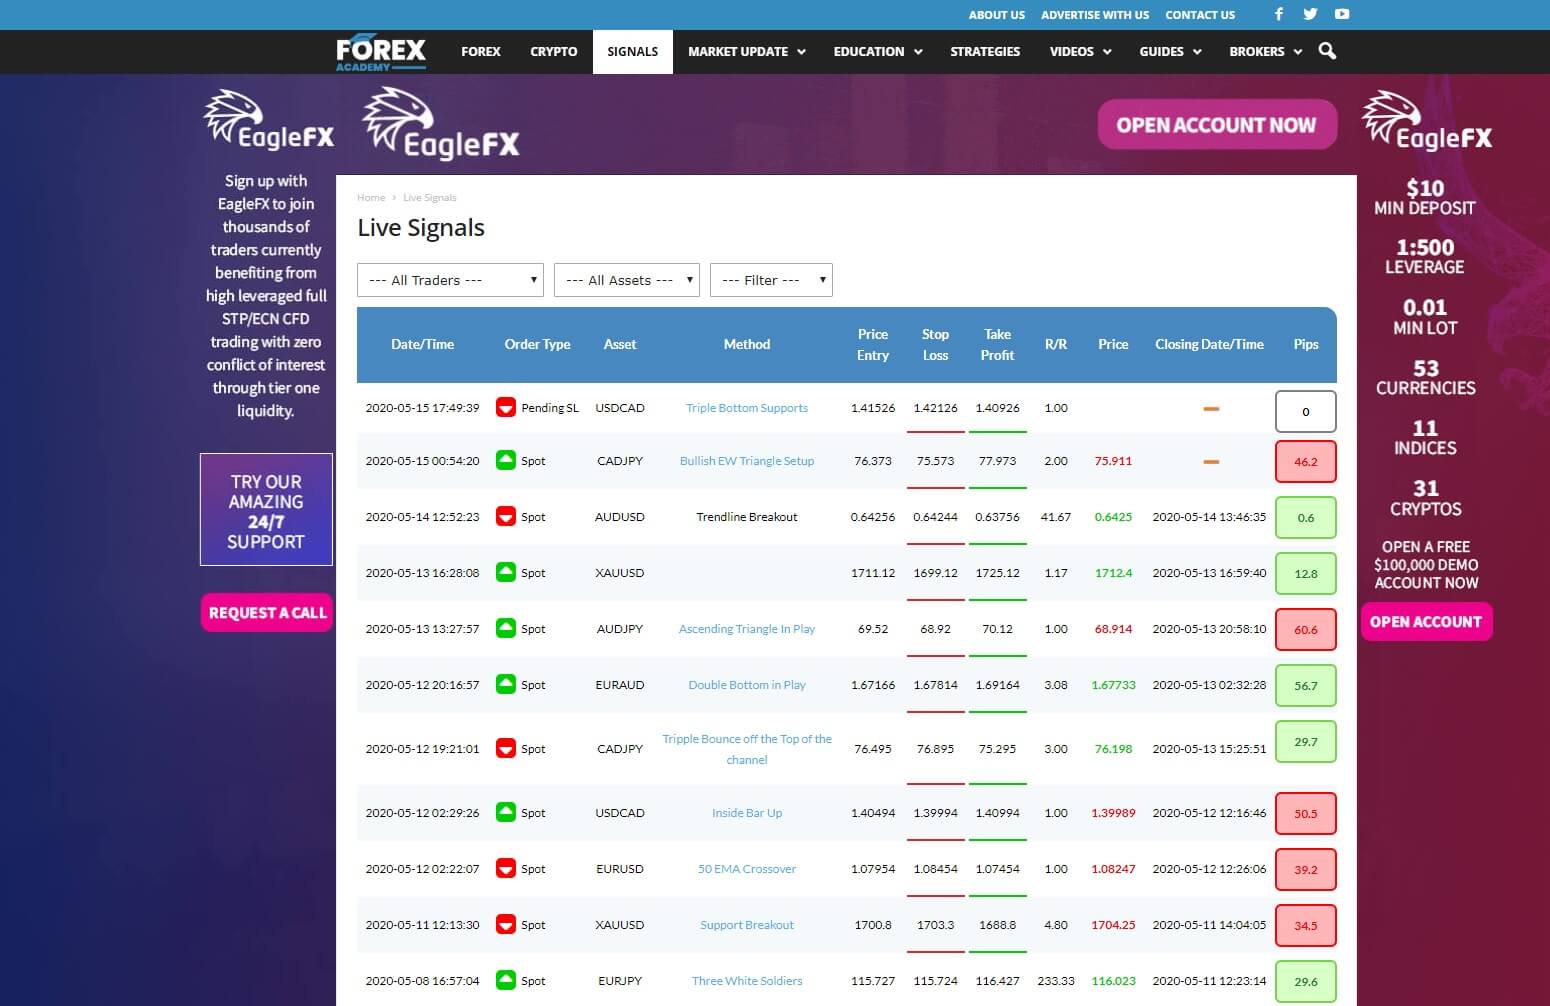
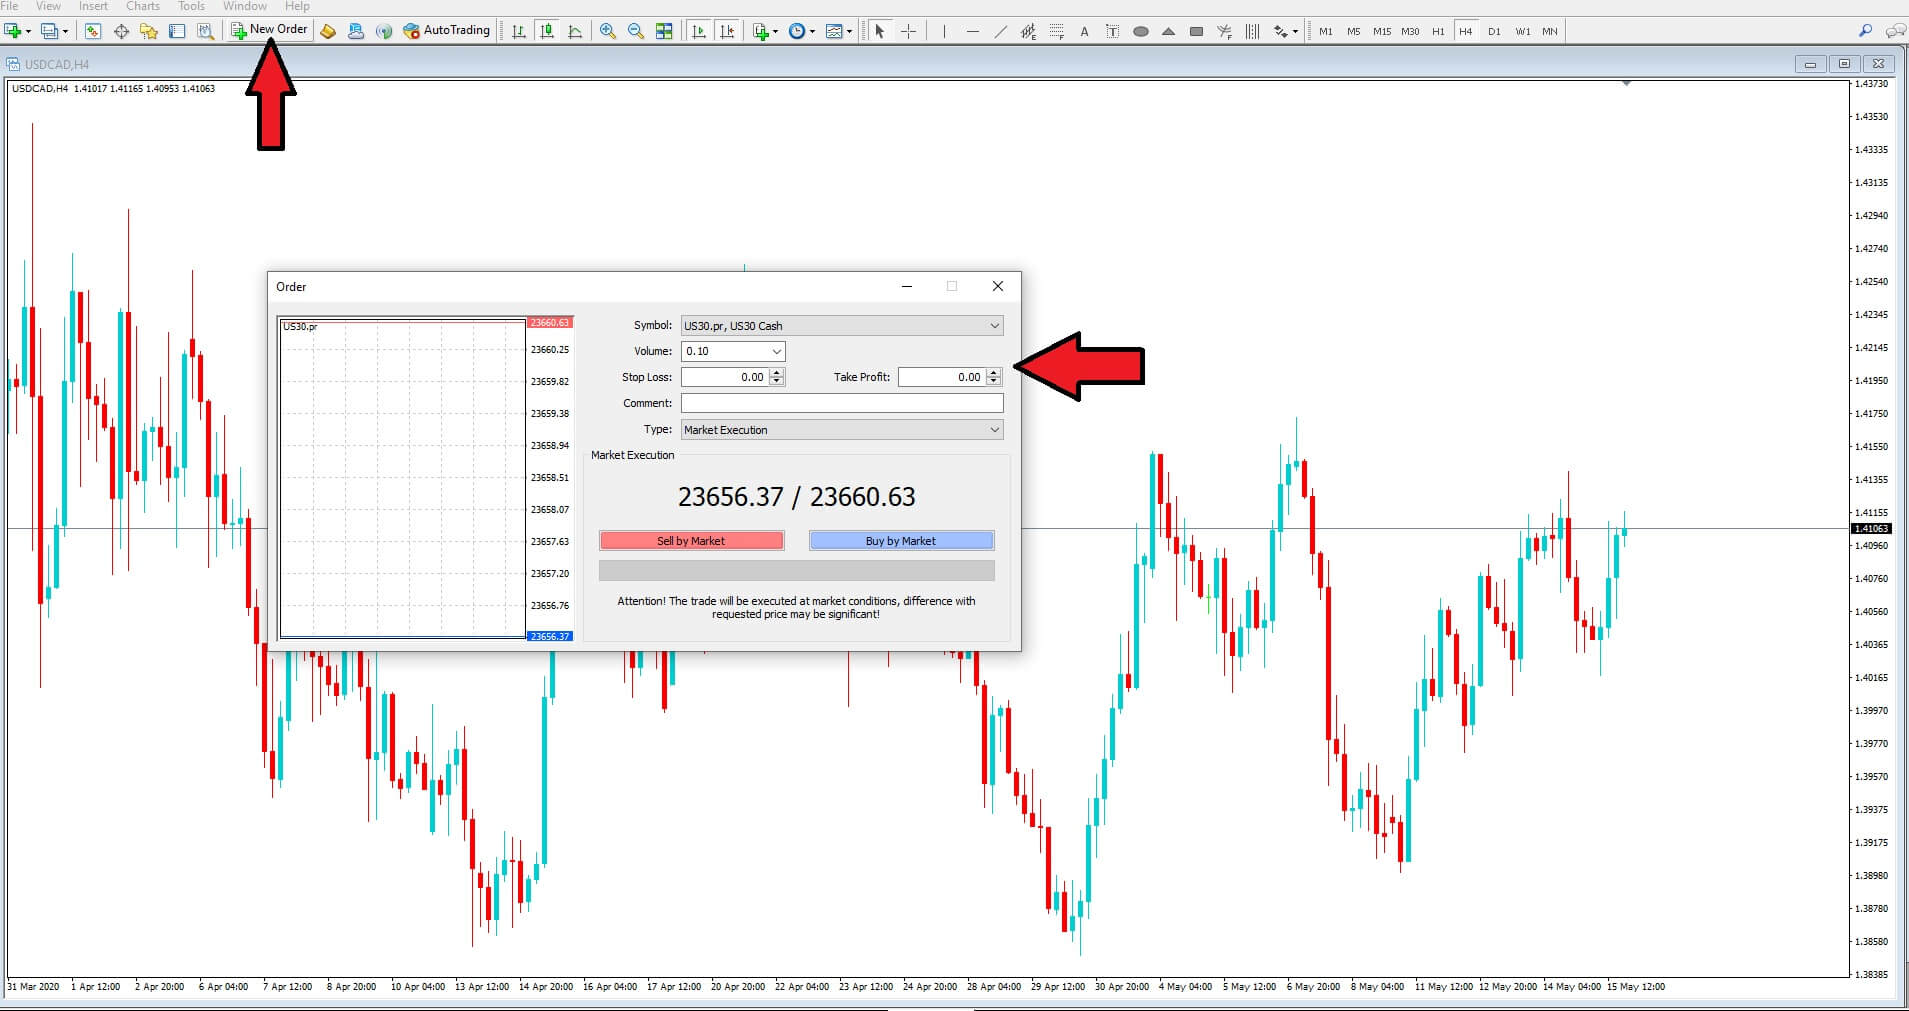
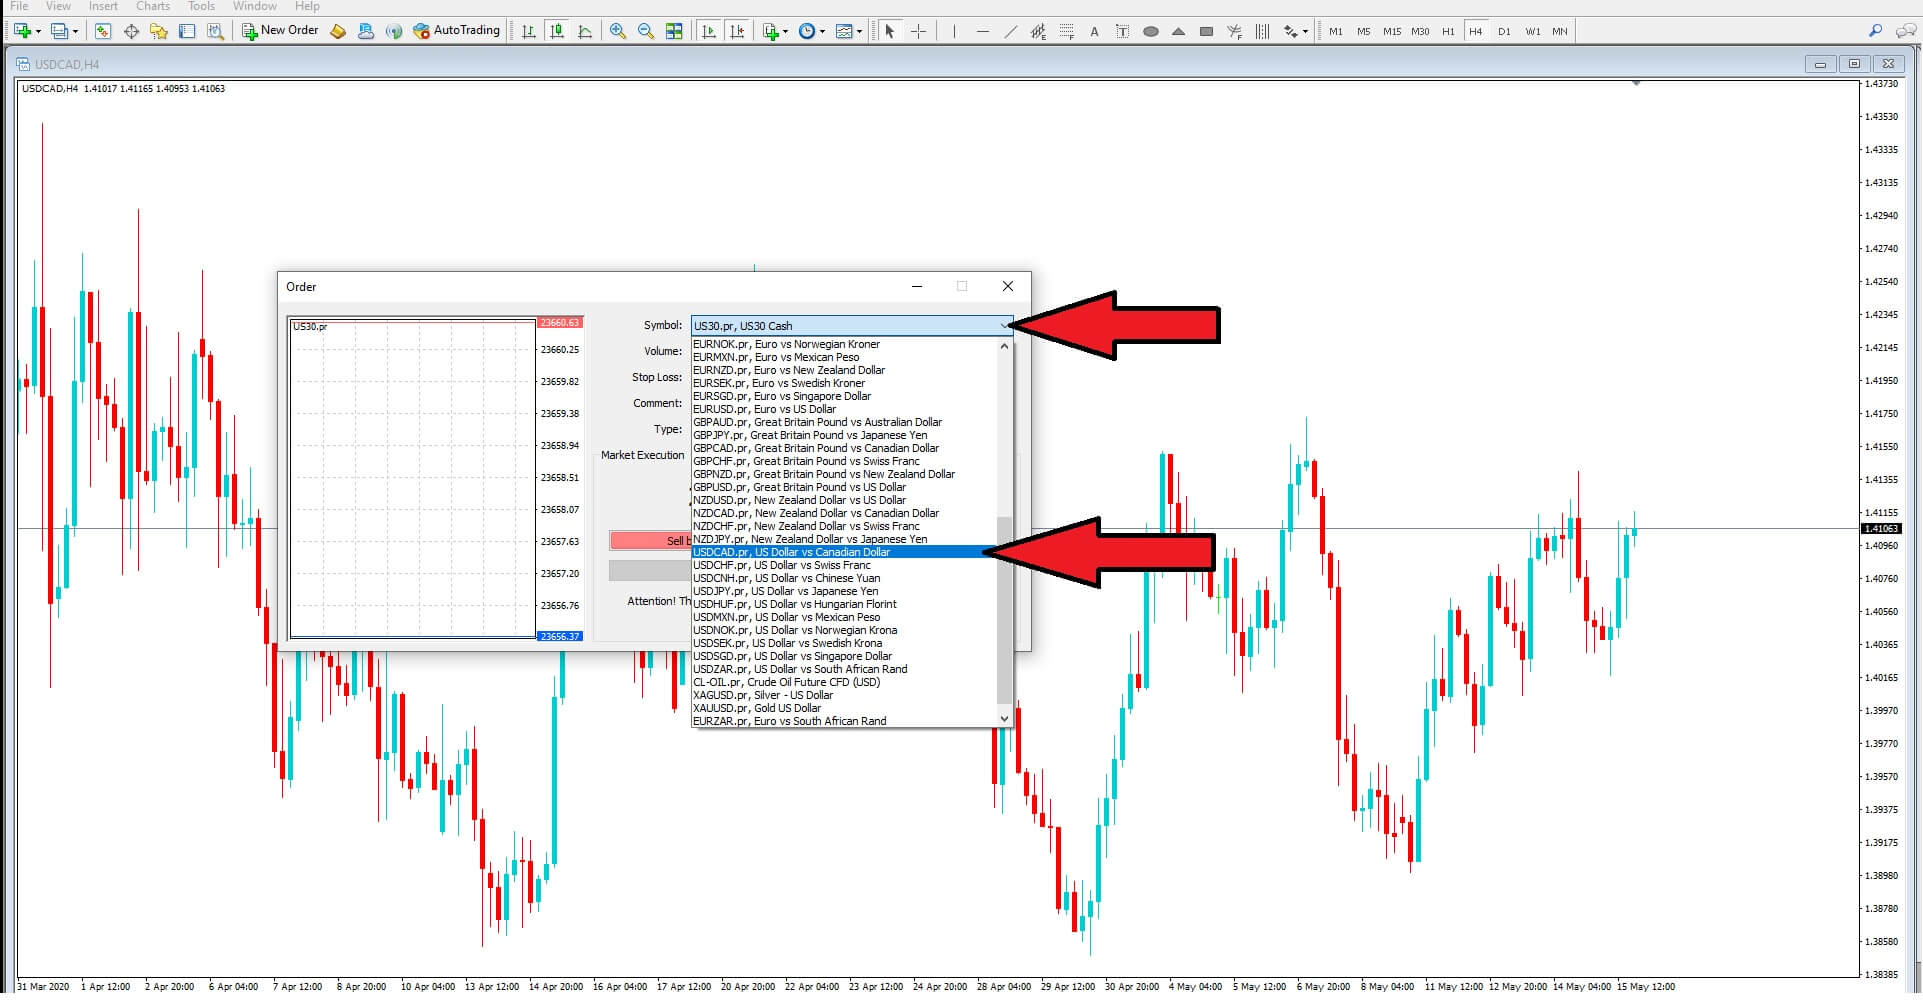
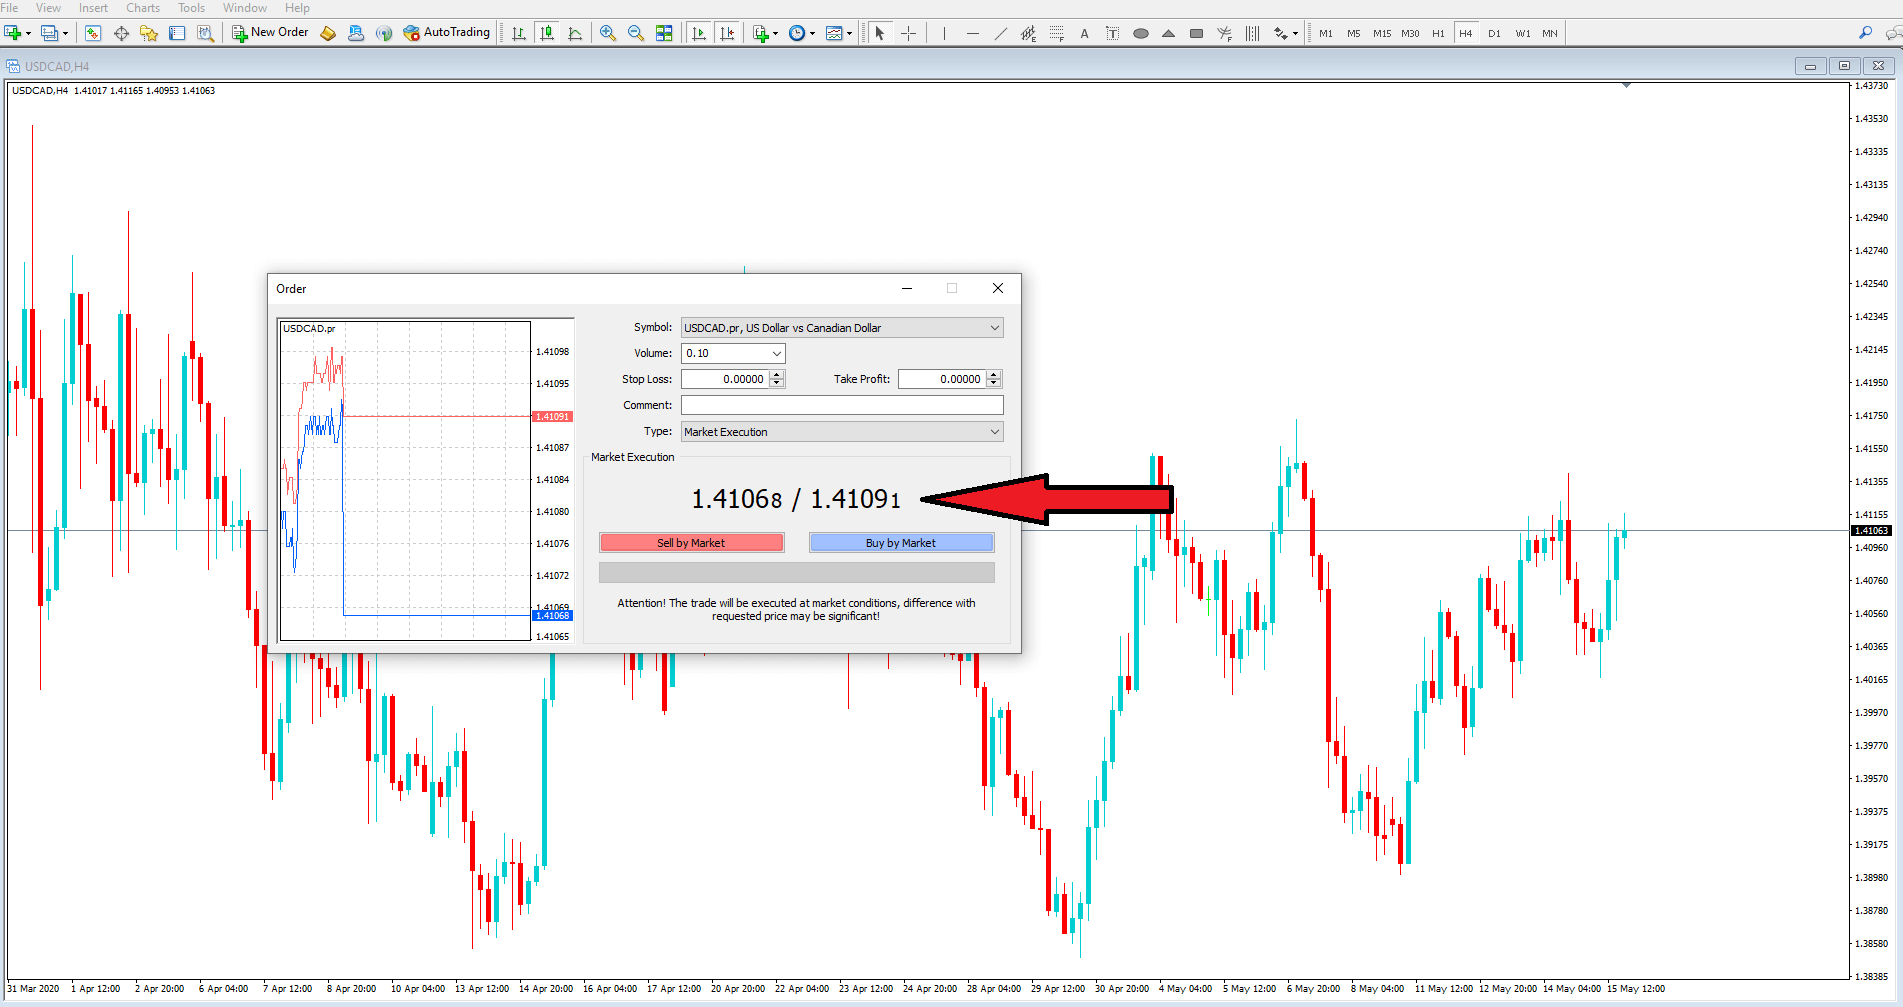
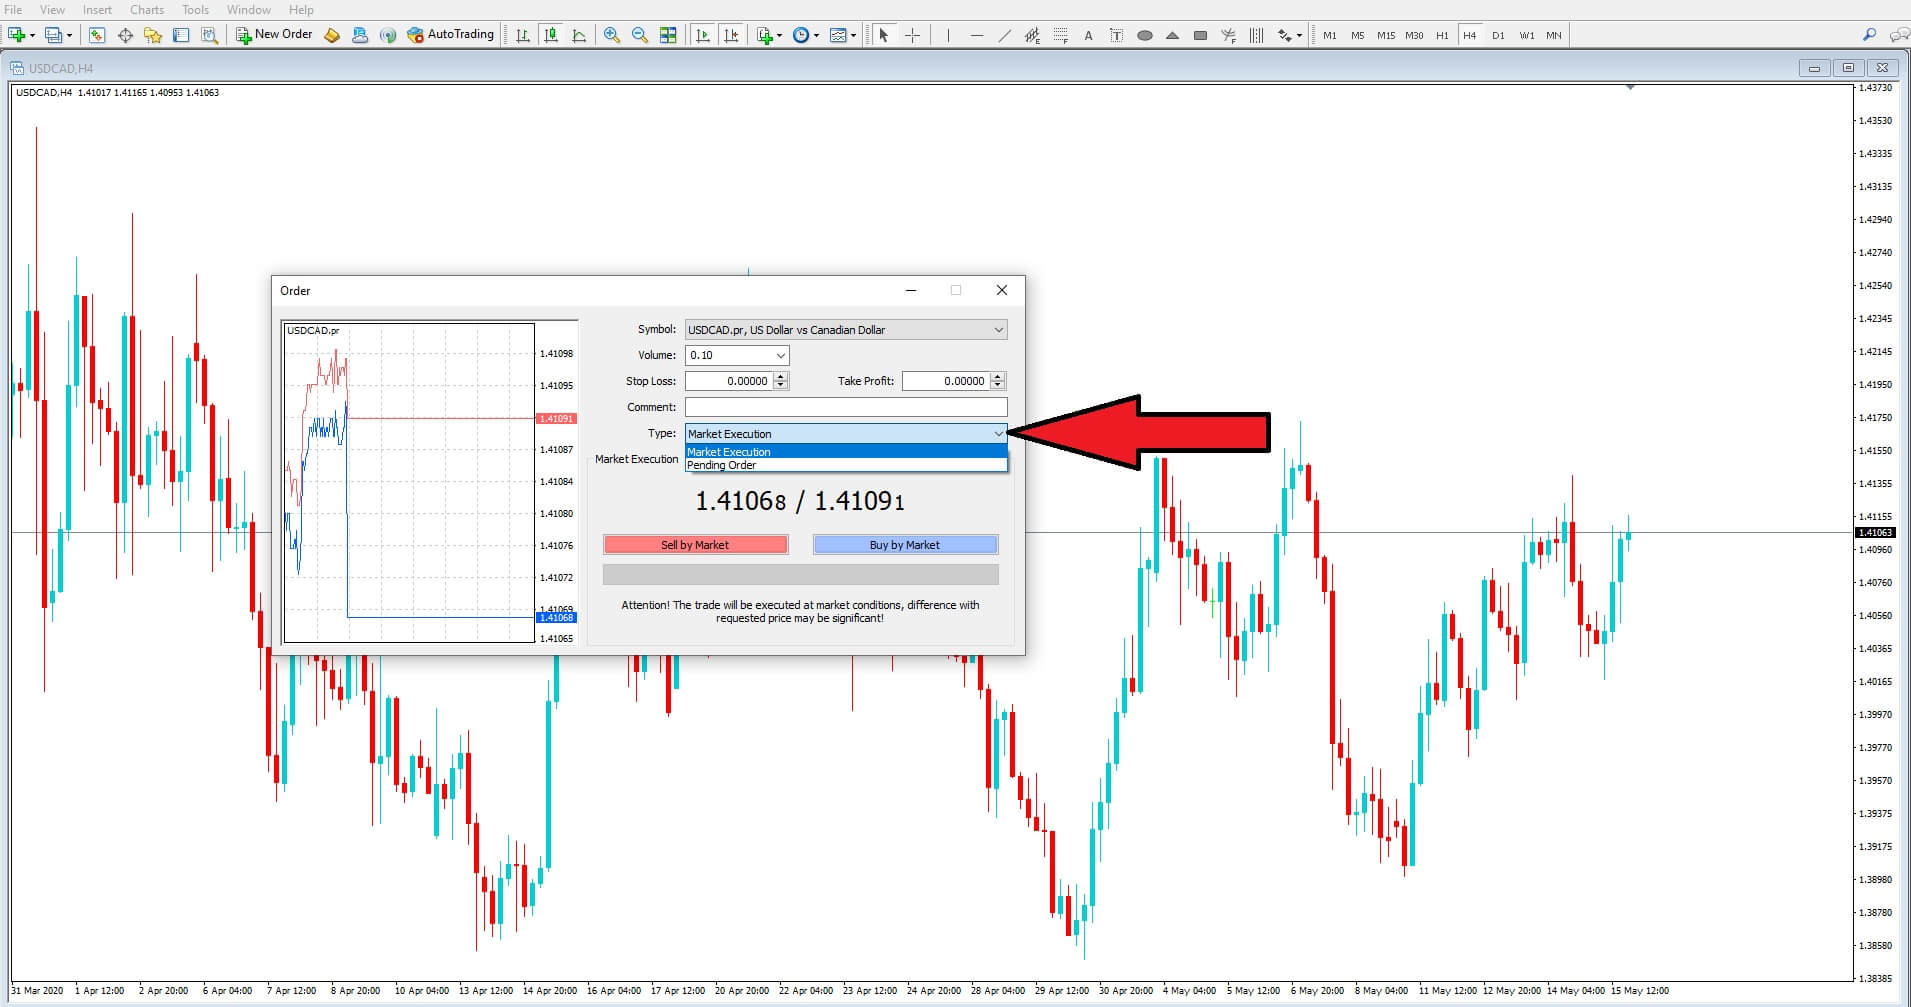
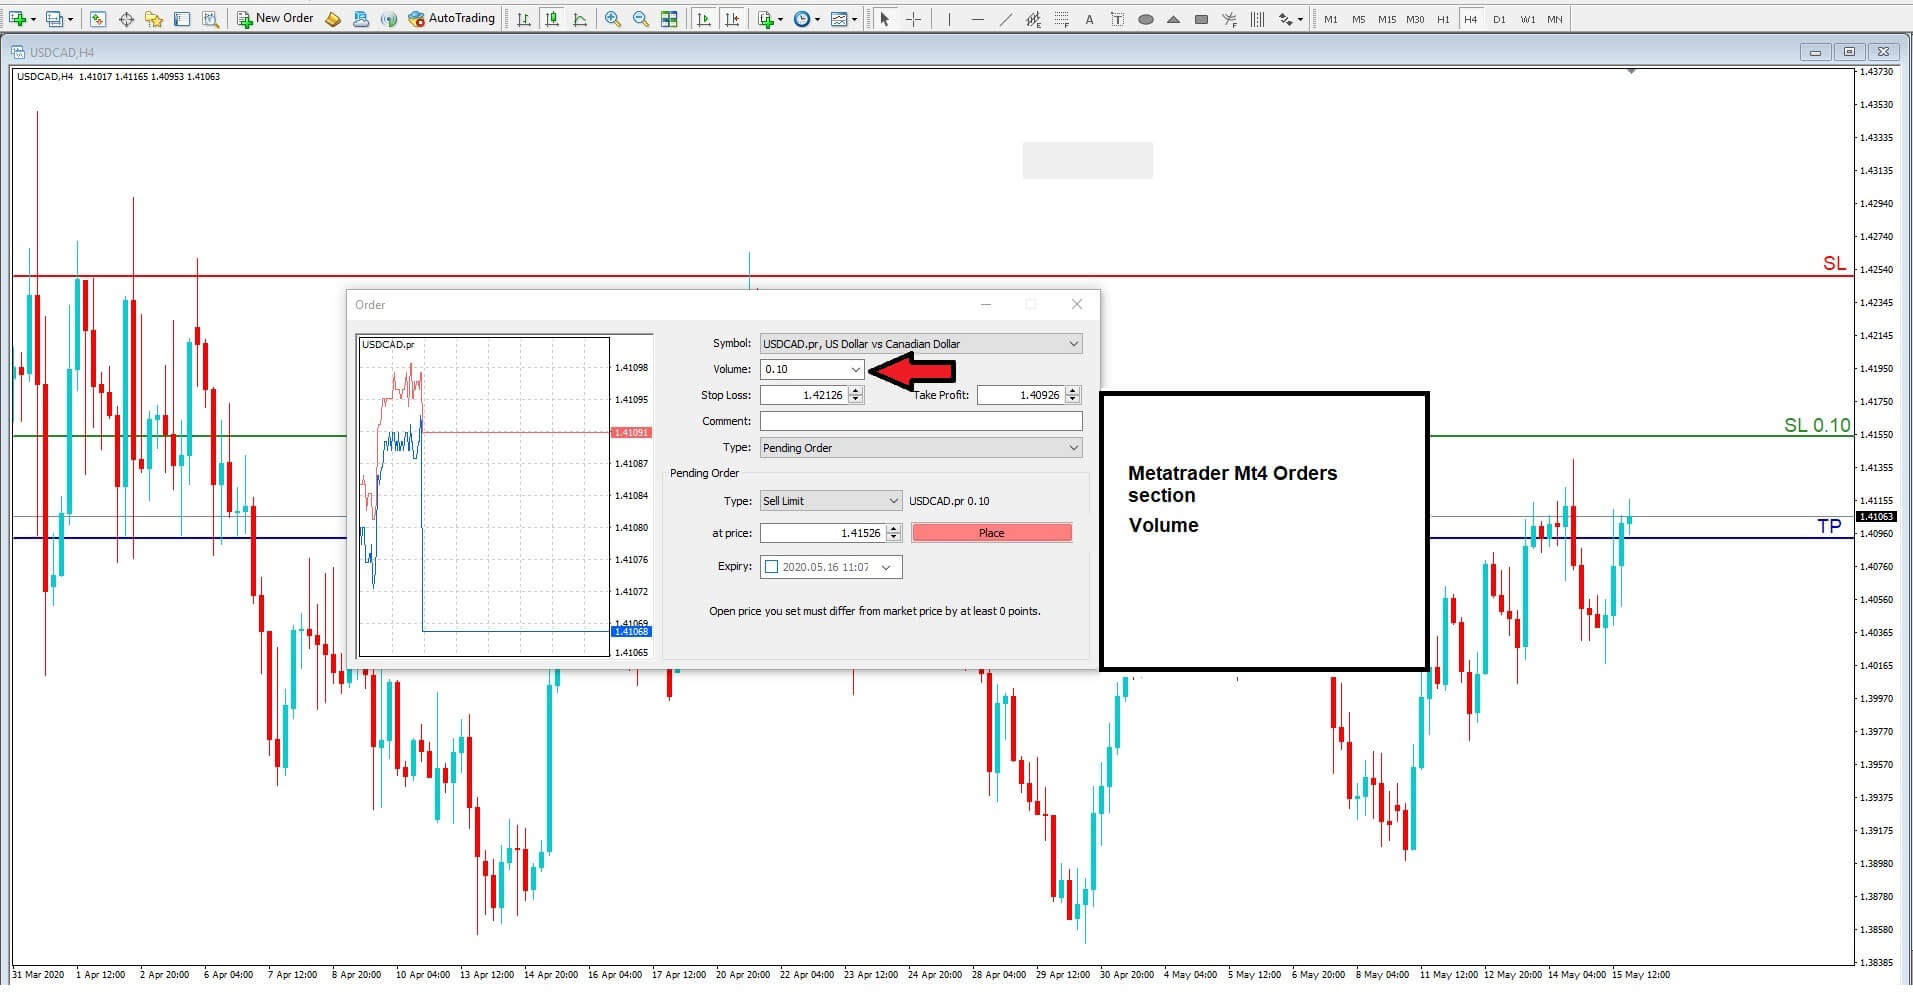
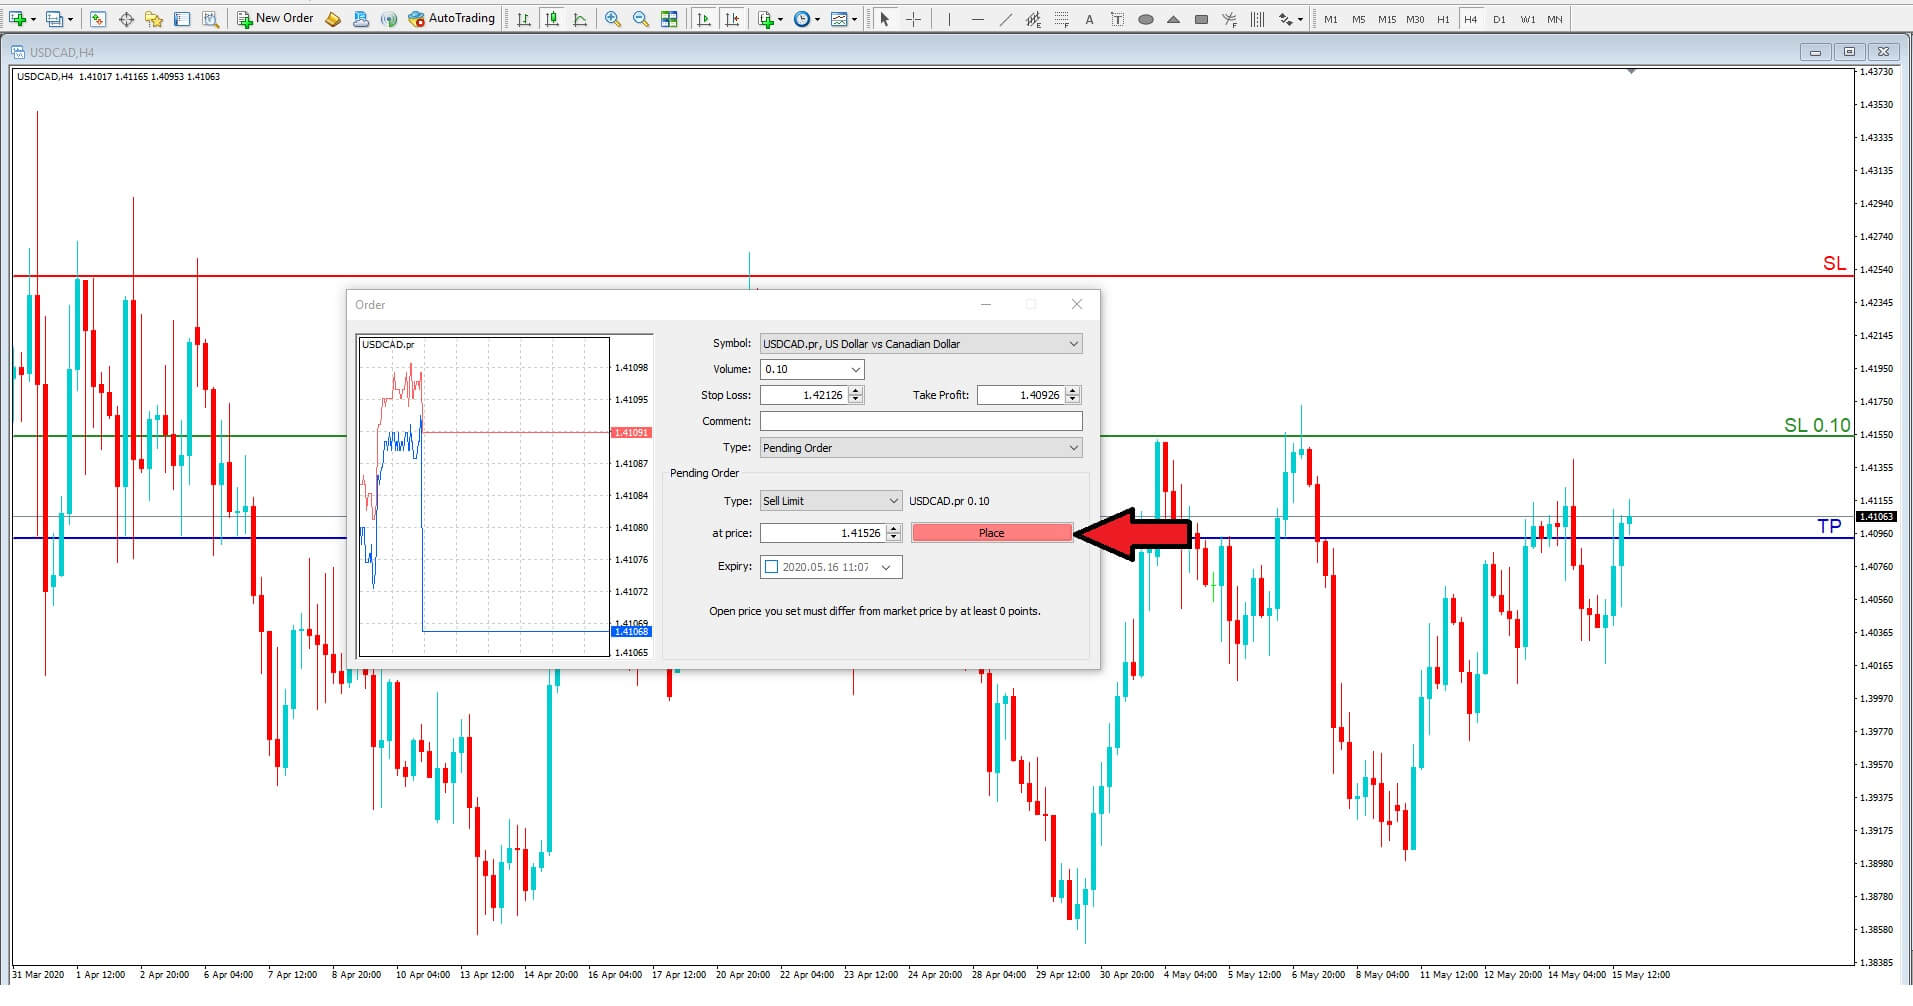
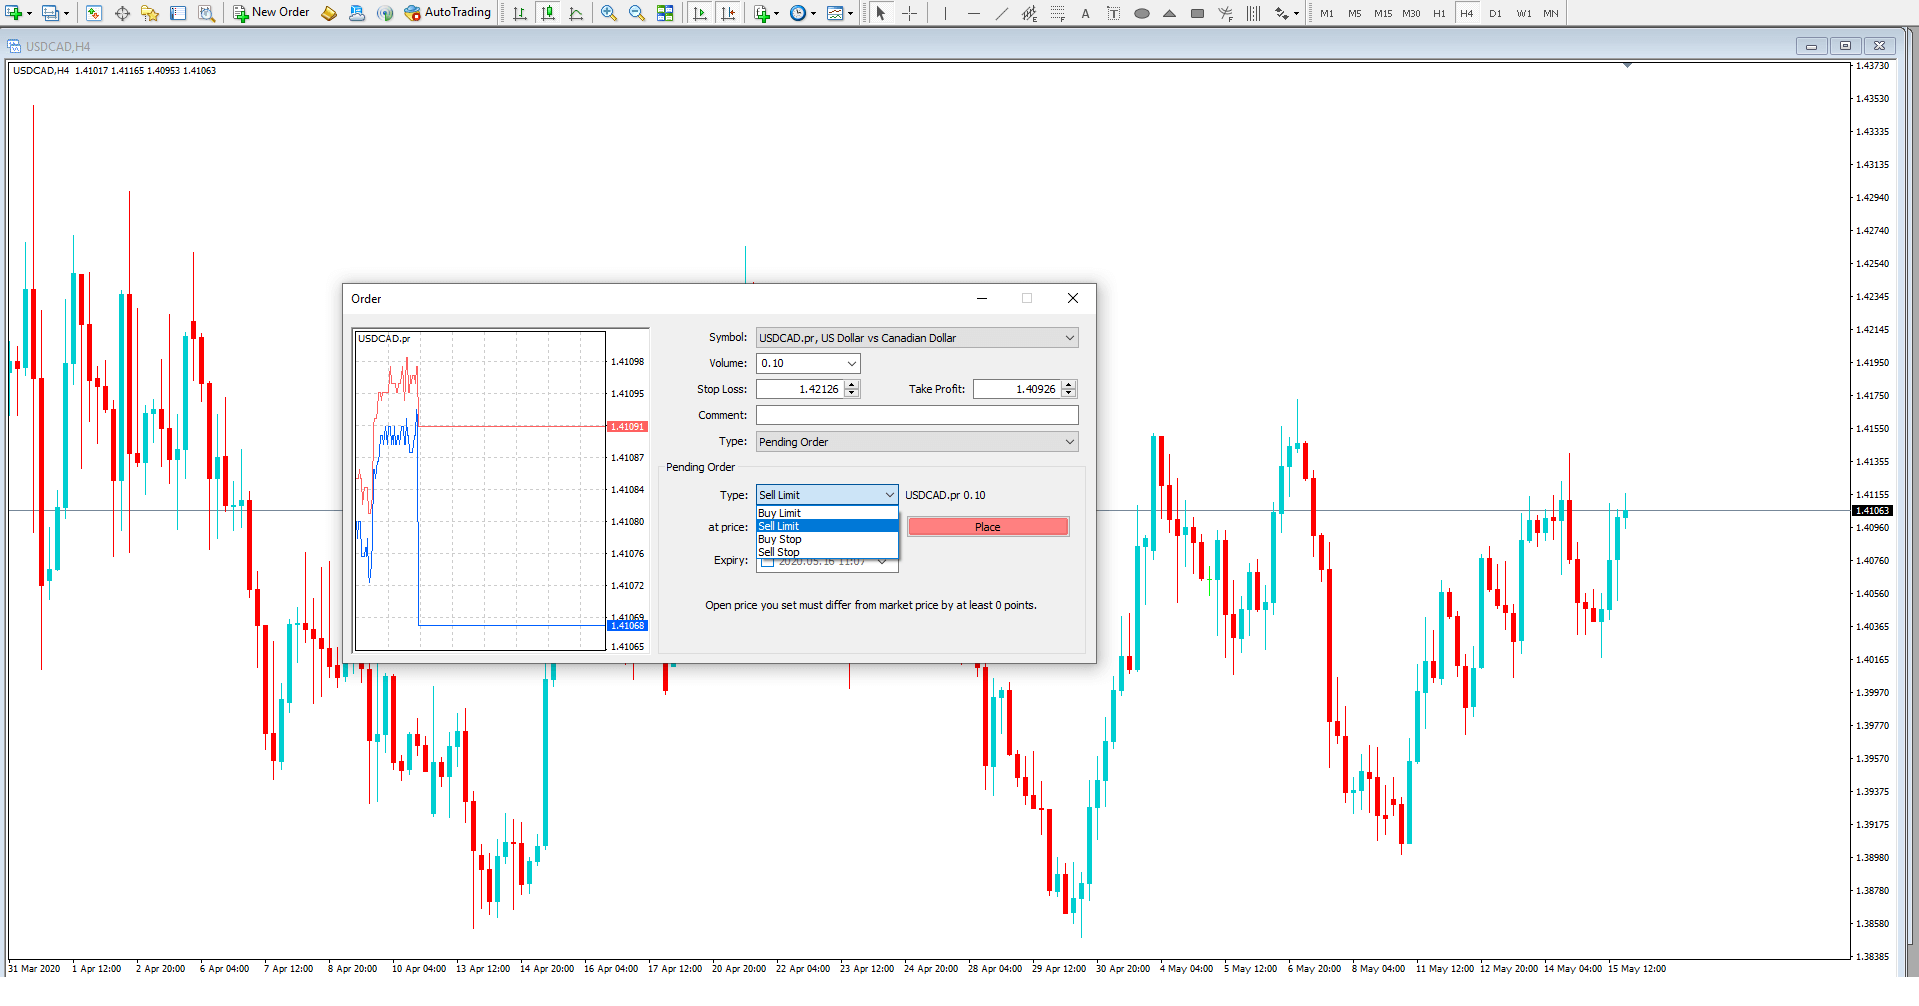
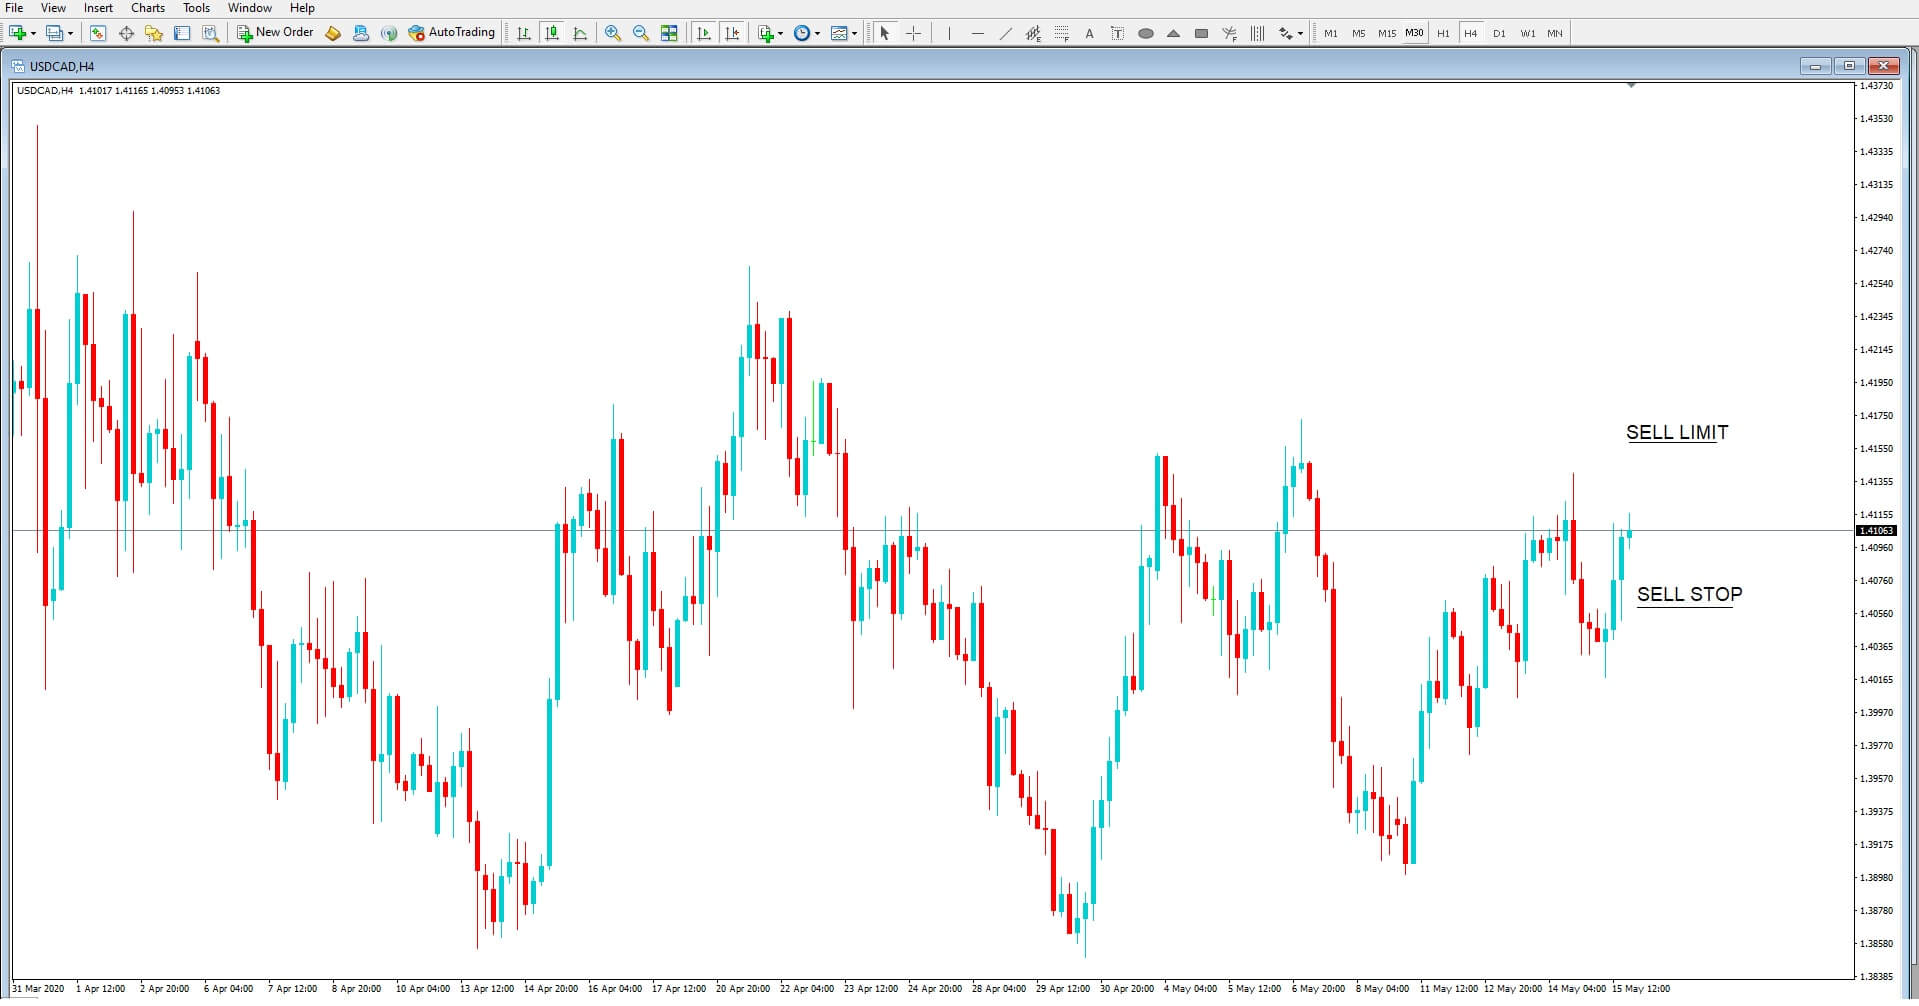
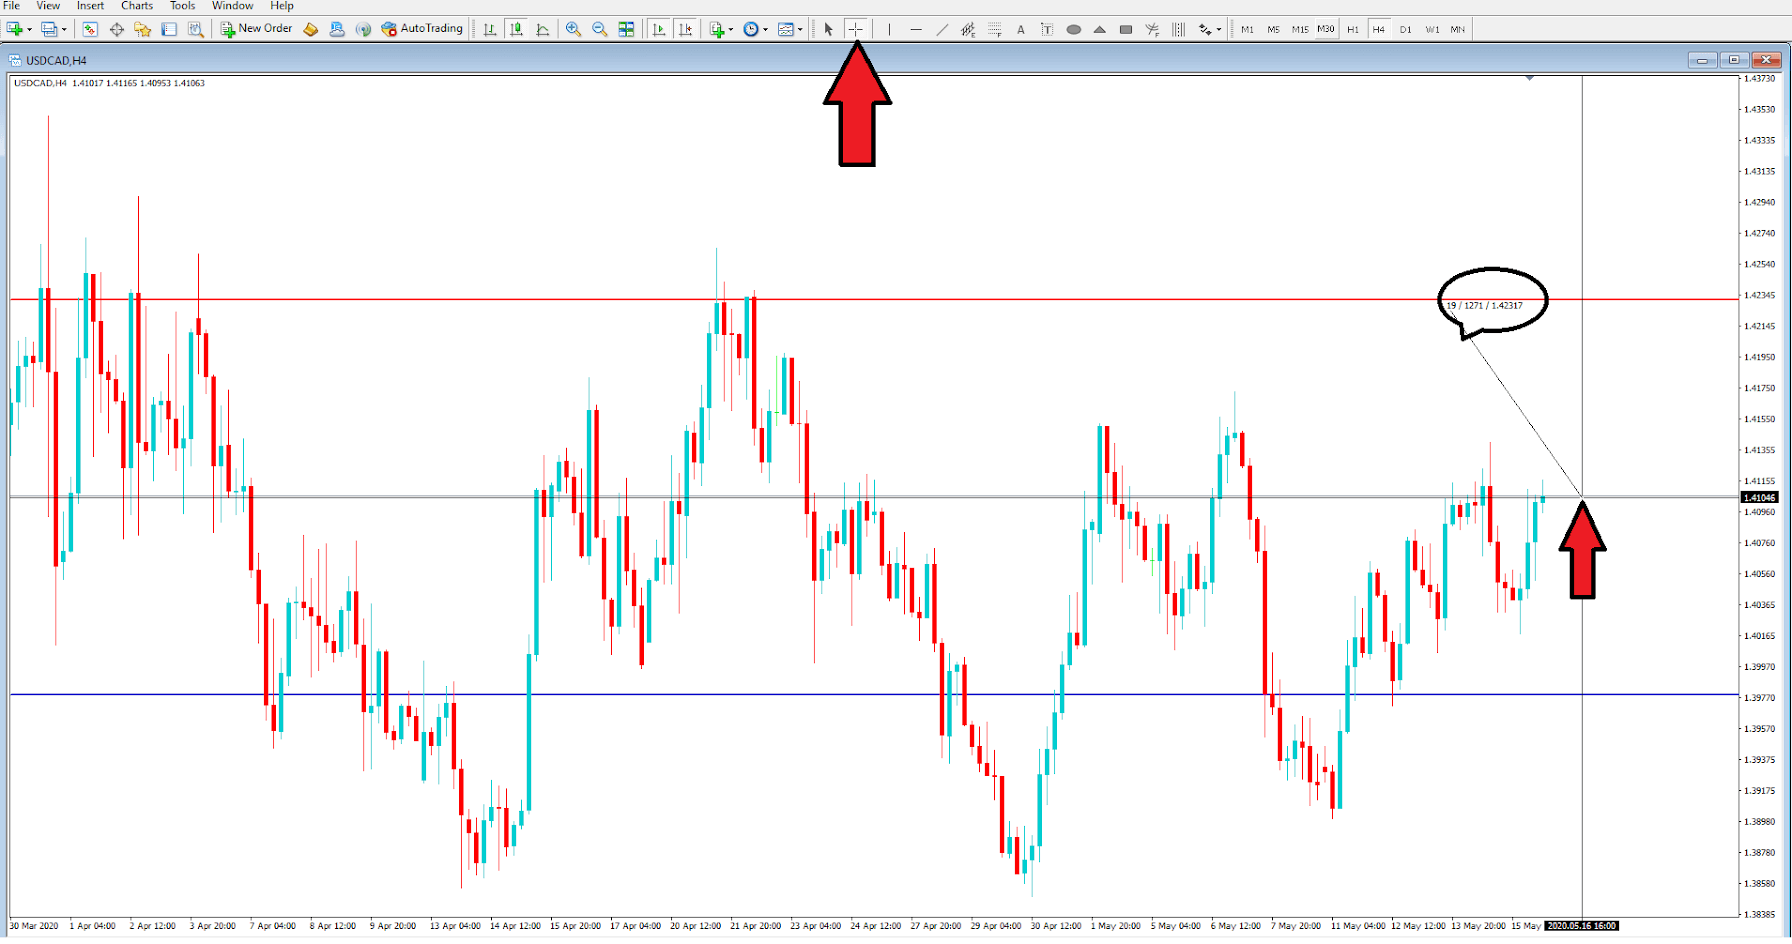
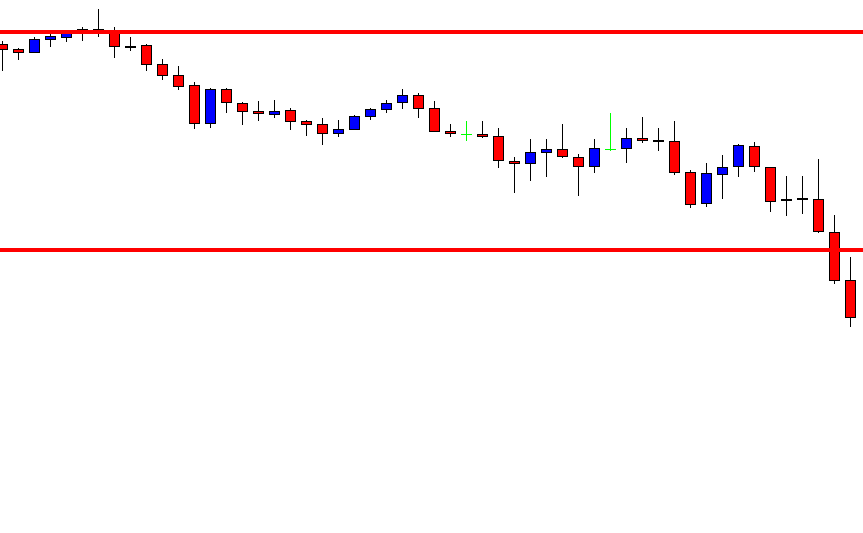
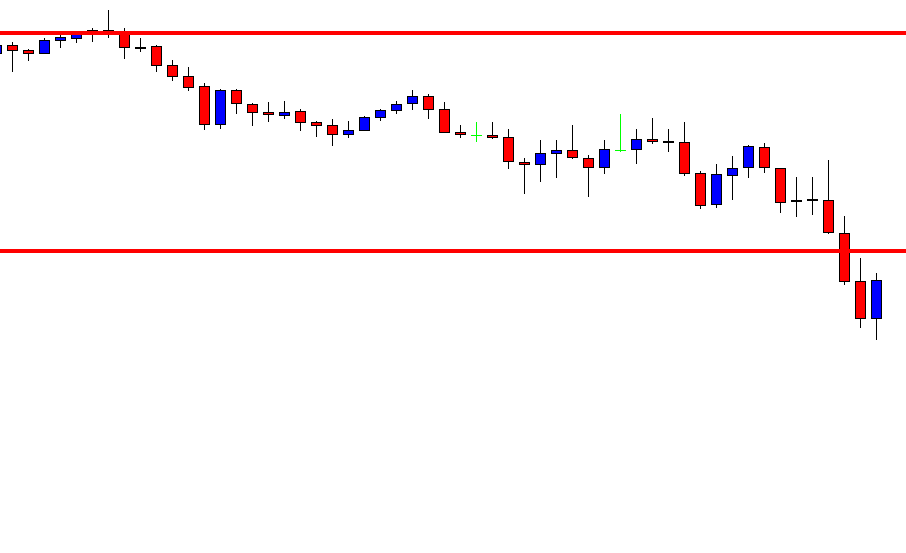
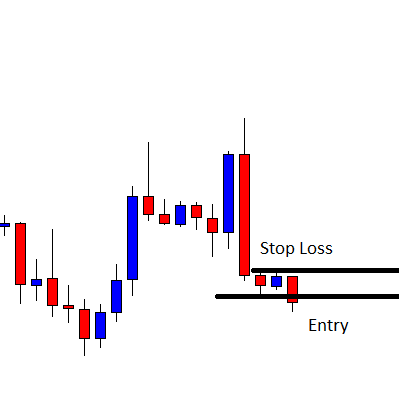
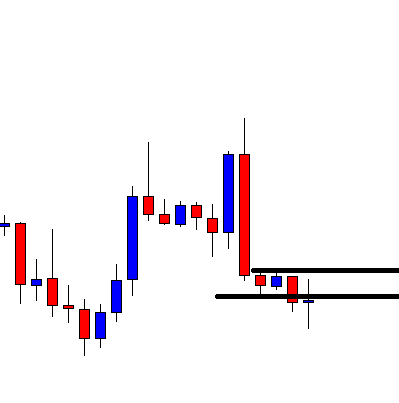
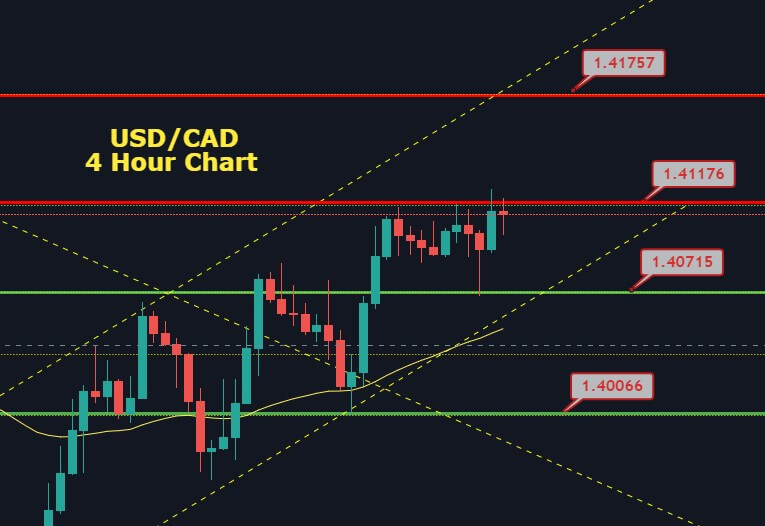
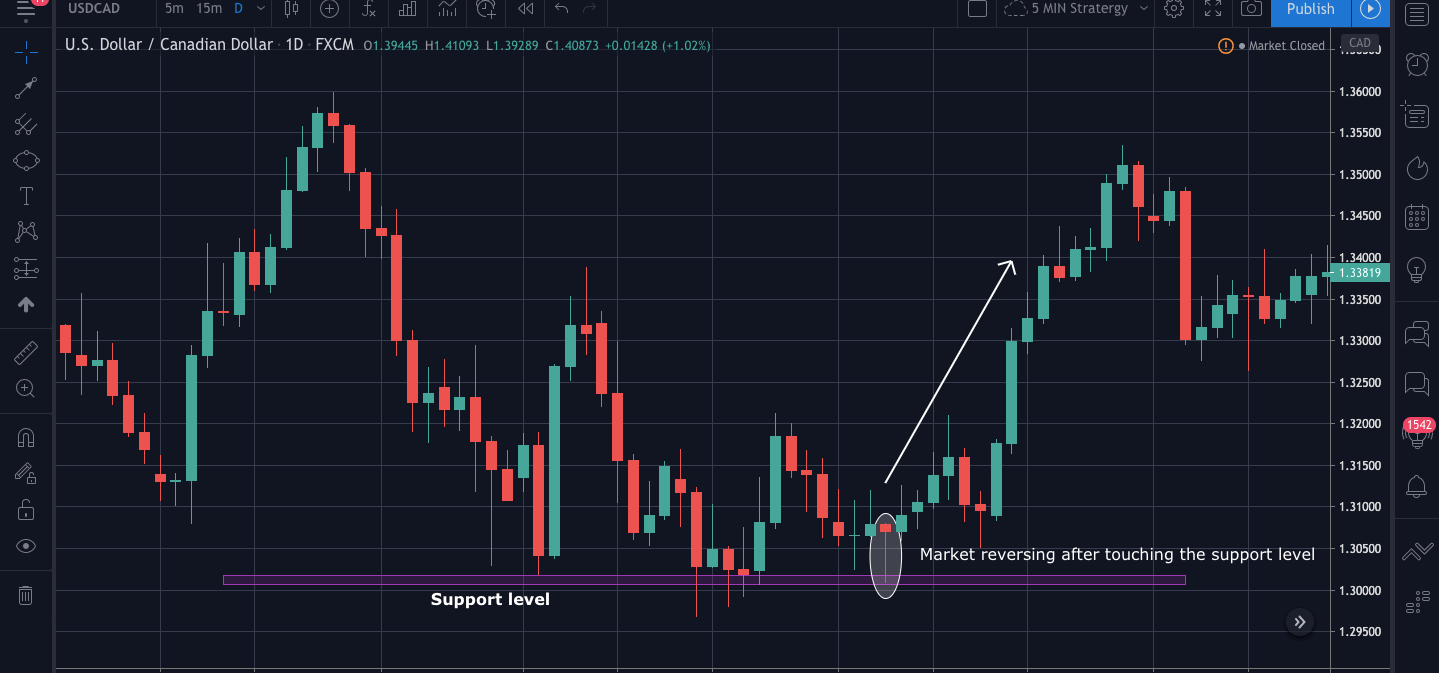
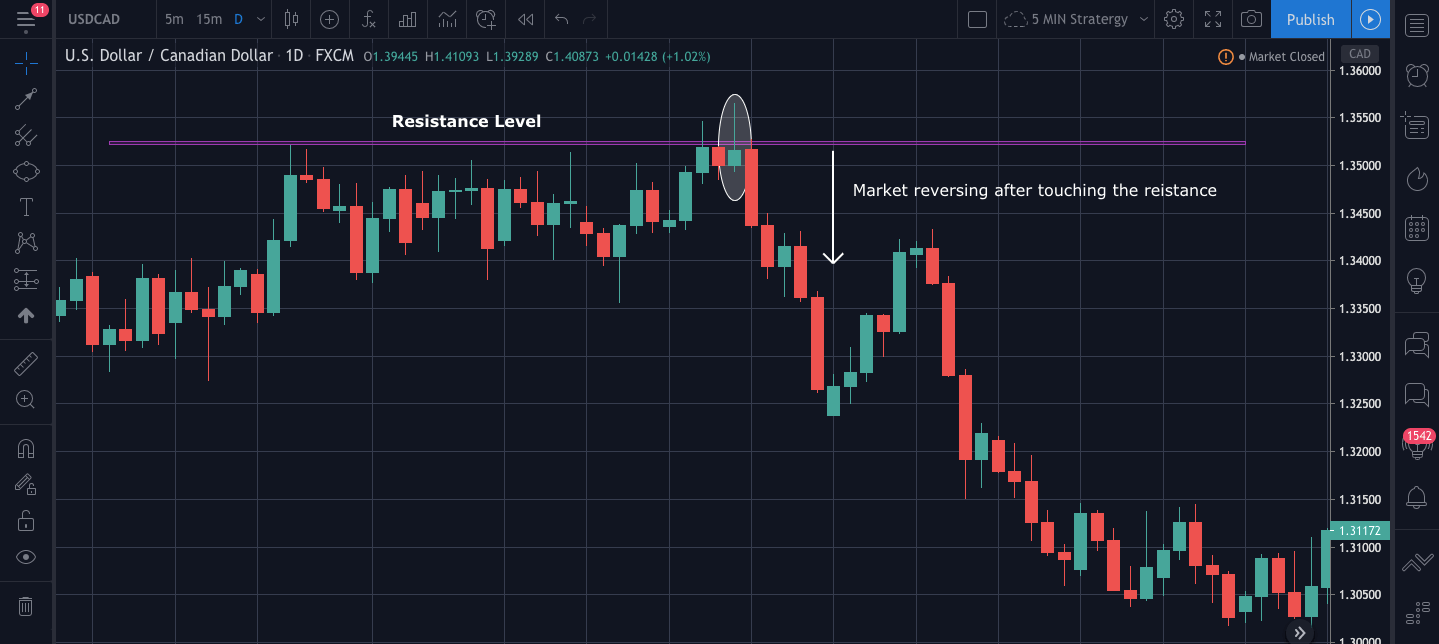
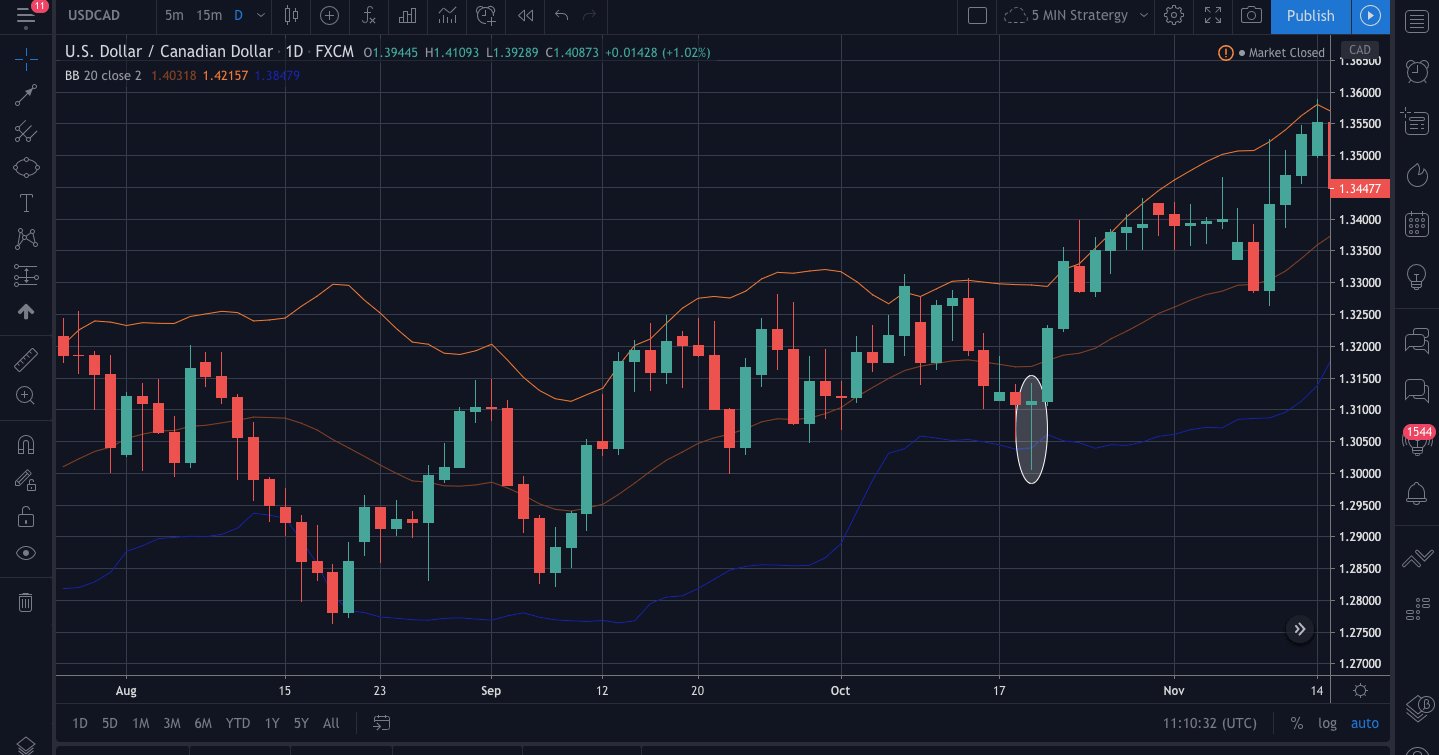
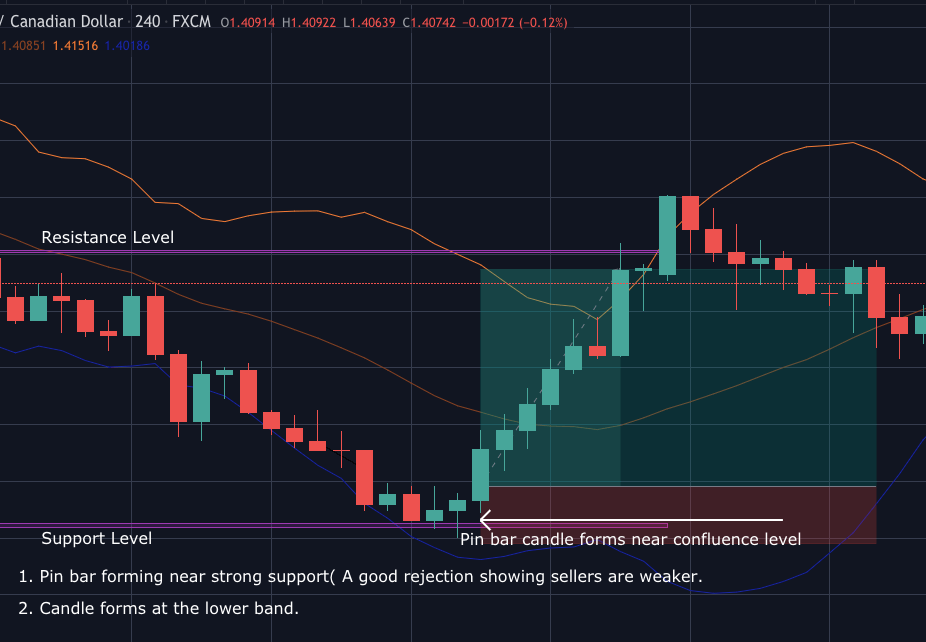
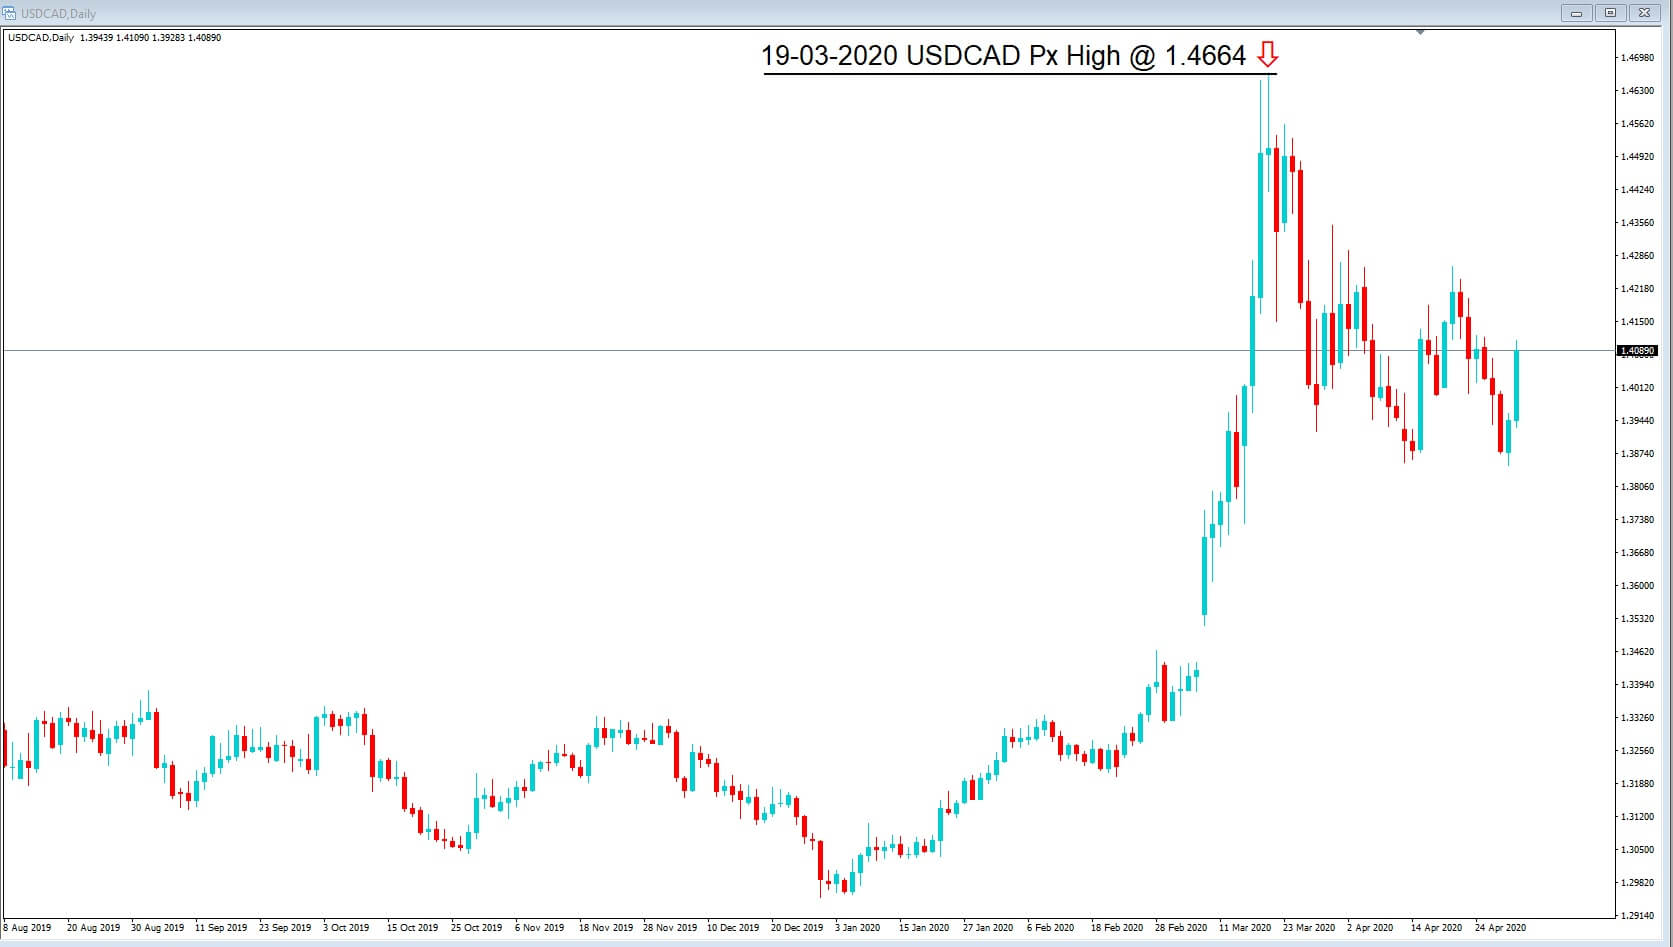
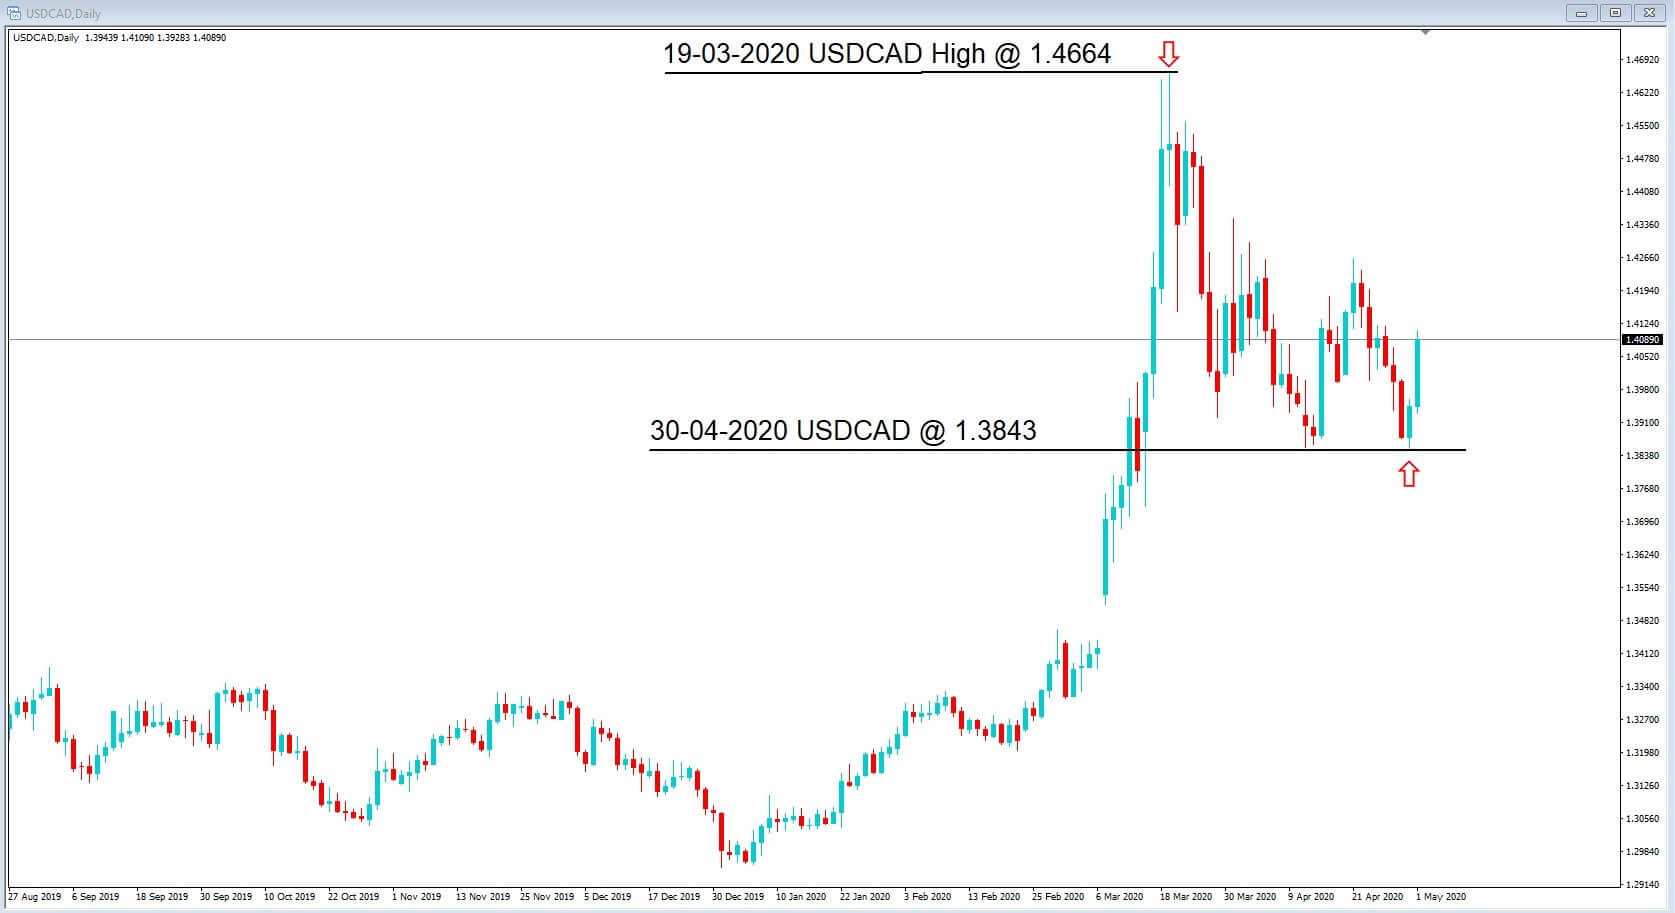
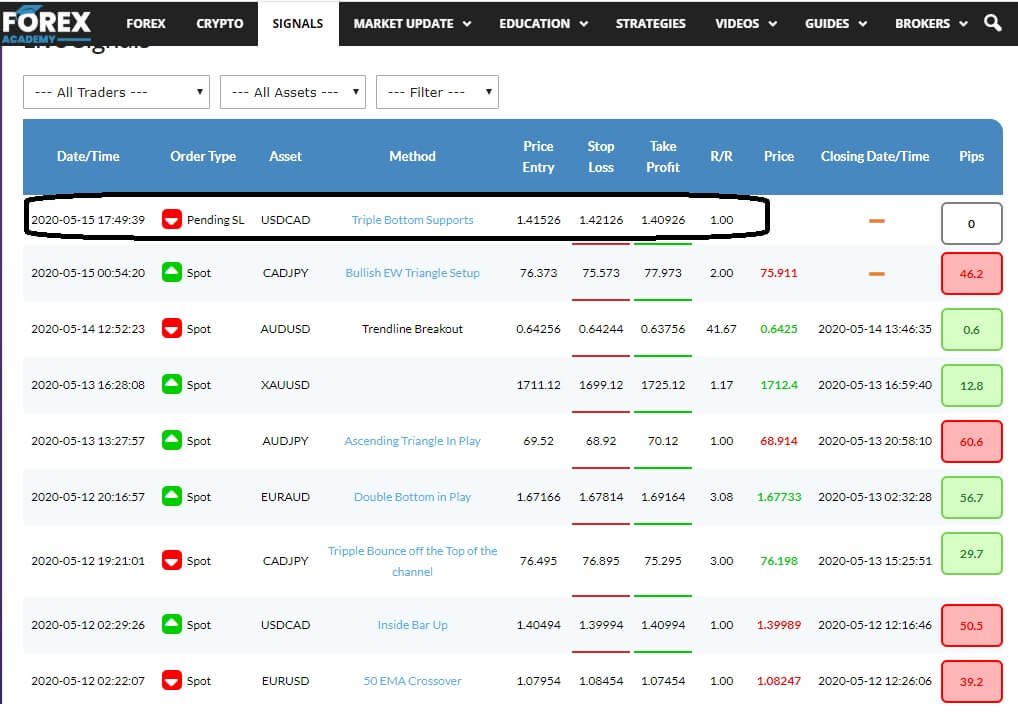 Let’s quickly remind ourselves of the trade we are copying. this is a Sell-limit pending order of the US dollar Cad pair, with an order to sell the pair at some point in the future with no specified cancellation date at an exchange rate of 1.41526 with a stop loss of 1.42126 and a