
Introduction
In our previous educational article, we learned to recognize and count waves finishing the essential topics in the wave analysis process.
From now, we will start to present additional concepts and rules described by Glenn Neely in his work “Mastering Elliott Wave,” which would support the wave study.
Points of Tangency in the Guidelines
The tangency rule will help wave analysts in the process of identification between impulsive and corrective waves. This rule establishes that in a five segments pattern, only four internal movements will be touched simultaneously. This rule can be applied in impulsive and triangular formations.
The following figure illustrates a different set of Elliott wave structures where the wave analyst can apply this rule.
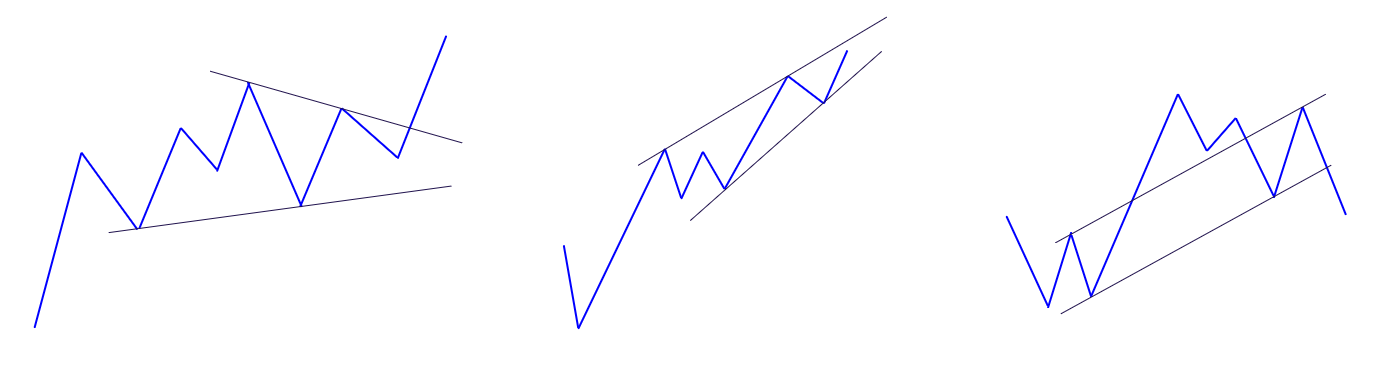
From the figure, the guidelines of both the first and second patterns converge each other. In the third figure, the guideline is parallel. The wave analyst must consider that the different segments that conform to the Elliott wave structure under analysis must have the same degree.
The following figure illustrates the tangency rule application in complex corrections.
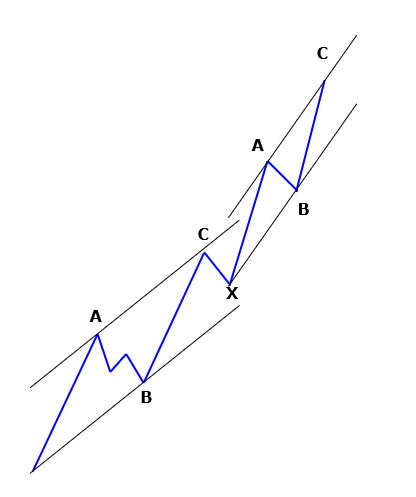
From the figure, we distinguish that once touched the fourth point, corresponding to wave C completion, the price reacts against the direction of wave C. This reaction corresponds to a wave X. Its finalization will give the start of a new corrective structure from where the wave analyst could apply the tangency rule.
Rule of Time
Time is an essential element when the wave analyst makes its market study. According to the Elliott wave theory, in an impulsive structure, the two non-extended waves tend to be similar in price, time, or both. In corrective waves, a zigzag pattern its waves A and C tends to be identical in terms of time.
In short, the rule of time establishes that there can not be three adjacent waves of the same degree, which be equivalent or similar in time in a simultaneous way.
The next picture illustrates the rule of time applied in impulsive structures.
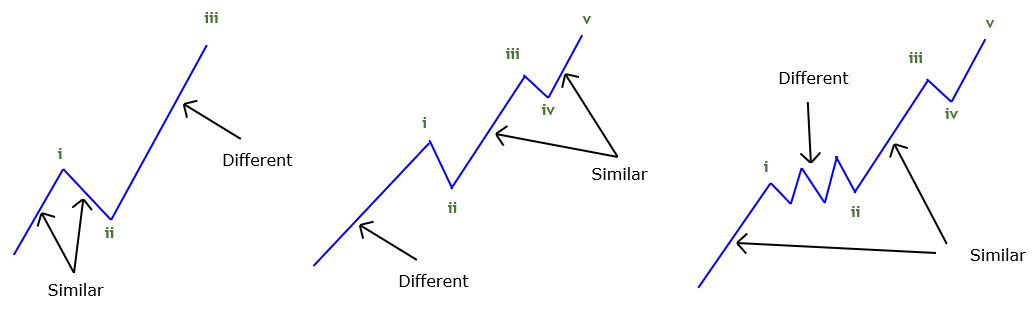
From the figure, we observe that:
- If the two first segments of a pattern are equal or similar, the third segment will be different in terms of time, price, or both. The theory says that the third move will elapse the sum of the first and the second part.
- If the second segment lapses more than the first move, the third segment will be related in 61.8% or 161.8% of the first movement.
- If no one of the waves matches in terms of time, these could be adjusted in a Fibonacci ratio.
The following figure exposes the rule of time applied in corrective waves, in particular, the case of a flat pattern.
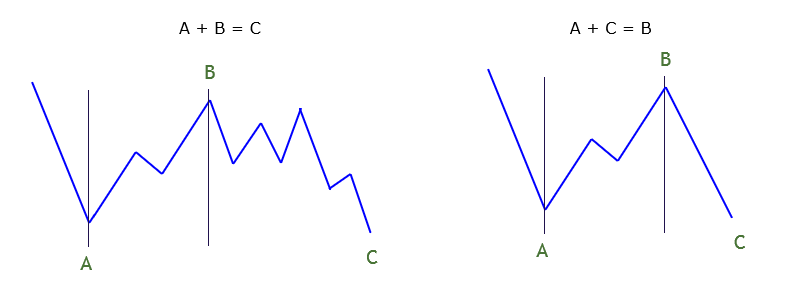
In some cases, the time elapsed by the wave C will be the sum of the time-lapsed by waves A and B. However, in the real market, the typical situation that could occur is that waves A and C will tend to match in terms of time, and wave B will be longer.
Conclusions
In this educational article, we started to present two basic rules for the wave analysis process. The first one corresponds to an extension of the canalization process, which its use allows the wave analyst to visualize with an objective method to define what kind of structure could be developing the price action.
The second one will bring the wave analyst a tool that would make a forecast of what could be the next path the market could take.
In the next educational article, we will present the advanced rules defined by Glenn Neely in his work “Mastering Elliott Wave.”
Suggested Readings
– Neely, G.; Mastering Elliott Wave: Presenting the Neely Method; Windsor Books; 2nd Edition (1990).