
In today’s price action lesson, we are going to demonstrate an example of a daily chart where the price reacts to support and resistance. We will dig into the chart and find out what message it has to offer us.
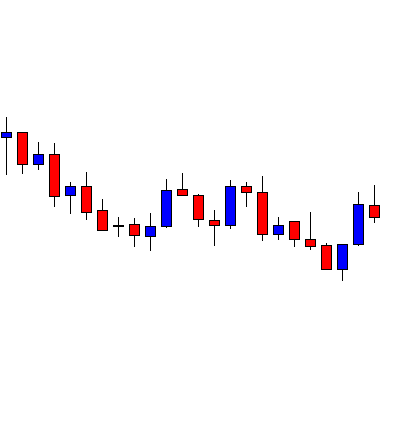
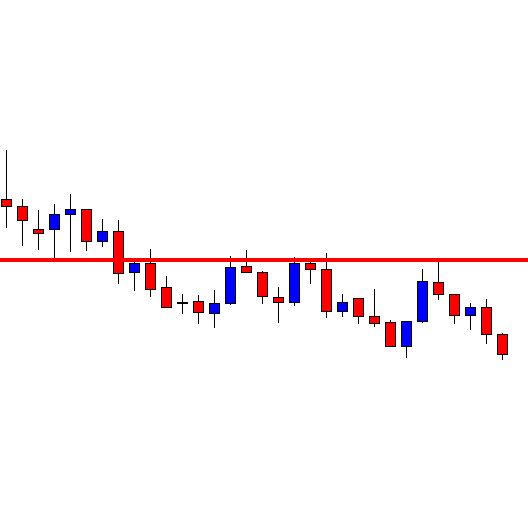
The chart shows that the price heads towards the North upon producing a bullish track rail pattern. The next candle comes out as another bullish candle. However, the price finds its resistance. The level has been working as a level of resistance where the price has rejection twice already. Look at the last candle on the chart. It comes out as a bearish inside bar. However, the level is now triple top resistance. Intraday sellers may look to go short in the pair and drive the price towards the South.
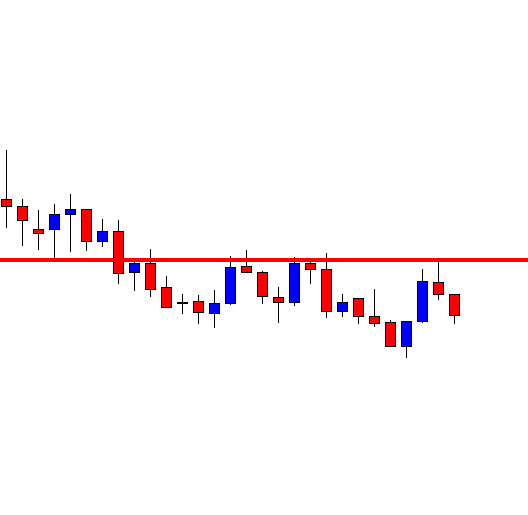
As expected, the pair produces another bearish candle. The last swing low offers enough space for the sellers to go short in the pair. Thus, they may still go short in the pair and drive the price towards the South further. The daily sellers are to wait for the price to consolidate and produce a bearish reversal candle to offer them a short entry. Let us see what happens next.
The chart produces a bullish inside bar. The sellers on the daily chart may go short if the next daily candle comes out as a bearish reversal candle. They are to keep this chart on their watch list.
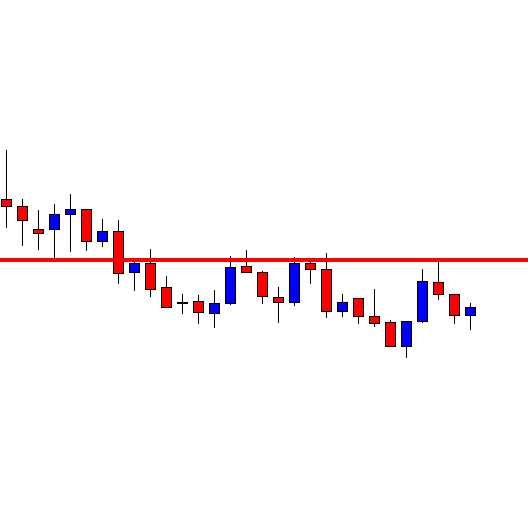
The next candle comes out as a bearish engulfing candle. This means the sellers on the daily chart may go short in the pair and drive the price towards the last swing low as far as price action trading is concerned. If the next daily candle breaches the level of support (last swing low), they may keep holding the position to grab more pips. Let us find out what happens next.
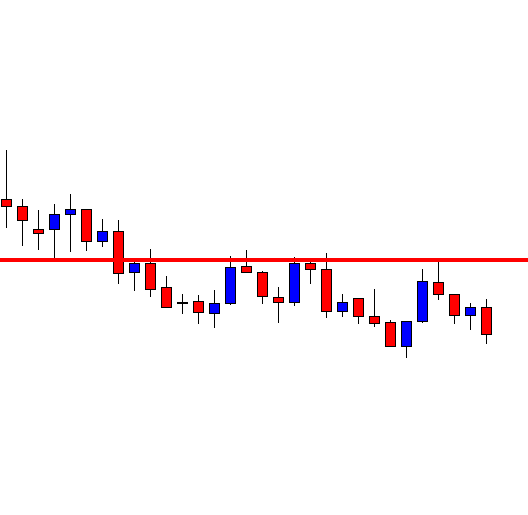
The next candle comes out as a bearish candle closing within the last swing low though. The sellers make some green pips. It might be time for them to close the trade since the candle closes within the level of support. If the candle closes below the level of support, it would surely be a different ball game for the sellers.
Intraday traders obey Support/Resistance on the daily chart a lot. Thus, daily support/resistance plays a significant role in the Forex market to make a reversal/correction/consolidation. Thus, if we take entry even based on the daily chart, we must count those to manage our entries.