The safe-haven-metal prices flashed green and erased its previous session losses mainly due to intensifying trade war tensions between the US-China. However, the yellow metal hit its highest level since December of 2012 at $1,765 on Monday, but after that, the gold prices dropped sharply during the American trading session. The reason for the sharp decline could be attributed to the positive news about the COVID-19 vaccine.
At this moment, the yellow-metal prices are currently trading at 1,733.71 and are consolidating in the range between 1,732.05 –and 1,740.38, while representing 0.18% gains and having hit the high of $1,735.84. Moreover, the broad-based US dollar modest weakness kept a lid on any additional losses in the gold and contributed to the pair’s bullish moves.
Gold futures were higher by 0.27% at $1,739.35 by 12:43 AM ET (5:43 AM GMT). Stocks, which normally have an inverse relationship with gold, were also up on Tuesday. Despite the optimism surrounding the market about Moderna (NASDAQ: MRNA) reports of positive results on Monday from its phase one experiment for its COVID-19 vaccine, the investors preferring into safe-haven yellow metal manly because the US-China trade tussle was getting worse day by day.
Trump warned about stopping US funds to WHO if the United Nations body will not be able to show bigger improvements and independence from China in the next 30 days. The reason behind the high preference of gold in the market could be the report that the NASDAQ stock exchange set to implement new restrictions on Chinese IPOs.
Daily Support and Resistance
S1 1666.87
S2 1704.45
S3 1718.73
Pivot Point 1742.02
R1 1756.3
R2 1779.6
R3 1817.17
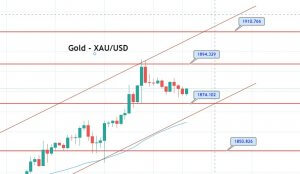
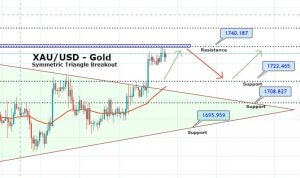
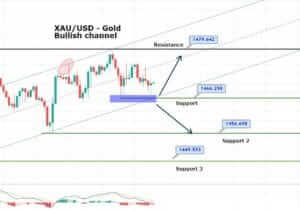
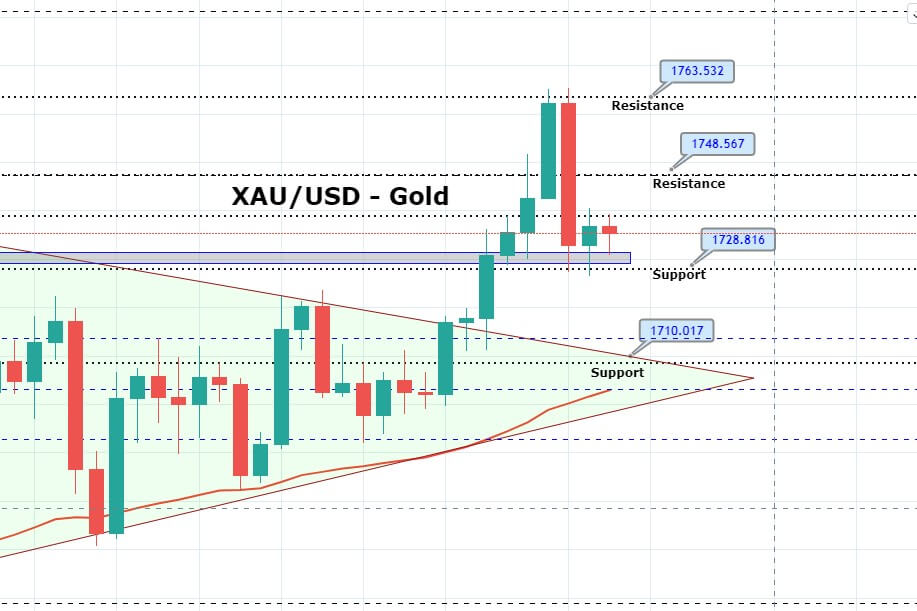
On the technical side, the yellow metal gold is trading sideways below 1,739 resistance and above the support level of 1,726 level. In between this range, the market is likely to offer choppy trading sessions, until the trading range gets violated. We may see an extension of a bullish trend upon the bullish breakout of 1,739, which may open further room for buying until the next target level of 1,750 and 1,759. Below 1,726 old prices can drop until 1,716 level. Let’s wait for a breakout, and then we will open a position accordingly. Good luck!