Categories
Forex Fundamental Analysis

Comprehending ‘Capital Flows’ As A Macro Economic Indicator

Introduction

Capital Flow is a useful indicator to assess the relative strength of economies and sectors within an economy. Capital always tends to flow towards growing, improving, and strengthening regions, be it industries, economies, or even currencies. Tracking the flow of Capital can help us understand the expanding areas within a nation and also throughout the world. It also gives us an insight over which sectors are contracting or experiencing a slowdown. Hence, understanding Capital Flow is crucial for investors and traders to make critical investment decisions.

What is Capital Flows?

Capital Flow refers to the money movement within an economy amongst different classes or economies in the broader sense. Capital movement from one sector to another can be for various purposes like an investment, trade, or business operations. On a small scale, individual investors can direct their savings and investment capital into securities such as mutual funds, bonds, or stocks, etc.

On the medium scale, It can include money flow within corporations in the form of investment funds, capital spending on business operations, and R&D. For example, Big tech Giants like Apple or Microsoft can direct their funds on expanding their production sites in other countries. In this case, Capital flows out of the country, or they may choose to invest in Research and Development Sector to develop new products and services, where Capital flows into that division, which is usually headquartered in the native country, in this case, the United States.

On the larger scale, Capital Flows are directed by Government from their federal tax receipts to many outlets like public spending programs, regulatory operations, foreign trades, currencies, and foreign investments, etc. On what aspects the Government decides to direct the flow of Capital can imply many things like development, employment, inflation, foreign goods, imports, etc.

As the entire world runs on money, directing the flow of money is essential. An excess of influx or deficit of money flow can be detrimental for any sector. Hence, the Government segregates Capital Flows into different types for studying, regulating, and policy-making purposes. The following are the Capital Flow types:

Asset-class movements: It refers to the changes of Capital between liquid currency, stocks, bonds and other financial instruments like real estate, metals (ex. Gold, Iron, etc.)

Venture Capital: It refers to the shift in trends of capital movements directing towards startup businesses. Which sector new startup businesses are seeing capital inflow and which are not is tracked through Venture Capital statistics.

Mutual Funds Flow: It tracks the overall addition or withdrawal from the underlying classes of its funds, which can be bonds, stocks, banks, or other mutual funds. Inflow and outflow from one segment to others can imply many things for investors. In general, the influx of Capital Flow into a sector is positive, while outflow is depreciating for that segment class.

Capital Spending Budgets: It refers to the Capital movements for the corporate institutions and is used to monitor growth and expansionary plans of the corporate based on their budget allocation patterns.

Federal Budgets: This is the critical component amongst Capital Flows as it has a long-term impact on the economy and can either attract or drive-off foreign investors. It refers to the budget plans allocated for public spending, running economic operations and regulations, etc.

How can the Capital Flows numbers be used for analysis?

Money accompanies the growth period. Money always follows where there is growth or improvement. In the financial markets, this is called “hot money,” which refers to the funds from investors throughout the world. Whenever a stock market performs good, or an industrial sector improves or comes up with an innovation, it is followed by an increase in the inflow of Capital.

The capital flow can assess the relative strength of capital markets into and out of the markets or the liquidity of that stock market. As the United States is the world’s largest economy and accordingly, it is having the top two stock exchanges, i.e., the New York Stock Exchange (NYSE) and Nasdaq (NASDAQ) beating all the global stock exchanges.

At the corporate level, the flow of Capital helps investors assess the current financial stature of the company and their probable future plans. For example, Investments into expansionary plans are likely to generate more revenue in the future.

The Government’s Federal Budget can be used to analyze how much growth can be expected based on the current public spending and what portion goes into servicing debts. For instance, Higher budget allocation for public spending is indicative of an effort to stimulate the economy in a positive direction. Similarly, interest rates, bond yields can all determine Capital flow in and out of the economy.

Impact on Currency

When Capital flows into the country, the currency appreciates and vice-versa. For example, when the USA regularly imports foreign goods resulting in dollars going out of the country, this results in excess of U.S. dollars in the global economy due to which the value depreciates. On the other hand, if the USA continuously exports its goods, for this other countries send dollars into the USA, creating a deficit in the rest of the world. Accordingly, the demand for dollar increases and currency appreciates.

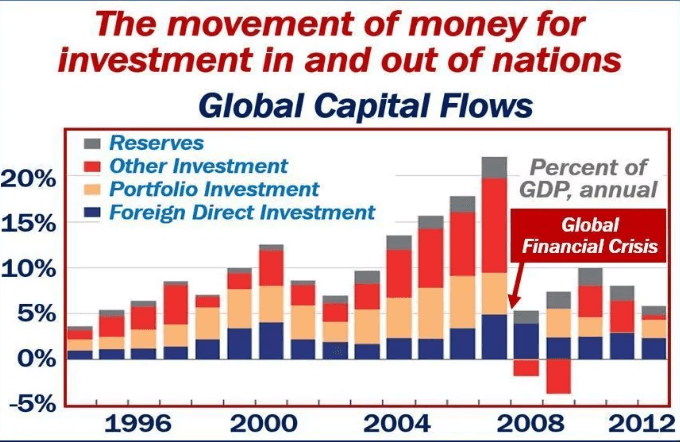
Generally, High yield rates (ex: Treasury Bonds), bank interest rates deposits relative to other economies attract Capital into the economy. When markets experience a slowdown or heading for a crash, it is amplified by the outflow of cash as it propels the de-liquefication and further drives down the confidence of people. Hence, healthy Capital inflow is essential to maintain the economy and for the currency to hold its value against other currencies. The same is illustrated in the below plot:
(Chart Credits – Market Business News)

Economic Reports

Capital Flow is a broad metric with several components, as discussed. The corporate balance sheets and press releases can be used to understand the Capital Flow within corporate sectors, which they usually release quarterly, or annually on their own official websites. The Federal Reserve System releases of the United States releases its Federal Budget and its recent revisions on its official website. There are many online platforms to track the status of the global stock exchanges themselves to observe the Capital Flow.

Sources of Capital Flows

Fed Balance Sheet Data & Information can be accessed here.

Information on major indices can be found here.

Capital Flow metrics with illustrative graphs for analysis can be found here.

Impact of the ‘Capital Flows’ news release on the price chart 

Now that we have understood the importance and significance of Capital Flows in a country, we shall study the impact of the same on the value of a currency. Capital Flows does not only mean the movement of funds across countries, but it is also measured in terms of investment in asset-classes, venture capital, federal budget, mutual funds, and government spending.

Capital Flows have quite an impact on the economy, if not a major effect. The revenue of the local Exchange Market, money supply and liquidity are some of the parameters which fall prey to any disturbances in the Capital Flows. Traders and Investors keep a watch on the Capital Flows data and monitor the trend of Flows. They will be interested in investing in the country only if they feel that there is growth potential looking at the monthly data.

In this section, we will be looking at the Capital Flows data of the U.S. collected in the Month of February and analyzed the impact on various currency pairs. This data is collected and published by the Department of Commerce’s Bureau of Economic Analysis. A higher than expected reading should be taken to be positive for the currency while lower than expected data is considered to be negative.

USD/CAD | Before The Announcement

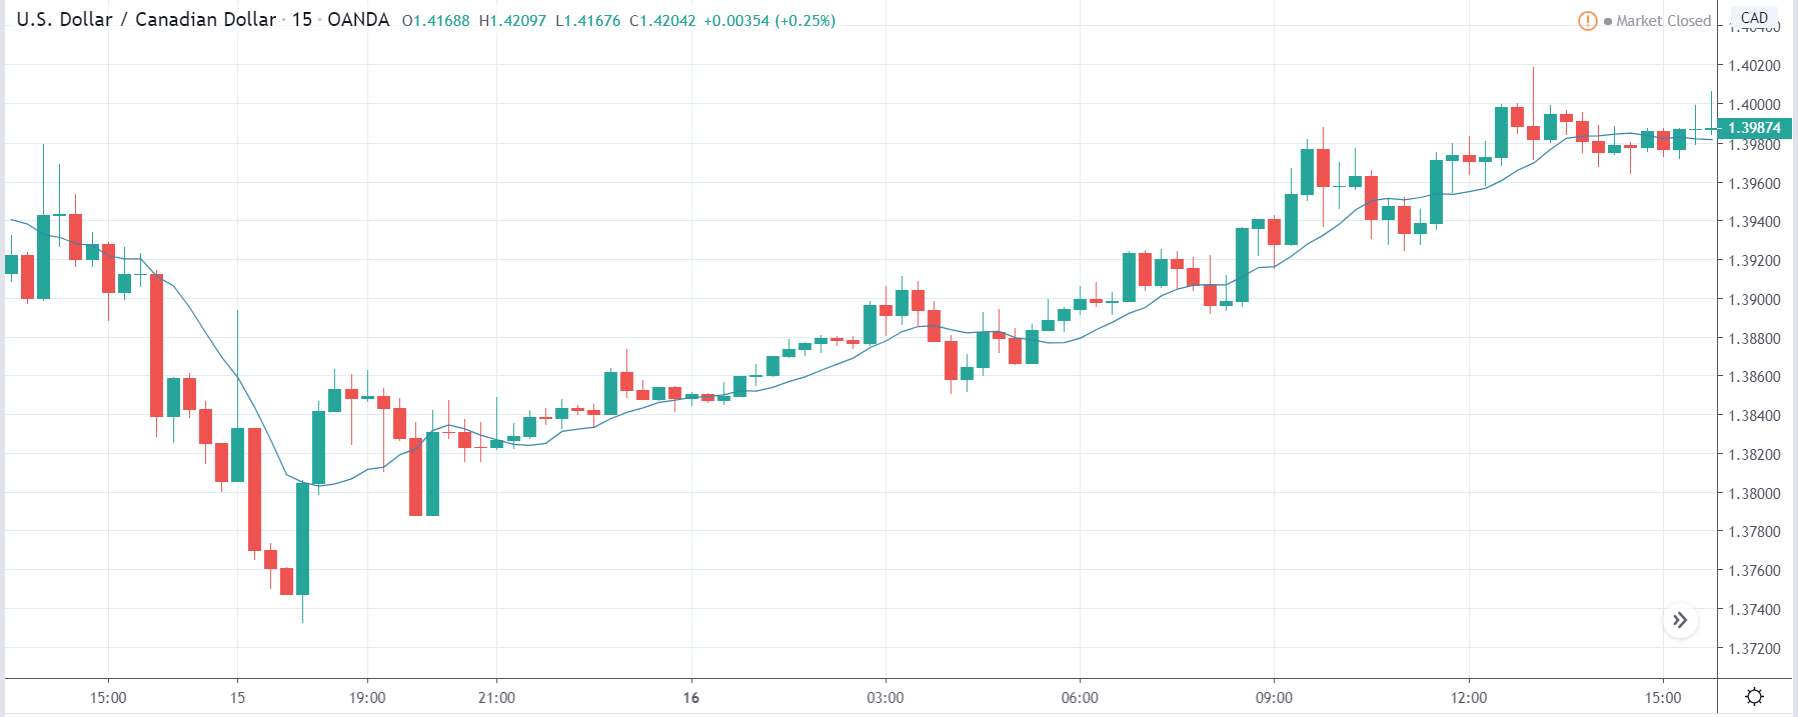
Let us first analyze the USD/CAD currency pair. The above image shows the characteristics of the chart before the announcement was made, and we see that the pair in a strong uptrend moving aggressively higher. The uptrend could be due to another fundamental reason which we are not sure about. Thus, we should not be taking ‘short’ trades based on the forecasted data as we don’t see any signs of reversal on the chart.

USD/CAD | After The Announcement

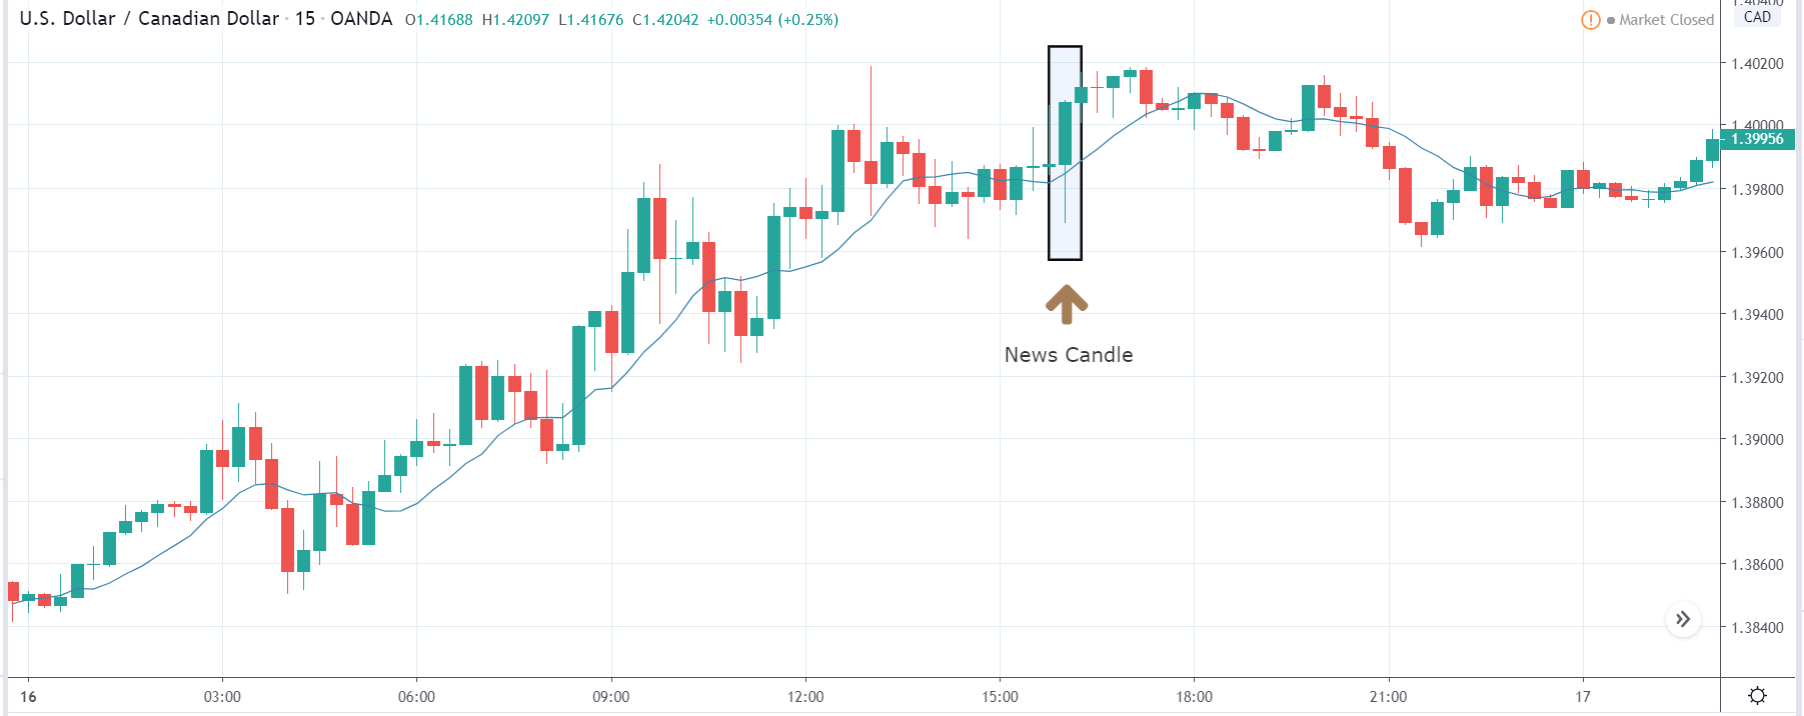
After the Capital flows data is published, we witness a large amount of volatility in the market, and finally, the price closed as a bullish candle. Due to the increased volatility, the price initially went lower, but later, when traders apprehended the numbers, they bought U.S. dollars aggressively, and the ‘news candle’ closed with great strength. This reaction was because the Capital Flows data was largely above expectations and much higher than last time. However, one should not chase the market and enter for ‘buy’ but instead wait for a retracement to join the trend.

AUD/USD | Before The Announcement

AUD/USD | After The Announcement

These are the images of the AUD/USD currency pair, where the first image shows the state of the chart before the announcement is made. In the first image, we see that the price is mostly moving in a ‘range,’ and there is a fair amount of volatility on both sides. Just before the news release, the price is a little above the ‘support’ area, and one can expect some green candles from this point.

This means one should be cautious before taking any ‘sell’ trade from here. After the news announcement, the price sharply drops lower, and we see a rise in the volatility to the downside. Traders again bought U.S. dollars in this pair, and the price closed as a strong bearish candle exactly at the ‘support.’ One could use the supply point of the ‘news candle’ and then take a ‘short’ trade with a  stop loss above the recent high.

NZD/USD | Before The Announcement

NZD/USD | After The Announcement

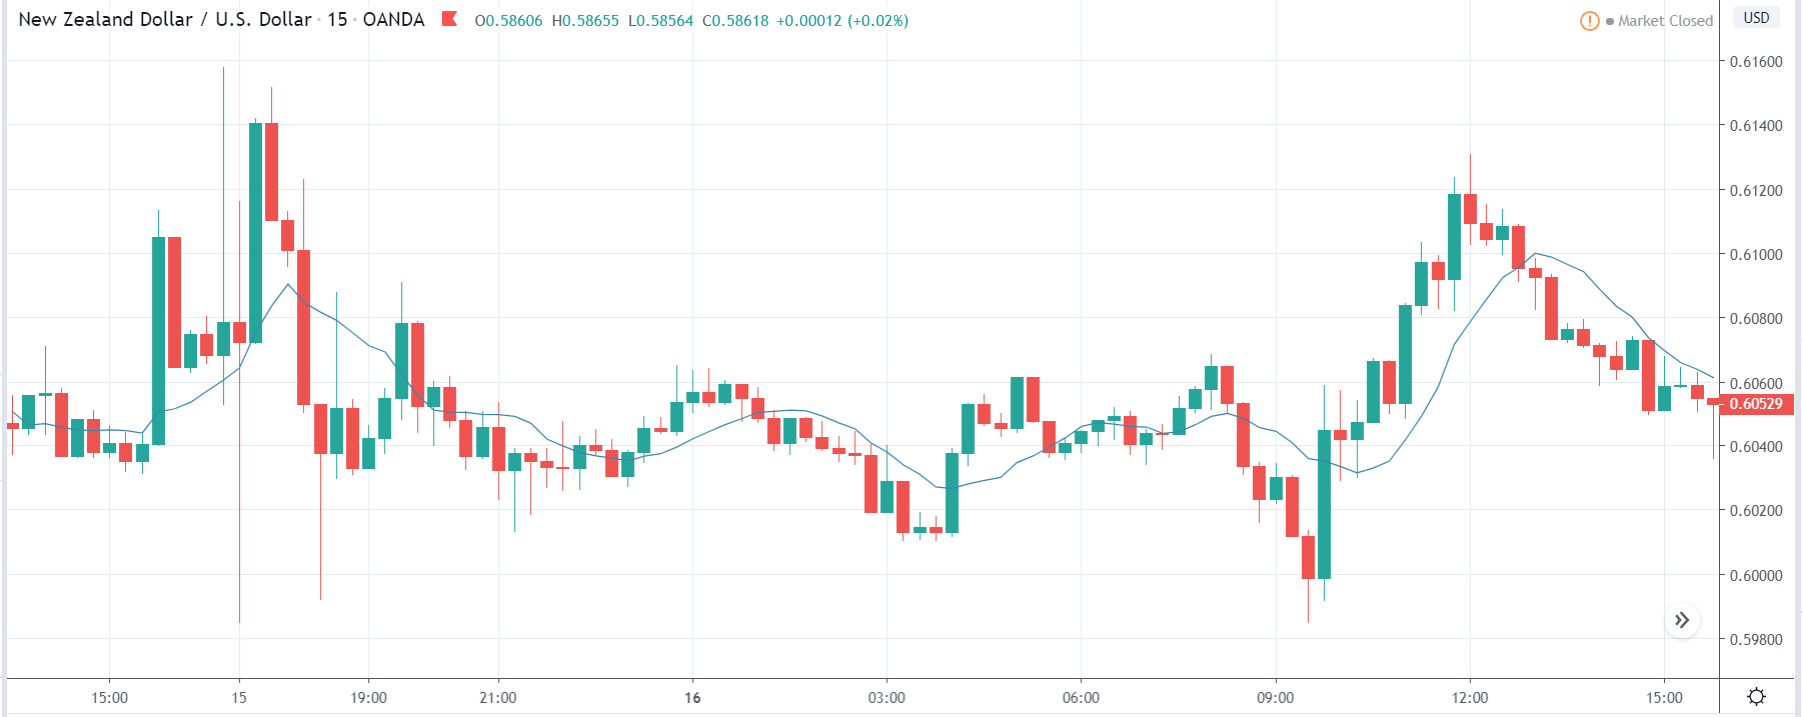
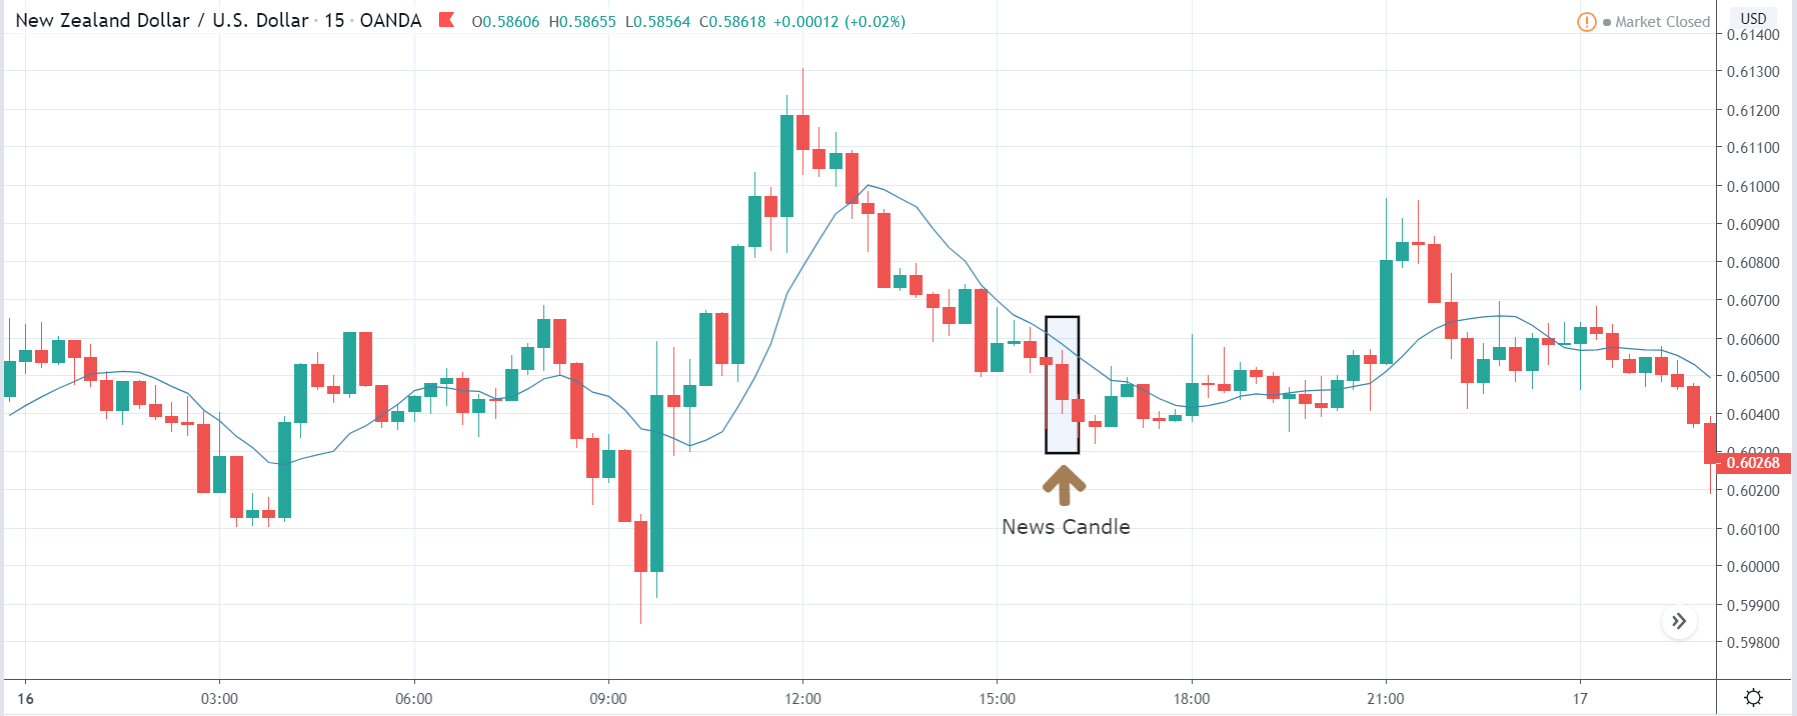
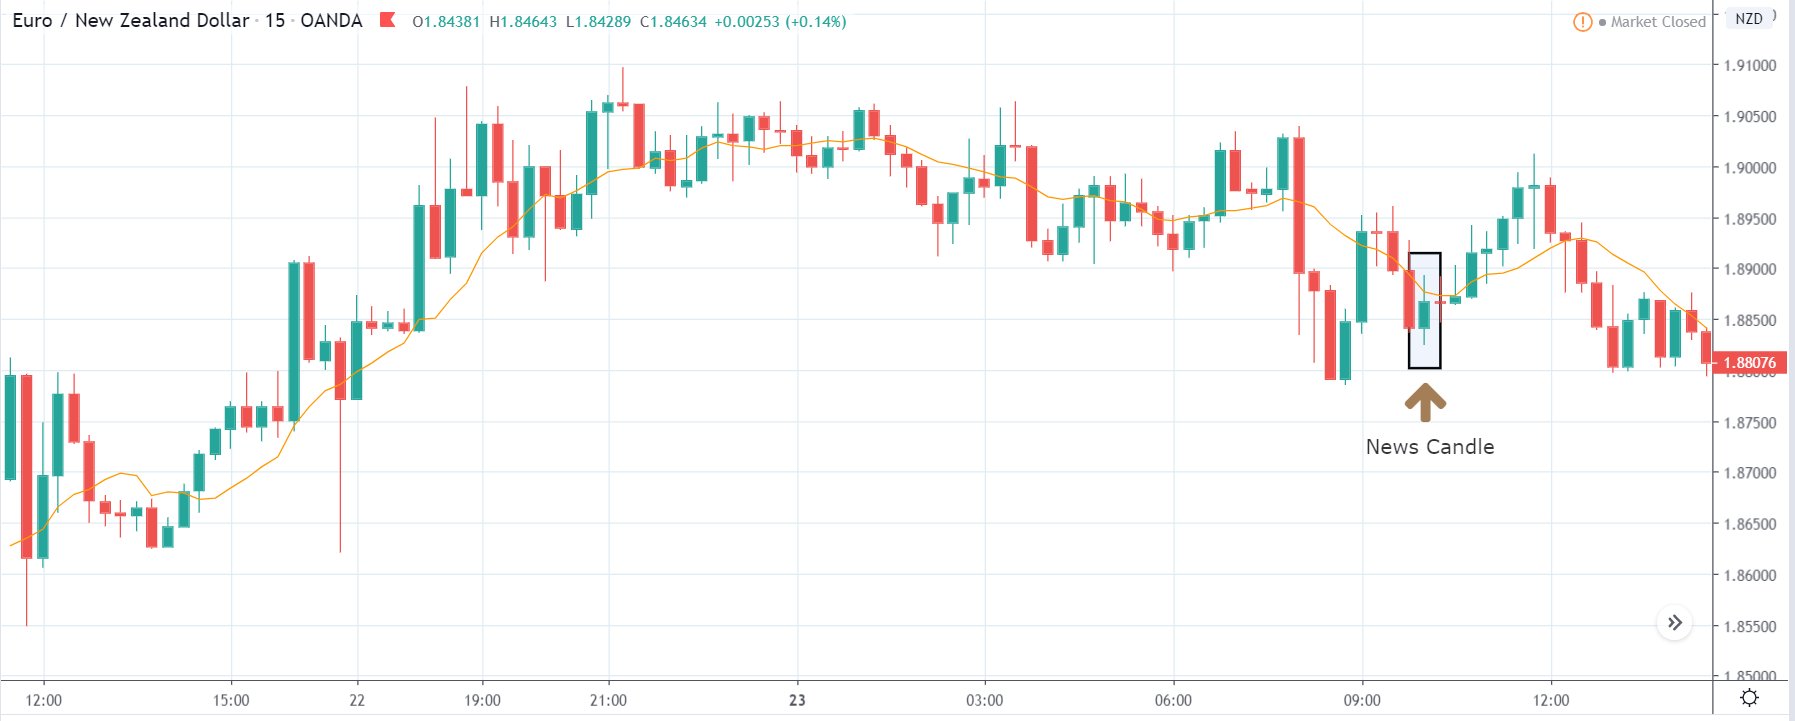
Next, we discuss the NZD/USD currency pair where before the announcement is made, the market is range-bound, and currently, the price is in the middle of the range. Aggressive traders who wish to ‘buy’ the currency pair based on the forecasted data can do so, but they do should be willing to close their positions after the release if there is a huge difference in the actual data.

But as the volatility is high to the downside, it is advised to wait for the news outcome and then trade based on the market reaction. After the news release, traders sell the currency pair owing to wonderful Capital Flows data for the U.S. economy, and here too, the price closes as a bearish candle. Now we are sure that the weakness could be increasing in the pair, and one can take a risk-free ‘short’ trade with a stop-loss above the ‘resistance’ of the range.

That’s about Capital Flows and the impact of its new release on the Foreign Exchange price charts. Let us know if you have any questions in the comments below. Cheers.

Categories
Forex Market Analysis

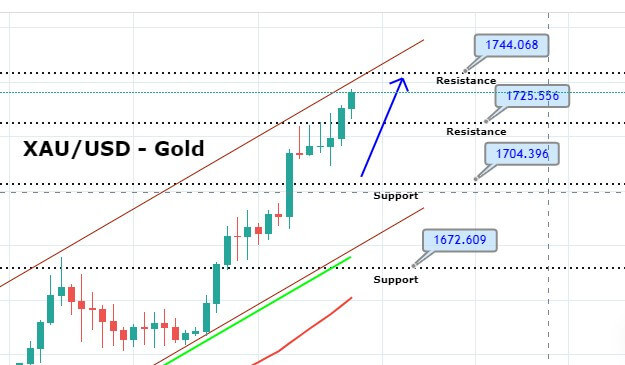
Gold Breakout Upward Channel – Can 50 EMA Support?

On Friday, the gold prices fell sharply from 1,724 level to 1,682 level as the demand for safe have assets faded after headlines from STAT news that Gilead Sciences experimental drug witnessed the fast recoveries in fever and respiratory symptoms which are linked with the coronavirus. 

Finally, there is something positive from COVID 19 viewpoint, and it helped reduce the chaos in the market, driving risk-on sentiment. As in result, the market’s risk-tone remains upbeat and supports the U.S. 10-year treasury yields to improve further and to erase the previous day’s losses, currently near 0.67%.

Whereas, the U.S. dollar continues to lose its buying momentum across the board, as the U.S. stocks futures and the Asian equities are reporting green mainly after the renewed hopes for coronavirus treatment. Thus, this extends bearish pressure for precious metal gold. 

On the other hand, the economic event from China, the world’s second-largest economy, had shown a decline in GDP. Chinese economy contracted 6.8% in the quarter year-on-year, slightly more than expected, and 9.8% from the previous quarter, driving selling bias for the gold.


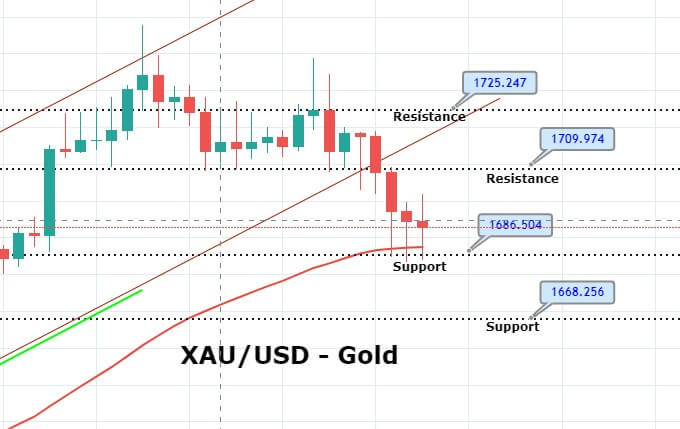
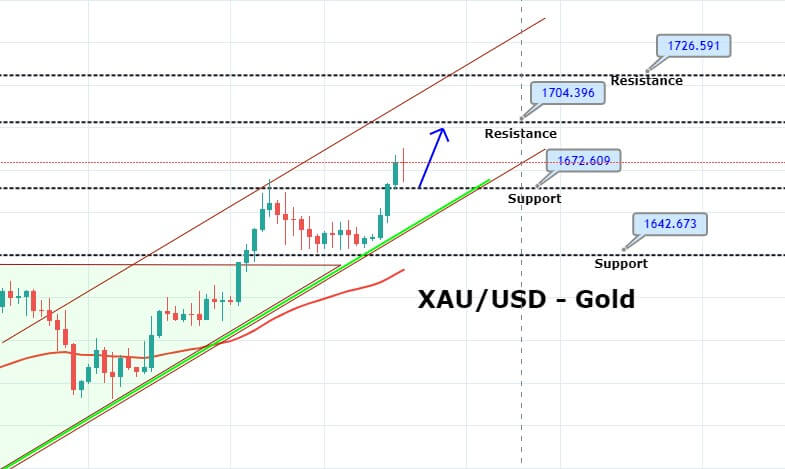
Technically, gold has violated the upward channel, and now it’s trading above 1,685 area. At the same price, the 50 periods EMA is proving it support, and gold has also closed a Doji candle followed by a hammer pattern, which can be seen on the 4-hour chart above. This setup demonstrates that investors are respecting 1,685 support areas, and gold prices may bounce off above this level until the resistance level of 1,700 and 1,709. In contrast, a bearish breakout of 1,685 level can cause further sell-off until 1,668. Good luck! 

Categories
Forex Signals

Ethereum on a Bullish Run – Ascending Triangle In Play!

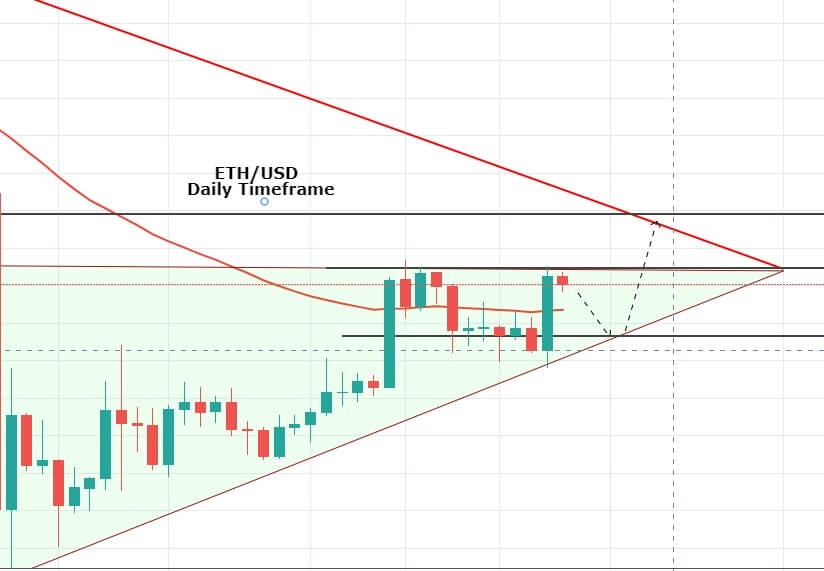
Yesterday on Thursday, the ETH/USD pair had exhibited dramatic bullish momentum on the daily timeframe, which leads Ethereum prices to soar to 174.68 resistance level. With this, the ETH/USD pair formed an ascending triangle pattern, which can be seen on the daily chart, and it is extending substantial resistance around 174.68 along with support at 164.

The support level of 164 is extended bu the 50 periods EMA which is suggesting chances of a bullish trend continuation on the Ethereum while the MACD is also suggesting chances of a bullish trend continuation in the market.


The recent bullish engulfing candle on the daily chart, formed on Thursday, is supporting odds of bullish trend continuation, therefore, the idea will be to place a buy stop above 177.16 with a stop loss below 165.16 and take profit at 192.16.

Trading Plan Summary
Buy Stop: 177.16
Protective Stop: 165.16
Profit Target: 192.16
Risk/Reward Ratio: 1.25

Categories
Forex Fundamental Analysis

‘Consumer Confidence’ & The Impact Of Its News Release On The Forex Price Charts

Introduction

Changes in Consumer Confidence drives macroeconomic indicators like Consumer Spending, which is a significant driver for Gross Domestic Product. Understanding what Consumer Confidence Surveys mean and imply are essential for predicting current and upcoming economic conditions. When understood properly, Consumer Sentiment can give us a hint regarding the direction of economic activity as an advanced or leading indicator.

What is Consumer Confidence?

The Consumer Confidence Statistics reflects the outlook of consumers on the future economic conditions and their financial status. The uniqueness of this indicator lies in the fact that this is a very subjective indicator and may be biased to some extent as it depends largely on the people’s opinion. Two people having the same current job and financial status may give a different outlook on it, but since the scope of the survey is broad, it irons out such exceptions and inconsistencies.

Consumer Confidence reflects how positive or negative people are feeling towards their future in the context of financial security, income, and employment. It is essentially a measure of the Consumer Sentiment in economic and monetary terms.

The numbers shown by Consumer Confidence surveys are not some monetary numbers derived from calculations, but instead, they are opinions rated on a scale in a numeric form similar to how we give a rating to movies on corresponding websites with stars or a ranking from 0-10.

How is Consumer Confidence scaled and assessed?

There are two major survey reports which show Consumer Confidence:

Consumer Confidence Index

It is released monthly by the Conference Board and reflects the general public’s expectations about their economic prospects for the next six months. The Conference Board expertise in these types of surveys (watching Consumer Spending and Buying habits) and take into account a plethora of data and survey information into account (about 5000 households) for their indices. Hence, it is considered a very reliable indicator by many.

Consumer Confidence Index is composed of the Present Situation Index, intended to be a coincident or current economic indicator, and the Expectations Index, expected to indicate future financial health.

Consumer Sentiment Index

The University of Michigan releases a preliminary report on the second Friday and a final report on the fourth Friday of every month. Their Consumer Research center conducts a telephonic survey asking 500 consumers a series of questions on personal finances and their opinions on business conditions. Two components, namely, Expectations Index and Current Conditions Index, make up the questions of Consumer Sentiment Survey.

Is Consumer Confidence necessary for our analysis?

The idea behind Consumer Confidence Surveys is that when consumers are confident of their economic prospects, they will spend more on personal expenses beyond the basic needs. For instance, when you assuredly receive 100$ daily, and the necessary daily requirements are taken care of with 50$. Naturally, we will spend the remaining 50$ for personal enjoyment as the next 50$ take care of tomorrow’s primary needs. In another case, if we were to receive the same 100$ on alternate days, then that money goes only for basic requirements, which cuts off the personal enjoyment expenditure.

Consumer Confidence drives Consumer Spending, which is more than a two-third component of GDP. Consumer Spending is the maker of GDP, and Consumer Confidence is a prime component of Consumer Spending.

How can Consumer Confidence be Used for Analysis?

The University of Michigan’s Consumer Sentiment Index historical data goes back to 1978, which is pretty decent for an economic indicator. Historically it has shown an excellent 85% correlation with the GDP growth rate, and this is a remarkable percentage to rely on these survey indices as leading indicators for the economy’s direction.

A low Consumer Confidence Index is a danger sign showing what is the probable economic crisis ahead in extreme cases. Weak confidence indicates there is a threat to the economy, and a contraction is on its way. Central Authorities may also use this to take corrective measures to change this. On the contrary, A healthy Consumer Confidence Index signals an economic expansion on its way, which stimulates growth and improves the standard of living of the citizens. Consumer Confidence can also be used by businesses to identify recessionary periods and take appropriate steps to minimize their risk and adapt accordingly.

Traders and Investors will always benefit the most from the leading or advanced indicators in comparison to coincident or lagging indicators. With such strong confidence leading indicators, we can significantly reduce our risk on financial investments and come out of trades before the danger signals manifest in the economy or go into the market and ride the economic growth ahead of others.

Sources of Consumer Confidence Indices

The Conference Board, which is a not-for-profit organization, has excellent data analysis for Consumer Confidence Indices. We can go through their surveying methodologies, historical records, samples on their official website. A sample issue of Consumer Confidence Survey pdf file can be found here.

The Michigan Consumer Sentiment Index numbers and corresponding data can be found here. The same is available on the St. Louis FRED website, where we can perform graphical analysis and plot against GDP rates for better understanding.

Impact of the Consumer Confidence news release on the price charts 

After understanding the Consumer Confidence economic indicator, we will now extend our discussion and analyze the impact of the same on the currency. It is a leading indicator that measures the overall economic activity. The reading is compiled after carrying out a survey of about 5000 consumers, which asks them to evaluate future economic prospects. When respondents give high ratings, it shows consumer optimism. Consumer Confidence data does not have a major effect on the monetary policy and the decision of policy-makers. Hence it does not cause severe volatility in the currency pair.

For illustrating the impact, we have considered the Consumer Confidence data of Europe, which is published by the European Commission. The below figure shows the previous, forecasted, and actual Consumer Confidence data in the Euro Zone, which was collected for the month of March. It shows that there was a decrease in the value from the previous month but higher than what was expected. A higher than expected reading is believed to be positive for the currency while a lower than expected reading is considered to be negative.

EUR/AUD | Before The Announcement

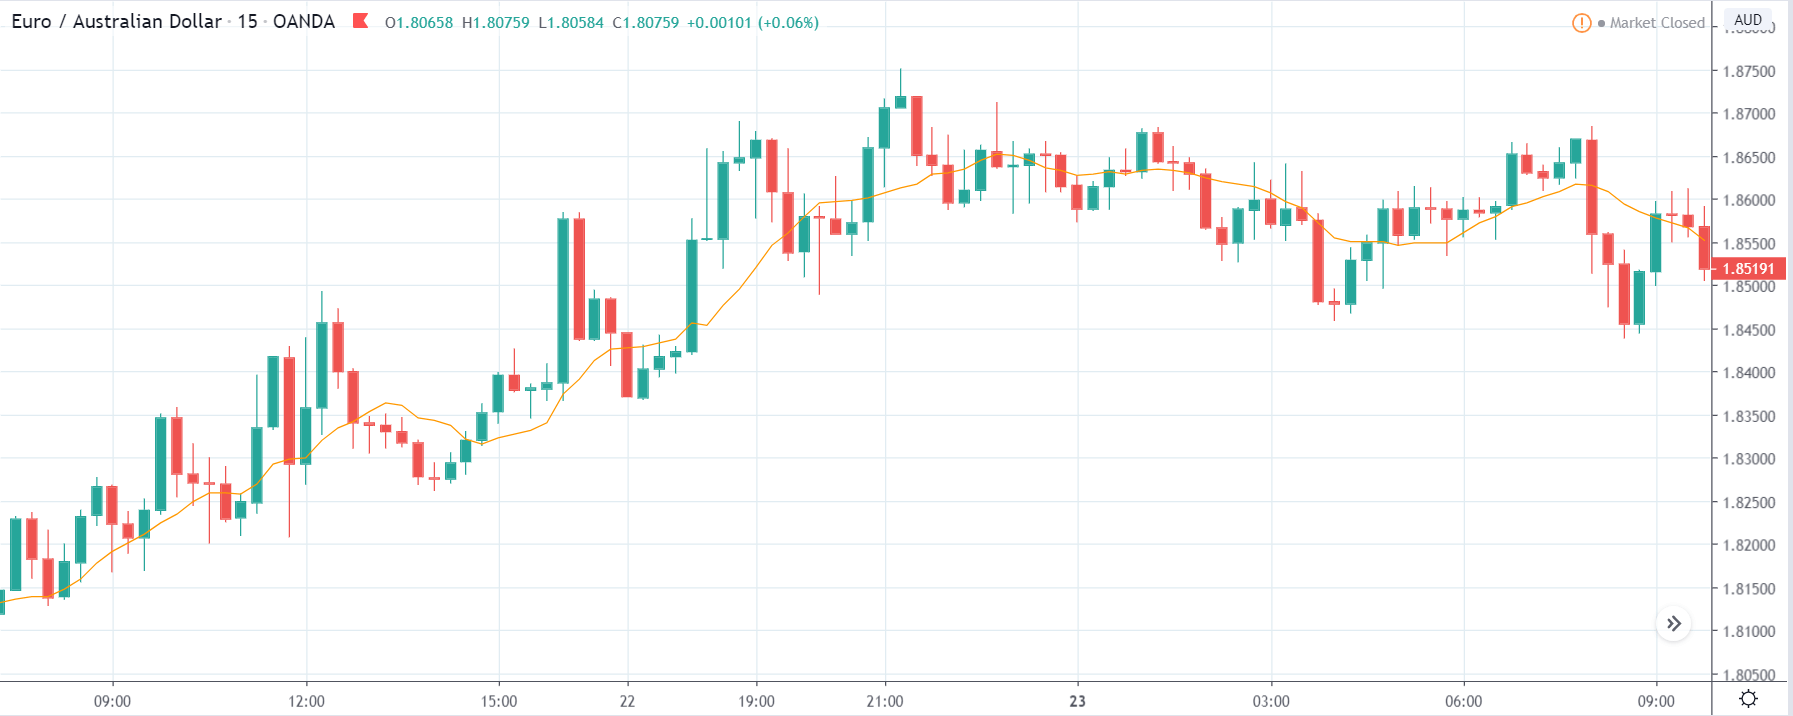
We begin our analysis with EUR/AUD, where the above chart shows the state of the currency pair before the news announcement. We see that the market is moving in a range and currently is at the bottom of the range. Since the impact of the news release is less, we need to rely more on technical analysis and trade based on technical indicators, rather than on the outcome of the news. Technically we are at the bottom of the range, so positive Consumer Confidence data is the ideal case for going ‘long’ in the currency pair.   

EUR/AUD | After The Announcement

After the Consumer Confidence data is released, volatility in the market increases on both sides, and the candle closes, forming a ‘Doji’ pattern. The reason behind this indecision is that the Consumer Confidence numbers were better than before but lesser than the forecasted numbers. Some traders took this to be positive, while some felt the numbers were not too great. From the trading point of view, since the market does not break the ‘support’ area, one can enter for a ‘buy’ with a ‘take-profit’ near the ‘resistance’ area.

EUR/JPY | Before The Announcement


EUR/JPY | After The Announcement

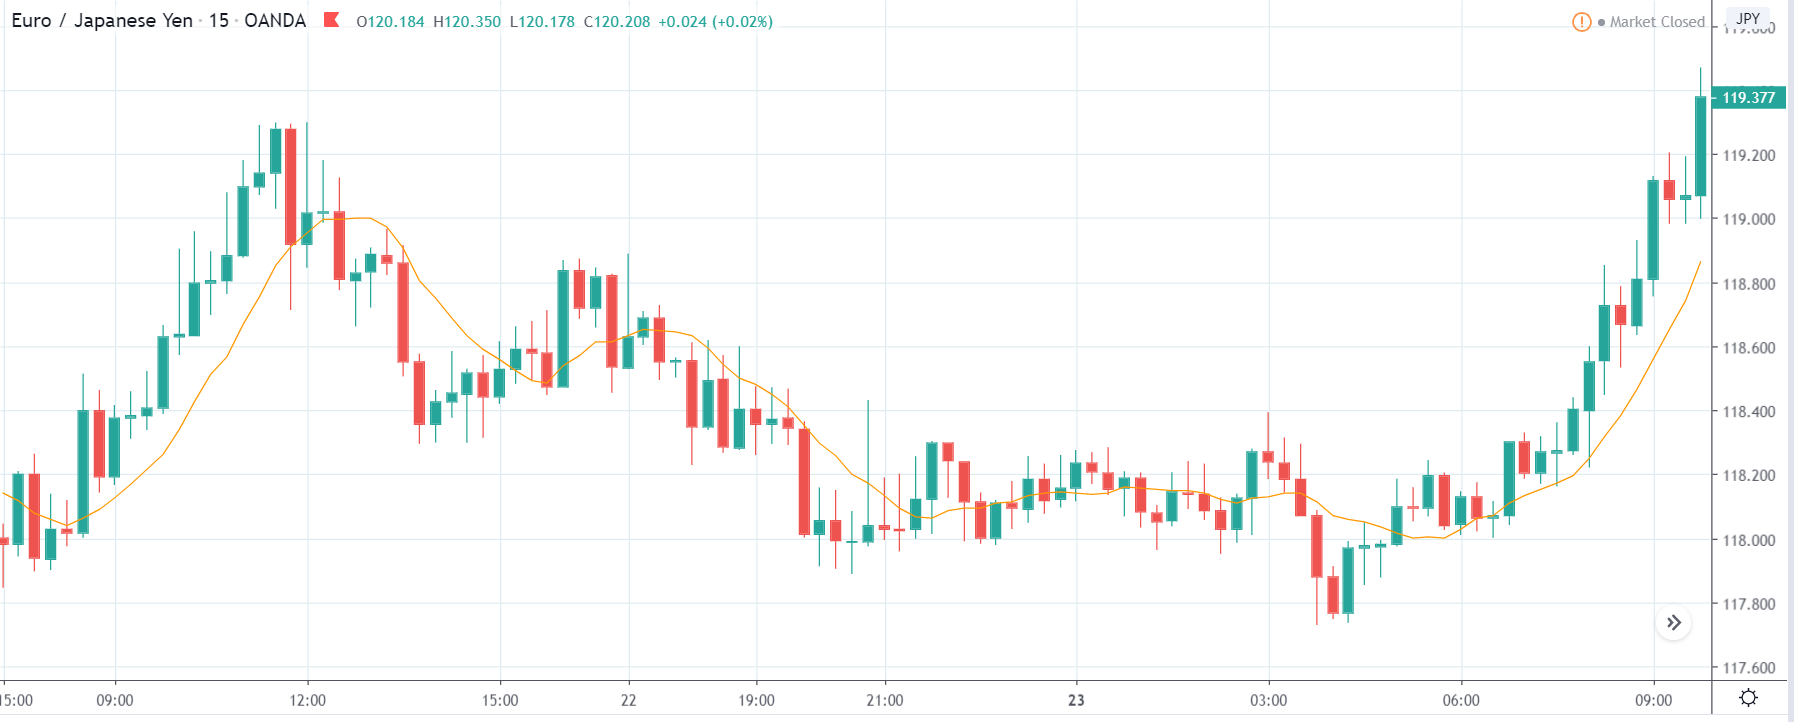
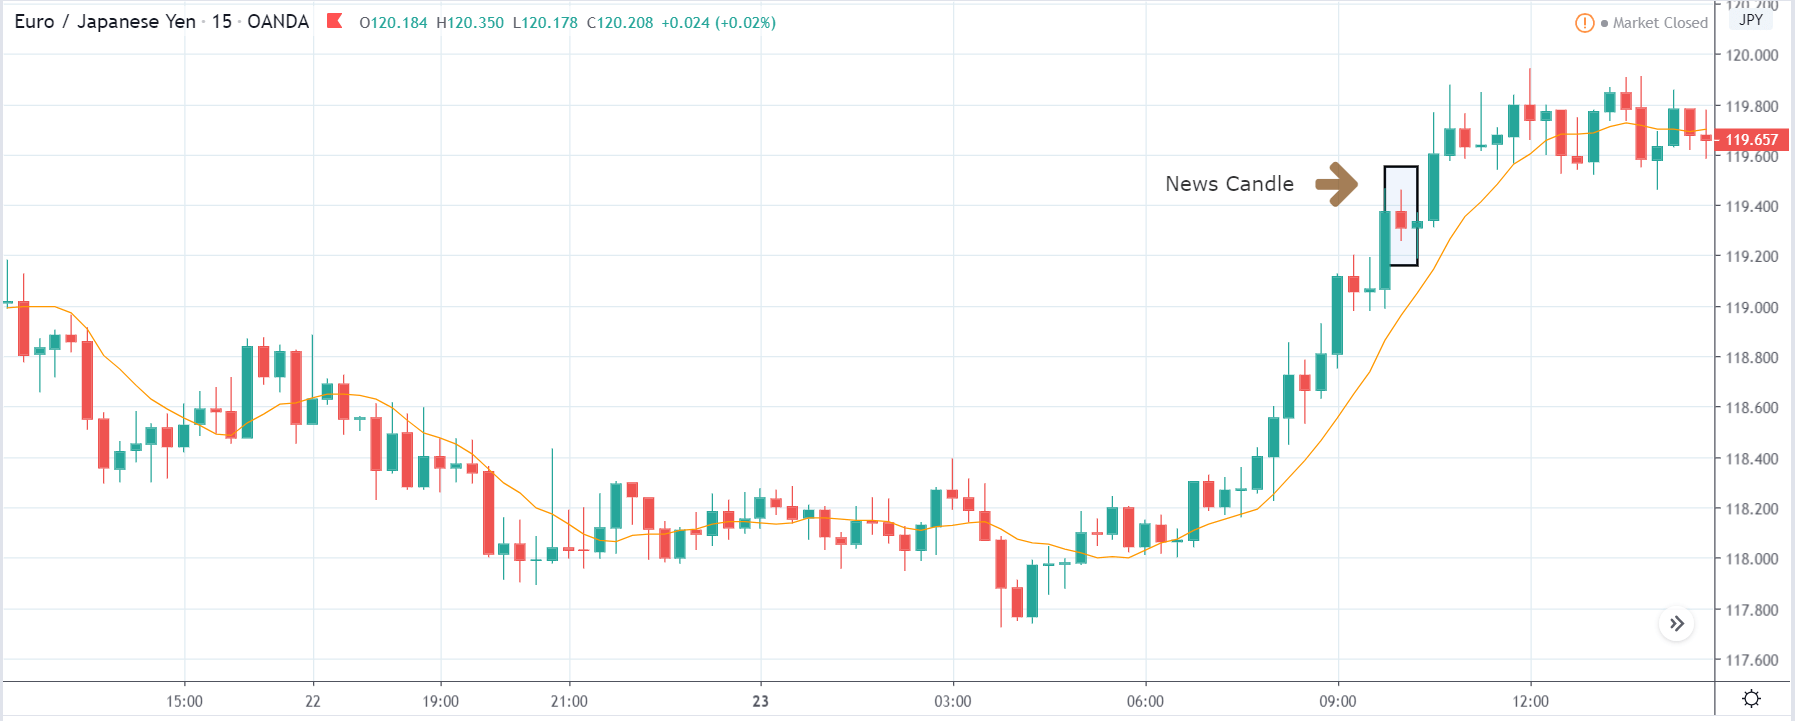
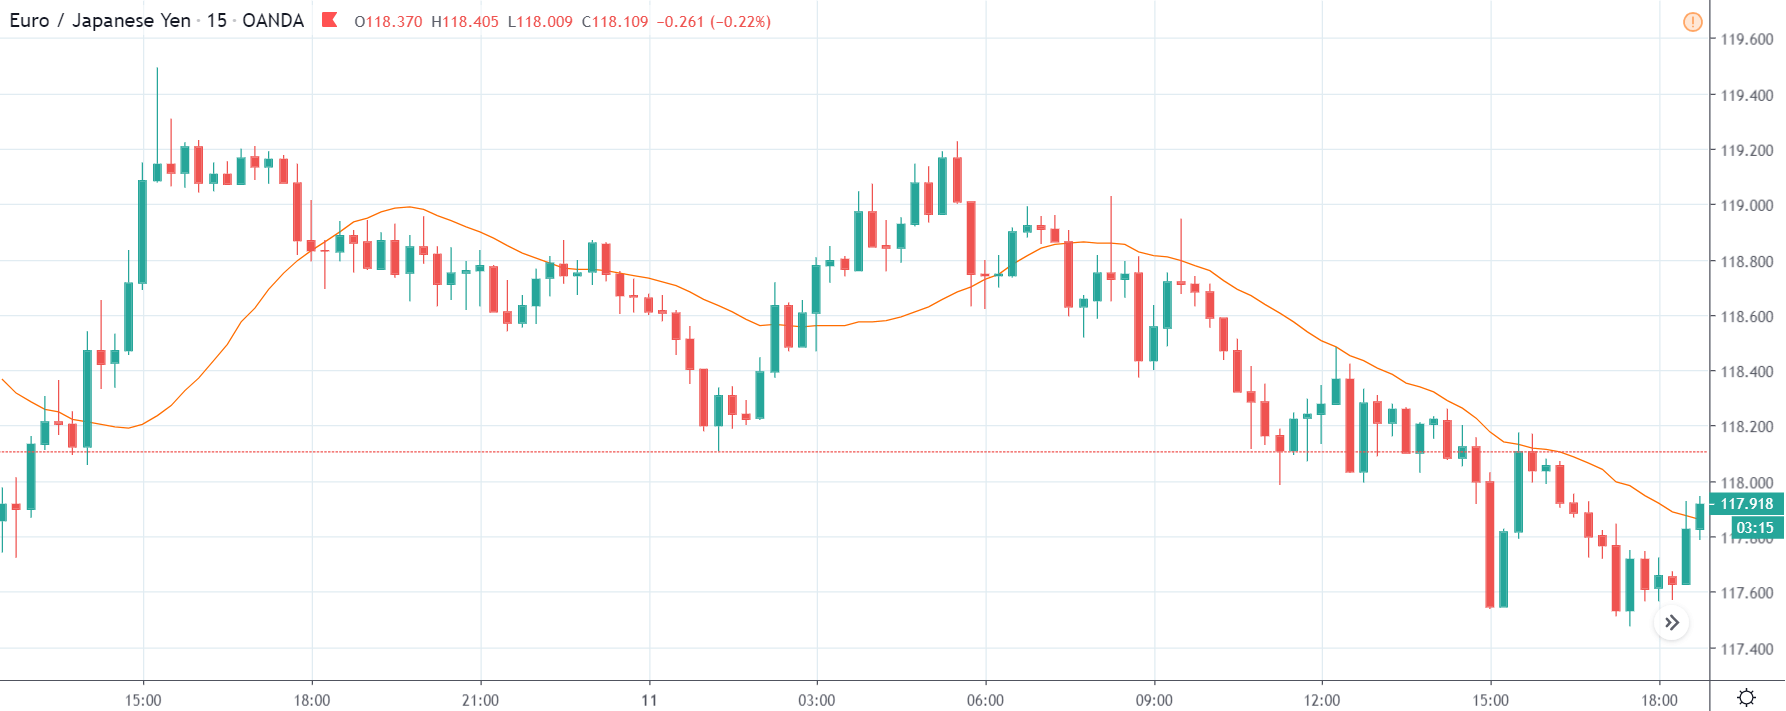
The above images represent the EUR/JPY currency pair, and the characteristics of this pair appear to be very different from that of the above-discussed pair. Before the announcement, the market is in a strong uptrend and currently at a point from where the market had reversed earlier. As the market is at a critical point, it is better to wait for the Consumer Confidence data and then trade based on the change in volatility.

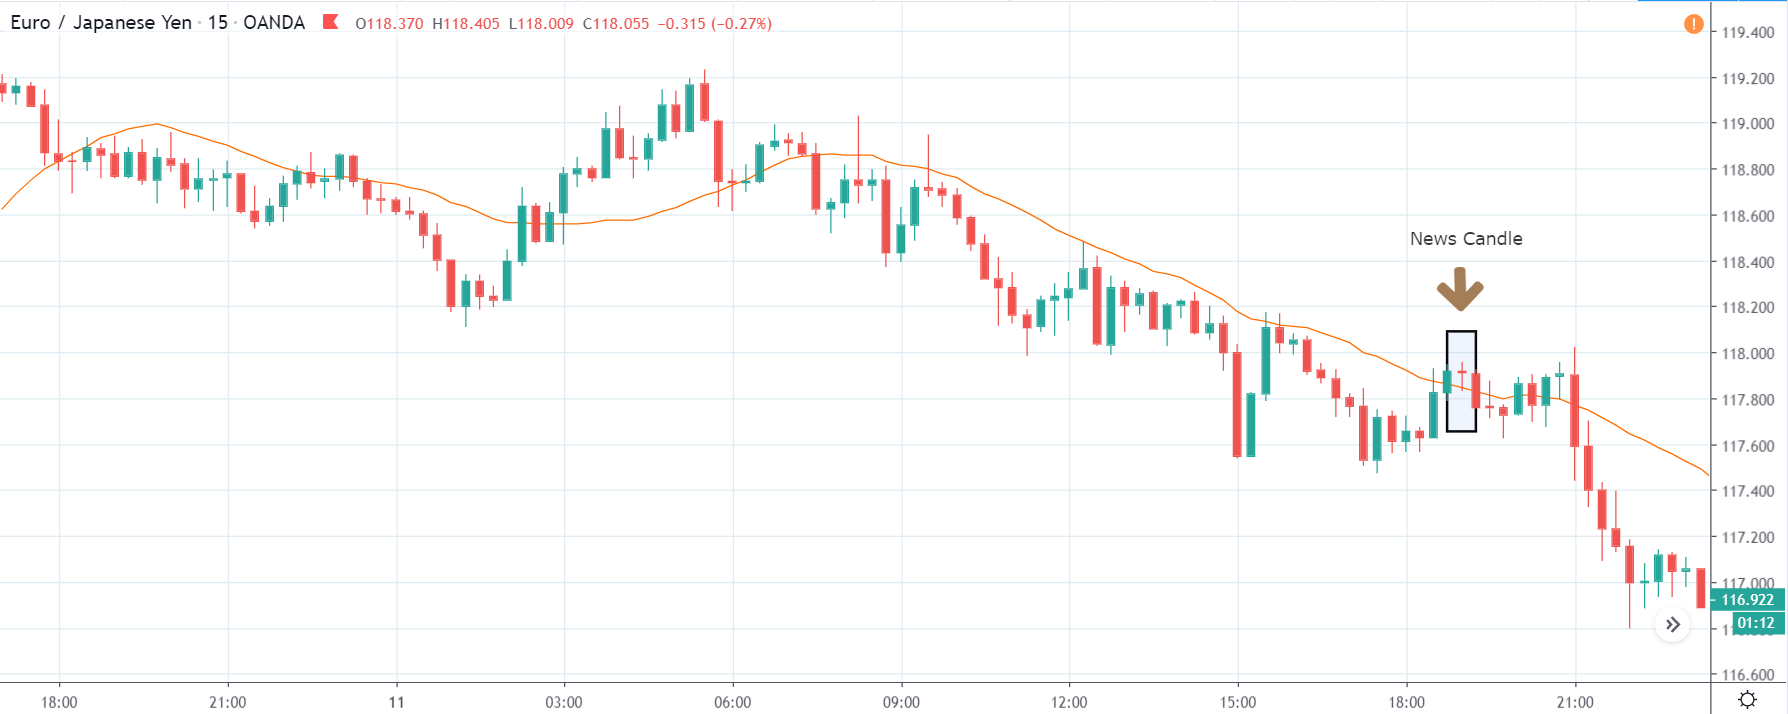
After the news release, the price initially goes up but later gets sold into and closes in red. We need to note here that even though the market reaction was bearish, the price did not break the moving average. Instead, volatility increases on the upside and results in a continuation of the trend. One can trade the above pair after price retracement to an appropriate Fibonacci level and then taking a ‘buy.’

EUR/NZD | Before The Announcement 

EUR/NZD | After The Announcement

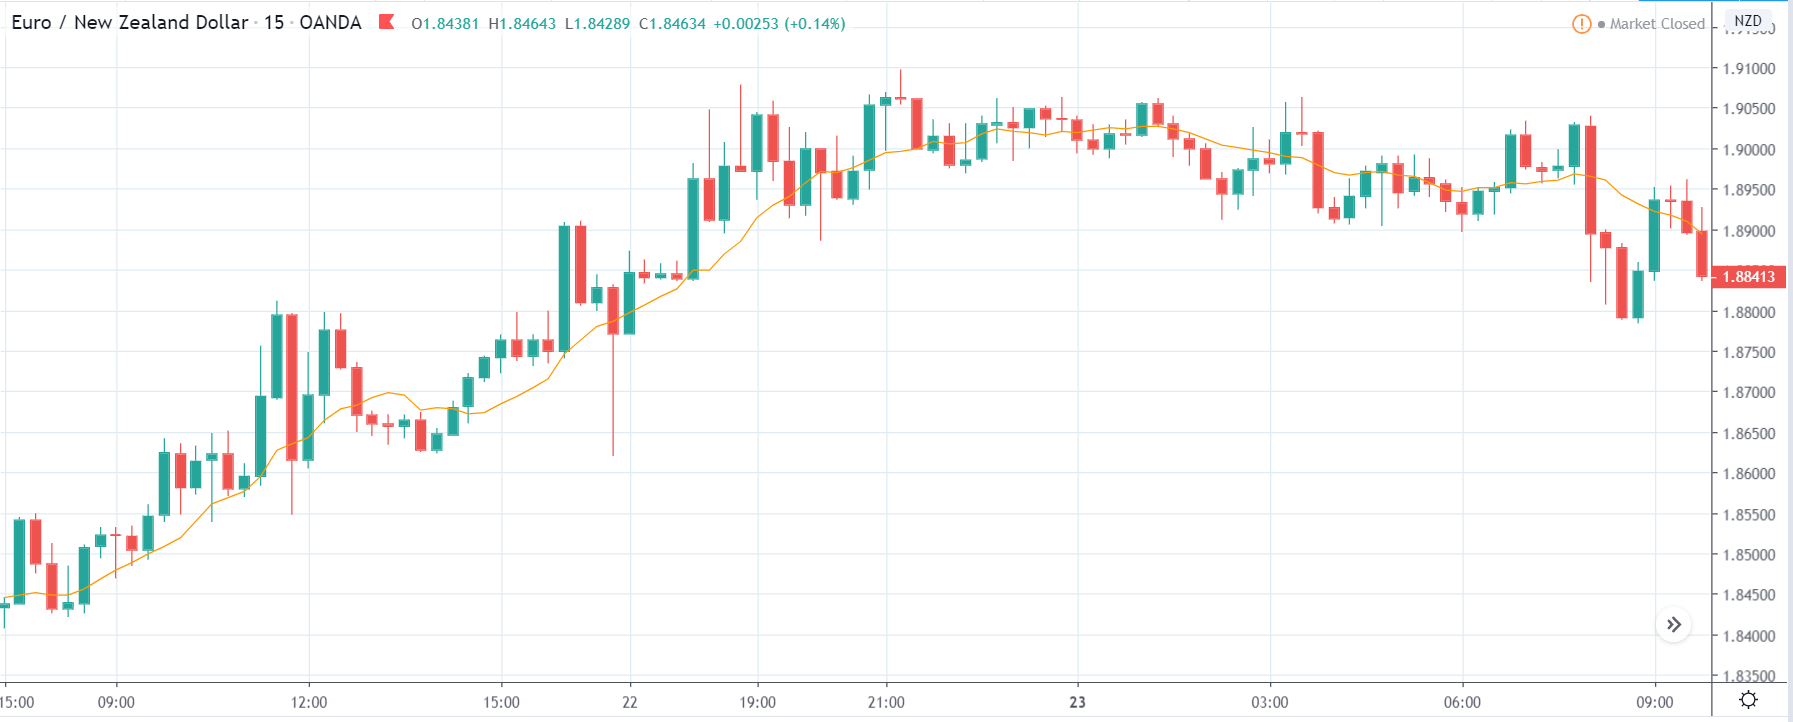
Now we shall discuss the impact of Consumer Confidence data on EUR/NZD currency pair. The behavior of the chart is similar to that of the EUR/AUD pair where here also the price is moving within a range, and recently the price has broken below the range. Since the selling pressure has increased, it can be risky to go ‘long’ in the market, even if the data proves to be positive for the economy.

After the news release, the market moves higher as a consequence of positive Consumer Confidence data, and the price closes, forming a bullish candle. As mentioned earlier, going ‘long’ can be risky due to the increased selling pressure, and thus conservative traders should not take such trades. Another reason why the up move might not be sustainable is that the impact of Consumer Confidence data on currency is not as much.

That’s about Consumer Confidence and its impact on the Forex Market. Let us know if you have any questions in the comments below. Cheers.
Categories
Forex Course

102. Brief Introduction To Momentum Indicators

Introduction

Leading and lagging indicators are not the only categorizations of technical indicators. If we dig deeper, we can find more classifications and momentum indicators are one such classification in leading indicators. Before getting into momentum indicators, let’s first define the term momentum. Momentum, in general (physics), is the product of mass and velocity. The meaning of momentum is not different in trading too.

What are the Momentum Indicators?

Momentum indicators are a type of indicator that determines the velocity or the rate at which the price changes in security. Unlike moving averages, they don’t depict the direction of the market, only the rate of price change in any timeframe.

Calculating Momentum

The formula for the momentum indicators compares the most recent close price with the close price of a user-specified time frame. These indicators are displayed as a separate line and not on the price line or bar. Calculating momentum is simple. There are two variations to it but are quite similar. In both, momentum is obtained by the comparison between the latest closing price and a closing price ‘n’ periods from the past. The ‘n’ value must be set by the user.

1) Momentum = Current close price – ‘n’ period close price

2) Momentum = (Current close price / ‘n’ period close price) x 100

The first formula simply takes the difference between the closing prices while the second version calculates the rate of change in price and is expressed as a percentage.

When the market is moving upside or downside, the momentum indicator determines how strongly the move is happening. A positive number in the first version determines strength in the market towards the upside, while a negative number signifies bearish strength.

How are Momentum Indicators useful?

As mentioned, momentum indicators show/predict the strength of the movement in prices, regardless of the direction, be it up or down. Reversals are trades where one can make a massive killing with it. And momentum indicators help traders find spots where there is a possibility of the market to reverse. This is determined using a concept called divergence, which is discussed in the subsequent section.

Momentum indicators are specifically designed to show the relative strength of the buyers and sellers. If these indicators are combined with indicators that determine the direction of the market, it could turn out to be a complete strategy.

Concept of Divergence

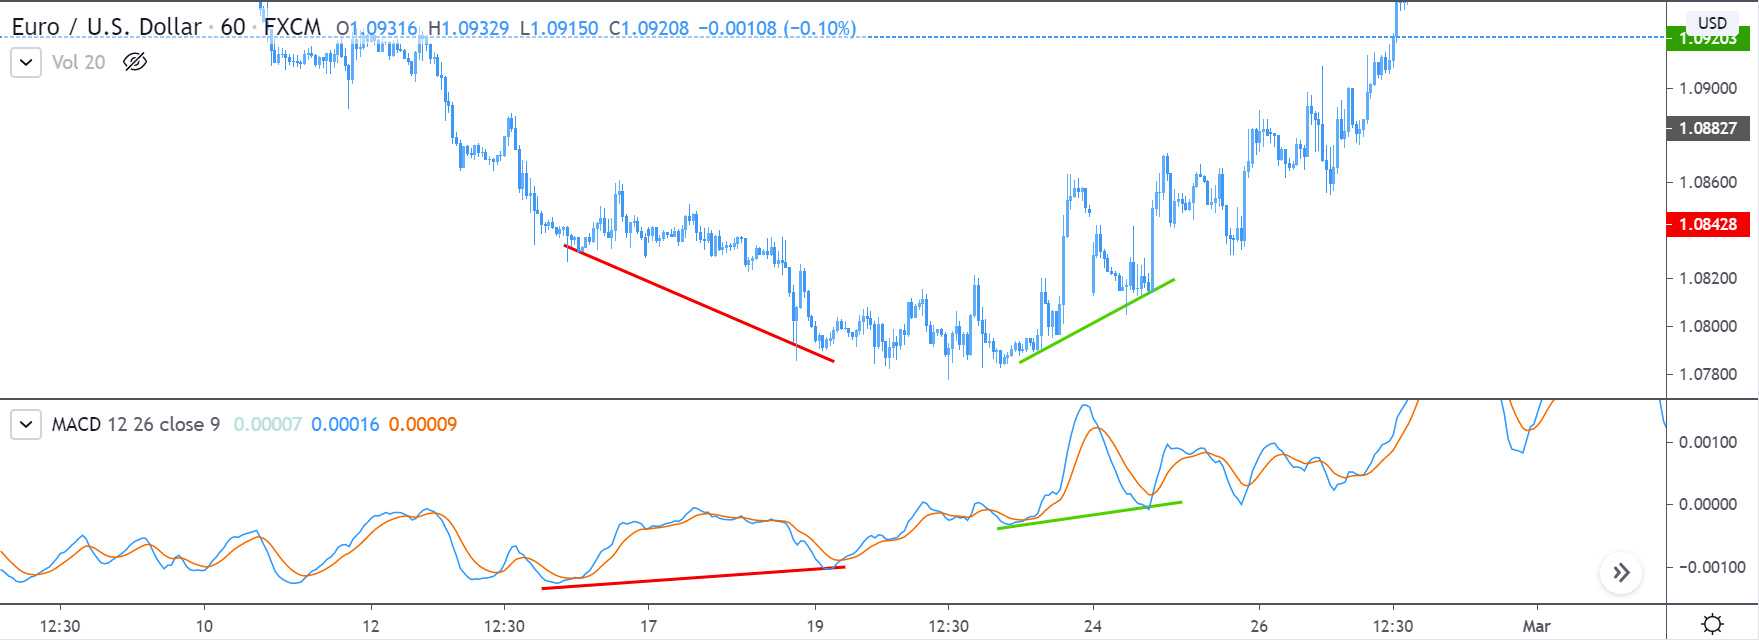
Consider the chart of EUR/USD given below. The MACD indicator (momentum indicator) is plotted as well. From the price chart, the market was in a downtrend, but the divergence was moving upward. It means that the indicator has diverged from the price chart and is indicating that the sellers are losing strength.

In hindsight, the market reversed its direction and started to move upwards. Hence, the MACD predicted the reversal in the market. Moving forward, when the market laid its first higher low, the MACD too was inclined upwards, indicating that the buyers are strong, and the uptrend is real. And yet again, the MACD proved itself right.

This concludes the lesson on momentum indicators. In the coming lessons, let’s get more insights over this topic. Don’t forget to take the below quiz before you go.

[wp_quiz id=”70612″]
Categories
Forex Assets

Asset Analysis – Exploring The GBP/AED Forex Currency Pair

Introduction

We all know that official currencies of the two countries are paired for being exchanged in reference to each other. In GBP/AED, GBP stands for the British pound sterling, and it is is the official currency of the United Kingdom. It is also the 4th most traded currency in the Forex Market and stands right after USD, EURO and YEN. Whereas the AED is known as the United Arab Emirates Dirham, and it is the official currency of the UAE.

GBP/AED

GBP/AED is the abbreviation of the Pound sterling against the Emirati Dirhams. In currency pairs, the first currency is the base currency, while the second currency is the quote currency. In this case, GBP is the base currency, and AED is the quote currency.

Understanding GBP/AED

In the Forex market, if the base currency’s value goes down, the value of the quote currency goes up and vice versa. Also, when we buy a currency pair, we buy the base currency and implicitly sell the quote currency.

The market value of GBP/AED determines the strength of AED against the GBP that can be easily understood as 1GBP is equal to how much AED. So if the exchange rate for the pair GBP/AED is 4.5748, it means that we need 4.5748 AED to buy 1 GBP.

Spread

Forex brokers have two different prices for currency pairs: the bid and ask price. The bid price is the selling price, and ask is the buy price. The difference between the ask and the bid price is called the spread. Spread is basically a type of commission by which brokers make their money. Below are the ECN and STP spread values for the GBP/AED pair.

ECN: 27 pips | STP: 30 pips

Fees

Each time we place a trade, we need to pay some commission on it. A Fee is simply that commission we pay to the broker for opening a particular position. The fee also varies from the type of broker we use; for example, there is no fee on STP account models, but a few pips on ECN accounts.

Slippage

Slippage refers to the difference between the trader’s expected price and the actual price at which the trade is executed. It can occur at any time but mostly happens when the market is fast-moving and volatile. Also, it occurs at the times when we place a large number of orders at the same time.

Trading Range in GBP/AED

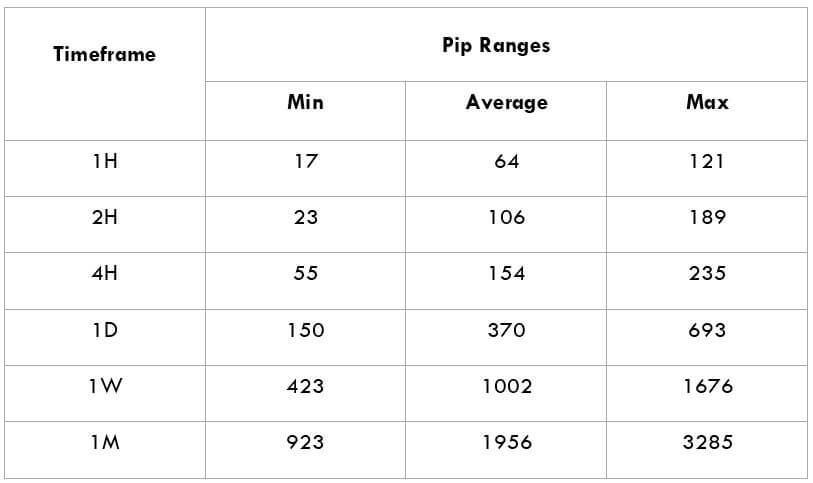
The trading range here is to measure the volatility of the GBP/AED pair. Whether we make a profit or loss in a given time period depends on the movement of a currency pair that can be assessed using the trading range table. It is a representation of the minimum, average, and maximum pip movement in a currency pair. This can be evaluated simply by using the ATR indicator combined with 200-period SMA.

Procedure to assess Pip Ranges

  1. Add the ATR indicator to your chart
  2. Set the period to 1
  3. Add a 200-period SMA to this indicator
  4. Shrink the chart so you can assess a significant period
  5. Select your desired timeframe
  6. Measure the floor level and set this value as the min
  7. Measure the level of the 200-period SMA and set this as the average
  8. Measure the peak levels and set this as Max.

GBP/AED Cost as a Percent of the Trading Range

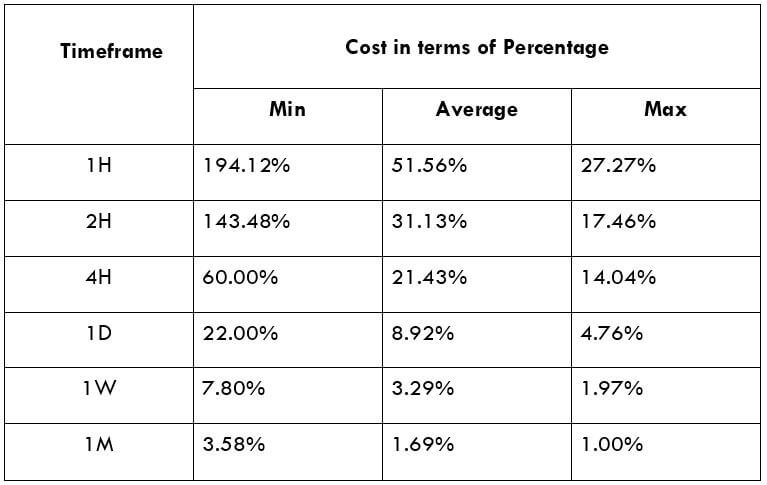
The cost of trade mostly depends on the broker and varies based on the volatility of the market. This is because the total cost involves slippage and spreads apart from the trading fee. Below is the representation of the cost variation in terms of percentages. The comprehension of it is discussed in the following sections. We will look into both the ECN model and the STP model.

ECN Model Account

Spread = 27 | Slippage = 3 |Trading fee = 5

Total cost = Slippage + Spread + Trading Fee = 3 + 27 + 5 = 35

STP Model Account

Spread = 30| Slippage = 3 | Trading fee = 0

Total cost = Slippage + Spread + Trading Fee = 3 + 30 + 0 = 33

Trading the GBP/AED

The GBP/AED is an exotic-cross currency pair and is mostly ranging. The volatility of this currency pair is on the lower side. As seen in the Range table, the average pip movement on the 1-hour time frame is only 64. This clearly shows that if we trade in this pair, we will have to wait for a more extended period of time to get some good profit because of such a less movement in the pips.

Note that the higher the volatility, the lower the cost of the trade. However, this is not an advantage as it is risky to trade highly volatile markets. Let’s take, for example, in the 1M time frame, the Maximum pip range value is 3825, and the minimum is 923. When we compare the fees for both the pip movements, we find that for a 923 pip movement, the fee is 3.79%, and for 3825pip movement, fess is only 1.07%.

So, we can confirm that the prices are higher for low volatile markets and low for highly volatile markets. It is safe to trade when the volatility is around the average values, but experienced traders who strictly follow money management can trade the volatile markets as the cost of trade is less there. Cheers!

Categories
Forex Market Analysis

Daily F.X. Analysis, April 17 – Top Trade Setups In Forex – Risk-on Sentiment In Play! 

On the forex front, the U.S. dollar strengthened against its major peers for a second straight session, with the ICE Dollar Index gaining 0.3% on the day to 99.93. Today, eyes will remain on the European Commission as it will post final readings of March CPI (+1.0% on-year expected). In the U.S., the Conference Board will release its Leading Index for March (-7.1% on month expected).

Economic Events to Watch Today     


EUR/USD – Daily Analysis

The EUR/USD fell 0.4% to a week-low of 1.0862. Official data reported that the Euro zone’s industrial production slipped 0.1% on month in February as expected). The European Commission will post final readings of March CPI (+1.0% on-year expected).

The official data which is scheduled to release at 09:00 GMT is expected to show that Eurozone’s industrial production decreased by 0.2% month-on-month in February. 

European stocks stabilized after a 3% loss in the prior session, with the Stoxx Europe 600 Index rising 0.6%. Germany’s DAX increased by 0.2%, the U.K.’s FTSE 100 climbed 0.6% while France’s CAC was little changed.

Markets are now concerned about extended lockdowns indicating a deeper economic recession than previously forecasted. Moving on, the market sentiment is expected to stay pro-risk during the day ahead. 

As in result, the EUR/USD currency pair could continue to gain altitude. At the data front, the Eurozone Consumer Price Index (CPI) is scheduled for release, while the U.S. data calendar is thin with just Baker Hughes US Oil Rig Count number expected to release at 17:00 GMT. 

Daily Support and Resistance  

  • S1 1.0684
  • S2 1.0772
  • S3 1.0815

Pivot Point 1.086

  • R1 1.0904
  • R2 1.0949
  • R3 1.1037

EUR/USD– Trading Tips

The EUR/USD is trading bearish at 1.0835, exhibiting a bearish crossover below 50 EMA, which is now extending resistance around 1.0903 level. Continuation of a selling trend below 1.0903 level can extend selling until the next support area of 1.0772. 

On Friday, the EUR/USD is likely to find support around 1.0772, but below this, the next support prevails around 1.0652 level. At this moment, the EUR/USD is holding at 1.0835, having an immediate resistance level of around 1.09230, where the bullish breakout of this level can extend buying until the next resistance level of 1.1036. Conversely, we should look for selling trades below 1.0870.

GBP/USD– Daily Analysis

GBP/USD dropped 0.8% to 1.2523 and consolidated in the range between the 1.2604 – 1.2450. However, the currency pair traders did not give any major attention to the coronavirus (COVID-19) crisis at home because the cases are comparatively more significant in the U.S. 

At the U.K. Crisis front, the United Kingdoms’ coronavirus death toll rose above 11,000. Still, the buyers are ignoring this probably because the death toll is comparatively larger in the U.S. almost 20,000 deaths have been registered so far. The GBP/USD is exhibiting selling bias in the wake of a stronger dollar. 

The U.S. official data showed that Initial Jobless Claims declined to 5.245 million for the week ended April 11 (5.500 million expected), and Housing Starts fell to an annualized rate of 1.216 million units in March (1.300 million units expected). Later today, the Conference Board U.S. Leading Index will be reported (-7.2% on month in March expected).

Later today, eyes will be on the U.S., the Conference Board will release its Leading Index for March (-7.1% on month expected) to determine further bias in the pair.

Daily Support and Resistance

  • S1 1.2181
  • S2 1.2353
  • S3 1.244

Pivot Point 1.2525

  • R1 1.2612
  • R2 1.2697
  • R3 1.2869

GBP/USD– Trading Tip

On Friday, GBP/USD is trading with a neutral bias over 1.2450 support areas to trade around 1.2486. The GBP/USD pair is likely to find support around 1.2450, which is extended by the triple top level, which got violated on the previous Friday.

On the 4-hour chart, the GBP/USD has formed a small bullish channel, which is likely to extend bullish bias for the pair. The 50 periods EMA is also keeping the GBP/USD pair supported around 1.2450. Thus, the bounce off above this level can lead the GBP/USD pair towards the next resistance level of 1.2657. While bearish breakout of 1.2460 can open up further room for selling until the next support area of 1.2220. 

USD/JPY – Daily Analysis

The USD/JPY pair is flashing red and struggling towards above 108.00 level, mainly due to the broad-based U.S. dollar weakness in the wake of risk-on market sentiment. In the meantime, the weaker safe-haven Japanese yen keeps the pair supportive and turned out to be one of the key data that placed a lid on any additional losses in the currency pair, at least for now. 

Currently, the USD/JPY pair is trading at 107.81 and consolidates in the range between the 107.64 – 108.08. At the USD front, the U.S. dollar continues to lose its buying momentum across the board, as the U.S. stocks futures and the Asian equities are flashing green mainly after the renewed hopes for coronavirus treatment. 

The greenback that tracks the greenback against a basket of other currencies dropped 0.25% to 99.862. It should be noted that the investors failed to prefer the greenback, which is traditionally viewed as a safe-haven, mainly because of the United States President Donald Trump’s step to reopening the economy, which could continue to add bullish pressure around the equities during the day ahead. 

Daily Support and Resistance    

  • S1 105.92
  • S2 106.84
  • S3 107.44

Pivot Point 107.76

  • R1 108.36
  • R2 108.69
  • R3 109.61

USD/JPY – Trading Tips

The technical side of the USD/JPY has not changed much as it’s price continues to hold above the triple bottom area of 107.039. The MACD and 50 periods of EMA are suggesting bearish bias. Therefore, a downward breakout of this level can extend selling until 105.300, while the resistance holds around 108.640. We should look for selling trades below 107 to target 106.630, and buying can be seen above the same 107.360 level today.  

All the best for today! 

Categories
Forex Price-Action Strategies

Price Action Trading: The Morning Star at a Breakout Level

Breakout is the first thing that attracts the price action traders to keep eying on a chart. Then, correction/consolidation followed by reversal candle breaching consolidation support/resistance is the signal to trigger an entry.

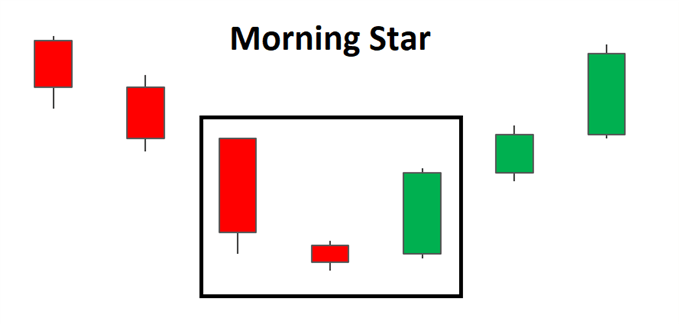
The breakout level plays an important role, which often becomes consolidation support/resistance and produces the reversal candle. Sometimes a breakout level produces even stronger reversal patterns such as Morning Star and Evening Star. When that happens, it attracts more traders and brings more liquidity. In today’s lesson, we are going to demonstrate an example where the breakout level holds the price as support; produces the Morning Star to offer a long entry. Let us get started.

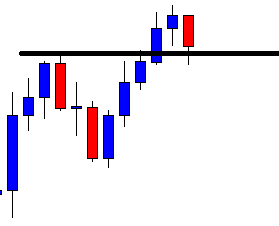
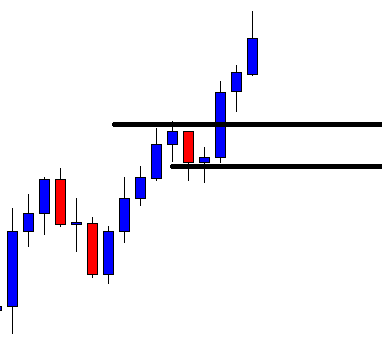
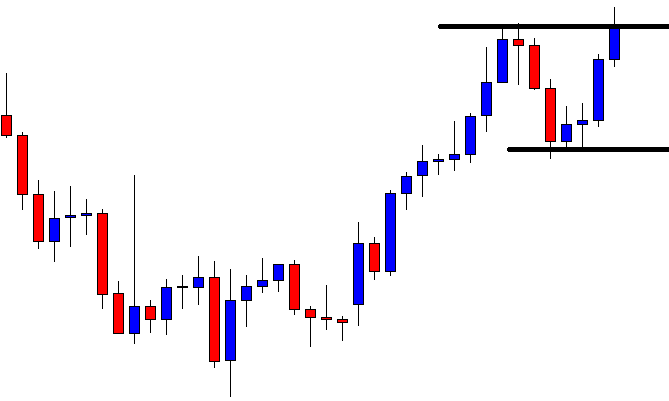
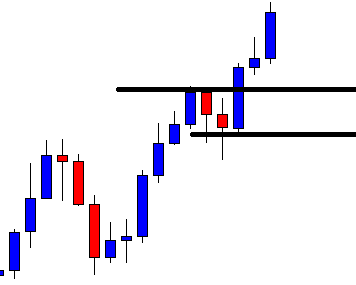
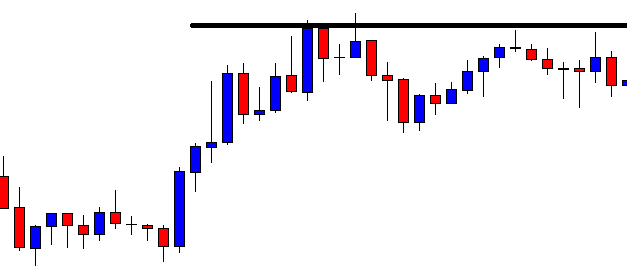
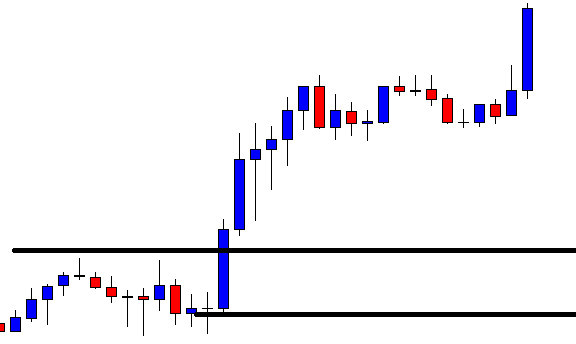
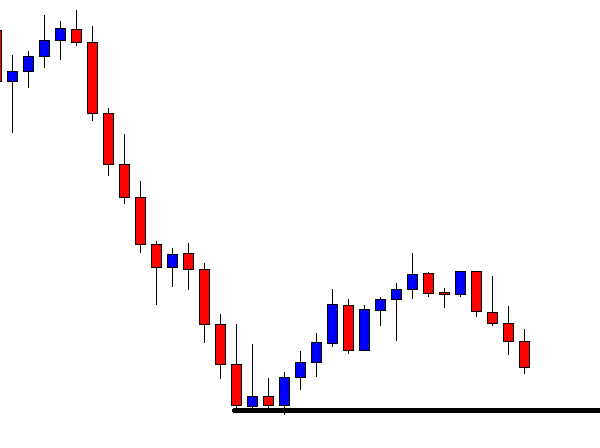
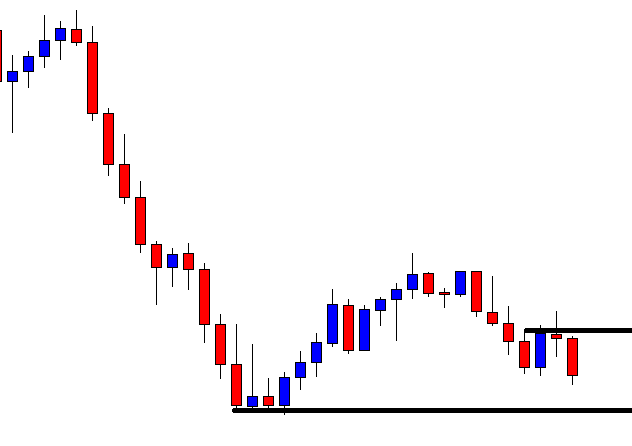
The chart shows that the price heads towards the North with good bullish momentum. On its way, it makes a breakout at the highest high. The pair then produces a bearish reversal candle to consolidate around the breakout level. The buyers are to keep an eye on this chart. If the breakout level produces a bullish engulfing candle closing well above consolidation resistance, they may trigger a long entry.

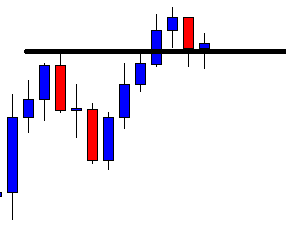
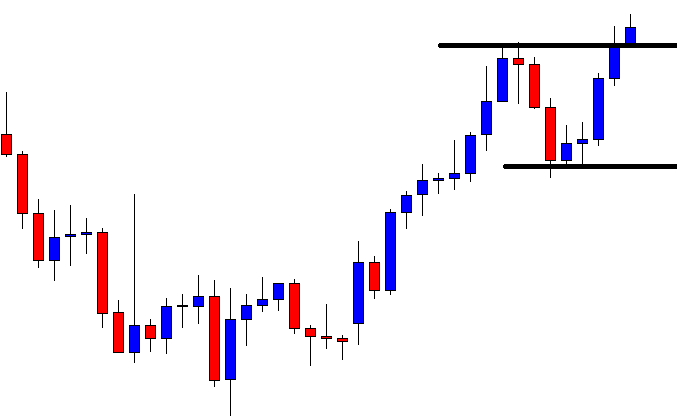
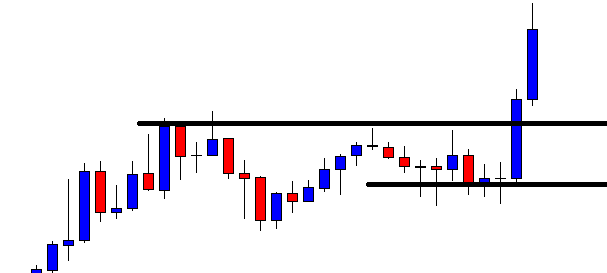
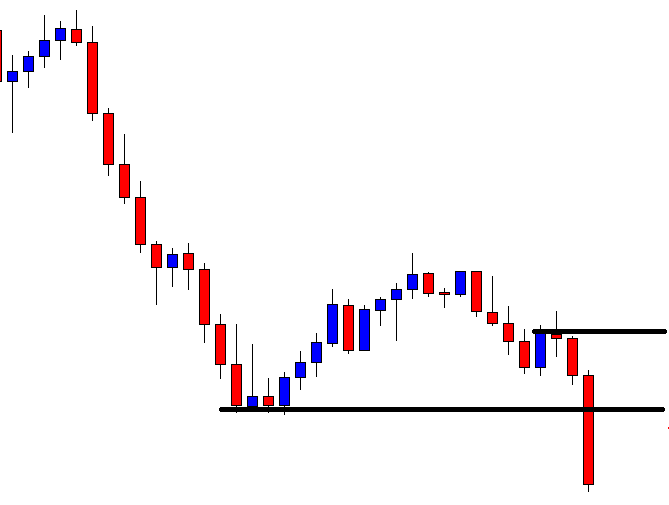
The chart produces a Doji candle (tiny bullish body with long shadows both sides). The breakout level holds the price, for which the buyers are going to be very keen to keep an eye on this pair. If the next candle comes out as a bullish engulfing candle, it would also form a candlestick pattern called Morning Star.

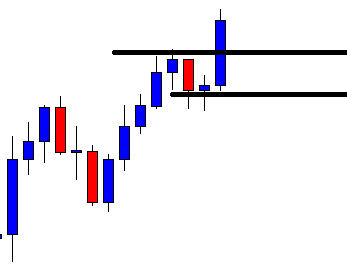
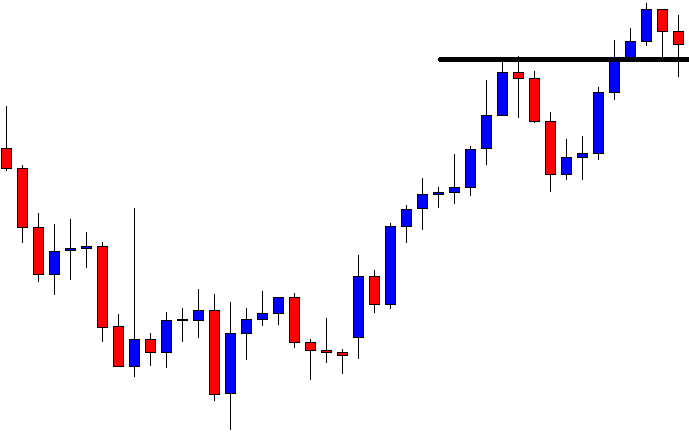
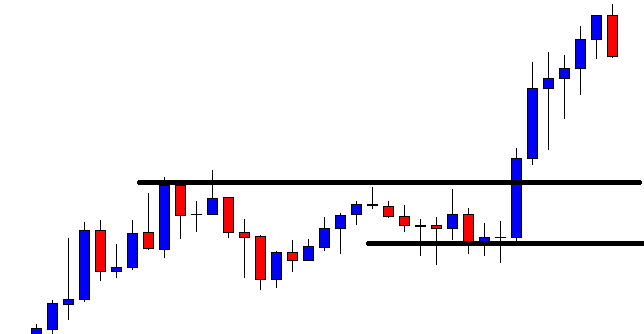
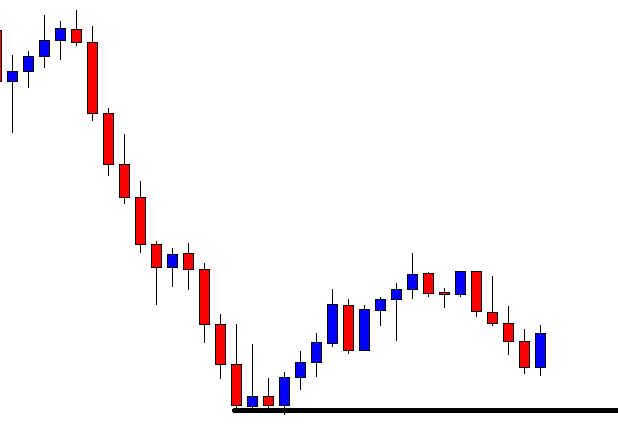
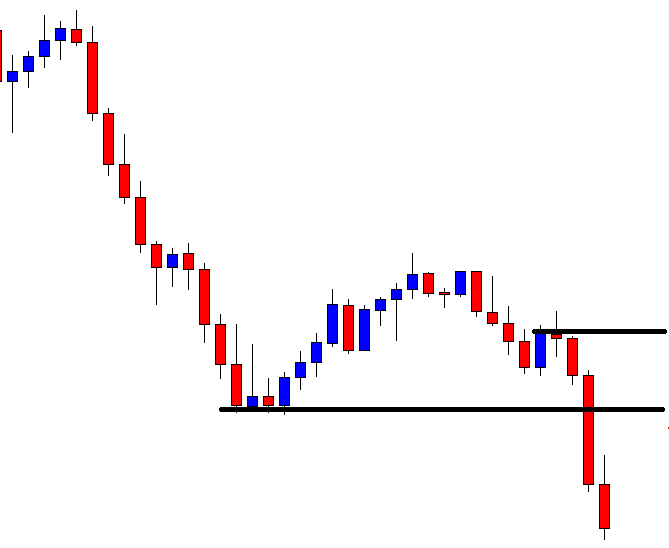
The chart produces a bullish engulfing candle closing well above consolidation resistance. A bullish engulfing candle is enough to attract the buyers to go long in this chart. The combination of the last three candle forms Morning Star, which is a strong bullish reversal candlestick pattern. The buyers may trigger a long entry right after the last candle closes. Stop Loss is to be set below the breakout level and Take Profit is to be set with 1R. Let us proceed to the next chart to see how the trade goes.

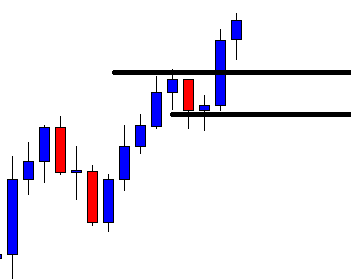
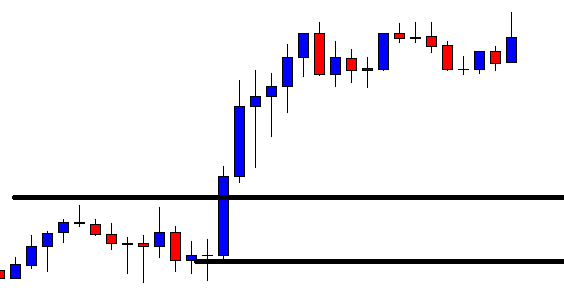
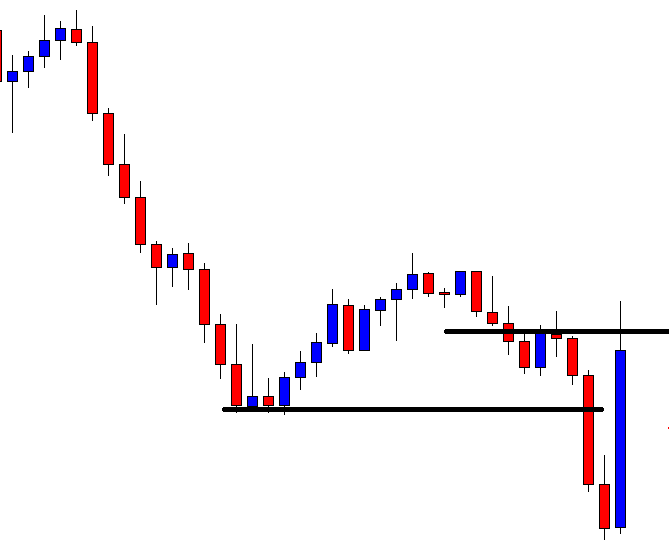
The next candle comes out as a bullish candle. The buyers seem to have taken control. The price may hit the target soon.

It takes only two candles to hit the target. Traders make some green pips in a hurry. If we analyze this trade, we find

  1. The price makes a bullish breakout and comes back at the breakout level.
  2. The breakout level works as support and holds the price
  3. It produces a bullish engulfing candle closing above consolidation resistance.
  4. It produces a candlestick pattern called Morning Star as well.
Categories
Forex Market Analysis

Daily F.X. Analysis, April 16 – Top Trade Setups In Forex – U.S. Jobless Claims Under Spotlight! 

On the forex front, the U.S. Dollar Index recouped losses seen in the prior session, rising 0.7% on the day the to 99.57. Later today, the European Commission will report February industrial production (-0.1% on month expected). The German Federal Statistical Office will report final readings of March CPI (+1.4% on-year expected). 

Economic Events to Watch Today     


EUR/USD – Daily Analysis

The EUR/USD dipped 0.7% to 1.0905. Later today, the Euro zone’s industrial production for February will be reported (-0.1% on month expected).

Lately, the European stocks were broadly lower, with the Stoxx Europe 600 Index sinking 3.3%. Germany’s DAX shed 3.9%, France’s CAC dropped 3.8%, and the U.K.’s FTSE 100 was down 3.3%. A sell-off in the stock market seems to weight on the EUR/USD currency pair. 

The official data which is scheduled to release at 09:00 GMT is expected to show that Eurozone’s industrial production decreased by 0.2% month-on-month in February. Markets are now concerned about extended lockdowns indicating a deeper economic recession than previously forecasted. The U.S. Labor Department will release initial jobless claims in the week ended April 11 (5.5 million expected). 

The Commerce Department will report March housing starts (1.3 million units expected) and building permits (1.3 million units expected). The Philadelphia Federal Reserve will post its Business Outlook Index for April (-32.0 expected).

Daily Support and Resistance

  • S1 1.067
  • S2 1.0792
  • S3 1.0851

Pivot Point 1.0915

  • R1 1.0973
  • R2 1.1037
  • R3 1.116

EUR/USD– Trading Tips

The EUR/USD is trading bearish at 1.0885, exhibiting a bearish crossover below 50 EMA, which is now extending resistance around 1.0923 level. Continuation of a selling trend below 1.09230 level can extend selling until the next support area of 1.0772. The EUR/USD is likely to find support around 1.0850, but below this, the next support prevails around 1.0772 level.

At this moment, the EUR/USD is holding at 1.08820, having an immediate resistance level of around 1.09230, where the bullish breakout of this level can extend buying until the next resistance level of 1.1036. Conversely, we should look for selling trades below 1.09230 today.


GBP/USD– Daily Analysis

GBP/USD dropped 0.8% to 1.2523 and consolidated in the range between the 1.2604 – 1.2450. However, the currency pair traders did not give any major attention to the coronavirus (COVID-19) crisis at home because the cases are comparatively more significant in the U.S. 

At the U.K. Crisis front, the United Kingdoms’ coronavirus death toll rose above 11,000, but the buyers are ignoring this probably because the death toll is comparatively larger in the U.S. almost 20,000 deaths have been registered so far.

The Brexit talks, which will be video conferencing between the European Union and the United Kingdom, are expected to happen and will likely entertain the cable traders as both sides have been stuck on the deadlines while the U.K. recently gave warning the bloc to change tactics or face serious ‘problems.

The market’s risk-tone remains heavy with shares in Asia and the U.S. stocks registering losses on the day. At the USD front, the greenback continues to gain support as a safe-haven asset. Although, the deadly virus recession fears are forcing investors to save cash, preferably in the form of the greenback. 

Looking forward, the U.S. Jobless Claims, housing market data, and Philadelphia Fed Manufacturing Survey, as well as the BOE’s first quarter (Q1) Credit Conditions Survey, will be key to watch. Moreover, the traders are keenly awaited for the speech by the BOE policymaker Silvana Tenreyro for taking fresh clues.

Daily Support and Resistance

  • S1 1.2181
  • S2 1.2353
  • S3 1.244

Pivot Point 1.2525

  • R1 1.2612
  • R2 1.2697
  • R3 1.2869

GBP/USD– Trading Tip

The GBP/USD is trading with a bearish bias over 1.2450 support areas to trade around 1.2486. The GBP/USD pair is likely to find support around 1.2450, which is extended by the triple top level, which got violated on April 10. On the 4-hour chart, the GBP/USD has formed a small bullish channel, which is likely to extend bullish bias for the pair. 

The 50 periods EMA is also keeping the GBP/USD pair supported around 1.2450. Thus, the bounce off above this level can lead the GBP/USD pair towards the next resistance level of 1.2657. While bearish breakout of 1.2460 can open up further room for selling until the next support area of 1.2220. 


USD/JPY – Daily Analysis

Today in the early Asian session, the USD/JPY currency pair failed to maintain its early uptick above 108.00 level and has now reversed almost 30 pips from the daily high. Although, the currency pair continues to taking bids as the U.S. dollar is getting strong and catch a safe-haven bid mainly due to on-going fears of global recession from the coronavirus outbreak. Currently, the USD/JPY pair is trading at 107.78 and consolidates in the range between the 107.36 – 108.08. 

At the greenback front, the U.S. dollar continues to gain support from its safe-haven status as continuing worries over the economic fallout from the coronavirus pandemic is keeping the global financial markets on their knees. The continued strong movement of the U.S. dollar lifted the pair to fresh high over the 108.00 level from the sub-107.00 level, while the bullish trend remains intact for the second consecutive session on Thursday.

At the coronavirus front, the U.K.’s death losses have recently decreased by 761 against 778 the previous day. On the other hand, the highest single-day rise by 2,371 to 30,817 in the death toll in the United States keeps the risk-off sentiment in the market.

Daily Support and Resistance    

  • S1 105.75
  • S2 106.52
  • S3 106.84

Pivot Point 107.3

  • R1 107.62
  • R2 108.08
  • R3 108.85

USD/JPY – Trading Tips

The USD/JPY is trading with a bullish bias, and it is pretty much likely to find support around the triple bottom area of 107.039. A downward breakout of this level can extend selling until 105.300, while the resistance holds around 108.640. The MACD and 50 periods of EMA are suggesting bearish bias, while the fundamentals side is also in favor of selling. Since we the U.S. Jobless Claims, which are due during the U.S. session, traders will focus on the news to drive the next movement in the market. Hence, we should look for selling trades below 107 to target 106.630, and buying can be seen above the same 107.360 level today.  

All the best for today! 

Categories
Forex Market Analysis

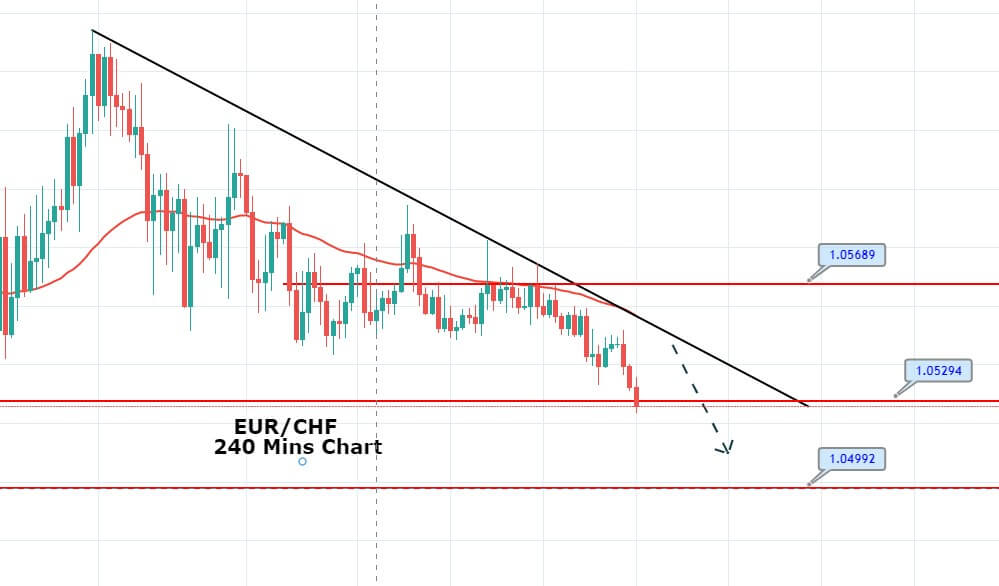
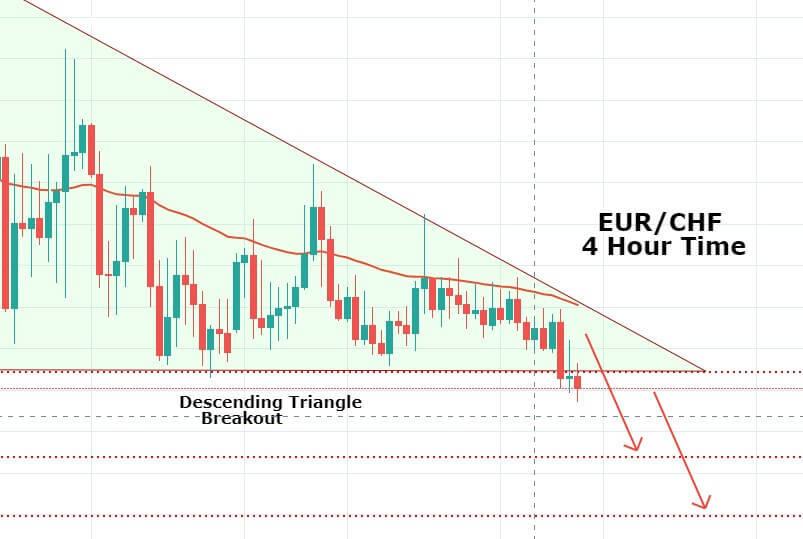
EUR/CHF Descending Triangle Breakout – Time to Short the Pair!  

The EUR/CHF pair hasn’t changed much as the previously formed descending triangle pattern is still supporting the pair around 1.0520 along with resistance around 1.05675. The 50 EMA and the descending trendline is weighing on the Euro cross pair, and it may drive additional bias in the EUR/CHF today. 

Spain and Italy have already released the report of inflation numbers for the month of March. In March 2020, the Consumer Price Index (CPI) grew by 0.1% over a month, following stability in the prior month. Manufactured goods prices stimulated (+1.4% after +0.2%), in the wake of winter sales in February. Tobacco prices rose by 6.6%, because of a tax hike. Despite this, the single currency Euro is getting weaker in the wake of COVID 19 increase number of cases around the globe. 


EUR/CHF- Daily Technical Levels

Support  Resistance 

1.0533      1.056

1.052        1.0573

1.0493      1.06

Pivot Point 1.0547

The EUR/CHF has created a descending triangle pattern that was underpinning the pair at 1.0520 along with resistance at 1.05675. As we can see, the EUR/CHF pair is already trying to breach the descending triangle. Usually, descending triangle patterns tend to break down thus, it may open further selling bias until the next target 1.0470. 

On the 4 hour chart, the 50 periods EMA and the descending trendline are pressing the EUR/CHF currency pair lower, and it may drive further selling bias in the EUR/CHF. 

Good luck! 

Categories
Forex Assets

Trading The XRP/USD Pair & Analysing The Costs Involved

Introduction

XRP/USD is the abbreviation for Ripple against the US Dollar. This pair is used for trading the Ripple cryptocurrency. Also, traders can trade Ripple against other fiat currencies.

Understanding XRP/USD

The value of XRP/USD represents the value of the US Dollar equivalent to one Ripple. It is quoted as 1 XRP per X USD. For example, if the value of XRP/USD is 0.1912, then it can be said that each Ripple is worth 0.1912 US Dollars.

XRP/USD specifications

Spread

Spread is the difference between the bid and the ask price quoted by the brokers. It varies based on the execution model used. Below are the ECN & STP spreads for the XRP/USD pair.

Spread on ECN: 50 pips | Spread on STP: 53 pips

Fee

The fee is the commission that is levied by the brokers on each trade. This fee is only applicable to ECN brokers, not STP brokers.

Slippage

When orders are executed on the ‘market,’ the price requested by the trader is different from the price given by the broker. This can happen either because of high market volatility or broker’s execution speed

Trading Range in XRP/USD

The minimum, average, and maximum pip movement in XRP/USD are given below. One can use these values to determine the profit/loss they could make in a given timeframe.

Procedure to assess Pip Ranges

  1. Add the ATR indicator to your chart
  2. Set the period to 1
  3. Add a 200-period SMA to this indicator
  4. Shrink the chart so you can assess a large time period
  5. Select your desired timeframe
  6. Measure the floor level and set this value as the min
  7. Measure the level of the 200-period SMA and set this as the average
  8. Measure the peak levels and set this as Max.

XRP/USD Cost as a Percent of the Trading Range

By applying the volatility values to the total cost of a trade, the variation in the costs for varying volatilities can be determined. Below are two tables representing the same.

ECN Model Account

Spread = 50 | Slippage = 3 |Trading fee = 5

Total cost = Slippage + Spread + Trading Fee = 3 + 50 + 5 = 58

STP Model Account

Spread = 53 | Slippage = 3 | Trading fee = 0

Total cost = Slippage + Spread + Trading Fee = 3 + 53 + 0 = 56

Trading the XRP/USD

While trading a pair, there are two factors that must be taken into consideration, namely, volatility and cost.

Volatility

The minimum in the 4H timeframe is 18 pips, while 142 pips are the maximum. And the average stands at 63. So, if a trader wishes to trade the 4H timeframe, then they should make sure that the current volatility is at or above the average volatility. This is because one can make money only when there is movement in the market.

Cost

Cost is not constant but varies as the volatility changes. The cost percentages in the minimum column are the highest compared to the average and maximum columns. This means that the costs are very high for highly volatile markets. Hence, it must be avoided.

The benefit with limit orders

Traders who trade with limit orders have an added benefit than those who trade with market orders. With limit orders, the total cost of the trade does not include the slippage. This hence brings down the cost of the trade to a decent extent.

This concludes the analysis of BCH/USD. We hope you found it interesting and useful. Stay tuned for more such asset analysis. Cheers!

Categories
Forex Course

101. What Are Oscillators & How To Interpret Them?

Introduction

Technical Indicators are primarily used to confirm a price movement and the quality of a candlestick pattern, and also to create trading signals with them. Indicators are a great source of strength to confirm an existing analysis. Moreover, some indicators solely help in analyzing the trend, momentum, and volatility of the market.

As discussed previously discussed, there are two types of indicators, leading and lagging. And oscillators fall under the leading indicators. That is, they determine the trend of the market before-hand.

Indicator construction

There are two ways through which indicators are designed:

  1. Non-bounded
  2. Oscillators

Non-bounded, as the name suggests, they are the indicators that are not bound in a specific range. They usually display the strength and weaknesses, and to an extent, generates buy and sell signals.

Oscillators, on the other hand, are indicators that are bound within a range. For example, 0-100 is the range they oscillate between. However, based on the type of oscillator, the range varies.

Oscillators

Oscillators are technical indicators that are mainly used to determine the oversold and overbought conditions. These non-trending indicators are used when the market is not showing any certain trend in either direction. They are unlike the moving averages (MA), which determine the trend and overall direction of the market.

When security is under an overbought or oversold situation, the oscillators show its real value. It indicates that one of the parties is losing its strength, and the other is slowly starting to gain together.

Interpreting Oscillators

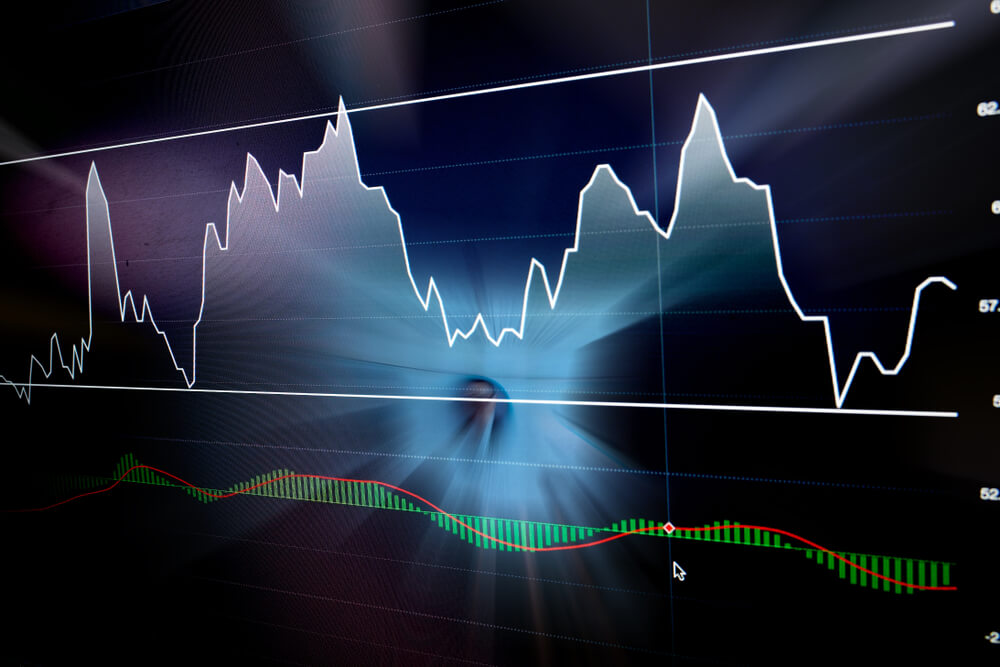
Oscillators are constructed with lower and upper bounds. And these bounds form a range. In the below oscillator, the purple region represents range-bound, where 30 is the lower bound, and 70 is the upper bound. The upper and lower bounds are also referred to as peaks and troughs. Typically, the peaks and troughs in the oscillator correspond to the peaks and troughs in the market as well.

Extreme Regions

The oversold and overbought regions are the extreme regions. That is, when the oscillator line shoots above the upper bound, the market is considered to be overbought. On the contrary, if the oscillator falls beneath the lower bound, the market is said to be overbought.

An overbought market means that the buying volume has diminished over a few trading days. So, there could be a possibility for investors to sell their positions. However, note that this interpretation holds true when the market was in a predominant uptrend and is currently consolidating.

An oversold market indicates that the selling volume, which was high in the past days, has now diminished. This could mean that the sellers are done selling with the security and might begin closing their positions. Hence, indicating a turn-around in the market.

Midpoint Line

A crossover at midpoint region of the range depicts the gain in strength of the buyer or sellers. From the oscillator given, 50 is the midpoint line. So, if the oscillators cross above the 50 mark, it indicates bullishness in the market. And if cuts below 50, it could indicate bearishness in the market.

This concludes the lesson oscillators. In the coming lessons, we shall discuss some strategies using a few oscillators. Stay tuned. Happy trading!

[wp_quiz id=”70529″]
Categories
Forex Fundamental Analysis

What Should You Know About ‘Income Tax’ As A Fundamental Indicator?

What is the Income Tax?

An Income Tax is a percentage of our income that the government takes in the form of taxes. Income Tax is paid by individuals and entities depending on the level of earning and gains during a financial year. In most of the countries, a single income tax does not usually apply to the entire income, but rather various rates apply to different portions of the “taxable income.” The different tax rates and the income levels at which they apply vary widely.

Types of Income which attracts Tax 

Income Tax is a direct tax that is levied on the income and other types of earnings of an individual in a financial year. Below are some types of incomes and taxation rules.

Income from Salary: This includes basic salary, taxable allowances, and profit in lieu of salary, pension received by the person who himself has retired from the service. They all fall under the category of taxable income.

Income from business/profession: This includes presumptive incomes from business and professions that individuals do in their capacity and maybe their part-time work. This is also added to the taxable income after adjustment of the allowed deductions.

Income from properties: A taxable person may also own one or more house properties. These properties can be self-occupied or rented out or even vacant. The rules of Income Tax state that rent from house properties is to be treated for the purpose of calculation of taxable income. An income tax assessee can, however, claim certain deductions for house maintenance in certain areas.

Capital Gains: They are the gains that one makes from selling capital assets like Gold, house properties, stocks, mutual funds, securities, etc. Although capital gains are a part income tax, they are not added to taxable income, as they are taxed at different rates.

Economics and Income Tax

Tax plays a major role in maintaining a balance between people, businesses, and governments,  which broadly represents the economic activity of a country. Here are two ways in which changes to Income Tax affects the economic activity and well being of people.

Tax Incentives

By granting incentives, taxes can affect both supply and demand in an economy. Reducing marginal tax rates on wages can motivate workers to work more. Expanding the income tax credit can bring more low-skilled workers into the labor force. Reducing Tax rates can also encourage to employed persons to invest in stocks and bonds, which improves the capital flow of companies.

Budget Deficit

Large Tax cuts can slow economic growth by increasing budget deficits. When the economy is operating at its potential, a sudden reduction in tax rates may provoke the government to borrow capital from foreign investors and institutions. They will also divert some funds allocated to private investment, reducing productive capacity relative to what it could have been. Either way, deficits increase and thus reduce well-being.

The Economic Reports

The Income-tax rates are announced every year by the Finance Ministry during a press release, which puts out all the slabs and tax brackets based on the income level. This is usually the Central Government tax rate, but there is also a yearly announcement made by all the states, which impose income taxes in the same way the federal government does. In some countries, a single tax rate is applicable to everyone, regardless of the income level. This is called a “flat tax.”

Analyzing The Data

Investors, when analyzing a currency Fundamentally, give extreme importance to the Capital Gains tax of that country. Income Tax is not a major concern for investors when taking a position in the market. But a major deviation from the standard Income Tax rates catches the attention of investors. However, if the Federal government has been maintaining a fixed rate over the years without any major changes, there is no reason to worry, as they fell, the economy is stable. However, an increase in Capital Gains tax is not taken well by the institutional investors, which changes their stance on the economy and the currency, mostly to negative.      

Impact on the currency

A study conducted by economists examined the impact of taxes on the real exchange rates through their effects on economic activity. Their report says that an increase in the capital interest tax rate leads to depreciation in the currency, while an increase in the wage or consumption tax leads to a real domestic currency appreciation. This hypothesis is supported by the data estimations of annual data from 10 OECD countries over 17 years.

A marginal increase in Income Tax is considered to be good for the economy as it increases the revenue of government organizations, but a substantial increase in tax rate can have a reverse effect on the economy, and this will be unbearable for salaried persons.

Source of information on Income Tax rates

Income Tax rates are available on the official website of the finance department of the country, where one can also find the rates for previous years as well (of more than 30 years). Using this information, a trader can analyze the trend in the Income Tax rates over the years. Here is a list of major countries of the world with their Income Tax rates.

Links to Income Tax information sources

GBP (Sterling)USDEURCHFCADNZDJPY

Income Taxes is a compulsory contribution to state revenue, levied by the government on workers’ income and business profits. This gives the ability to the government to provide basic safety and community systems for the public. This ensures freedom and basic living standards that citizens expect. Therefore, it is the duty of citizens to timely file Income Tax returns and be a responsible civilian.  

Impact of the Income Tax news release on the price chart 

After having a clear understanding of the Income Tax and its role in the economy, we will now extend our discussion and study the impact of the same on the value of a currency. Investors and traders mainly consider the Capital Gains tax rates, which is also a form of Income Tax. Any major changes to the Capital Gains tax cause extreme volatility in the currency pair and a change in the outlook for that currency. Thus, the income tax alone is not explicitly taken into account by traders.

In the upcoming sections, we will analyze the change in volatility in the currency pair due to the announcement of Income Tax rates. The above image shows the Federal Tax rates of Canada for 2020, where we can see the percentage of income that will be levied as Income Tax on individuals of the country. This is also known as ‘Tax Bracket.’ The maximum Income Tax rate stood at 33%, and this rate has been maintained from the past four years. This data is published by the Canada Revenue Agency, where one can find other tax rates as well.

GBP/CAD | Before The Announcement

We start our discussion with the GBP/CAD currency pair, where the above image shows the behavior of the chart before the news announcement. Price action suggests that the price seems to be retracing the big uptrend and is at a key ‘support’ level. If the Income Tax rate announcement comes out to be negative for the Canadian economy and not per expectations, one can take a ‘buy’ trade in the above pair. Whereas positive data might not result in a trend reversal as the overall trend is up.

GBP/CAD | After The Announcement

After the announcement, we see that the price moves higher, and it closes with a fair amount of bullishness. The increase in volatility to the upside is a sign of continuation of the trend, and this shows that the data was not very positive for the Canadian dollar. The bullish ‘news candle’ indicates a weakness in the currency where traders find the data to be negative for the economy. As the market moves higher, once can go ‘long’ in the market with a stop loss below the ‘news candle’ and ‘take profit’ at the recent ‘high.’

EUR/CAD | Before The Announcement


EUR/CAD | After The Announcement

The above images represent the EUR/CAD currency pair. In the first image, we see that the price is moving within a range, and just before the announcement of Income-tax rates, the price is at the bottom of the range. Since the price is at an optimal place for going ‘long’ in the market, aggressive traders can buy the currency pair with a strict stop loss of a few pips below the ‘support’ area.

We are essentially advantage of the increased volatility and movement in the pair. After the Income Tax rates are published, the market moves higher similar to the GBP/CAD pair, but later, the market gets sold into, and the candle closes with a large wick on the top. We can say that the news data was neutral to negative for the economy. Thus, there some confusion among traders can be seen. As the ‘news candle’ is not a bullish candle, it is wise to wait for the price to cross above the moving average and then a ‘buy’ trade.

CAD/JPY | Before The Announcement

CAD/JPY | After The Announcement

Lastly, we discuss the CAD/JPY currency pair, where the characteristics of the chart appear to be different from the above two pairs. Since the Canadian dollar is on the left-hand side, an uptrend in the first image signifies a great amount of strength in the currency. As the market is continuously moving higher before the announcement, we need a lot of confirmation from the market in order to go ‘short’ in the market. I

f the news data is positive for the economy, the move gets accelerated to on the upside and, in that case, once can join the trend after a retracement. After the news announcement, the market crashes, and volatility increases to the downside, thereby indicating a possible reversal. The bearish ‘news candle’ shows that the Income Tax rates were not very positive for the economy, and thus traders sold Canadian dollars. One should take ‘short’ trade only after the price goes below the moving average.

That’s about Income Tax and the impact of its new release on the Forex Market. Let us know if you have any questions in the comments below. Cheers.
Categories
Forex Basic Strategies

Pairing The ‘Gravestone Doji’ Pattern With Significant Resistance Levels

Introduction

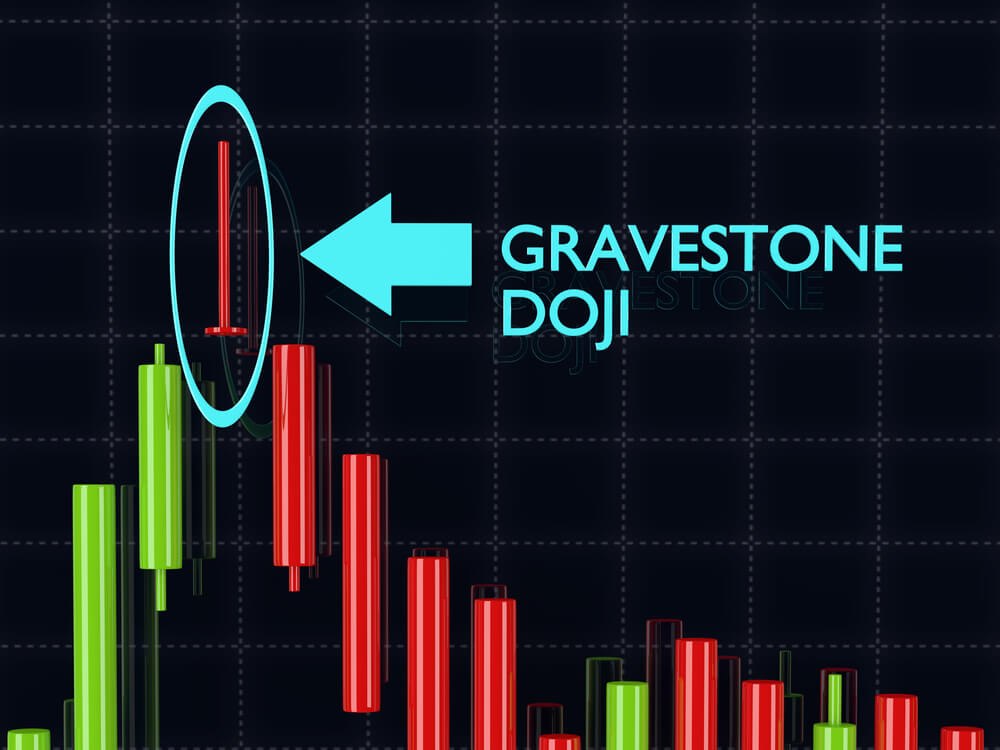
Gravestone Doji is a bearish reversal candlestick pattern that occurs at the top of an uptrend. This pattern helps the traders to visually see where the significant resistance level is located on the price chart. The most important aspect of the Gravestone Doji pattern is its long upper shadow. The candlestick’s open, close, and low are all the same in this pattern.

The psychology behind the long upper shadow is this – In an ongoing uptrend, when the price action hits the significant resistance line, buyers exit their positions, and the price action is smacked down by the sellers. In short, the appearance of this pattern represents the losing momentum of the buyers and essentially indicates a bearish reversal in the market.

Most of the traders place their trades as soon as this pattern appears on the price chart. But that’s definitely not the right approach. Instead, we must wait for the next candle to close for the confirmation and only then take the trades. The opposite of the Gravestone Doji is the Dragonfly Doji, which appears at the bottom of a downtrend or the major support area. The below image represents the Gravestone Doji Pattern.

Trading Strategies – Gravestone Doji Pattern   

The Gravestone Doji pattern indicates that the buying trend is ending, and the market is reversing to the selling side. However, this doesn’t hold true all the time. We will be finding this pattern quite often in all the types of market conditions, and if we start trading every time we find them, we will end up on the losing side. We always need to ask our self the reason why this pattern appears in certain conditions. Is it going to reverse the market or not?

Pairing the pattern with a significant resistance level

If you find this pattern at the bottom of the range, do not trade it. But if the price action prints this pattern at the top of a range, it can be considered a sign for us to go short. Similarly, find the trending markets and look for a major resistance level where the price could possibly react. So when the price action prints a Gravestone Doji at the major resistance level, it’s a strong sign for us to go short.

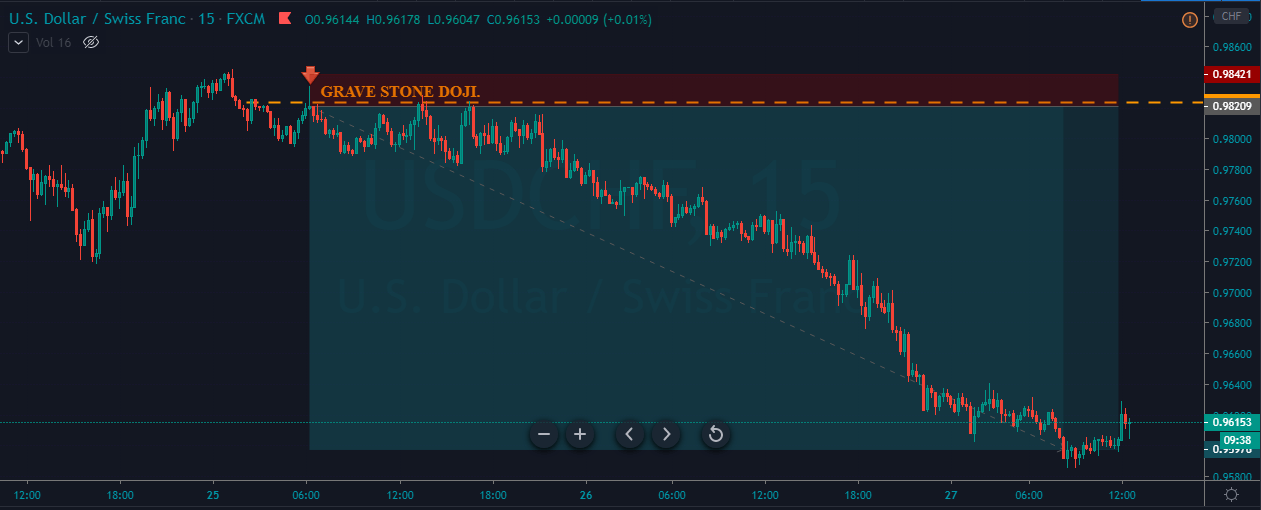
In the below USD/CHF Forex chart, we can see that the price action has printed the Gravestone Doji pattern at the significant resistance level. We should be going short as soon as the Doji candle closes.

In the below image, we can see that we took a sell entry when the market printed the Gravestone Doji pattern. We have placed the stop-loss just above the resistance level. It is safer to put the stop-loss above the pattern or at the resistance line because if the price goes above the pattern, the pattern gets invalidated. We know that the Gravestone pattern indicates a market reversal, and most of the time, these reversals travel quite far. That is the reason why we go for deeper Take Profits.

In the above chart, we can see that we had exited our full positions when strong buyers showed up. This indicates that the sellers are losing their momentum, and there is no logic to continue holding our positions.

Gravestone Doji + Stochastic Oscillator

The strategy that we shared above is for aggressive traders who like to take risks. However, if you are A type of trader who needs more confirmation to pull the trigger, we suggest you follow this strategy to trade this pattern. Most of the conservative traders do have a fear in their minds that one single candle does not have the potential to reverse the market. And it is completely okay to think like that. The truth is that sometimes even a single candle can move the market, and sometimes it doesn’t. Ultimately it is your money management system that makes all the difference.

But to filter out some poor signals and to get an additional confirmation, it is advisable to use the Stochastic oscillator to confirm the probability of our trading signal. Stochastic is a range-bound indicator that oscillates between the 0 & 100 levels. When the Stochastic goes above the 70 level, it means that the market is in an overbought condition, and we can expect a change in the trend. Likewise, when it goes below the 30 levels, it means that the market is oversold are we can expect a reversal anytime soon.

The Stochastic indicator also shows the bearish and bullish divergence, which helps the traders in trading the upcoming reversals. The divergence is when the market moves in one direction, but the indicator is signaling a different direction. Now we believe that you understand the basics of trading with the Stochastic indicator. Now let’s dive into the strategy.

The strategy here we are using is simple and straight forward. First of all, identify the Gravestone Doji pattern at a significant resistance level in an uptrend. Then, apply the Stochastic indicator to the price chart and check if the indicator is at the overbought area, indicating a downside reversal. If yes, go short and place the Stop-Loss just above the pattern.

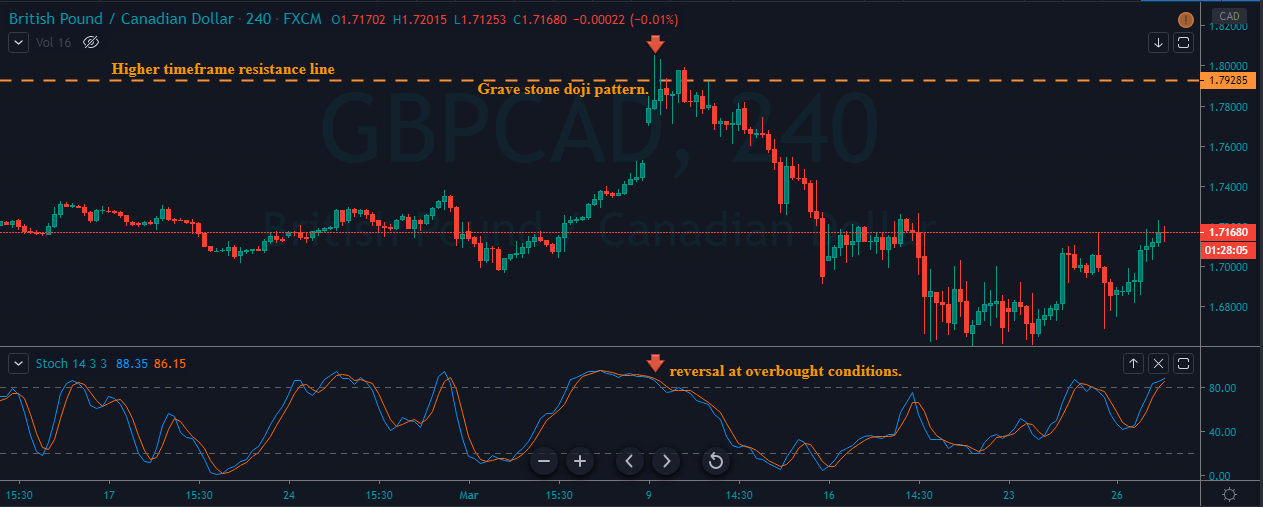
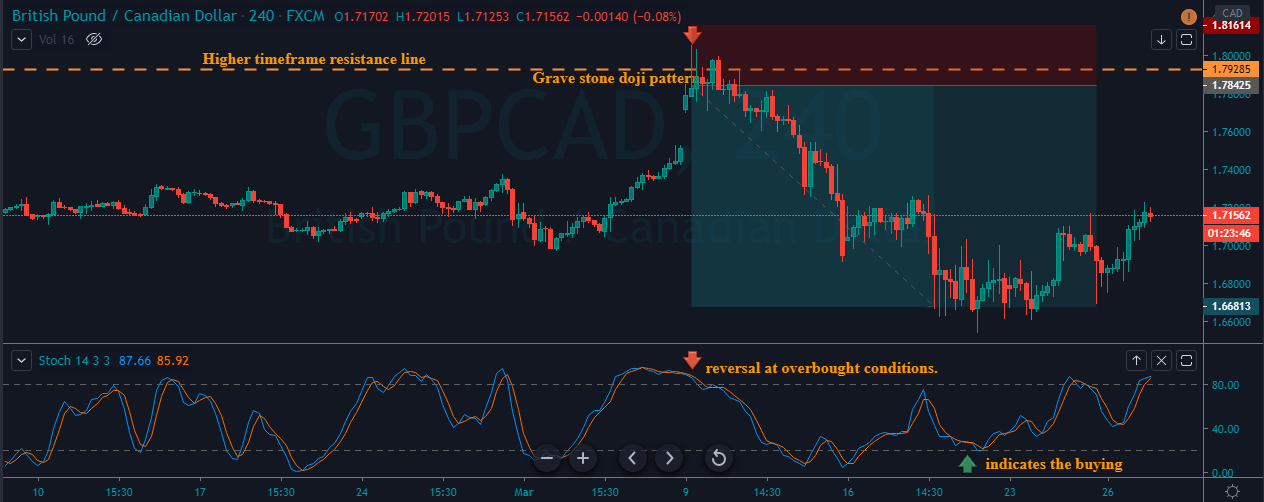
The GBP/CAD chart below indicates the appearance of the Gravestone Doji pattern in an uptrend. When the price is approaching the upper resistance level, it got smacked down immediately, and the market ended up printing the pattern. The next six candles tried very hard to break the pattern & resistance line, but nothing worked, and the price ended up rolling down. We can also observe the Stochastic indicator was at the overbought area, which is a confirmation sign for us to go short.

We have entered for a sell when both the conditions are met, and placed the Stop-Loss just above the pattern. For the Take-Profit, we choose to go for deeper targets. When the selling trend started to struggle, the Stochastic indicator was at the oversold selling conditions. At that point, we have closed our full positions for obvious reasons.

Conclusion

The trades taken based on the Gravestone Doji pattern are pretty reliable. But do not make the mistake of identifying the pattern everywhere on the price chart. The psychology behind this pattern says that the bulls drove the price to a peak point, and the sellers are comfortable in reversing the market. For booking profits, you can expect an equal move to that of a previous trend. If you are an intraday trader, make sure to exit your positions at any significant level. Although this pattern appears on all the timeframes, the reliability is higher on higher timeframes to that of lower timeframes.

We hope you find this article informative. Try trading this pattern on a demo account and master it before applying the above-mentioned strategies on the live market. Cheers.

Categories
Forex Signals

EUR/JPY Violates Descending Triangle Pattern – An Update on Signal! 

The EUR/JPY is trading with a bearish bias around 117.150, holding below strong support to become a resistance level of 117.350, which is extended by the descending triangle pattern.  

The COVID 19 updates are consistently impacting the exchange rate of the EUR/JPY pair. French Prime Minister Edouard Philippe said on Wednesday, healthcare staff in France’s most stricken regions by the new coronavirus would receive a bonus of 1,500 euros ($1,637). 

Alongside this, they will receive higher interest than normal for their extra hours, which is positive news for the Euro, but at the same time, it’s increasing cautions of traders about the future of the Eurozone. Eventually, this drives selling bais in the pair, as investors move their investments in the safe-haven currencies such as Japanese yen


Technically, the EUR/JPY is following a narrow range, which can extend selling bias until 116.450. On the 4 hour timeframe, EUR/JPY has violated the EUR/JPY support level of 117.350, and this can lead the pair towards an initial target level of 116.765 and 116.380. The MACD is holding below 0, suggesting bearish bias among traders. While the 50 periods, EMA continues to support the selling trend in the pair. 

Entry Price: Sell at 117.179    

Take Profit 116.479    

Stop Loss 117.779    

Risk/Reward 1.17

Profit & Loss Per Standard Lot = -$‭560.4/ +$653.8‬

Profit & Loss Per Micro Lot = -$‭56/ +$65.38

Categories
Forex Videos

Mastery Of Forex Candlesticks In 5 Minutes


Become An Expert On Candlesticks In 3 Minutes

This video is the beginner’s guide to candlesticks,
where we will teach you what a candlestick is, and identify its basic properties.

Insert B:

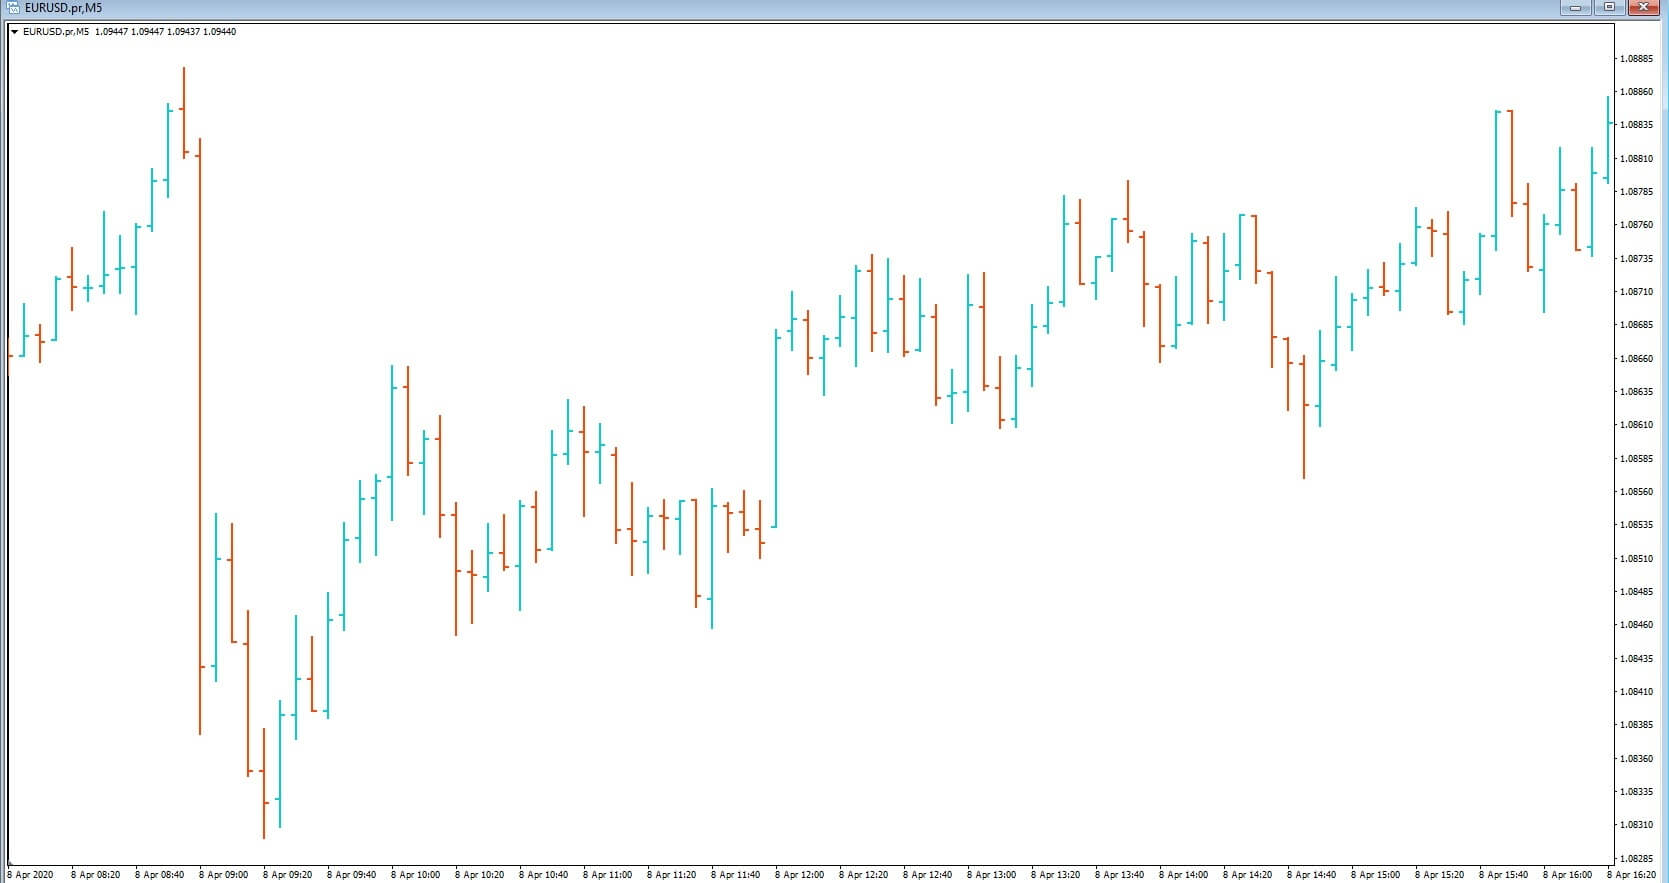
Candlesticks are one of the more preferred methods of showing the price of a currency pair in technical analysis.

Insert C Bar charts

Insert D

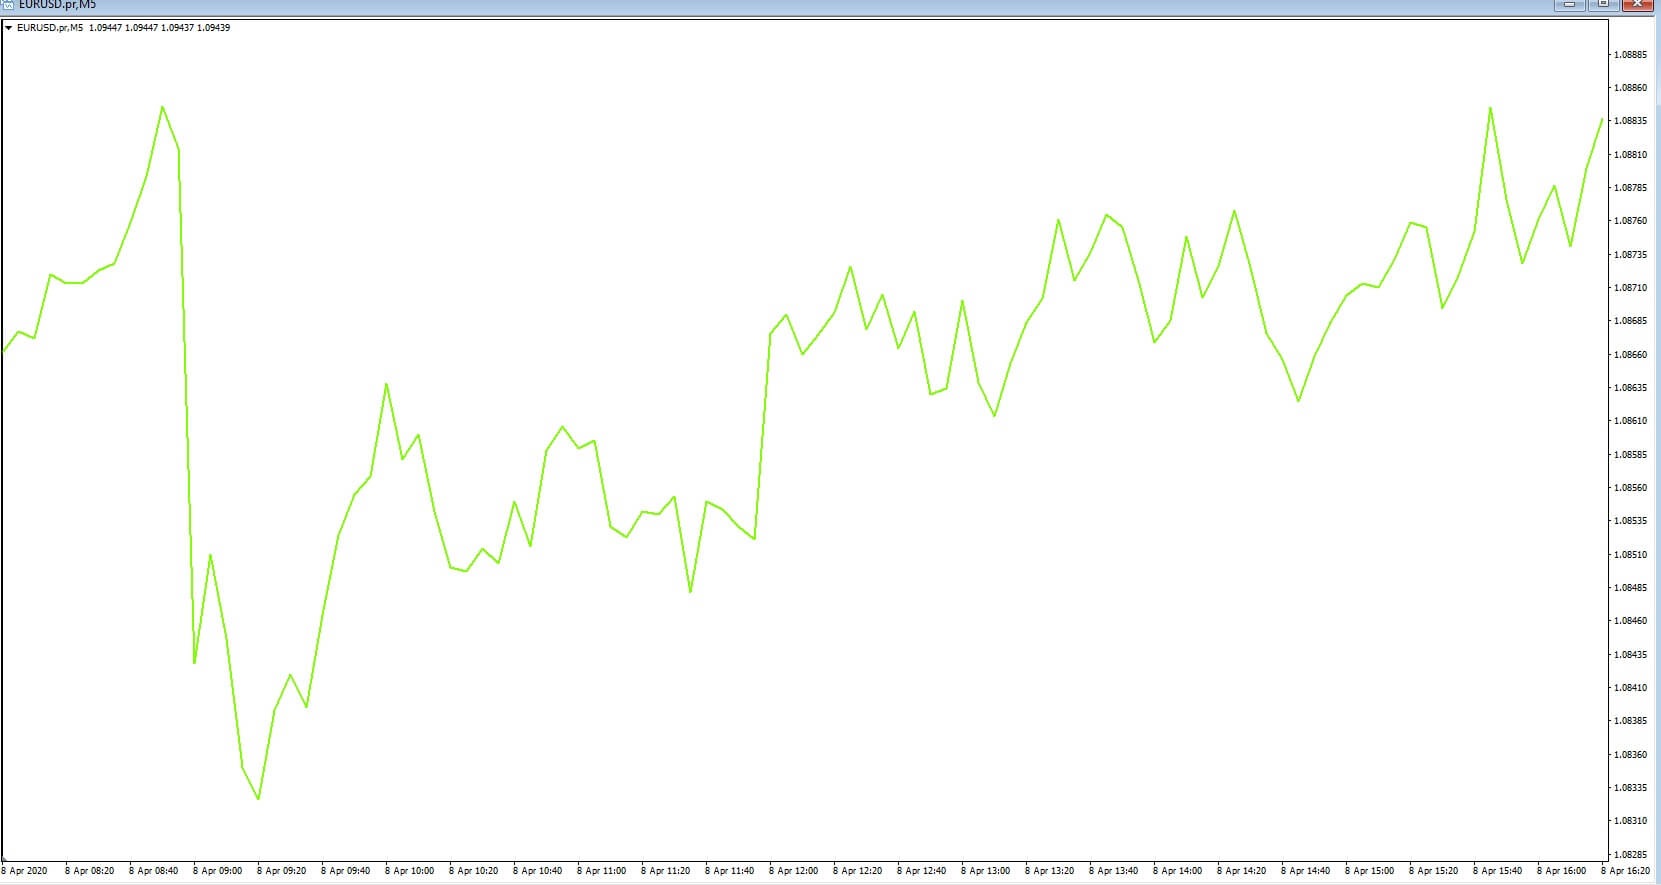
line charts are also used by traders but are somewhat more simplified versions of expressing price action as a visual representation on a screen.

See Insert B! Each candlestick tells a story of where price has been and where it is likely to go during the particular time frame that it is viewed upon. It is, therefore, essential that new Forex
traders learn how to read them because they are applicable in every currency pair that you may wish to trade.

The shape and size of a candlestick, and the color, will help you to determine if a trend in either direction is in play, or if a trend has stalled and is about to reverse, or the amount of volume being traded, which will tell you you the interest from participants at any given time, and this, of course, will help you chose your entry into a trade and of course your exit, either with a profit or as defined by a stop loss.


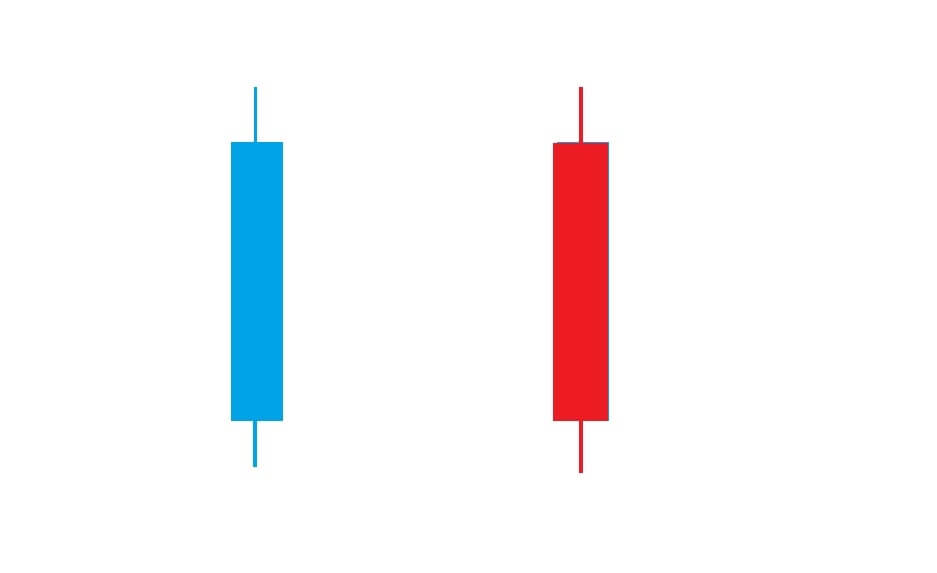
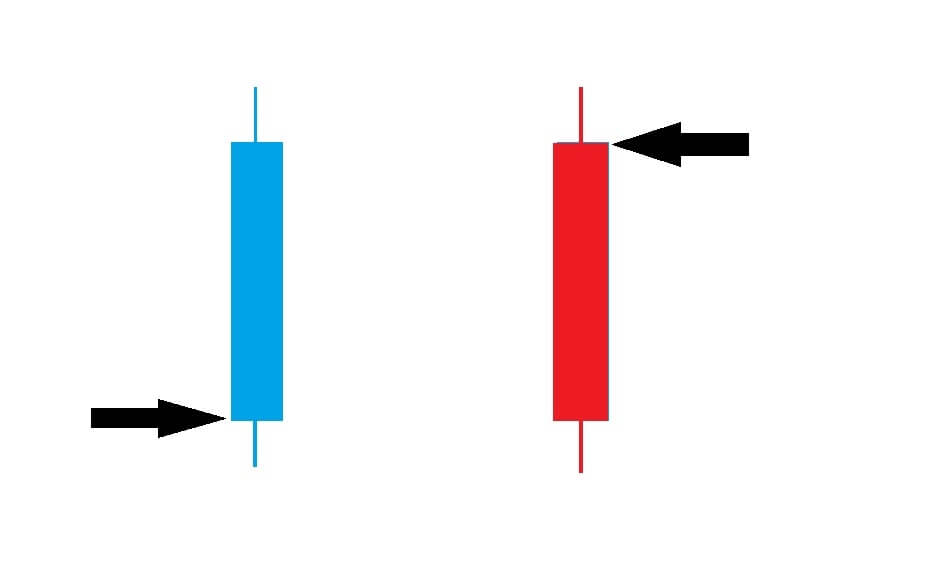
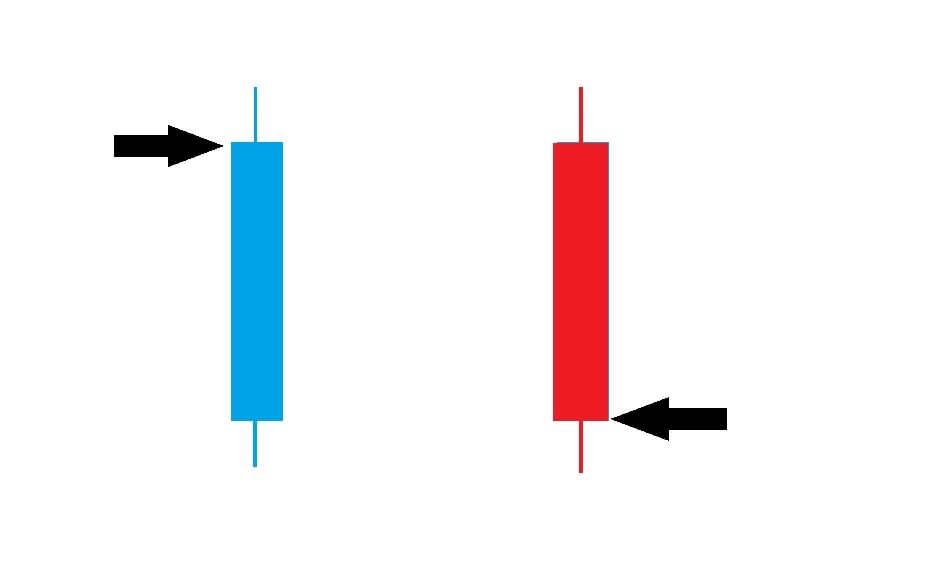
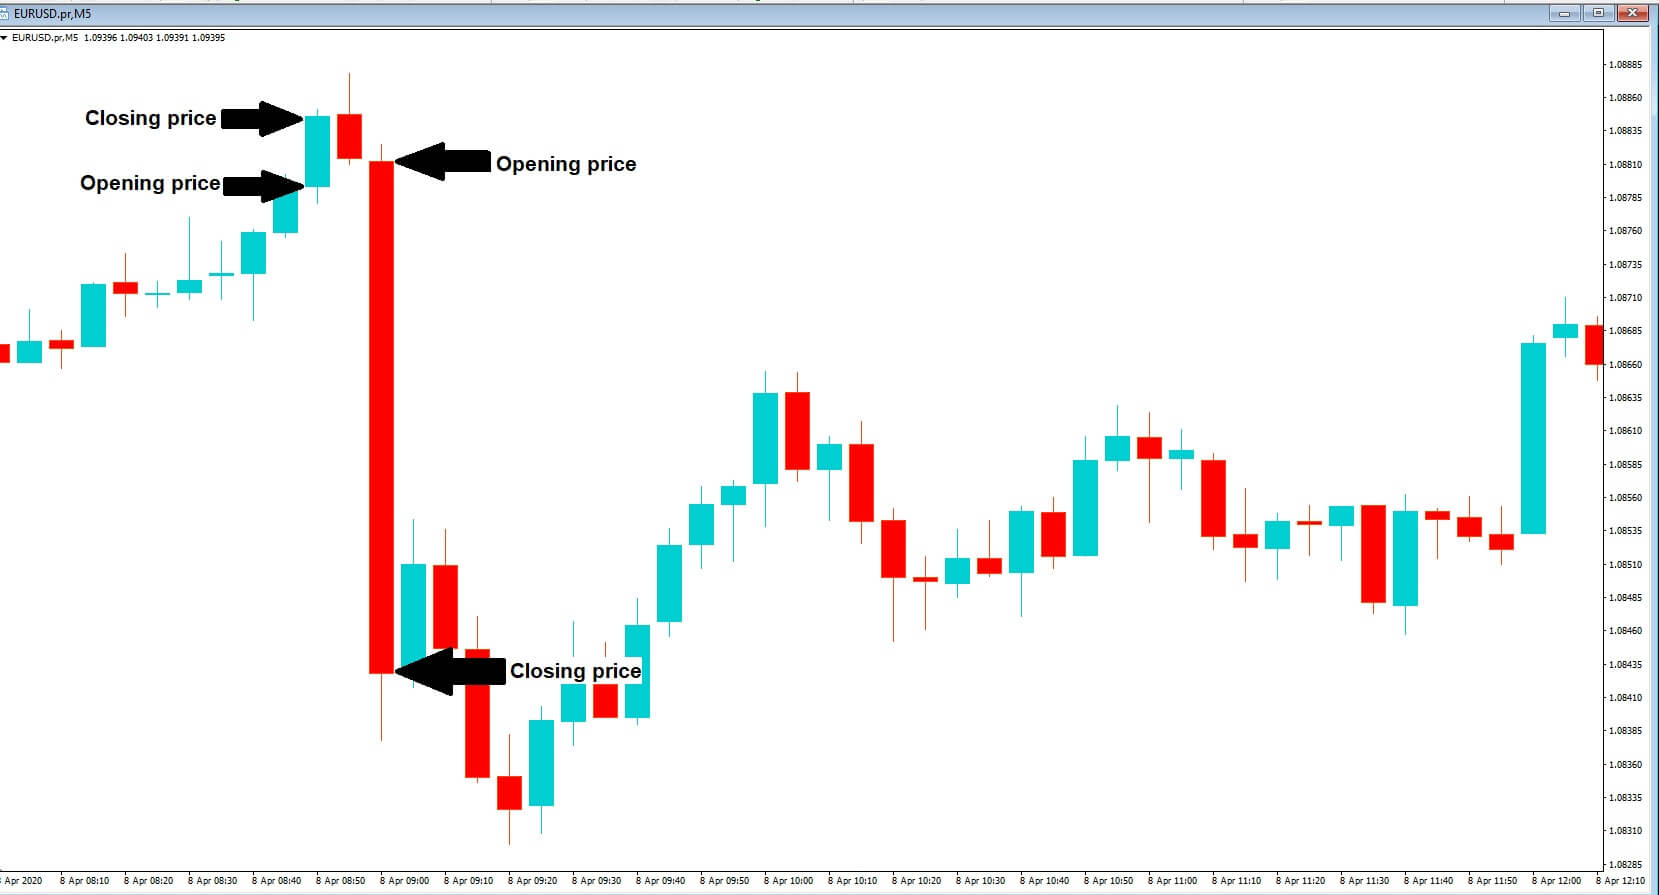
Insert E, Candlesticks can be the color of your preferred choice. In this example, we are using a blue candlestick to denote price ascending and a red candlestick to denote price falling. There are three parts that make up a candlestick.

Insert F, the open price.

Insert G, the closing price.

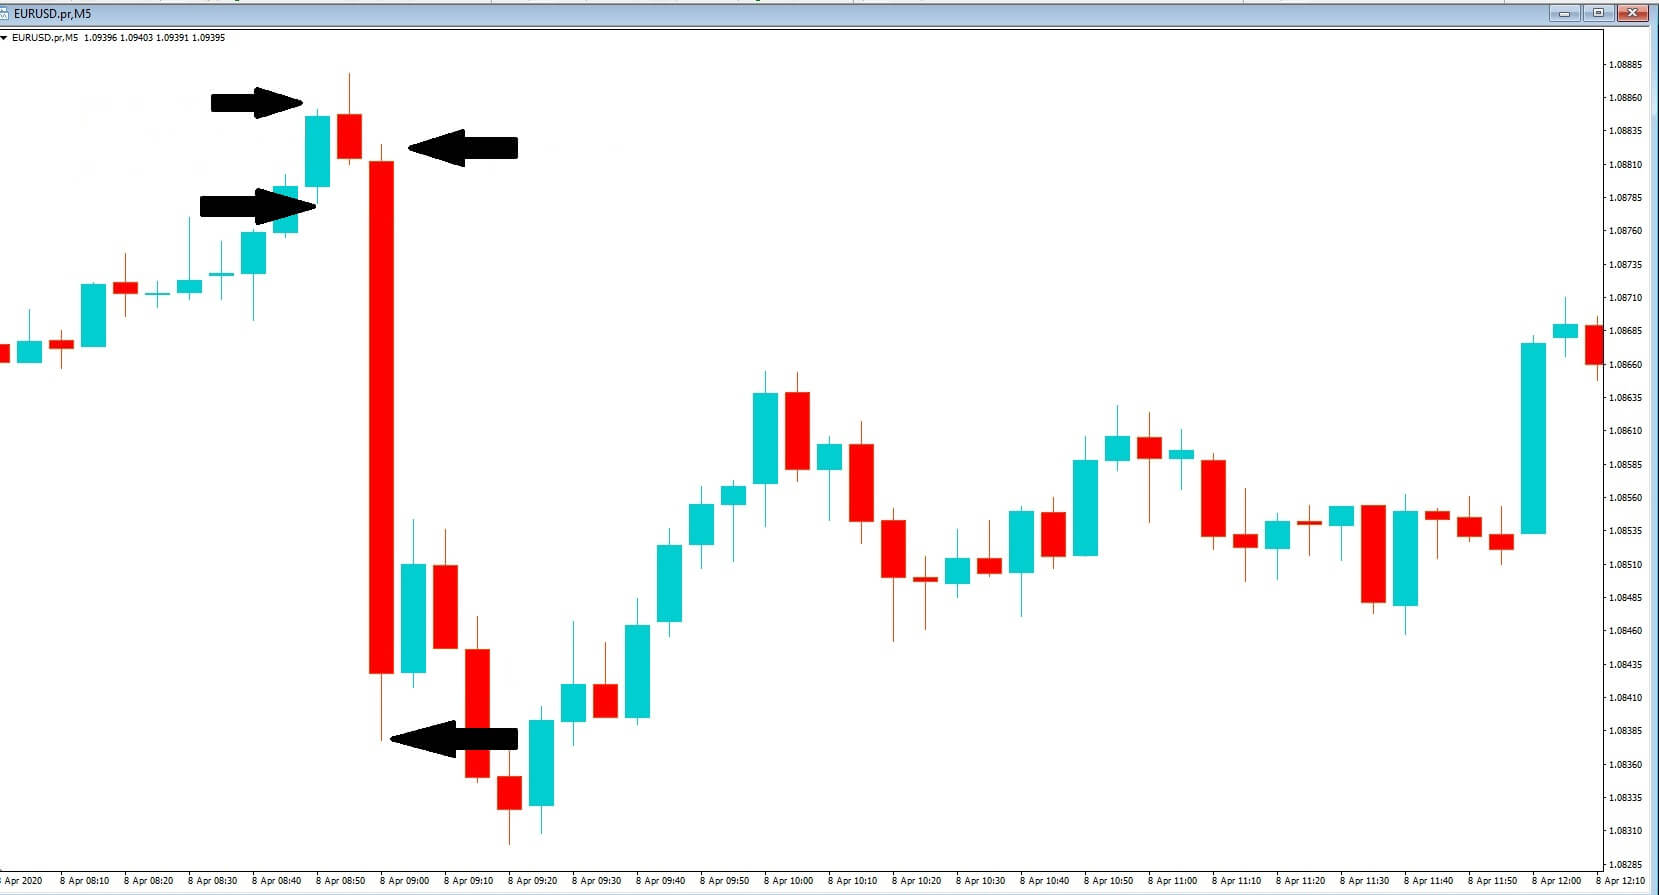
Insert H and the wicks, which are also known as shadows, and which will appear on the majority of candlesticks.


Insert I

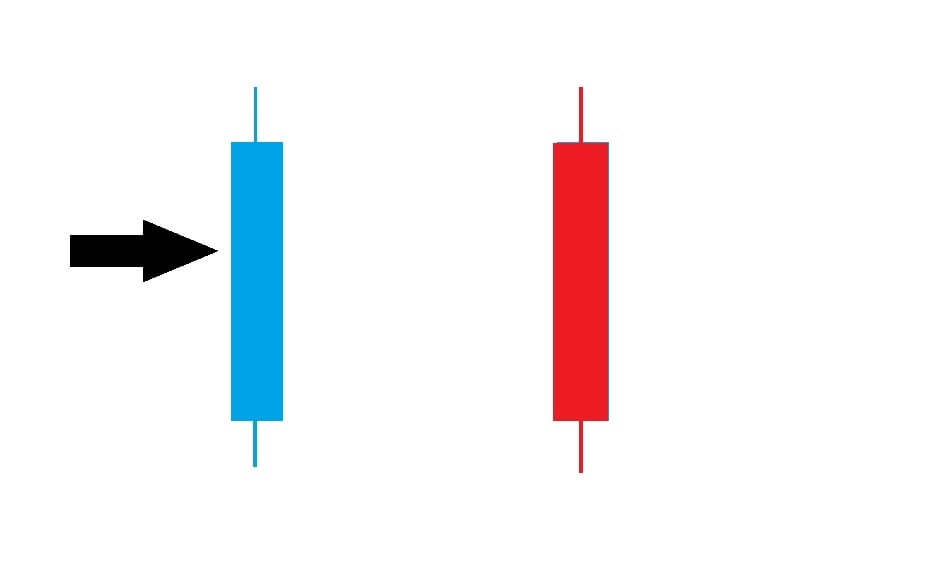
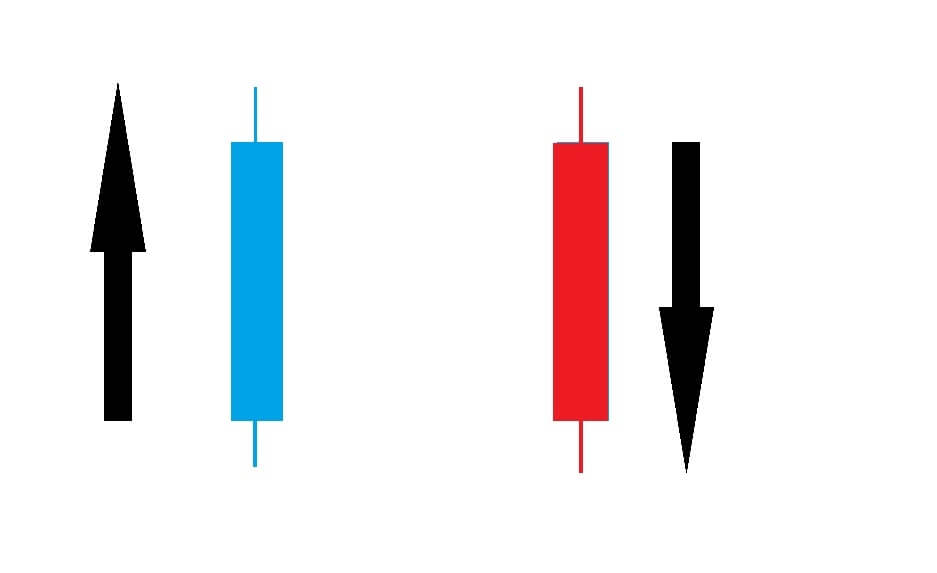
candlesticks will turn blue if the price of a currency pair moves above the exchange rate price when the candlestick first opened.

Insert J

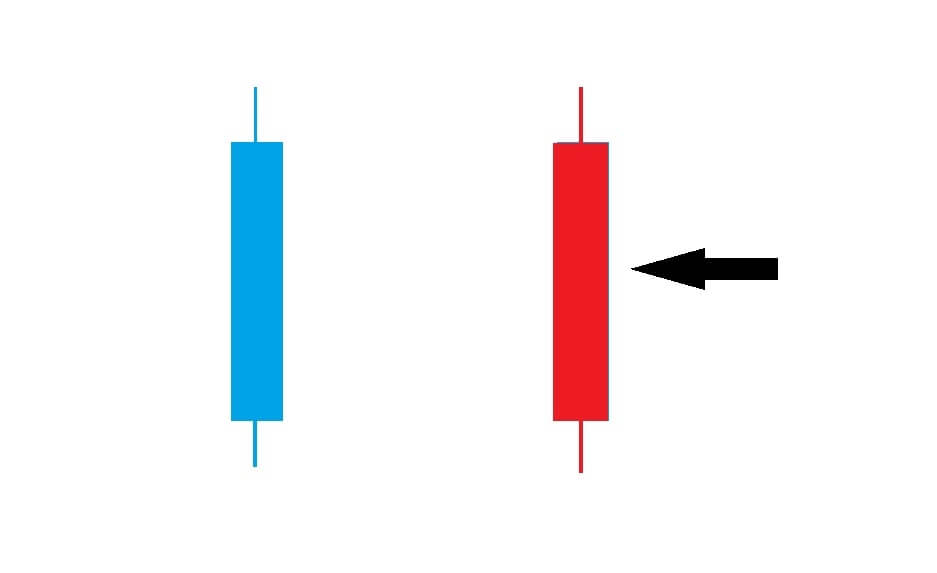
and the candlestick will turn red if the exchange rate moves lower after the candlestick form opens.

Insert K

A blue candlestick is also known as a bullish candlestick, and a red one is known as a bearish candlestick. As mentioned previously, your broker may give you the option to change the candlestick’s colors, and this isn’t important, as long as you know which color represents the bullish or bearish direction.
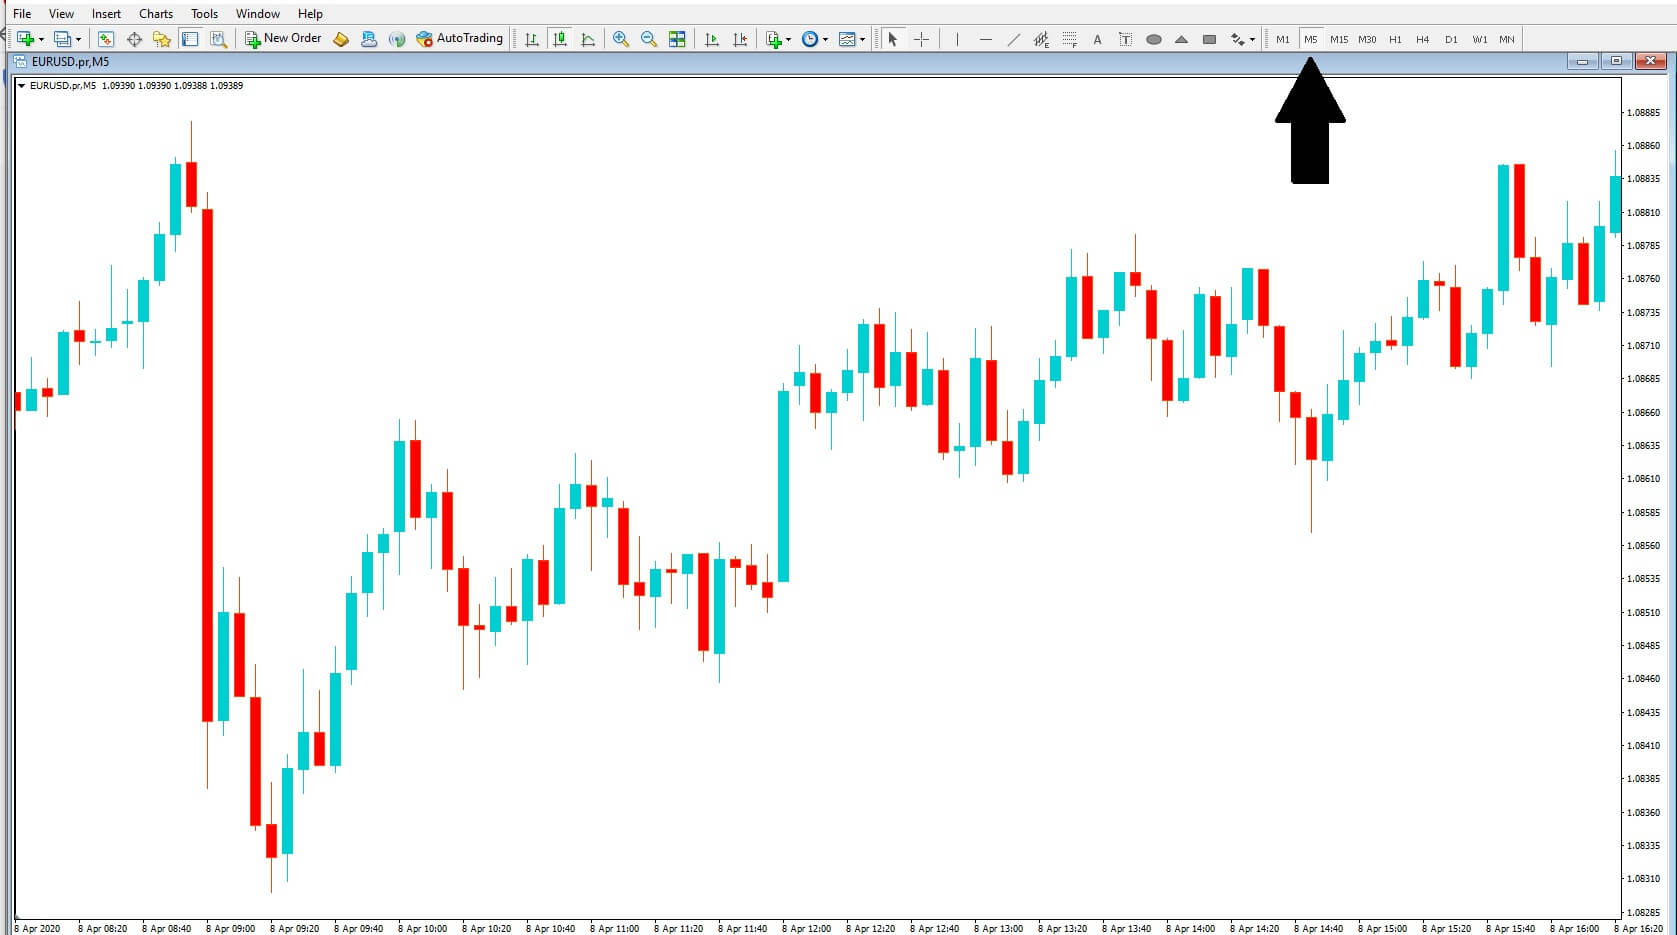
Re-insert B, No matter which time frame you chose to trade on, be it a 5 minute, 15-minute, 1-hour, or daily, the candlestick will remain open for the duration of that specific time period.

Insert L

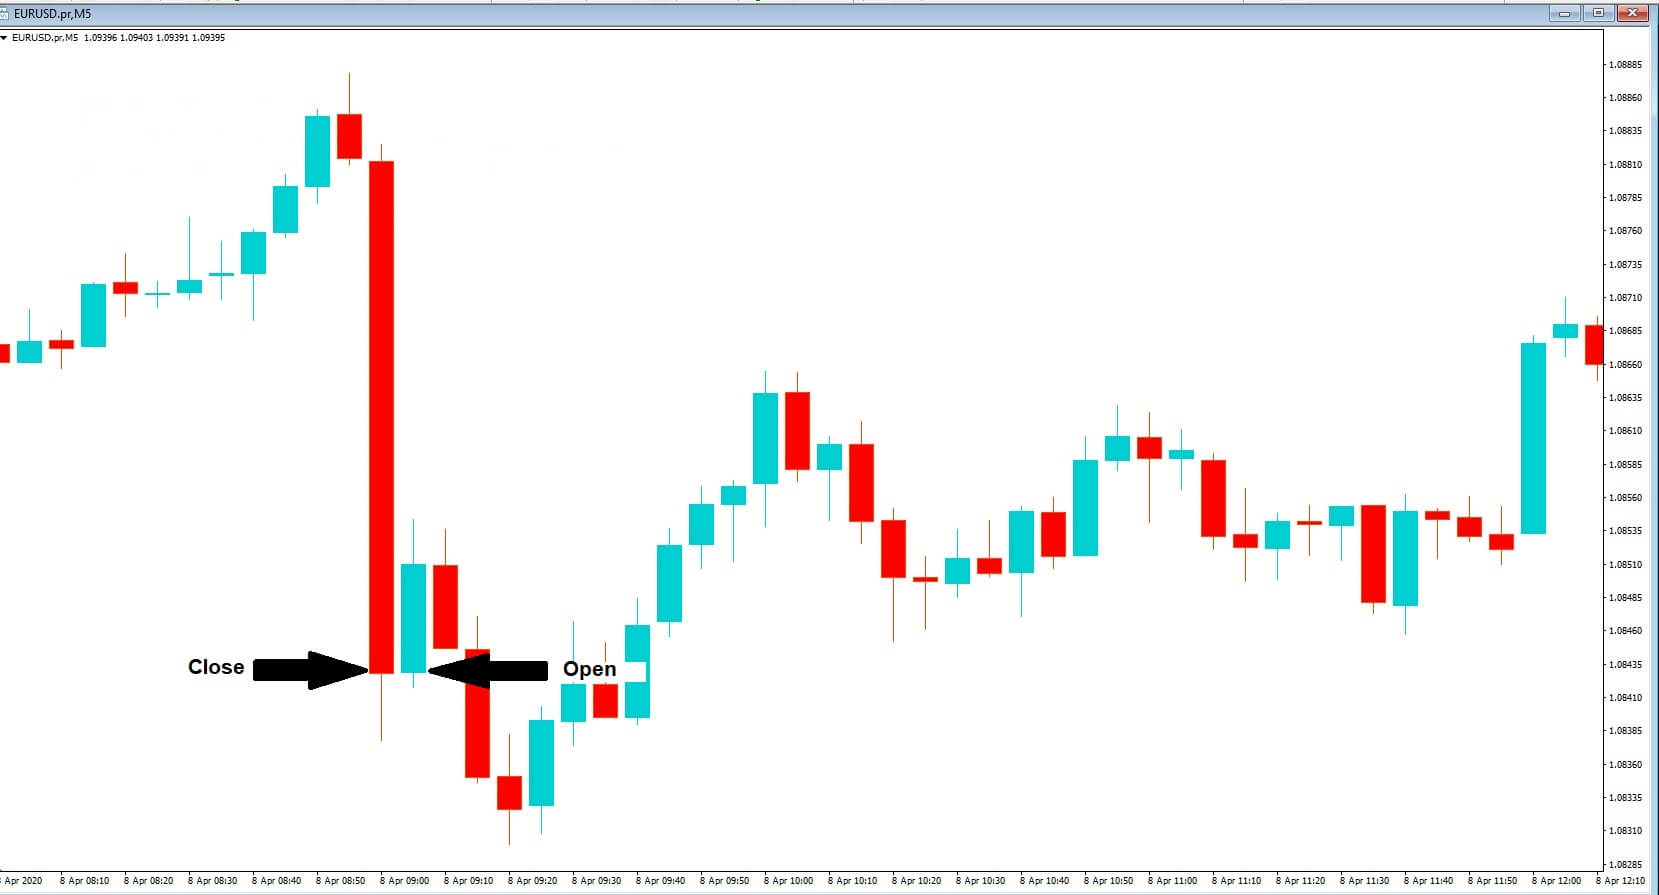
the candlestick will provide you with information on the first price traded on opening and then price direction during the particular time frame for which it is currently open. In this example, we have chosen the 5 minute time frame. And so, each candlestick will remain open for 5 minutes each. When closed it can also provide a host of information regarding the historical price action, including the last price traded for that candle, and which then can be used in conjunction with previous candlesticks to determine price direction and specifically trend formations, the end of a trend and possible reversals in price action. This is the key information that traders require to successfully utilize candlesticks in their technical analysis.

Insert M

In the context of a real chart, we have two examples, one of a bullish or blue candlestick where we can see where the price opened during the five-minute period and where it eventually closed. And also the second bearish red candlestick, showing where that opened and eventually closed.

Insert N

Initially, the price of a candlestick may change colors several times during the time frame, but the key information is left after the time frame has ended. However, the wicks or shadows, tells the trader that at some time during the time frame price may have gone above all below the initial open. Therefore, the wicks tell the trader the complete range of price action during any given time frame.

Insert O

As a general rule of thumb, a new candlestick will open at the exchange rate, where the previous candlestick closed. Gaps can appear in volatile sessions and also sometimes when there has been a break in trading, such as after the weekend break.

The beauty about candlesticks is that forex market professionals all rely on certain formations which are well recognized and offer reliable entry points into the forex market because of the high probability that certain shapes or groups of patterns of candlesticks, which repeat themselves time after time and tells traders about the state of a particular currency pair and how it is performing and whether or not there will be a reversal in price action or if a trend is forming.

So how do we use candlesticks to trade Forex? Well, we are always looking for high probability setups because it is this which differentiates traders from gamblers, and if we know that certain candlestick formations offer a high probability of future directional bias, it will be in our favor to incorporate them into our training methodology.

Insert Q

Here are just a few candlesticks that traders look out for, the spinning top, the Doji, the Hanging Man, the hammer, and the shooting star. All of these are firm favorites and offer reliable information to traders about future potential price direction.


Reading candlesticks is like reading a story, and they should always be read from left to right on your chart in order to tell you where price has been, and whether it is faltering in any particular direction. It can tell you if the market is flat or if the market is extremely volatile, and it can predict with a high degree of accuracy future price direction. Understand your candlesticks and use them like a detective, by analyzing them in great detail and using them to tell you what is happening currently with regard to price action and where to enter and exit your trades.

Categories
Forex Market Analysis

Daily F.X. Analysis, April 15 – Top Trade Setups In Forex – Brace for Retail Sales & BOC Policy!  

On the forex front, the U.S. Dollar Index was seldom changed at 99.5 amid thin holiday trading. The economic calendar is muted a bit. The only focus today will be on the U.S. Labor Department, which will release March’s import price index (-3.2% on month expected). 

Later in the day, the U.S. Commerce Department will post March retail sales (-8.0% on month expected) and February business inventories (-0.4% on month expected). The New York Federal Reserve will publish April Empire Manufacturing Index (-35.0 expected). The Federal Reserve will release March industrial production (-4.0% on month expected), capacity utilization (74.0% expected), and its latest Beige Book.

Economic Events to Watch Today     


EUR/USD – Daily Analysis

The EUR/USD climbed 0.7% to 1.0987, French Finance Minister Bruno Le Maire said his government sees 2020 GDP contracting 8%, compared with a decline of 6% previously estimated.

The fresh uptick in the oil prices and above-forecast China trade data also helping restore the risk-sentiment. At the moment, the EUR/USD is trading at 1.0941 and consolidates in the range between the 1.0893 – 1.0967. At the coronavirus front, Australia has shown very sharp declines in the virus cases as compared to other countries and also registered declines in the death toll as per the latest report. 

On the other hand, the macro-environment also supported the EUR/USD, and so do technical charts, especially Tuesday’s marubozu candle, which is indicative of strong bullish sentiment. 

Looking forward, Spain and Italy are ready to release the report of inflation numbers for the month of March and will be essential to watch. Apart from this, the traders will also keep their eyes on U.S. Retail Sales and Industrial Production numbers for March. 


Daily Support and Resistance

  • S1 1.0811
  • S2 1.0887
  • S3 1.0936

Pivot Point 1.0964

  • R1 1.1012
  • R2 1.104
  • R3 1.1116

EUR/USD– Trading Tips

The EUR/USD prices fell after testing 1.09885 resistance level, and the pair now seems to reverse back to the long-held trading range of 1.0922 – 1.0765. The EUR/USD is likely to find support around 1.0922 level. At this moment, the EUR/USD is holding at 1.09320, having an immediate support level of around 1.09060, where the bearish breakout of this level can extend selling until the next support level of 1.0846 and 1.07990. Conversely, the resistance stays at 1.0970 and 1.1035. The MACD is tossing above and below 0, converting the bearish sentiment into bullish and vice versa. Let’s consider staying bullish over 1.0960 today. 

GBP/USD– Daily Analysis

The GBP/USD rose 0.9% to 1.2629. The GBP/USD is currently trading at 1.2508 and consolidates in the range between the 1.2604 – 1.2494. However, the currency pair traders did not give any major attention to the coronavirus (COVID-19) crisis at home because the cases are comparatively more significant in the U.S.

At the U.K. Crisis front, the United Kingdoms’ coronavirus death toll rose above 11,000, but the buyers are ignoring this probably because the death toll is comparatively larger in the U.S. almost 20,000 deaths have been registered so far.

The Brexit talks, which will be video conferencing between the European Union and the United Kingdom, are expected to happen and will likely entertain the cable traders as both sides have been stuck on the deadlines while the U.K. recently gave warning the bloc to change tactics or face serious ‘problems.

On the flip side, the headlines related to the expected British lockdown extension will likely keep the traders busy during the day ahead. Looking forward, the U.S. data, including the Retail Sales, activity numbers, and the Fed’s Beige Book, will be key to watch. The virus updates could keep the driver’s seat.


Daily Support and Resistance

  • S1 1.2352
  • S2 1.2475
  • S3 1.255

Pivot Point 1.2599

  • R1 1.2674
  • R2 1.2723
  • R3 1.2846

GBP/USD– Trading Tip

The GBP/USD is trading with a bearish bias over 1.2500 support areas to trade around 1.2516. The cable is likely to find support around 1.2490, which is extended by the triple top level, which got violated on Monday. As we can see on the 4-hour chart, the GBP/USD sideways channel has already been violated, and now it’s likely to keep the pair bullish outside this range of 1.2479 – 1.2185. 

Ahead of the U.S. retail sales, the U.S. dollar is gaining bullish momentum, driving the bearish trend in the GBP/USD pair. However, the overall bias remains bullish as the prices are holding above 50 periods EMA. Conversely, the MACD is crossing into the bearish zone, opposing the EMA signal. So let’s consider taking buying trades over 1.2472 with a target of 1.2560. 

USD/JPY – Daily Analysis

During Wednesday’s European session, the USD/JPY currency pair has succeded to recover almost 50 pips from the previous session lows and rose to a fresh session high near the 107.35 level in the last hour mainly due to the fresh upticks in the U.S. dollar. The USD/JPY is currently trading at 107.36 and consolidates in the range between the 106.94 – 107.46.

The pair for the second straight session on Wednesday showed some resilience below the 107.00 round-figure marks and attracted some dip-buying near monthly lows set on April 1.

Despite the latest positive news about decreasing the new coronavirus cases and deaths across the world, investors still worried about the economic fallout from the deadly coronavirus. This eventually supported the USD’s status as the global reserve currency and started some fresh selling around the major.

On the other hand, the risk-off market sentiment and declines in the global equity markets keep supporting the Japanese yen’s safe-haven status, which eventually keeps the currency pair limited.

Daily Support and Resistance    

  • S1 105.75
  • S2 106.52
  • S3 106.84

Pivot Point 107.3

    • R1 107.62
    • R2 108.08
    • R3 108.85

USD/JPY – Trading Tips

The USD/JPY is trading with a bearish bias, and it is pretty much likely to find support around the triple bottom area of 107.039. A downward breakout of this level can extend selling until 105.300, while the resistance holds around 108.640. The MACD and 50 periods of EMA are suggesting bearish bias, while the fundamentals side is also in favor of selling. Since we the U.S. retail sales due during the U.S. session, traders will focus on the news to drive the next movement in the market. Hence, we should look for selling trades below 107 to target 106.630, and buying can be seen above the same 107 level today.  

All the best for today! 

Categories
Forex Daily Topic Forex Price-Action Strategies

Example of a Breakout Unfit for an Entry


In today’s lesson, we are going to demonstrate an example of a breakout on the H4 chart. The chart shows that the price heads towards the North with good momentum. It makes a bullish breakout upon consolidation. However, the breakout is not the kind that the breakout traders look for. Thus, this is going to be an example which we should skip taking entry. Let us now have a look at what happens.

The chart shows that it produces a bullish candle followed by a bearish inside bar. The next candle comes out as a bullish engulfing candle. Do you notice something here? Yes, this is an entry for the buyers. However, this is not where we concentrate today. Let us proceed to the next chart to dig out the main story.

The price keeps going towards the North. The buyers are to wait for the price to consolidate and produce another bullish engulfing candle to offer them entry. The way it has been going, it seems that the buyers hold the key and dominate over the sellers.

The price makes a bearish correction and finds its support. The first bullish reversal candle comes out as a bullish inside bar. This is not a strong bullish reversal candle. It produces three more bullish candles but the price does not make a breakout at the level of resistance. The last candle closes within the level of resistance, which is a point to be noticed. It means even the next candle makes a breakout, it would be a breakout right from the level of resistance.

The next candle closes well above the level of resistance. This is a breakout but not the kind of breakout that the breakout buyers wait for. The price is trending towards the upside; it consolidates and makes a bullish breakout. These three equations suggest that the buyers may take a long entry. They must not forget that the breakout candle does not make an explicit breakout. If a breakout takes place by one bullish engulfing candle that brings momentum. Over here, it needs four candles to make the breakout. Moreover, the breakout candle forms right at the level of resistance (now support). The buyers may restrain themselves from taking such entry. Let us find out what the price does next.

The price comes back to the breakout level. This is what usually happens when the price does not make a breakout with an A+ breakout candle. The price may still head towards the North, but 1 out of 3 times, it may come back in and hits the stop loss. Thus, to have winning consistency, we might as well skip taking entry in such price action.

Categories
Forex Assets

Analyzing The BCH/USD Crypto-Fiat Pair

Introduction

BCH/USD is a cryptocurrency abbreviated for the Bitcoin Cash against the US Dollar. This is the highest traded cryptocurrency in terms of volume. Also, it is a 24/7 market. Note that, Bitcoin Cash is not the same Bitcoin; both are two different cryptocurrencies.

Understanding BCH/USD

The price of BCH/USD represents the value of the US Dollar that makes up one Bitcoin Cash. It is quoted as 1 BCH per X USD. For example, if the value of BCH/USD is 234.06, these many US Dollars are required to purchase one Bitcoin Cash.

BCH/USD Specifications 

Spread

Spread is the difference between the bid and the ask price. Spread is different with different brokers and the type of execution model they use. Below are the ECN & STP values for the BCH/USD pair.

Spread on ECN: 400 pips (4.00 USD) | Spread on STP: 450 pips (4.50 USD)

Fee

A Fee is a commission paid on each position a trader takes and closes. This fee is charged only by ECN brokers. The slippage for each lot traded is a pip. The seems to be less because one lot accounts for only 1 BCH.

Slippage

Slippage is the difference between the price demanded by the trader and the price given by the broker. There are two reasons for slippage to occur:

  • High market volatility
  • Broker’s execution speed

Trading Range in BCH/USD

A Trading range is the representation of the volatility in BCH/USD for different timeframes. The numbers help in determining the approximate risk and reward on a trade.

Procedure to assess Pip Ranges

  1. Add the ATR indicator to your chart
  2. Set the period to 1
  3. Add a 200-period SMA to this indicator
  4. Shrink the chart so you can assess a large time period
  5. Select your desired timeframe
  6. Measure the floor level and set this value as the min
  7. Measure the level of the 200-period SMA and set this as the average
  8. Measure the peak levels and set this as Max.

BCH/USD Cost as a Percent of the Trading Range

A Fee is a variable that varies as the volatility of the market changes. Below are tables depicting the variation in the costs with the change in the volatility.

ECN Model Account

Spread = 400 | Slippage = 10 |Trading fee = 1

Total cost = Slippage + Spread + Trading Fee = 10 + 400 + 1 = 411

STP Model Account

Spread = 450 | Slippage = 10 | Trading fee = 0

Total cost = Slippage + Spread + Trading Fee = 10 + 450 + 0 = 460

Trading the BCH/USD

As mentioned, BCH/USD is currently the most traded cryptocurrency in the market. Therefore, one can expect enough volatility and liquidity. The volatility in BCH/USD is very high. For example, the minimum volatility on the 1H timeframe is 20, while the maximum is 118 on the same timeframe, which is five times the minimum. Hence, this makes this pair highly volatile and risky as well.

So, it is ideal for traders to trade when the volatility is between the average values. The volatility during such times is neither too high nor too low. Also, the costs aren’t too high. If traders wish to reduce costs even further, they could trade via limit or stop orders instead of market orders, as this would completely cut the slippage on the trade. The cost variations when the trades are executed either by limit or stop is given below.

ECN Model Account (Using Limit Orders)

Spread = 400 | Slippage = 0 |Trading fee = 1

Total cost = Slippage + Spread + Trading Fee = 0 + 400 + 1 = 401

Categories
Forex Fundamental Analysis

What Impact Do ‘Building Permits’ News Release Have On The Forex Market?

Introduction

The building permits monthly reports is one of the major indicators closely watched by economists and Fundamental analysts. It is also one of the most misunderstood numbers even by experienced traders. Understanding the difference between building permits report, housing starts report, and housing completion reports and what they imply is key here. It is important to understand the building permits report because it plays a key role in predicting GDP growth.

What is a Building Permits Report?

Building Permit Report

It is an official authorization by the local governing body to allow construction of a new building or the reconstruction of an old one. An individual owning land cannot simply build a house or a commercial store without any approval from the concerned legal authorities. The building which has obtained its permit implies that it has received the planning permission by the local state planning department.

The governing body dictates construction rules and regulations, which will be specific to that geographical location. For example, a state which is vulnerable to earthquakes is likely to have a mandate which dictates that building should be able to tolerate a certain level of seismic activity. A coastal region-building permit might require the builders to construct the building to tolerate high-velocity winds etc.

Housing Starts Report

It is a monthly report which tells the number of houses that have started their construction activity recently and are at the beginning stage of the construction process.

Housing Completion Report

It is also a monthly report which tells the number of houses that have reached their finishing stage with the majority of the construction work completed recently.

How is the Building Permits Report obtained?

In the United States, the United States Housing Sector monitors building permits. The Housing Sector releases the U.S. Housing Starts report from which the United States Census Bureau releases the monthly building permits report. The report is released every month in the second or third week for the previous month (eighteenth working day to be precise).

As per the Census Bureau, the organization conducts a voluntary mail survey, to which the officials give a response with their reports and figures from which they generate the final report. They cover almost the entire country through the individual permit offices, which in most cases, are the municipalities. Based on geographical locations, the reports can be categorized for area-specific analysis. 

Is the Building Permits Report important?

The number of building permits applied is genuine, as it costs around 500 to 2000 dollars on the type of building, which can be a residential home or a commercial store. All the numbers are, in actuality, going to translate into real newly constructed buildings.

Construction of a building involves a lot of economic activities like the hiring of the labor force, preparing raw materials, purchasing construction items, hiring engineers, etc. Because of the scale and nature of the activity, more money gets circulated into the economy. A large increase in the number of building permits can indicate an increase in employment, increased consumption of goods and services, flourishing businesses, etc.

Construction permits also indicate that the population has enough funds or has the necessary means, which is usually bank loans. Most people construct a home through a mortgage, which implies that banks are ready to lend money; this again implies that money was injected into the economy to stimulate economic activity.

An increase in building permits can also mean that the population has more confidence in their economic prospects and trust the solvency of the plan. Since the construction of a home or a commercial store involves a significant amount of money, we can also give an insight into the nation’s liquidity and health of the economy. An increase in building permits also gives us an idea about the country’s lending environment, i.e., whether the health of the banking sector for the monetary base of the nation will expand or contract, which can be inflationary or deflationary respectively.

How can the Building Permits be Used for Analysis?

The data set goes back to the 1960s, which is a fairly decent range to rely on its correlation with economic activity with good confidence. The U.S. Census Bureau publishes building permits report, housing starts report, and housing completion report. Among these, the building permits report is the most closely watched reports as it indicates an upcoming economic activity. Whereas the housing starts report tells us about the current economic activity, while the housing completion report tells us of the past economic activity.

An increase in the building permit report tells that the construction sector people are confident about an increase in demand for house sales, which implies more money will be in circulation soon. Conversely, decreased building permits report tells us that the economy is slowing down or contracting due to which people are not ready to buy new houses or do not have sufficient funds to afford the cost.

The building permits report is an advanced indicator, whereas the housing starts report is a current indicator, and the housing completion report is a trailing indicator. The building permit indicates first of an upcoming economic surge or plunge while the housing starts report reflects the current economic condition, and the housing completion report shows the effect of a past economic surge or plunge.

It is noteworthy to mention that the housing completion follows the housing starts numbers, and the housing starts number follow the building permits numbers. An increase in the building permits will automatically result in a rise in the housing starts number in the subsequent months, and a few more months later, the same numbers will appear in the housing completion report. Hence, understanding which reports implies what economic activity is key here.

Sources of Building Permits Reports

We can browse through the historical building permits survey reports on the official website of the United States Census Bureau here. You can also find the construction-related statistics here.

Impact of Building Permits news release on the price chart 

In the first part of the article, we understood the importance of Building Permits in a country, which is a key indicator of demand in the housing market. The ‘Building Permits’ indicator, also known as ‘Building Approvals’, is one of the most impactful events in the forex market.

Traders and investors around the world pay a lot of attention to this data and keep close on its numbers. The ‘Building permits’ data is released on a monthly basis and is said to cause a fair amount of volatility in the currency pair. In the following section, we shall see how the data of ‘Building Permits’ affects the price charts and notice the change in volatility.

For illustrating the impact of the news, we will be analyzing the latest month-on-month ‘Building Permits’ data on Australia and measure the impact of the same. A higher than expected reading is considered to be positive for the economy, while a lower than expected reading is considered to be negative. In this case, the ‘Building Permits’ of Australia was reduced to -15.3% from +3.9%, which is a reduction of a whopping 19.2%. One would already imagine this to be very bad for the Australian economy but let us see what it meant for currency traders.

AUD/CAD | Before The Announcement

We shall begin with the AUD/CAD currency pair, where the above chart shows market action before the news announcement. We see a decrease in volatility as the announcement is nearing as the market players are eagerly waiting for the ‘Building Permits’ data. We already have an idea from what is forecasted by economists that the data is going to much worse than before due to a fundamental factor that has affected the Australian economy. Instead of predicting what the numbers are going to be, it is better to wait for the actual news release and trade based on the shift in momentum.

AUD/CAD | After The Announcement

In the above chart, after ‘Building Permits’ data is released, the market collapses, and the price goes below the moving average. The market reaction was as expected, where there was a sudden increase in volatility on the downside. The data shows that there was the least confidence in the housing market of Australia in the month of February. As the market falls and given that the ‘Building Permits’ data was very bad, we can ‘short’ the currency pair with certainty.

A few hours later, we see that the market shot up and reversed completely.  This move was influenced by the announcement of ‘Interest Rate’ by the Reserve Bank. We need to always be aware of such events, especially when we are already in a trade. This teaches us the importance of trade management, which crucial for every trade.

AUD/CHF | Before The Announcement

AUD/CHF | After The Announcement

The above images represent the AUD/CHF currency pair, where it seems like the market has factored in weak ‘Building Permits’ data before the news announcement. After a big downward move, the market has retraced from the ‘lows,’ which is the ideal use case for going ‘short.’

Also, at present, the price is below the moving average, which shows the weakness of the Australian dollar. After the data is released, the price goes lower but leaves a spike on the bottom, and we see increased volatility on both sides. But this shouldn’t scare us, and we need to stick to our plan of going ‘short’ in the currency pair as the data was really bad.

EUR/AUD | Before The Announcement

EUR/AUD | After The Announcement

In the EUR/AUD currency pair, the Australian dollar is on the right-hand side, which means a news release positive for the currency should take the price lower and vice versa. The characteristics of this pair are different from the above-discussed pairs since the price has retraced the major uptrend by a lot. This means the Australian dollar is very strong against the Euro.

Therefore, any news release that is negative for the Australian economy may not collapse the Australian dollar here. Therefore, it needs to be traded with caution. After the news announcement, the price does go up because of the weak ‘Building Permits’ data, but after a couple of candles, the price goes below the ‘news candle.’ We see that the news data does not have much impact on this currency pair and not suitable for trading based on news.

That’s about Building Permits and the impact of its new release on the price charts. Let us know if you have any questions in the comments below. Cheers.
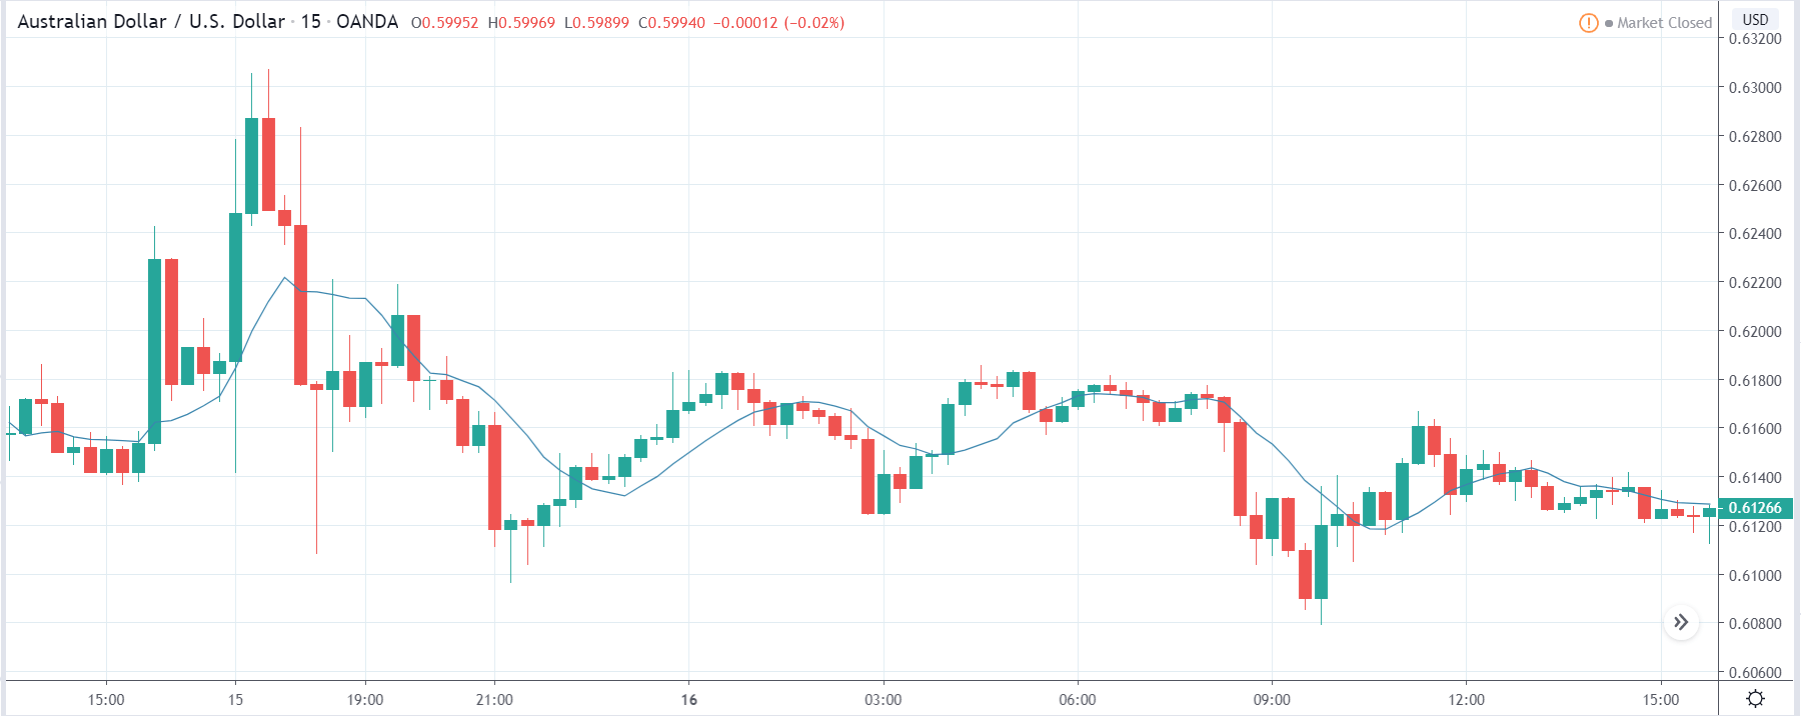
Categories
Forex Market Analysis

EUR/CHF Triangle Breakout – Time to Short the Pair!  

The EUR/CHF is facing stiff resistance around 1.05440, which is mostly extended by a descending triangle pattern that has already been violated. This may drive the EUR/CHF pair further lower until the next support area of 1.0502. The Euro as a signal currency is still staying bearish in the wake of an increased number of COVID 19 cases around the globe.  

Most of the selling in the EUR/CHF pair triggered after the Eurozone money market rates crawled lower from four-year speak. It’s a hint the Euribor benchmark may be beginning to counter to European Central Bank measures aimed at reducing the funding rush beyond the single currency bloc. Declines in the oil prices could be recovered during the day ahead, mainly due to the risk recovery in the market, as the coronavirus cases are showing some sign of a slowdown in global economies. 


The EUR/CHF pair has formed a descending triangle pattern which was supporting the pair around 1.0540 along with resistance around 1.05675. As we can see, the pair has already breached the descending triangle pattern, which now opens further room for selling until the next target level of 1.0540.  

The 50 EMA and the descending trendline is weighting on the cross pair, and it may drive selling bias in the EUR/CHF today. The violation of 1.0540 level can extend the selling trend until the next target level of 1.0520 and 1.0509. Good luck! 

Categories
Forex Signals

Bullish Bias in Gold Continues to Dominate – Who’s up for a bullish Signal?

On Tuesday, the precious metal gold continues to trade higher around 1,730 area in the wake of increased safe-haven appeal driven by COVID 19. Furthermore, the early-day upbeat remarks from the U.S. Task Force Briefings, news from the U.K. also recommend the coronavirus (COVID-19) is near to its expected high’s. The same could negatively influence the gold’s safe-haven appeal that has lately fired the bullion to the highest since November 2012.

The U.S. President Donald Trump is showing a willingness to support the USA fight against the coronavirus (COVID-19), which eventually seems to help the risk-tone. This time, the Fed will elevate about $2.3 trillion to promote small and medium-sized companies, districts and workers harmed by the coronavirus break.

Apart from this, the recent recovery in the Asian equity and continued rise in the U.S. 10-year Treasury yields, which is currently near 0.773%, provided support to the oil prices recover. The better-than-expected Chinese trade data also give confidence to the oil buyers.


Technically, the XAU/USD has the potential to go long, which is why we have opened a buying signal at 1728.27 with a stop loss of around 1718.27 and take a profit of 1738.27. The bullish channel likely keeps the gold prices higher, while the RSI and MACD are suggesting a continuation of a bullish bias in the gold. On the higher side, gold has the potential to go after 1,743 level today.

Buying Price: 1728.27
Take Profit 1738.27
Stop Loss 1718.27
Risk/Reward 1
Profit & Loss Per Standard Lot = -$1000/ +$1000
Profit & Loss Per Micro Lot = -$100/ +$100

Categories
Elliott Wave Guide Forex Elliott Wave

Intermediate Level Elliott Wave Analysis Guide

We have finished the section that covers the Intermediate Level of the Elliott Wave Analysis based on the work of Glenn Neely. These concepts are described and include the following aspects.

1.- Introduction to Intermediate Wave Analysis. In this section, we present the concept of grouping waves and how to apply them in the real market.
2.- Motive Waves Analysis. This section, divided into three parts covers the following aspects:
– The first part presents the extension concept and its application in the real market.
– The second part extends the concepts of Alternation, Equality, and Superposition, and we identified how the price action follows these rules.
– The third part presents the canalization process.
3.- Corrective Waves Analysis. This part unfolded in five parts, includes the following concepts:
– The first part reviews the rules of construction of corrective formations and the flat pattern, including its variations.
– The second part presents how to analyze the zigzag pattern and its variations.
– The third part exposes the characteristics and rules of the triangle pattern.
– The fourth part discusses the contracting triangle, including its variations, rules, and target zones.
– The fifth part dedicated to expanding triangles presents its variations and rules.
4.- Validation Rules. This two-part section exposes the next principles:
– In the first part, we learn how to validate impulsive waves.
– The second part shows how to validate corrective waves.
5.- Simplification of Wave Analysis. This last section illustrates how the compaction process can help the wave analyst to ease its analysis.

Categories
Forex Price-Action Strategies

A Classic Example of the H4 Breakout Trading

In our trading lesson, we have been demonstrating H1 breakout strategies in our last five lessons. Today, we are going to demonstrate an H4 breakout trade setup, which is a classic example of price action breakout trading. The price makes a bullish breakout at the last highest high; comes back at the breakout level and produces a beautiful bullish engulfing candle closing well above consolidation resistance to offer a long entry. Let us proceed and see how it occurs.

The chart shows that the price heads towards the North with good bullish momentum. On its way towards the North, it does not produce even a single bearish reversal. It suggests that the buyers have been very confident. It makes a breakout at the last swing high. The breakout is not explicit though. However, the price continues to go towards the North after the breakout. Then, it finds its resistance and produces two bearish reversal candles. Look at the last candle. It closes within the last highest high (breakout level), which is a flipped support now. This is one of the most important factors in price action trading. The price reacts to such levels and produces reversal candles.

As mentioned, the level produces a bullish engulfing candle closing well above consolidation resistance. The buyers may trigger a long entry right after the candle closes by setting stop loss below the level of support and by take profit with 1R. Let us proceed to the next chart how the trade goes.

The last candle comes out as a spinning top. Not a good start for the buyers, but the buyers must keep patience here. Trading on the H4 chart allows traders to manage their trade and take early exit. However, they must not think taking an early exit here. The last candle is not a strong bullish candle, but it is not a strong bearish reversal either. Let us proceed to the next chart. It may take one good candle to hit the target.

The price does not take too long to hit the target. It hits the target with the last candle. This is a classic example of trading on the H4 breakout trading. After the breakout, the price comes back at the breakout level. It produces a bullish reversal candle right at the breakout level. The bullish reversal candle comes out as an engulfing candle closing well above consolidation resistance. Price actions traders wait for the price to behave like this to take an entry.


Categories
Forex Assets

‘LTC/USD’ – Understanding The Crypto/Fiat Pair & Trading Costs Involved

Introduction

Cryptocurrencies are traded in pairs by pairing them with a fiat currency. Always, the cryptocurrency is written on the left and the fiat currency on the right. LTC/USD is a cryptocurrency, which is an abbreviation for the Litecoin versus the US Dollar. Like the Bitcoin and Ethereum, Litecoin is extensively traded in the exchange market.

Understanding LTC/USD

The market price of LTCUSD depicts the value of the US Dollar, which is equivalent to 1 Litecoin. It is quoted as 1 LTC per X USD. For example, if the value of LTCUSD is 41.69, then one Litecoin is worth 41.69 US Dollars.

LTC/USD specifications

Spread

Spread is the difference between the bid and the ask price in the market, where bid price is given considered when shorting a pair and ask price when going long on a pair. The varies from broker to broker. It also differs based on the type of execution model used. Below are the spreads for the LTC/USD pair for both ECN & STP accounts.

  • Spread on ECN: 50 pips (0.5 USD)
  • Spread on STP: 60 pips (0.6 USD)

Fee

ECN brokers charge some commission on every position a trader opens and closes. The fee for ECN accounts is about $0.18 per standard lot, which corresponds to 18 pips.

Slippage

Slippage is the difference between the price asked by the user and the price given by the broker. There is this difference due to two reasons – High market volatility & broker’s execution speed.

Trading Range in LTC/USD

Below is the trading range table for the LTCUSD, which represents the minimum, average, and maximum volatilities of a pair for different timeframes using the ATR indicator. These values can prove to be helpful for assessing one’s profit/loss on a trade.

Procedure to assess Pip Ranges

  1. Add the ATR indicator to your chart
  2. Set the period to 1
  3. Add a 200-period SMA to this indicator
  4. Shrink the chart so you can assess a large time period
  5. Select your desired timeframe
  6. Measure the floor level and set this value as the min
  7. Measure the level of the 200-period SMA and set this as the average
  8. Measure the peak levels and set this as Max.

LTC/USD Cost as a Percent of the Trading Range

The cost as a percent of the trading range represents the variation of cost on a trade based on the change in the volatility of the market. And these variations are indicated as a percentage. Using the magnitude of the percentages, we shall determine the ideal times of the day to trade this coin.

ECN Model Account

Spread = 50 | Slippage = 5 |Trading fee = 18

Total cost = Slippage + Spread + Trading Fee = 18 + 50 + 5 = 73

STP Model Account

Spread = 60 | Slippage = 5 | Trading fee = 0Total cost = Slippage + Spread + Trading Fee = 5 + 60 + 0 = 65

Trading the LTC/USD

LTCUSD is a crypto-fiat pair that has got enough volatility and liquidity to trade in the market. LTC is the fourth highest traded coin in terms of volume. However, it is not apt to trade anytime during the day. There are ways through which one reduces their costs for the same trade.

In the above table, if the percentages are high, then the costs are very high and vice versa. So, the cost is more for low volatile markets and less for high volatile markets. If you are a scalper or short-term trader, you may trade when the volatility is high as the profit margin is small, and you can avoid high costs.

Positional traders – these traders usually aim for large movements, and high costs become a little insignificant for their big pip movements. So, such traders may trade when the volatility is around the average values. Finally, it is not advisable to trade during low volatilities because the costs are high, and there is barely any movement in the market.

Slippage is a variable in total costs that can be eliminated by placing orders as ‘limit’ or ‘stop.’ We hope you found this analysis on LTCUSD useful. Stay tuned for more informative content. Cheers.

Categories
Forex Course

99. Pivot Points: What have we learned so far?

Introduction

In the previous six lessons, we discussed pivot points right from understanding what they are, to the strategies one can apply to trade the markets. Now, let’s summarize what we’ve learned so far and move on with another exciting tool for analyzing the markets.

Pivot Point Basics

A pivot point is a technical indicator in technical analysis trading, which determines potential support and resistance levels in the market. This indicator is stationary, unlike the other indicators that move with the change in price.

The pivot points are levels that are essentially determined using the previous day’s high, low, and close price. So, every trading day, we can obtain one set of the pivot point.

What is the pivot point made up of?

There are up to six levels that make up the pivot point levels. One of the levels is the pivot point level, and the rest are support and resistance levels. The six pivot levels are symbolized as follows:

Pivot Point (PP/P)

First Support (S1), First Resistance (R1)

Second Support (S2), Second Resistance (R2)

Third Support (S3), Third Resistance (R3)

Fourth Support (S4), Fourth Resistance (R4)

Fifth Support (S5), Fifth Resistance (R5)

Note that, most of the time, we stick to the levels until S3/R3 because the price does not usually touch the levels beyond it.

How are the pivot levels calculated?

As mentioned, the pivot points are calculated using the close, high, and low of the prior trading day.

For example, the Pivot Point, First Support, and First Resistance are calculated as follows:

PP = (High + Low + Close) / 3

S1 = (2 x PP) – High

R1 = (2 x PP) – Low

Similarly, one can calculate levels until R5/S5. However, these values need not be calculated practically. There are trading platforms that automatically calculate these values.

Types of Pivot Points

There are four types of pivot points based on how the levels are calculated.

  1. Standard
  2. Woodie
  3. Camarilla
  4. Fibonacci

Most of the time, the standard pivot point levels are used.

Strategies using Pivot Points

There are several ways through which one applies pivot points. In our course, we have listed out three strategies.

Range trading strategy

According to this strategy, one can consider buying when the support level of the pivot points coincides with the support level of the range. A similar strategy can be applied for shorting as well.

Breakout Trading Strategy

As the name pretty much suggests, traders can consider going long or short when the price breaks above the resistance or below the support level.

Measuring Sentiment

Traders can use the pivot point level (PP) to determine the trend of the market. If the market breaks above the PP, it indicates a buyer’s market and vice versa.

Summing it up

The pivot point is that indicators that can be used every level of traders from beginners, intermediate to the advance trades. However, this indicator is not a standalone indicator. It must always be used in conjunction with other indicators and tools to have higher odds of favoring you. We hope you enjoyed this series on pivot points. Happy trading!

Categories
Forex Videos

Forex! Mastering Trading The Major Pairs!

Top Facts You Need To Know Before Trading Major Currency Pairs


Insert A: In this video presentation, we will be looking at trading the major currency pairs. Like all currencies which are trading in pairs, the major currencies are traded against the US dollar.
The quotes are the same as other currency pairs, but because the major currency pairs are more popular, this means there is more volume going through when they are traded than other currency pairs, and we, therefore, tend to find that the spreads are tighter on the majors.
Before we look at which of the pairs are considered the major currencies, we should just establish what a currency pair is. All financial traders look to speculate on the changing value of a particular asset, for example, precious metals such as gold and silver and stocks and shares.

The only difference in forex trading is that you are speculating on the value of one currency against another. And this is where the value of the first currency is expressed in units against the value of the second. These units are known as the exchange rate, and the exchange rate moves up and down and is measured in pips.


Insert B: If the Euro is being valued against the US dollar, the current exchange rate is 1.09, where 1 Euro is equal to $1 dollar and nine cents. Easy enough. The best way to learn how to gauge currencies and their value against one another is to open a demo account and spend some time looking at screen charts and seeing how currencies are quoted against each other. You can even play some trades at no risk to see how the spreads differ and look at historical price action of the pairs while experimenting with some of the many technical analysis tools which are available to help try and determine future price direction. This is the safest way to learn how to trade using virtual money in real market conditions.


Insert C: Let’s look at some examples now to learn how to read major currency pairs. This is one of the most commonly used trading platforms; it’s called the MetaTrader MT4 and is widely available via most brokers.
On the left of the screen, we can see the market watch section, which is home to all the currency pairs that your broker will offer you. We have highlighted one pair, which is one of the most widely traded major currency pair, the EURUSD, by clicking on the pair in the market watch window, we can open a trading chart and drag it onto our screen which we have done here.

Insert D, each currency is denoted by its three-letter ISO, Which stands for International organization for standardization.

Insert E, The following ISO’s makeup the major currency pairs, so JPY for the Japanese yen GBP for the British pound, USD for the United States dollar, CHF for the Swiss franc, EUR for the Euro, cad for the Canadian dollar, AUD for the Australian dollar, NZD for the New Zealand dollar, and finally SEK for the Swedish krona.


Insert F, If we believed next fundamental reasons such as the European Union was about to increase their interest rates, which might be attractive to investors in Euros, we might expect that the Euro would rise in value you against the US dollar, as in this example, and where we would execute a buy trade in the hope that the Euro would rise in value against the dollar in which case we would make money.

Insert G, If only, on the other hand, we expected that the US Federal Reserve was going to increase their interest rates, which would be attractive for investors to then buy dollars, we might expect the price to fall all in this pair, in which case we would sell it.

There are a whole host of different reasons why currencies rise and fall against each other as well as economic conditions such as the strength of a country’s economy. There are technical reasons as well, and whereby traders use a system called technical analysis to tell them when the price of a pair might move higher or lower, and this would be based on factors including a currency being overbought or oversold.
Therefore traders bet against these exchange rate fluctuations where each movement is measured in pip value and where traders bet and amounts in value against the rise and fall of the exchange rate. So if a retail trader betted that the exchange rate would move up 10 pips and they bet $1 per pip, and they were correct, they would make $10. However, if the market moved down and therefore against them by 10 pips, they would lose $10 and so on.
When the unit value of the dollar is higher than an equal unit of a counter currency, the US dollar will be quoted first, such as the USD JPY pair. However, currency values can go from parity to inverted, but we’re typically the format will remain the same. The first quoted currency ISO is called the base currency. In this example, that’s the US dollar, and whereby the second currency is the quote currency.

Base currencies can be quoted as quote currencies on other pairs and vice versa, depending on which pairs are traded. Remember, currency pairs form the largest amount of volume going through the market at any given time, and this means there is a great deal of liquidity in these pairs. And liquidity and volume mean price movement. And movement means opportunities to make money trading Forex.
It is no coincidence that the major currencies belong to those countries which are amongst the richest on our planet. This means that they have a high gross domestic product due to the amount of goods and services which they provide across the world, and which has made them wealthy. Investors, traders, and providers of goods and services are continually driving exchange rate fluctuations, and this is why the best training opportunities are available on the major currency pairs.

Categories
Crypto Videos

Mastering Crypto Using The Morning Star


Trading Crypto using the Morning Star Pattern

The Morning Star pattern is a three-candle candlestick pattern that signals a bullish reversal and appears at the bottom of a downtrend. It signals a trend slowing down and a large bullish move laying the foundation for a new uptrend.
Identifying the Morning Star Pattern
Identifying the Morning Star on cryptocurrency charts requires more than just identifying the three main candles. It also requires knowledge of the previous price movement. The pattern should be identifiable if these five things occur:

The market should be posting lower highs and lower lows prior to the Morning Star formation.
The large bearish candle shows up as a result of large selling pressure as well as a continuation of the existing downtrend. Traders should be looking to take only short positions as there are no signs of a reversal yet.
The second candle is a small-bodied candle (sometimes even a Doji candle) is the first sign of market showing downtrend fatigue. This candle often gaps lower and makes a lower low. It does not matter whether the candle ends up being bearish or bullish, as it is only supposed to represent market uncertainty.
The first real sign of bullish pressure is this exact candle. It should be a big green candle followed by an increase in volume.
After a successful reversal, traders will start to enter long positions as the market posts higher highs and higher lows. However, make sure to manage the risk through the use of well-placed stops-losses.

Trading the Morning Star Pattern

The chart on the screen shows us the formation of a Morning Star pattern, where an established downtrend is leading up to the formation of the Morning Star reversal pattern.
Once the formation has completed, traders are looking for an entry point at the open of the next candle. If a trader is more conservative, they could delay their entry point until they are satisfied with how the pattern plays out.
Targets should be placed at previous resistance levels or previous areas of consolidation. Stops-losses should be placed right below the recent swing low. As there are no guarantees of this pattern playing out correctly, traders should always maintain a positive risk to reward ratio to avoid taking any substantial risk of ruining their portfolio.

Morning Star Pattern reliability

The Morning Star pattern, just like any other candlestick pattern, should be used alongside other trading tools available to the traders. Even though this pattern occurs frequently and has a fairly high chance of playing out correctly, one has to take all precautionary measures to protect oneself from the risk.

Categories
Forex Market Analysis

Daily F.X. Analysis, April 14 – Top Trade Setups In Forex – Eyes on G7 Meeting via Satellite! 

On the forex front, the U.S. Dollar Index was little changed at 99.49 amid thin holiday trading. The economic calendar is a bit muted, but the only focus today will be on the U.S. Labor Department will release the March import price index (-3.2% on month expected). 

Economic Events to Watch Today     


EUR/USD – Daily Analysis

The EUR/USD found bids and crossed above 1.09 level while representing 0.37% gains, mainly due to the recent broad-based U.S. dollar weakness after risk recovery in the market sentiment in the wake of fresh measured optimism about coronavirus outbreak. 

The fresh uptick in the oil prices and above-forecast China trade data also helping restore the risk-sentiment. At the moment, the EUR/USD is trading at 1.0941 and consolidates in the range between the 1.0893 – 1.0967.

At the coronavirus front, Australia has shown very sharp declines in the virus cases as compared to other countries and also registered declines in the death toll as per the latest report. Meanwhile, India’s flow is starting to drop, as the growth rate of new cases has consecutively declined after April 6. Moreover, the discussion of easing restrictions on activity is taking attention in the U.S. and other parts of the world. 

On the other hand, the above-forecast China trade data, especially imports, which registered a growth of 2.4%, contradicting expectations for a 2.4% decline, and the uptick in the crude oil prices, is helping improve the risk sentiment. 

The EUR currency got supported by multiple factors, the figures of newly infected peoples and death toll showing a sign slowing down across the hotspots in Europe and boosted the sentient around the shared currency. The Eurogroup has reached a half a trillion euros virus rescue package gave further support to the common currency bulls.

Looking forward, the USD moves and virus updates will continue to play an important role. Traders will keep their eyes on the G7 meeting for the fresh trading sentiment.

Daily Support and Resistance

  • S1 1.0772
  • S2 1.0847
  • S3 1.0877
  • Pivot Point 1.0923
  • R1 1.0953
  • R2 1.0998
  • R3 1.1073

EUR/USD– Trading Tips

Last week, the EUR/USD violated the asymmetric triangle pattern, which has lead the EUR/USD prices further higher towards the next resistance level of 1.09299 area. The long-held trading range of 1.0922 – 1.0765 as it’s been already violated, and now the pair is holding above this level. 

At this moment, the EUR/USD is holding at 1.09320, having an immediate support level of around 1.09060, where the bearish breakout of this level can extend selling until the next support level of 1.0846 and 1.07990. Conversely, the resistance stays at 1.0970 and 1.1035. The MACD is tossing above and below 0, converting the bearish sentiment into bullish and vice versa. Let’s consider staying bullish over 1.0960 today. 

GBP/USD– Daily Analysis

Today in the Asian trading hours, the GBP/USD currency pair found bids and hit the monthly high near above 1.2550, mainly due to fresh declines in the broad-based U.S. dollar in the wake of risk-on market sentiment. As well as, the latest statement that the UK PM Boris Johnson has discharged from the hospital and still recovering from coronavirus, this news also helped the pairs quote. The GBP/USD currency pair is currently trading at 1.2568 and consolidates in the range between the 1.2504 – 1.2574. However, the currency pair traders did not give any major attention to the coronavirus (COVID-19) crisis at home because the cases are comparatively larger in the U.S.

At the U.K. Crisis front, the United Kingdoms’ coronavirus death toll rose above 11,000, but the buyers are ignoring this probably because the death toll is comparatively larger in the U.S. almost 20,000 deaths have been registered so far.

On the other hand, the reason behind the pair’s bullish moves could also be the UK PM Boris Johnson’s health recovery as Johnson left the hospital. Though, The Guardian relied on his spokesman to say that He is “focusing on recovery.”

On the negative side, there are many chances to extend the U.K. lockdown for another month. Sir Patrick Vallance, Government Chief Scientific Adviser, said that the deaths toll from coronavirus could continue to rise this week or that could last for up to 3-weeks. It is worth mentioning that Chris Hopson, chief executive of NHS (National Health Services) Providers, indicates the lack of medical supplies.

Daily Support and Resistance    

  • S1 1.2366
  • S2 1.2436
  • S3 1.2474
  • Pivot Point 1.2505
  • R1 1.2544
  • R2 1.2575
  • R3 1.2645

GBP/USD– Trading Tip

The GBP/USD is trading with a bullish bias over 1.2500 to trade around 1.2496 but still holds within a sideways channel. The GBP/USD sideways channel has already been violated as the GBP/USD is holding around 1.2520 and along with resistance around 1.2770. Considering the weakness in the U.S. dollar, the chances of selling remains low, but the bullish bias remains solid over 1.2500 level. 

Since the resistance level of 1.2500 has already been violated, we may see GBP/USD prices going towards the next resistance level of 1.2720. The MACD and 50 EMA are also supporting the bullish bias, so let’s consider taking buying trades over 1.2432 with a target of 1.2500 first and then buying over 1.2500 to target 1.2610. 

USD/JPY – Daily Analysis

 the USD/JPY currency pair failed to continue its winning moves and dropped to 2-weeks low near the 107.53, mainly due to the fresh losses in the broad-based U.S. dollar in the wake of risk-on market sentiment. On the flip side, the risk-on market sentiment also weakened the Japanese yen and helped limit the downside in the currency pair, at least for the time being. 

The USD/JPY is trading at 107.69 and consolidates in the range between the 107.53 – 107.81. The reason behind the global risk-on market sentiment could also be better-than-expected Chinse trade data, which keeps the U.S. dollar U.S.wer and provided the goodish boost to the riskier currencies.

At the data front, the data showed China’s exports improved in March and fell 6-6% YoY as compared to a 17.2% slide in the previous month. Moreover, imports reversed the previous month’s decline and rose 2.4% during the reported month.

While the futures on the S&P 500 are representing a 1.27% gain at press time and the U.S. dollar U.S.ntinues to lose its momentum across the board. The dollar index, which measures the worth of the greenback against majors, is reporting a 0.30% drop. 

Daily Support and Resistance    

  • S1 106.59
  • S2 107.18
  • S3 107.46
  • Pivot Point 107.77
  • R1 108.05
  • R2 108.36
  • R3 108.95

USD/JPY – Trading Tips

The USD/JPY is trading with a bearish bias, and it is pretty much likely to find support around the triple bottom area of 107.039. A bearish breakout of this level can extend selling until 105.300. While the resistance holds around 108.640. The MACD and 50 periods of EMA are suggesting bearish bias, while the fundamentals side is also in favor of selling. Since we don’t have any major fundamental coming out shortly, traders will focus on the technical side and levels. Hence, we should look for selling trades below 108 to target 107.030 today.  

All the best for today! 

Categories
Forex Videos

Forex Education Scams – Know the Signs! Get A Real Education Free


Forex Education Platforms: A Route To Income Or A Get Rich Quick Scam?

There is an old saying in the United Kingdom: Where there is muck, there is brass. Essentially, what that means is that in any aspect of our lives, no matter how grimy, there are money-making opportunities to be made. And when the forex space opened up to retail traders after the advent of the internet, one huge area opened up regarding forex education, and where so-called experts, with very little experience of how the forex market operates, decided to set themselves up as educational gurus in order to exploit would-be traders looking to make a successful go at making money in Forex.


Be warned, if you have across people offering to teach you how to trade Forex, where they tell you that you will make a truckload of cash or fast cars, perhaps showing themselves in their luxury plane, or maybe sunning themselves in a far off exotic location, it is highly likely they are scammers looking to sell you a get rich scheme with very little substance behind it.


A great deal of these so-called forex educators make their money by getting you to subscribe to their educational platforms, where they might offer you a few videos, where you can see almost identical ones for free on YouTube, and in any case, have very little backbone to them, and where often these will be trading strategies that they guarantee will make you money, and in fact, most of them will fail.


The majority of these scammers set themselves up on platforms such as Instagram, Facebook, Twitter, and the like, while relying on the pictures of their so-called wealth made from their success as forex traders in order to subdue and entice you. When, in fact, they tend to be skilled marketers, but poor traders.

In fact, the forex space is littered with many types of fraudsters. One of the biggest areas where scammers made money was in binary options, where traders were asked to bet on the rise and fall of the forex market via binary options platforms, over certain time periods which were typically anything from 1- minute up to one hour, but where the prices were manipulated on the platforms, which operated almost like a casino, where the house always won. Regulators clamped down on this very quickly and shut them down.
Weigh more and more people ripping off newbie traders by offering them comprehensive educational experiences and where most of the information provided is inadequate or not at all comprehensive, in which case could we expect that the educational space will soon become regulated? It seems to be gathering a lot of interest in a space that is beginning to resemble the Wild West.

One thing is for sure, here at Forex Academy, we will not ask you to pay for the educational material which we provide on this website. What’s more, we offer a comprehensive educational experience and cover all the aspects that you need to be a proficient trader. And the people that write our educational material and present it to you are market professionals, some of them having come from an institutional background in the forex space. And so you can rest assured that the educational material we provide is professional, and comes with a wealth of real market experience behind it.
Forex is not a get rich scheme; there are no shortcuts to becoming a successful trader; it takes time, effort, and practice.

Categories
Forex Elliott Wave

How to Simplify Wave Analysis – Intermediate Level

Introduction

How to simplify wave analysis can seem a confusing task. However, if we consider the concepts we have previously studied, the process may be more straightforward. 

Until now, we have studied concepts and principles such as types of waves, internal characteristics of each kind of pattern, wave channeling rules, price and time alternation, and wave validation criteria, among other aspects.

In this section, we will see procedures in which we will transform the complexity into a basic market structure.

Waves Compaction

Compaction is the analysis process in which a sequence of adjacent segments that make up an impulse or correction structure (5 or 3) is grouped. Given the dynamic nature of price action, any Elliott wave pattern, once completed, can be labeled as impulsive or corrective. Therefore, this technique cannot be applied, while Elliott’s formation is in progress.

Once an Elliott wave pattern has been completed, the structure of the series can be compacted, which will make as a basic structure. Then, the formation we will use as a base in the following process for the analysis and compaction can be repeated.

Regrouping

Regrouping is the process you perform after compacting waves. At this stage, the wave analyst will use the compacted wave as the base structure of the following wave group and thus construct a series of larger waves, which may be standard or non-standard.

Integration

Integration is the process in which the wave analyst uses short-term compacted waves to form larger wave structures to be included in long-term charts. For example, once a short-term wave pattern is completed, this structure can be transferred with its labels to the long-term (or higher degree) chart. 

This process can be useful for information references when comparing short-term and long-term graphs to obtain a more logical and accurate idea of the next market movement.

The Principle of Complexity

This principle is useful for the classification of subdivisions of an Elliott pattern. Its usefulness lies in the possibility of combining large scale patterns and determining the relative name of the degree of each segment.

In other words, when a wave advances in the short term, it is straightforward to identify each segment and thus identify and label wave pattern. As time progresses, this wave increases its complexity, and the process of compacting waves is required. Once the wave is compacted, another wave is completed on a higher degree. 

Consequently, the complexity tends to grow as the waves increase, and they combine to give way to new waves.

The principle of complexity may not be relevant in the short-term analysis. However, as the horizon of analysis increases, the usefulness of this principle becomes essential. In this respect, the Elliott guidelines identified at the same consecutive level, have the same degree.

The Concept of Degree

Until now, we have used the term Degree superficially referring to an ambiguous time horizon as short, mid, or long term. 

In Elliott wave theory, the degree is not related to a specific timeframe, for example, 15 minutes, an hour, 5-day, etc. It is related to the order in which the different wave patterns are completed. 

R.N. Elliott, in his Treatise “The Wave Principle,” states that both labeling and degrees are not the ultimate purpose of wave analysis, but are an instrument that allows keeping an order to be maintained within the analysis process.

A wave degree is determined by the wave compacting process from the short to the long-term. Once the short term wave has been completed, it will be a segment in a higher time range or greater degree.

R.N. Elliott defined the following degrees to classify the order of market movements.

  • Subminuette
  • Minuette
  • Minute
  • Minor
  • Intermediate
  • Primary
  • Cycle
  • Supercycle
  • Grand Supercycle

The different degrees are represented in increasing order in terms of temporal magnitude. 

On the other hand, Prechter & Frost, in their work “Elliott Wave Principle,” incorporated six additional degrees, as shown in the following table.

In practical terms, to have a reference to the temporality to be used in the analysis process, when Elliott developed wave theory, the smallest data time range available corresponded to the hourly graph. Consequently, the wave analyst can begin by assigning the Subminuette degree to the wave structures that are completed in this temporality and thus advance successively from there.

Conclusions

In this article, we have seen how a systematic process can simplify the process of wave analysis.

The wave analyst can simplify the market analysis helped by the use of the compaction process, which should be realized once completed a wave pattern. Later, by using grades and labels, the wave analyst will be able to maintain a simplified order in the study and, in turn, make a forecast of the next most likely market movement.

In the following article, we’ll start the advanced level of the wave analysis with the study of complex corrective waves.

Suggested Readings

  • Neely, G.; Mastering Elliott Wave: Presenting the Neely Method; Windsor Books; 2nd Edition (1990).
  • Prechter, R.; The Major Works of R. N. Elliott; New Classics Library; 2nd Edition (1990).
  • Prechter, R., Frost.A.J.; Elliott Wave Principle: Key to Market Behavior; New Classic Library; 10th Edition (2005).


Categories
Forex Fundamental Analysis

Understanding The Impact Of ‘Corporate Tax’ On The Forex Price Charts

Introduction

The Corporate Tax is one of the most poorly understood economic indicators when it comes to fundamental analysis of currency pairs and the broader stock market. Most economists have concluded that the Corporate Tax is among the least efficient and least defensive Tax. Although, there is an ongoing debate among economists about the efficiency of Corporate Tax collection from various companies. Beurocrats have agreed that it causes significant distortions in economic behavior.

The common person on the street believes that the Tax is directly paid by Corporations, which is not true. Owners and Managers of corporations often assume that the Tax is simply passed along to consumers—the vagueness about who actually pays the Tax accounts for its continued popularity among officials.

What is Corporate Tax?

The Federal Corporate Tax differs from the individual income tax in two ways. First, the Tax is levied on the net income and not on gross income. This means the profit of the organization is also included in the net income with permissible deductions of business costs. Second, it applies only to businesses that as registered as Corporations and not as partnerships or sole proprietorships.

The Corporate Tax is levied at different rates for different brackets of income. For example, in the U.S., 15% on taxable income under $50,000, 25% on income between $50,000 – $75,000 and rates varying from 34% to 39% on income above that. The federal government has kept the rates low for small corporates with a lower turnover as it can benefit companies to a greater extent. However, lower rates have little economic significance. More than 90% of all the Corporate Tax revenue came from 1.5% of corporations with assets higher than $10 million.

States levy further income taxes on these corporations, the rates ranging from 3 to 12 percent. One of the main reasons behind low State Corporate Tax is that the states can easily relocate out of states that impose unusually high taxes.

Effect on Capital Flow due to Corporate Tax

Today, economists are of the opinion that the burden of Corporate Tax falls entirely on the owners of capital. The latest research says that, since capital is mobile, it will flow to investments that produce the highest after-tax returns. High Corporate Tax raises the cost of capital and reduces after-tax returns in the corporate sector, thus leads to relocation of capital into Tax-exempt sectors of the economy.

When governments reduce the rates under various tax brackets, it has two major effects. Firstly it increases the supply of capital available to corporations, and secondly, it increases the rate of return on investments in the non-corporate sectors as capital becomes more plentiful there.

The major drawback of the relocation of funds due to higher tax rates is that the burden of Tax ultimately shifts to workers and employees. The workers, over time, become less productive and earn lower real wages.

The Economic Reports

The Economic Reports of Corporate Tax are announced on a yearly basis for most of the countries. However, during economic emergencies, changes to the Tax rates will be made by the Finance Ministry to stabilize the money flow into the companies. In the U.S., the Corporate Tax data is published and maintained by the Internal Revenue Service (IRS), which is the government agency responsible for the collection of taxes and enforcement of tax laws. The IRS also handles corporate, excise and estate taxes, including mutual funds and dividends. People in the U.S. refer to the IRS as the “tax man.”

Analyzing the Data

Corporate Tax plays a vital role in the long term growth of a country. Most investors pay close attention to the Corporate Tax rate of a nation as it determines the development of the Manufacturing sector and GDP as a whole. Institutional traders compare the Corporate Tax rates of different economies and invest in those countries where the Taxes are low. They feel that lower tax rates lay down the path of growth for companies, and they will also be able to pay dividends to their shareholders.

Impact on the currency

When the government reduces tax rates, companies will be able to retain their profits, and hence this will lead to reinvestment in the company. This directly leads to the expansion of the business and will be able to increase production. When the Manufacturing sector starts to perform well, investors will be prompted to invest in the economy either by purchasing shares of a company or in the currency. When large investors invest, smaller fund houses also start buying the currency, which leads to an appreciation in the currency.

Sources of information on Corporate Tax

Corporate Tax data is available on the official website of every country’s Finance department, which also provides a comprehensive analysis of the same. Here are the Corporate Tax rates of some of the major countries of the world.      

Sources to find more information on Corporate Tax 

GBP (Sterling)AUD | USD | CAD | NZDJPY

There are many arguments in favor of the removal of Corporate Tax, but this is from the perspective of industries. When we think from the government’s point of view, the Corporate Tax is said to increase the revenue of the government, which is very much needed for running the nation. Executives believe that ‘an old tax is a good tax’ holds validity even today. Any major change in the tax regime imposes new costs and complications during the transition period.

Impact of Corporate Tax rates news release on price charts

We understood in the previous section of the article, the meaning of Corporate Tax, and the role it plays in an economy. In the following section, we will see how the Corporate Tax announcement impacts the value of a currency and cause volatility in the pair. The data of this economic indicator is keenly watched by long term investors and representatives of the manufacturing sector. In the below image, we can see that the Corporate Tax rate announcement has a moderate to high impact on the currency, and in most cases, the announcement is made by the Deputy Governor.

Today we will be analyzing the Corporate Tax rate of Australia, which shall be imposed on the companies for the current financial year. It is published on the official website of the Australian Taxation Office, which gives statistics of previous data as well. The below image shows that the Base Rate was fixed at 27.5%, while for the general category, the Tax rate was fixed at 30%. There were no changes in the Tax rate as compared to the previous year. Let us see how the market reacts to this data.


EUR/AUD | Before The Announcement

We shall first look at the EUR/AUD currency pair, where the above image signifies the state of the chart before the announcement is made. What we see is that the overall trend is up, and recently, the price has been moving within a range. We should be cautious before taking any sell trades in such chart patterns, as the price is at the bottom of the range, and the major trend is up. Depending on the news data, we shall trade the currency pair.

EUR/AUD | After The Announcement

After the Corporate Tax announcement is made, market crashes below, and we witness selling a fair amount of pressure, which takes the price lower, thereby strengthening the Australian dollar. One of the reasons behind the sudden downfall is that the Corporate Tax rates were maintained at the same level as before, which is said to be good the economy (due to overhead costs of changing rates). At this point, we cannot immediately go ”short” in the market as the price is the key ”support” level. Therefore, we should wait for the price to break the ”support” and then take a ”breakdown trade.” In such trades, the ”take profit” should be small based on the overall trend.

AUD/CAD | Before The Announcement

AUD/CAD | After The Announcement

The above images represent the AUD/CAD currency pair, and in the first image, we see that the overall trend is down, suggesting weakness in the Australian dollar, and now the price seems to be retracing the down move. If the data were to be positive for the Australian economy, we need to be extra cautious before attempting a buy trade as the trend is down, and there is a high chance that it might get sold into. However, bad news can work in our favor and might result in a further down move. After the news announcement, we see an increase in volatility to the upside, and the price closes with a bullish ”news candle.” Traders buy Australian dollars after they realize that the Corporate Tax rate was unchanged, which is good news for the manufacturing sector, particularly. One should be trading the pair on the long side, only after suitable reversal patterns are seen in the market.

AUD/CHF | Before The Announcement

AUD/CHF | After The Announcement

This is the AUD/CHF currency pair, where the chart characteristics appear to be similar to the AUD/CAD currency pair. Also, here the market has recently formed a range and currently at the bottom of the range. In this pair, positive news data can prove to the ideal case for going ”long” in the market as the price is at a point from where some buyers can pop up anytime. In any case, it is advised to analyze the data and then trade. After the Corporate Tax rate announcement, the market again moves higher, and volatility increases on the upside, which strengthens the Australian dollar by little. The sudden surge in price is because of the positive Corporate Tax data, and thus traders turn bullish on the currency. One can go ”long” in the market with a ”take-profit” at the ”resistance” of the range and stop-loss below the ”support.

That’s about Corporate Tax rates and the impact of its new release on the price charts. Let us know if you have any questions in the comments below. Cheers.
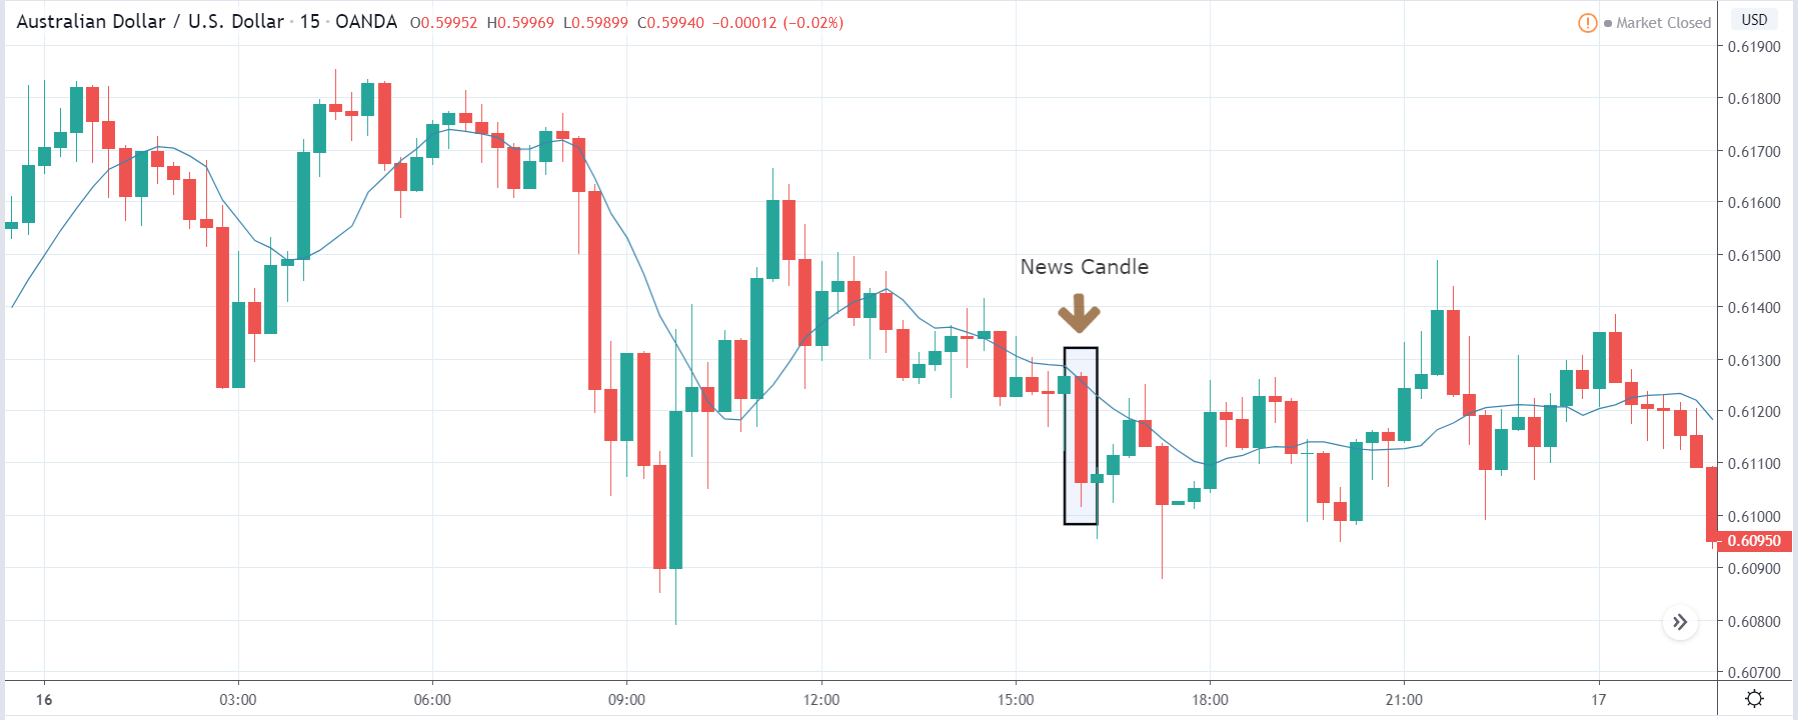
Categories
Forex Daily Topic Forex Price-Action Strategies

H1 Breakout Trading: Keep Holding Your Positions

Price action traders are to maintain discipline with their entry and trade management. As far as trade management is concerned, it varies on time frames. Trade management on the H4 chart and the H1 chart is different. A reversal candle on an H4 chart has more potential to change the existent trend. Thus, traders may need to think about an early exit. On the other hand, H1 breakout traders may keep holding their positions until it reaches the target. In today’s lesson, we are going to demonstrate an example of this.

The chart shows that the price after being bullish has rejections at a level of resistance. The price heads towards the North but does not make any breakout. It has been in the bearish correction again. Let us see whether it finds its support and makes a bullish breakout or not.

Here it comes. The price finds its support and produces a bullish engulfing candle breaching the level of resistance. This is an A+ breakout candle. The buyers are to wait for the next candle to close above the breakout candle to trigger a long entry.

The next candle comes out as a bullish candle as well. It has an upper shadow, but the last 15 candle comes out as a bullish candle. The buyers may trigger a long entry right after the last candle closes by setting stop loss below the support level and take profit with 1R.

The price heads towards the North. However, it seems that the price does not head towards the target with good bullish momentum. Moreover, the last candle comes out as a bearish engulfing candle. This is ominous for the buyers. Do not forget this is an H1 chart, and the buyers are not supposed to take an early exit. They should keep holding their position and wait for the price to do the rest.

The price gets rather choppy. It has been testing traders’ patience. It is hard to keep holding positions. However, traders must not keep looking at the chart. Meanwhile, they might as well concentrate on other charts to find out potential entries.

Patience pays back to the buyers at last. The last candle comes out as a bullish candle, which helps the buyers to reach their take profit target. In the end, the trade goes well for the buyers. It may have gone the other way, but H1 breakout traders should stick with their plan and keep discipline.

Categories
Forex Forex Brokers

Tradelyo Review

Tradelyo is an online foreign exchange and CFD broker. They do not give a lot of information about themselves away apart from the fact that they offer MetaTrader 5, 24/7 support, a single wallet, and quick withdrawals, so as we do not know a lot, we will use this review to find out a little more about them and to see exactly what services they really offer.

Account Types

There is just the one account type available which is the Standard account, the account requires a minimum deposit of at least $100 and can be leveraged up to 1:200, the account also comes with a fixed spread that starts at 1.6 pips. As we go through this review, we will be looking into each section in a little more detail, all information in this review is related to this singular trading account.

Platforms

The platform being offered by Tradelyo is MT5, which is the younger brother of MetaTrader 4 (MT4)m developed by MetaQuotes Software and released in 2010, MT5 is used by millions and for good reason. Offering plenty of trading and analysis features to aid in your trading. Additional services expand the functionality of the platform making its capabilities almost limitless.

MetaTrader 5 offers the built-in Market of trading robots, the Freelance database of strategy developers, Copy Trading and the Virtual Hosting service (Forex VPS). Use all these services from one place, and access new trading opportunities. MetaTrader 5 is also highly accessible with it being available as a desktop download, application for iOS and Android devices and even as a WebTrader where you can trade from within your internet browser.

Leverage

The account can be leveraged up to 1:200, this can be selected when opening up an account and can be changed by sending a change request to the customer service team. Leverage at 1:200 is an appropriate level to have as it gives a good risk and reward ratio, however, many modern brokers are now aiming to provide their clients with leverage up to 1:500.

Trade Sizes

Trade sizes start at 0.01 lots which are known as micro-lots, the trades then go up in increments of 0.01 lots so the next trade would be 0.02 lots and then 0.03 lots. Unfortunately, we do not know what the maximum trade size is or how many open trades and orders you can have at any one time.

Trading Costs

There aren’t any commissions or trading fees mentioned on the website, looking at the demo account, there are no commissions reflected in that either so it does not look, like there are any, especially as the spreads are as high as they are (we will look at that later in this review).

There will however be swap charges which are fees charged when you hold a trade overnight, they can be both positive or negative and are based on interest changes, they can be viewed within MetaTrader 5.

Assets

The website does not provide us with a list of available assets or a product specification. Looking at MetaTrader 5 there seems to be a large selection available including Forex Currencies, Indices, Commodities and Shares available to trade.

Spreads

The spreads are actually not disclosed on the website, instead, we have to use the demo account to find out what they are, this, however, is not a 100% accurate way of finding out as the demo account may have slightly different spreads to the main account. We believe that the spreads are starting from 1.6 pips and are fixed, this means that they do not change, no matter what is happening in the markets, they will always remain the same. Different instruments also have different spreads, so while the lowest starts from 1.6 pips, there are others with spreads fixed at 2 or 3 pips.

Minimum Deposit

The minimum amount required to open up an account is $100 which makes it very accessible to newer traders, we are not sure if this amount reduces once an account has already been opened.

Deposit Methods & Costs

There isn’t a specific page detailing and payment methods, at the bottom of the page there are some images of Visa and Mastercard, however, the actual terms of these methods are not known. We do not know if there are any added fees or if there are any additional methods available. You should check with your own card issuer for any potential outgoing transfer fees.

Withdrawal Methods & Costs

We do not have any information on the withdrawal methods either, so the only information we have to go on are the same images of Visa and MasterCard at the bottom of the site. We do not know of any possible fees which are not good as the last thing people want is to sign up, deposit, trade and then find that half their profit will be taken away with fees.

Withdrawal Processing & Wait Time

This is yet more information that is not available on the site, due to this we cannot say exactly how long withdrawal processing may take but we would hope that it would be fully processed within 7 days of the request being made.

Bonuses & Promotions

We did not notice any information on bonuses on promotions on the website or within the terms of service, so it does not look like there are any active promotions at this current point in time. You could always contact the customer care team to see if there are any coming up or not listed that you could take part in.

Educational & Trading Tools

While going through the site, we did not come across any educational information, this is a shame as many modern brokers are now trying to do what they can to help their clients improve their trading, so it would be nice to see Tradelyo do something similar.

Customer Service

Sadly there isn’t a customer support or contact page, this is a massive red flag because if there is no way to get in contact with them, not even an email, there would be no way to get any help, there may be ways once you have opened an account, but there is nothing from on the site directly.

Demo Account

Demo accounts are available for use in MetaTrader 5, this is how we got most of the information for this review. We hope that the information provided by the demo account is accurate to the live account, as sometimes they can vary a little bit. We do not know what the expiration time on these accounts is if there is one.

Countries Accepted

This is another aspect where there is no information present, so be sure to check with the customer service team to see if you are eligible for an account prior to signing up.

Conclusion

There is a lot of information missing from the site, luckily we were able to find out some of it by using the demo account, if we were only going by the information on the site then we would not know anything about the trading conditions, payment methods or anything else, and that is the information that most potential clients will see, as they will not use the demo account to find out. The most concerning things are the lack of financial information, deposit and withdrawal methods and fees, and also the fact that there is no information available to contact the customer service team, nothing, not even an email, so this is the main reason why we would suggest looking elsewhere for a broker to use.

Categories
Forex Market Analysis

Bullish Bias in Gold Fades – Is It Going to Retrace Back? 

On Friday, the yellow metal gold as showing sideways trading around 1,683 level after mounting to the highest level since March 9. Yesterday, most of the bullish bias was seen in the wake of another stimulus plan announced by the Federal Reserve. 

The U.S. President Donald Trump is showing willingness to support the USA fight against the coronavirus (COVID-19), which eventually seems to help the risk-tone. This time, the Fed will elevate about $2.3 trillion to promote small and medium-sized companies, districts and workers harmed by the coronavirus break.

Increased volatility driven by COVID 19 has driven gold prices higher towards the forecasted resistance level of 1,689 and has closed a candle below this level. 

The consumer price index declined 0.4% from the previous month and grew 1.5% year, which is extremely lower than 2.3% gain in February. The pair got major as energy prices sank by the most in five years, exhibiting one of the stronger-ever breakdowns in oil prices.

XAU/USD – Daily Technical Levels

Support Resistance 

1656.59 1700.91

1629.83 1718.47

1585.51 1762.79

Pivot Point 1674.15

On the four timeframes, precious metal gold has formed three white soldiers, which suggest odds of further buying in the pair. Continuation of the upward trend may lead to gold prices towards the next resistance level of 1,702. At the moment, there are odds that gold prices may show correction until 1,676 and 1,669 marks ahead for extending further buying trends today. Good luck! 

Categories
Forex Forex Brokers

Tradesto Review

Tradesto is a foreign exchange broker based in Saint Vincent and the Grenadines but also with offices and corporations within the United Kingdom. Tradesto Corporation is supervised and regulated by the authorities of Saint Vincent and the Grenadines, regulated by the Vanuatu Financial Services Commission (VFSC) and registered under the Australian Securities and Investments Commission (ASIC). Some of the main features offered by Tradesto is their fund security, easy payments, tight spreads, and excellent service. This review will be looking at the services being offered to see if they manage to achieve this and so you can decide if they are the right broker for your trading needs.

Account Types

There are six different accounts available however we will only be looking at the first three as we are not interested in the MAM account, joint account or corporate account, so what are the features of the three accounts we are looking at?

Standard Account: With the all-time classic forex account, the Standard Account at Tradesto offers traders a wide range of features suitable for all traders, from the beginner to the experienced. This account type was the first to offer traders the ability to trade standard lots in the forex market.

Islamic Account: Forex Islamic accounts are also known as swap-free accounts for clients following the Muslim Faith as they imply no swap or rollover interest on overnight positions. The account is 100% Shariah-compliant, it has no interest/swap charges on overnight positions and positions can be held with no time limit.

ECN Account: Tradesto offers ECN Account with real market spreads as low as zero pips, along with no re-quotes execution on the MT4 trading platform. Clients can choose to trade over 50 currency pairs, spot metals, and commodities. Spreads as low as 0 pips, can use MetaTrader 4 as a trading platform and, there is a low commission charged (USD 10 per standard lot).

ECN Account Perks

Platforms

Tradesto uses MetaTrader 4 (MT4) as its only trading platform, MT4 is one of the world’s most used trading platforms, hosting the trading of millions of traders. You can trade anywhere and at any time as MT4 comes as a desktop download, web trader and as applications for your mobile devices. A user-friendly interface makes it easy to put powerful charting features, real-time quotes, advanced technical analysis, and automated trading capabilities to work for you. While it would be nice to have a choice of platforms, you cannot go wrong with using MetaTrader 4.
Leverage

We may have been going blind but we could not locate this information on the website, after scouring the internet it appears that the maximum leverage available is 1:500, we are not sure if this is relevant to all account types though.

Trade Sizes

Trade sizes start from 0.01 lots and go up in increments of 0.01 lots so the next trade would be 0.02 lots. There is no mention of the maximum trade size, however, whatever it is, we would not recommend trading over 50 lots as it can become increasingly hard to execute larger trades without slippage and to perform the trade quickly. It is also not known what the maximum number of open trades you can have at any one time is.

Trading Costs

The ECN account has a “low” commission of $10 per lot traded added to the account, while Tradesto calls this low, it is actually considerably higher than the industry average of $6 per lot traded. The other accounts do not have an address commission as they use a spread based system instead.

If you are using a normal account then swap charges are also present, these are interest charges that are incurred for holding trades overnight, they can be both negative or positive and can usually be viewed from within the trading platform of choice. If you are using an Islamic account then these swap charges are not relevant to your account.

Assets

Tradesto has very handily made their assets available to view so we have a full breakdown of the available tradable instruments, let’s see what is available.

Forex: AUDCAD, AUDCHF, AUDJPY, AUDDNZD, AUDUSD, CADCHF, CADJPY, CHFJPY, EURAUD, EURCAD, EURCHF, EURGBP, EURJPY, EURNZD, EURUSD, GBPAUD, GBPCAD, GBPCHF, GBPJPY, GBPNZD, GBPUSD, NZDCAD, NZDJPY, NZDUSD, USDCAD, USDCHF, USDJPY, USDMXN, USDTRY, USDZAR.

Spot Metals: Gold and Silver.

CFDs: AUS 200, CHN 50, German 30, WU 50, FRA 40, HK, Italy 40, Japan 225, Spain 35, SUI 20, UK 100 (FTSE), Nasdaq (US 100), Dow Jones, SP 500, UK Brent Oil, Natural Gas, US WTI Oil.

As you can see there isn’t a huge selection so it would be good to potentially see this list grow in the future.

Spreads

Tradesto has spreads as low as 0.1 pip, this is for the ECN account, it is not clear to us what the spreads on the Standard or Islamic accounts are. The spreads are variable which means they move with the markets when there is added volatility in the markets they will often be seen higher than when there isn’t. Different instruments also have different spreads so while one such as EURUSD may have a spread (example) of 1 pip, other instruments slike EURCAD will have a slightly higher starting spread.

Minimum Deposit

The minimum amount required to open up an account is $100, this will get you the standard account. It is not known if there is a different requirement for Islamic or ECN accounts. After an account has been opened the minimum deposit for top-ups is $25.

Deposit Methods & Costs

There are plenty of ways to deposit, unfortunately, there are also fees, so we have outlined the deposit methods, along with any applied fees below.

  • Bank Wire – Bank fees
  • Neteller – 2%
  • Fasapay – No Fee
  • i-Account – No fee
  • Bitcoin – 1%
  • Shop2Pay – 3.4%
  • Help2Pay – 2.5%
  • China88Pay – 1.8%

Withdrawal Methods & Costs

We are a little confused as to which methods are available to withdraw with, there is only a tick next to Bank Wire Transfer and fasapay, however, there are withdrawal fees stated for different methods also, so we believe they may also be available, the methods we think are available are:

  • Bank Wire – Bank fees
  • Fasapay – 0.5% + 0.5%
  • i-Account – 3 USD
  • Bitcoin – Transaction fee

Again, it is not clear if the other methods are available, they may well be but we cannot say. It is a shame to see so many fees for both deposits and withdrawals as many brokers are now looking to get rid of transaction fees. It would be good to see Tradesto do something similar.

Withdrawal Processing & Wait Time

The withdrawal processing time is not known, but depending on the method used you should expect your withdrawals to be fully processed between 1 to 7 days after the request is made.

Bonuses & Promotions

It does not appear that there are any active promotions or bonuses at the time of writing this review, if you are interested in bonuses then we would recommend getting in touch with the customer service team to see if there are any upcoming promotions you could take part in.

Educational & Trading Tools

There isn’t a whole lot when it comes to education or trading tools. There is the usual economic calendar that details upcoming new events and which currencies they could have an effect on. There is also a page containing daily forex analysis which is currently being updated daily. If you are looking for a proper education then you will need to look elsewhere on the internet.

Customer Service

If you need to contact Tradesto for whatever reason you can do so in a few different ways, you can use the online submission form to fill in your query and you should then get a reply back via email within 1 business day. You can also contact the Tradesto corporation or UK Limited via phone or post.

Tradesto Corporate:
Address: Suite 305, Griffith Corporate Centre, P.O.Box 1510, Beachmont, Kingstown, St. Vincent and the Grenadines
Phone: +1-855-246-7284

Tradesto UK Limited:
Address: 7 35-37, Ludgate Hill, London, England, EC4M 7JN.

Demo Account

It seems like a demo account should be available, but at the time of writing this review when you click on the open demo account button it loads up a “Page Not Found” error, this may be a temporary thing we are not sure.

Demo accounts allow potential clients to test out the servers and trading conditions while also allowing experienced traders to test out new trading strategies without risking any of their own capital.

Countries Accepted

Tradesto does not specify which countries are allowed to trade with them and which are not, so if you are thinking of signing up we would recommend contacting the customer service team to check your eligibility prior to signing up.

Conclusion

Tradesto offers a lot of information on their site, however, there is a lack of information specific to the account types so we had to either dive deep into the site or look to other websites in order to find the relevant information. All info should be made readily available as it can put off potential clients if they cannot find something they need to know. There are not a lot of tradable assets which is a shame and there is not a whole bunch of deposit methods either, there are also fees for deposit and withdrawals which is always a little disappointing to see.

Tradesto looks like they offer decent trading conditions but we could not test them as the demo account sign up page was down. While Tradesto could be a good broker to sue, there are too many small issues for us to be able to fully recommend them at this time.

Categories
Forex Assets

Exploring The ETH/USD Pair & The Relative Costs Involved

Introduction

Trading cryptocurrencies is similar to trading in the Forex market, but the only difference being, both base and quote currencies are not fiat currencies. In crypto pairs, one of them is a virtual currency, and the other is a fiat currency. ETH/USD is a cryptocurrency pair, which is an abbreviation for Ethereum against the US Dollar. Participants can trade them via Forex brokers or through cryptocurrency exchanges.

Understanding ETH/USD

The value of ETHUSD represents the value of the US Dollar that is required to purchase one. It is quoted as 1 ETH per X USD. For instance, if the market price of ETHUSD is 170.46, then around 170 US Dollars are needed to buy one ETH.

ETH/USD Specifications 

Spread

The difference between the bid price and the ask price marked by the brokers is called the spread. Spread is the main source of revenue for brokers. Spread on major and minor currency pairs is typically very low. But, in cryptocurrencies, the spread is usually high. Below are the spread values of ECN & STP accounts for the ETH/USD pair.
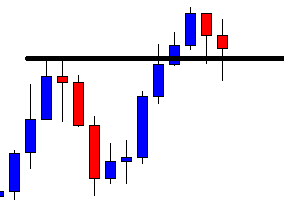
  • Spread on ECN: 200 pips (2 USD)
  • Spread on STP: 250 pips (2.5 USD)

Fee

A Fee is applicable only on ECN accounts and the pro accounts of brokers. Typically, it is between 40-50 pips.
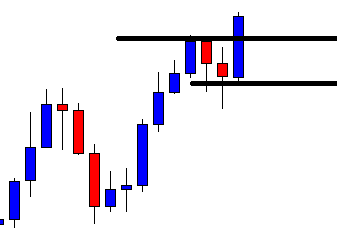
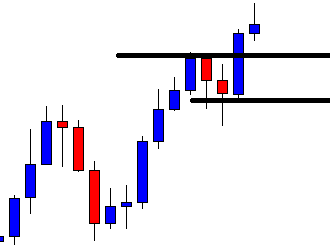
Slippage

Slippage is the difference between the price at which a trader opened a position and the price given by the broker. Due to the high volatility of the market and slow execution by the brokers, slippage occurs.

Trading Range in ETH/USD

Below is the representation of the volatility from minimum to maximum for ETHUSD in different timeframes. These numbers are very helpful in assessing one’s risk on a trade.  

Procedure to assess Pip Ranges

  1. Add the ATR indicator to your chart
  2. Set the period to 1
  3. Add a 200-period SMA to this indicator
  4. Shrink the chart so you can assess a large time period
  5. Select your desired timeframe
  6. Measure the floor level and set this value as the min
  7. Measure the level of the 200-period SMA and set this as the average
  8. Measure the peak levels and set this as Max.

ETH/USD Cost as a Percent of the Trading Range

With the application of the volatility values with the total cost on the trade, the variation in the cost of a trade can be assessed. To do so, the ratio between the total cost and volatility is taken and expressed in terms of a percentage.

The magnitude of the costs represents how high the costs are. If the percentages are large, it indicates high costs and vice versa.

ECN Model Account

Spread = 200 | Slippage = 15 |Trading fee = 45

Total cost = Slippage + Spread + Trading Fee = 15 + 200 + 45 = 260

STP Model Account

Spread = 250 | Slippage = 15 | Trading fee = 0

Total cost = Slippage + Spread + Trading Fee = 15 + 250 + 0 = 265

Trading the ETH/USD

Cryptocurrencies can be traded just like any other asset. In ETHUSD, the volatility is good enough for both short-term and long-term traders. Though the volatility values appear to be high, they don’t have a large reflection on your profit/loss. This is because, unlike forex currencies where one lot was equivalent to 100,000 units of the base currency, one lot in ETHUSD represents only 10 units of ETH.

From the above volatility table, it is seen that the costs are more when the volatility of the market is low and is less when the volatility is high. So, trading this pair majorly depends on the type of trader you are. For example, scalpers might trade when the volatility is high to get the greatest number of pips in a short amount of time. If they do so, they can get the benefit of lower costs.

In general, costs on a trade can be reduced by placing orders as ‘limit’ or ‘stop.’ In such orders, the slippage becomes nil. Hence, the total cost would be brought down to a good extent. The cost variations for limit orders or stop orders are given below for your reference and comparison.

ECN Model Account (Using Limit Orders)

Spread = 200 | Slippage = 0 |Trading fee = 45

Total cost = Slippage + Spread + Trading Fee = 0 + 200 + 45 = 245

Categories
Forex Videos

Dominating Price Action! Making You A Better Trader

Dominate Price Action To Amplify Your Trading Arsenal

In this video presentation, we will be looking at price action. If you want to be a successful forex trader, you need to understand what price action is. If we had to strip forex training down to 1 single most important feature, then price action would be it. Today we are going to show you how it is applied in forex trading.
All areas of the financial markets capture the movements of any specific asset, including Forex, on a chart and where this is recorded historically. These movements can be represented as candlesticks, line charts, or bar graphs, And can be observed over varying time periods from 1-minute or 5-minute time frames, all the way up to monthly charts. This data reflects the beliefs of market participants at any given time, whether they are human or algorithm-based traders, which is shown on the charts in the form of price action.

Price action is the methodology of applying all your decisions from a price chart while adhering to some basic trading principles. Price action is often called naked trading because traders rely on the price itself in order to denote when to enter and exit trades. However, by adding a couple of moving averages and some support and resistance lines, it becomes much more easy to identify key levels of support and resistance to trade around. Ideally, as a trader, we want to try and identify tops, bottoms, and trends. And this methodology is an extremely important feature in identifying these key areas.

A couple of old adages come to mind which lends themselves very nicely to forex trading: the first one is that sometimes you can’t see the wood for the trees, and where that can be applied to Forex in so far as sometimes traders overload their screens with technical tools and they cannot really clearly identify what is happening with the price action because they are too focused on too many technical tools. And the other adage is sometimes less is more, and that applies for the same reason: by stripping away technical tools, we can only rely on price action itself, which is a key leading indicator in its own right. While in this example of the EURUSD pair, we can quite safely say that during this period of the 1-hour chart, the general trend was to the downside, but how can we pick this out by utilizing price action itself?


Example B, the Price action of a pair is in continuous motion apart from interruptions during the weekends. Otherwise, price is consolidating or moving in a sidewards direction, or it is trending higher or lower. As traders, we should be looking at what is happening with price action at any given time and then try to establish if the price is trending, or if it is in a period of consolidation, or even a pullback before a trend continuation.
Price action alone can help us determine these areas, but by adding a couple of visual supports such as some trend Lines, it just makes it more easily identifiable. For this example, we have just added two very simple lines that help us to more clearly identify levels of support and resistance. Here we can see a period of consolidation, which is qualified by price action touching, or is very close to touching at least two areas of support and resistance, which are clearly identifiable such as drawn onto our chart.
One thing is for sure that price action will breach this area at some future point. This is a key area of interest for traders.


Example C, Here we can see that the support line has been breached by a strong bearish candlestick. Traders will jump on this opportunity to go short on the pair at this point.

Example D, We subsequently see another area of consolidation and a further breach to the downside, and where traders would expect that a downtrend is in process, and they would be looking for opportunities to go short.
Whilst stochastics, MACD, and moving averages are widely used throughout the trading community, many traders feel that price alone can be relied on for identifying trade opportunities, and certainly, these couple of examples would support that.
But of course, as cautious traders, we like to stack the odds in our favor, and if that means adding a couple of extra visual technical tools that will help us well, what’s the harm in that?

Example E, Here, for example, we have added a simple 30 period moving average. Notice how the price action tends to bounce lower off of this line, while price action continues in its trend lower.

Example F, I know the world price continues to consolidate and punches lower through support lines and where support lines become lines of resistance, but all the while price is bouncing lower from the 30-period ma.


Example G, Price action also throws up another favorite for traders: highs with lower highs and lows with lower lows which identify a downtrend, and where the opposite would apply for an uptrend, where they would be looking for highs with subsequently higher highs and lows with subsequent higher lows. But again, these key areas are clearly evident on the screen, even with price action alone.

Example H, Price action Traders will also observe higher time frames, in this example, we are looking at a 4-hour chart of the EURUSD pair, traders try and establish what is going on with price action on the longer time frames because this will filter through to the lower time frames and where they will look for opportunities to jump on the overall trend should there be one.
Price action becomes repetitive, and this is because human nature in trading tells us that certain things are likely to happen at certain levels, typically key levels or round numbers, and if these things are recurring on a regular basis, human emotion would suggest that they are likely to continue to recur and therefore trading sometimes becomes a self-fulfilling prophecy where certain price action events, in the absence of fundamental reasons, is likely to continue in this vein. Price action levels become significant because market participants give significance to them.

In summarising price action who is the most significant aspect of Forex trading, and where by just using the minimum amount of technical tools you can more easily see areas of price consolidation, within resistance and support levels, and when these areas are breached we may see a continuation in price action in the direction of the breach, and by incorporating a simple moving average it can more easily help us to identify a trend. And that these very basic mechanisms are highly favored by professional and institutional traders.

Categories
Forex Course

98. Do You Know There Are Four Types of Pivot Points?

Introduction

In all the previous lessons of pivot points, we considered the traditional pivot points. But this is not the only type of pivot points that are existing. There are three other types to it as well. In this lesson, we shall cover the four different types of pivot points that exist.

Types of Pivot Points

The four types of pivot point are mentioned as follows:

  • Traditional Pivot point
  • Woodie Pivot point
  • Camarilla Pivot point
  • Fibonacci Pivot point

Since we’ve already discussed the traditional pivot point in detail, we shall be concentrating on the rest of the types. Note that, in all the different types of pivot points we will be studying, the only difference is the calculation of the pivot point levels. As far as the concept to trade using these pivot points is concerned, it remains the same as the traditional approach.

Woodie Pivot Point

The Formulae

Pivot point (P) = (High + Low + 2Close) / 4

First Resistance (R1) = (2 x P) – Low

Second Resistance (R2) = P + High – Low

First Support (S1) = (2 x P) – High

Second Support (S1) = P – High + Low

From the above formulas, we can notice that the way of calculations is pretty different from that of the traditional type. In the traditional, we considered the difference between High and Low to calculate support and resistance levels. But, in this case, consider the range as well as the close of the previous day. Some traders prefer this over the traditional pivots because it gives more weightage to the close price of the previous day.

Camarilla Pivot Points

The Formulae

P = (High + Close + Low) / 3

S1 = Close – ((High – Low) x 1.0833)

S2 = Close – ((High – Low) x 1.1666)

S3 = Close – ((High – Low) x 1.2500)

S4 = Close – ((High – Low) x 1.5000)

R4 = Close + ((High – Low) x 1.5000)

R3 = Close + ((High – Low) x 1.2500)

R2 = Close + ((High – Low) x 1.1666)

R1 = Close + ((High – Low) x 1.0833)

If we look closely, we can infer that the support and resistance levels are calculated using the range and the close price similar to the Woodie calculation. The only major difference being, in Camarilla, four levels of Support and Resistance is calculated and is multiplied by a multiplier.

The theory with which Camarilla was created is based on the concept that the price has a natural tendency to return to the mean (here, close of the previous day). So, the simple strategy here is to sell when the price reaches the R3 or R4 level and buy when the price bottoms to S3 or S4 level. However, if the price breaches the S4 or R4 level, it indicates a strong trend in the market.

Fibonacci Pivot Points

The Formulae

P = (High + Low + Close) / 3

S1 = P – ((High – Low) x 0.382)

S2 = P – ((High – Low) x 0.618)

S3 = P – ((High – Low) x 1.000)

R3 = P + ((High – Low) x 1.000)

R2 = P + ((High – Low) x 0.618)

R1 = P + ((High – Low) x 0.382)

For calculating Fibonacci level, the pivot point level is calculated using the traditional method. Then the Support and Resistance levels are obtained by finding the product of the previous day’s range and the corresponding Fib level. The most used Fib levels are 38.2%, 61.8%, and 100%. Finally, adding/subtracting this value with the pivot point yields the Support and Resistance levels.

All of these indicators will be available with most of the brokers and charting tool software. Consider trying all of these pivot points on a demo account and use the ones that work the best for you. This hence brings us to the end of this lesson as well as the concepts involved in the pivot points. In the next lesson, we’ll summarize this topic and move ahead with another interesting technical analysis tool. Cheers!

[wp_quiz id=”70131″]
Categories
Forex Market Analysis

Daily F.X. Analysis, April 10 – Top Trade Setups In Forex – U.S. CPI Under the Spotlight! 

The greenback dropped broadly due to the downbeat U.S. Initial Jobless Claims data release, which showed that the weekly new claims exceeded 6 million for the second straight time last week. The fresh fears of economic difficulty, indicated by the Fed Chair Powell, also keeps the USD lower, which leads a 0.06% drop in the U.S. dollar to trade at 99.46, having hit a daily high at 99.63 in early Asia. Today, the major focus of traders will be on the U.S. inflation report as most of the market is off due to good Friday. Let’s take a look at the technical and fundamental’s outlook.

Economic Events to Watch Today     


EUR/USD – Daily Analysis

The single currency EUR gained a slight bullish momentum against the U.S. dollar on reports that the U.S. jobless claims performed worst than expected. A day before, the European Union finance ministers failed to agree on a coronavirus relief package. Meanwhile, the Bank of France sees the first-quarter GDP shrinking 6% from the previous quarter, the most significant decline since World War II, amid nationwide lockdown due to the coronavirus outbreak.

On the other hand, the EUR currency got supported by multiple factors, the figures of newly infected peoples and death toll showing a sign slowing down across the hotspots in Europe and boosted the sentient around the shared currency. In the meantime, the Eurogroup finally reached a half a trillion euros virus rescue package gave further support to the common currency bulls.

Looking forward, the USD moves and virus updates will continue to play an important role. Traders will keep their eyes on the Fed’s Mester’s speech, the U.S. Consumer Price Index (CPI), and the G20 energy ministers meeting for the fresh trading sentiment.

Daily Support and Resistance

  • S1 1.0685
  • S2 1.0796
  • S3 1.0862

Pivot Point 1.0907

  • R1 1.0973
  • R2 1.1018
  • R3 1.1129

EUR/USD– Trading Tips

The EUR/USD has violated the asymmetric triangle pattern, which is leading; it’s price further higher towards the next resistance level of 1.0960. The pair was following 1.0922 – 1.0765 trading, which is now likely to give support to the EUR/USD pair. At this moment, the EUR/USD is holding at 1.0940, having an immediate support level of around 1.09110, where the bearish breakout of this level can extend selling until the next support level of 1.0846 and 1.07990.

The MACD has crossed over 0, converting the bearish sentiment into bullish. At the same time, the 50 periods exponential moving average is also keeping the EUR/USD in a bullish mode, extending an immediate resistance around 1.08996. So, let’s consider taking buying trades above 1.0907 to target 1.0970 today. 


GBP/USD– Daily Analysis

The GBP/USD rebounded for a second straight session, gaining 0.4% to 1.2392. U.K. government spokesman James Slack said Prime Minister Boris Johnson is in a stable condition and responding to coronavirus treatment in hospital. 

The reason behind the GBP strength could also be the fresh pessimism surrounding Brexit date because the new Labour Party shadow Chancellor Anneliese Dodds asked ministers to beware putting “ideology over the national interest. Whereas, the U.K. Express conveyed the headlines indicating the Transition period delay could cost U.K. taxpayer £26 billion a year.

On the other hand, the U.S. Federal Reserve (Fed) Chair Jerome Powell expecting downbeat economics during the 2nd-quarter (Q2) of 2020 before expecting the recovery in the second half of the year.

As in result, Japan’s TOPIX recently rose to 1,424, up 0.56%, while stocks in China remain mixed by the reporting time. Looking ahead, traders will keep their focus on the coronavirus updates for intermediate direction. However, the expectedly downbeat U.S. inflation figures for March will likely keep the pair strong.

Daily Support and Resistance    

  • S1 1.2187
  • S2 1.231
  • S3 1.2381

Pivot Point 1.2432

  • R1 1.2504
  • R2 1.2555
  • R3 1.2678

GBP/USD– Trading Tip

The GBP/USD soars to trade around 1.2496 but still holds within a sideways channel. The GBP/USD sideways channel is supporting the GBP/USD pair around 1.220 and along with resistance around 1.2490.

Considering the weakness in the U.S. dollar, the chances of selling remains low, but the bullish bias remains solid over 1.2500 level. Violation of this can lead the GBP/USD prices until 1.2720. The MACD and 50 EMA are also supporting the bullish bias, so let’s consider taking buying trades over 1.2432 with a target of 1.2500 first and then buying over 1.2500 to target 1.2610. 


USD/JPY – Daily Analysis

Today in the early Asian session, the USD/JPY currency pair dropped to 108.33, mainly due to the risk-off market sentiment in the wake of intensified concerns about coronavirus (COVID-19). The fresh declines in the U.S. dollar, which are based on downbeat data and depressed signals from the Fed Chair, keeps the pair lower.

The USD/JPY is currently trading at 108.39 and consolidates in the range between the 108.33 – 108.61. At the USD front, the greenback dropped broadly due to the downbeat U.S. Initial Jobless Claims data release, which showed that the weekly new claims exceeded 6 million for the second straight time last week.

The fresh fears of economic difficulty, indicated by the Fed Chair Powell, also keeps the USD lower; as in result, the U.S. dollar index drops 0.06% to 99.46, having hit a daily high at 99.63 in early Asia.

At the coronavirus front, as per the latest report, the 427,460 cases of coronavirus registered an increase of 32,449 cases from its previous count and said the number of deaths also rose 1,942 to 14,696. It should also be noted that the Centers for Disease Control and Prevention (CDC) earlier announced ‘no sail’ order to all cruise ships. As in result, the U.S. continues marked as the world’s second-worst affected nation due to the virus after Italy.

Daily Support and Resistance    

  • S1 107.84
  • S2 108.34
  • S3 108.59

Pivot Point 108.85

  • R1 109.09
  • R2 109.35
  • R3 109.86

USD/JPY – Trading Tips

The USD/JPY’s symmetric triangle pattern has already been violated, which was supporting the pair around 108.570. Closing of candles below this level is suggesting bearish bias among traders, which can lead the USD/JPY, the safe-haven currency pair, towards the next support level of 107.850. The 50 EMA is also suggesting a bearish bias for the USD/JPY pair. 

On the higher side, the support level 108.500, which got violated earlier, is going to work as resistance now, and it may offer us selling traders in the USD/JPY today.  The USD/JPY may exhibit buying until 108.580, and violation of this can open more room for buying until 108.8500. On the lower side, support continues to hold around 107.850. Let’s look for selling traders below 108.550 today.  

All the best for today! 

Categories
Forex Forex Brokers

Mt Cook Financial Review

Founded in 2013, Mt Cook Financial is ECN and DMA forex broker. Aiming their services more towards the professional trader they are looking to provide the best in terms of trading conditions and trading platforms. We will be using this review to dive deep into the services on offer to find out what they offer and so you can see if they are the right broker for you.

Account Types

There are two different account types available, they are based on liquidity streams and execution types. Let’s look at what they are.

ECN Account: This account requires a minimum deposit of $1,000, it uses ECN / STP as its clearing method and has a raw spread. It has an added commission of $32.5 per million per side, which equates to around $6.5 per lot traded. The account can be in EUR, USD, GBP or AUD and the minimum trade size is 0.01 lots which go up in increment of 0.01 lots. The account can be leveraged up to !:100 and has access to forex, metals, indices, and futures. The margin call level is set at 80% with the stop out level at 60%. And the account can use the MetaTrader platforms as well as social trading.

DMA Account: This account requires a minimum deposit of $1,000, it uses DMA / STP as its clearing method and has a raw spread. It has an added commission of $30 per million per side, which equates to around $6 per lot traded. The account can be in EUR, USD, GBP or AUD and the minimum trade size is 0.01 lots which go up in increment of 0.01 lots. The account can be leveraged up to !:100 and has access to forex, metals, indices, and futures. The margin call level is set at 80% with the stop out level at 60%. And the account can use the MetaTrader platforms as well as social trading.

Platforms

The main trading platform on offer is MetaTrader 4, but there are also additional social trading platforms that can be used which we have outlined below.

MetaTrader 4 (MT4):
MetaTrader 4 is one of the most innovative and powerful trading platforms and is still favored by the vast majority of professional currency traders. After years of development, its suite of analytic tools and algorithmic trading capabilities provide the user with a powerful platform from which to access the markets. Metatrader platform raises the bar for those familiar with trading on MT4. Mt.Cook’s unique configuration can process trades entered via MetaTrader GUIs in under 20 milliseconds which provides our clients with an operational advantage. The platform is available as a desktop download, web trader and as an application for your mobile device.

Social Trading Platforms:
There are two social trading platforms available to use, these are ZuluTrade and Myfxbook Autotrade. ZuluTrade is one of the largest social trading communities. The users of the platform can follow between thousands of registered talented currency traders from 192 countries automatically. By engaging in auto trading, users can eliminate the potentially harmful factor of emotion and the error-prone human factor from their trading practice. Myfxbook Autotrade is an account mirroring (trade copy) service operated by Myfxbook who happens to be one of the largest social trading communities and FX tech providers in the industry. The AutoTrading service allows you to copy the trades of other profitable traders and systems from the Myfxbook community directly into your Mt.Cook MetaTrader 4 account.

Leverage

The maximum leverage available to both accounts is 1:100, however, this can be increased if you contact the customer service team and they deem it appropriate. The leverage can otherwise be selected when opening up an account.

Trade Sizes

Trade sizes for both accounts start at 0.01 lots and go up in increments of 0.01 lots. We are not sure what the maximum trade size is or what the maximum number of open trades you can have at any one time is.

Trading Costs

Both accounts come with a commission, the ECN account has an added commission of $32.5 per million per side, which equates to around $6.5 per lot traded. The DMA account has an added commission of $30 per million per side, which equates to around $6 per lot traded which is in line with the industry average of $6 per lot traded.

There are also swap charges which are fees charged for holding trades overnight and can be viewed within the MetaTrader 4 platform.

Assets

The assets have been broken down into a few different categories, we will now outline the different instruments within them.

Forex:
AUDCAD, AUDCHF, AUDJPY, AUDNZD, AUDSGD, USDUSD, CADCHF, CADJPY, CADSGD, CHFJPY, CHFSGD, EURAUD, EURCAD, EURCHF, EURDKK, EURHKD, EURJPY, EURMXN, EURNOK, EURNZD, EURPLN, EURSEK, EURSGD, EURTRY, EURUSD, GBPAUD, GBPCAD, GBPCHF, GBPJPY, GBPNOK, GBPNZD, GBPSEK, GBPUSD, HKDJPY, MXNJPY, NOKJPY, NOKSEK, NZDCAD, NZDCHF, NZDJPY, NZDSGD, NZDUSD, SEKJPY, SGDJPY, USDCAD, USDCHF, USDCNH, USDDKK, USDHKD, USDJPY, USDMXN, USDNOK, USDPLN, USDRUB, USDSEK, USDSGD, USDTRY, USDZAR.

Metals:
XAGUSD, XAUUSD, XPDUSD, XPTUSD.

CFD Futures:
WTI Crude Oil, Brent Crude Oil, High Grade Copper, Natural Gas.

CFD Indices:
JP225, EU50, FR40, DE30, HK50, UK100, US500, UT100, US30, ES35, AU200.

Spreads

Both accounts use raw spreads form the markets so they can be as low as 0 pips. The spreads are variable which means they will move with the markets and so when there is added volatility they can be seen a little higher, the spreads will always remain quite low when using raw spreads though.

Minimum Deposit

The minimum amount required to open up an account is $1,000 which gets you to access either of the accounts. We do not know if this amount reduces for further top-up deposits.

Deposit Methods & Costs

There are just a few methods available to deposit, these are Bank Wire Transfer, Neteller, and China Union Pay. There are no added fees from MT cook when depositing funds but be sure to check with your own bank to see if they add any fees of their own.

Withdrawal Methods & Costs

The same methods are available to withdraw with, for clarification these are Bank Wire Transfer, Neteller, and China Union Pay. When withdrawing via Bank Wire Transfer there is a fixed fee of $25 added to the transaction. The other methods do not have any added fees.

Withdrawal Processing & Wait Time
Unfortunately, we do not know what the withdrawal processing times from MT Cook are, however, we would hope that any request is fully processed within 1 to 5 days from the request being made.

Bonuses & Promotions

It doesn’t appear that there are any bonuses or promotions available to take part in. If you are after bonuses then you could contact the customer support team to see if there are any coming up that you could take part in.

Educational & Trading Tools

The only tools that seem to be available are the ones relating to a VPS, these are paid however so the value is not as good as they could be as a lot of other brokers are giving VPS for free as long as certain conditions are met. It would have been nice to see more educational material as many modern brokers are now looking to help their clients improve.

Customer Service

Should you wish to get in contact with MT Cook there are a few different ways you can do it, firstly is the online submission form, fill it in and you should get a reply via email. You can also use live chat features. There is then a number of different phone numbers and email addresses for various departments.

Phone: + 1 (866) 672-8733
Support: [email protected]
General Inquiries: [email protected]
Accounts: [email protected]
Compliance: [email protected]
Partnerships: [email protected]

Demo Account

Demo accounts are available and allow you to both test out the conditions and also strategies without risking any capital. When signing up for a demo account you can select the leverage, account type and the balance that you desire. We are not sure if there is an expiration time on the accounts.

Countries Accepted

The following statement is present on the site: “The information on this site is not directed at residents of the United States and is not intended for distribution to, or use by, any person in any country or jurisdiction where such distribution or use would be contrary to local law or regulation” If you are still not sure of your eligibility for an account, contact the support team to find out.

Conclusion

MT Cook Financial offers some very competitive trading conditions, the spreads are low and the commission is in line with what you would expect from the industry. Plenty of assets are available to trade and the choice of manual trading or social trading is good to see. It would be nice to have seen a few more deposit methods and to remove the Bank Wire withdrawal fee, but otherwise, the deposits and withdrawals are not too expensive. When looking at the services on offer, MT Cook looks like a promising broker, but the decision to use them or not is yours.

Categories
Forex Forex Brokers

Commodity & Forex Merchants Review

CF Merchants was established in 2011 in St. Vincent and the Grenadines. CF Merchants aim to offer the best service to all their customers with a service team available 24/6, offering the best trading platforms, variety in trading assets, competitive spreads and high leverage. In this review, we will be looking into what CF Merchants actually offer and so you can decide if they are the right broker for you.

Account Types

There are four different accounts available from CF Merchants, each with different entry requirements and trading conditions, we will now give a brief overview of what each one offers.

CFM Standard Account: This account has a $100 minimum deposit in order to open it, it has a spread starting from 1.6 pips and has no added commission. Leverage on the account can go up to 1:500 and margin call is set at 99% while the stop out level is at 50%. The minimum trade size is 0.01 lots and the maximum trade size is 8 lots. Hedge margin on the account is 50% and this account can also be made as an Islamic swap-free account.

CFM Prime Account: The prime account also has a minimum deposit amount of $100, spreads are slightly reduced to 1 pip and there is again no commission added to this account. Leverage remains at 1:500 as a maximum and the margin call and stops out levels remain at 99% and 40% respectively. Trade sizes start at 0.01 lots and go up to a maximum of 8 lots. The hedge margin is 50% and this account can also be used as a swap-free Islamic account.

CFM ECN/VIP Account: This account increases the minimum deposit up to $10,000, this account has spreads starting as low at 0 pips but due to this there is a $3.5 commission on opening and closing trades, so $7 for a complete trade per lot. Leverage remains at 1:500, so does the margin call and stop out levels at 99% and 40%. Minimum and maximum trade sizes remain the same at 0.01 lots and 8 lots. This account can also be used as an Islamic account.

CFM Fix Account: This account requires a minimum deposit of $25,000, this account is different as it has a fixed spread starting at 2.5 pips and there are no added commissions. All other features remain the same as the other accounts except this time getting an Islamic swap-free account is conditional so you will need to be in contact with the customer service team to get one opened up.

Platforms

CF Merchants offers MetaTrader 4 as their only trading platform, so let’s take a little look at what MetaTrader 4 offers. In terms of accessibility, MT4 is second to none, available as a desktop download, an app for Android and iOS devices and as a WebTrader where you can trade from within your internet browser. MetaTrader 4 is a great trading solution to have.

Leverage

The accounts page state that the maximum leverage on all the account sis 1:500, however on the “Why Choose Us” page it states that the leverage ranges between 1:1 and 1:400, as the numbers are different we will look at 1:400 as the maximum, however, if it is 1:500 then that is a bonus.

Trade Sizes

Trade sizes for all accounts start at 0.01 lots which are also known as a micro lot. Trades then go up in increments of 0.01 lots so the next trade size would be 0.02 lots and then 0.03 lots. The maximum trade size is currently 8 lots which are quite low when looking at the competition, however, the majority of retail traders may not make it this high, or can be limiting for those that do.

Trading Costs

The Standard, Prime, and FIX account use a spread based system which we will look at later in this review. The ECN / VIP account uses a commission-based system and adds a commission of $3.5 for each side of a lot. This means $3.5 when opening trade and $3.5 when closing it, totaling $7 per round lot traded.

There are also swap fees on all accounts, these are fees charged for holding trades overnight, they can be both positive or negative and can be viewed directly within the MetaTrader 4 trading platform. If you opt for an Islamic swap-free account then these fees will be substituted with an administration charge.

Assets

CF Merchants have broken down their assets into a number of different categories, there are forex currencies, majors, minors and exotics, lots available with a minimum trade size of 0.01 lots and a max of 8 lots, examples are EUR/USD, GBP/AUD and ZAR/USD. Energies in the form of Crude Oil and Brent Oil are available along with precious metals like Gold, Silver, Palladium, and Platinum. Stock Indices such as DOW 30, GER 30 and UK 100 are available along with the addition of cryptocurrencies, only four are available which are Bitcoin, Ethereum, Litecoin, and Ripple but it is great that they are included.

Spreads

Spreads are dependent on the account type you are using, with the Standard account spreads start at 1.6 pips, the Prime account starts at 1 pip and the ECN / VIP account they start as low as 0 pips. These spreads are variable (also known as floating) which means they move with the markets, when the markets are being volatile they often widen and become bigger, so the starting spread is the minimum but they are often seen higher.

The Fix account has fixed spreads, this means that they do not move, they start at 2.5 pips and no matter what the markets are doing they do not change. It should be noted that different assets have different minimums so while EURUSD may be 1.6 pips, other currencies such as AUD/USD will have a slightly higher starting spread.

Minimum Deposit

The minimum required to open up an account is $100, however, once an account has been opened the minimum amount required for a top-up reduces down to $25 for all methods except for bank wire transfer which remains at $100.

Deposit Methods & Costs

The following methods are available to deposit with: Bank Wire Transfer, Skrill, Neteller, Perfect Money and Visa/Mastercard both Credit and Debit cards. There are no additional fees added by CF Merchants, however, be sure to check with your processor and bank to ensure that they do not add any fees of their own.

Withdrawal Methods & Costs

The same methods are available to withdraw as they were to deposit, for clarification these were Bank Wire Transfer, Skrill, Neteller, Perfect Money and Visa / Mastercard both Credit and Debit cards. Similarly to deposits, there are no additional fees when withdrawing, again be sure to check with your processor just in case they add any fees of their own.

Withdrawal Processing & Wait Time

Withdrawal times on the site state that all withdrawal methods have an instant processing time apart from bank wire transfers which have a processing time of 3 – 5 days. All withdrawals will be processed to the same method used to deposit. Bank wire to bank wire, Skrill to Skrill, Neteller to Neteller, Perfect Money to Perfect Money and credit card to credit card.

Bonuses & Promotions

There seems to be three different promotions on offer, we will outline the basics of each one below using information from the website.

10% Credit Bonus:

  • Minimum Deposit 2500$
  • The client needs to send email to the support team to get Credit Bonus.
  • On First withdrawal All Credit Bonus will be deducted.
  • This Bonus is not cashable in any case only tradeable.
  • This offer will be credited only in the Deposit Account.
  • No IB can claim this Credit Bonus.
  • The company reserves the right to cancel this Bonus at any time without mentioning any reason or prior notice.
  • This offer is only for Online Skrill, Neteller, Perfect Money Deposits.

Champions Welcome Bonus:

  • All new clients registered on our website are entitled to get a $50 bonus in their first trading account only.
  • For crediting a $50 Welcome Bonus, you are required to send an email at [email protected], you must mention your trading account no in your message.
  • For account, opening client must complete the verification of the documentation process.
  • $50 bonus amount is only tradeable not Cashable.
  • Profit earned on No Deposit Bonus is withdrawable, The maximum profit withdrawal limit is $100 without depositing funds and a minimum of 50 Standard lots are required.
  • If client deposits a minimum of $100 into a bonus account, then the client needs to place a minimum of 10 more standard lots after deposit to withdraw unlimited profit.
  • Whenever clients withdraw from the trading account, the company will deduct its bonus amount on first withdrawal.
  • Only one trading account will have a $50 welcome bonus Against One ID.
  • For deposit & withdrawal amount, see our deposit and withdrawals policy.
  • Leverage on these bonus accounts will be 1:50 maximum.
  • All accounts will be opened in ECN spreads category only.

Demo Contest:

  • The duration of the contest will be 1 month only, (1st Nov to 30th Nov 2018).
  • The leverage in the demo trading account is 1:1000.
  • All Participants will get the Initial deposit of $10,000 in demo Contest trading.
  • All Participants must be at least 18 years old or legal age according to their origin.
  • One ID/Passport has only one account in Demo Contest.
  • At the end of the contest, all open positions will be settled before final calculations.
  • The company has the right to terminate the account at any time if fraud and any specious activities have been found.
  • The Company can discontinue the contest at any time without prior notice.
  • All winning account is in Standard account Category & shall not be under any IB.
  • Winner will get a live trading account.
  • The winning amount is withdraw-able.
  • Withdrawals are only in Skrill, Neteller, Perfect Money.

Educational & Trading Tools

CF Merchants have broken down their education and research into the two distinct categories.

Education: The majority of the education provided by CF Merchants is based around getting to know the trading platform as well as how to use the CF Merchants platform. There are two sections based around reaching charts and basic indicators which could be helpful, but if you are really looking to learn how to trade we would recommend looking for more in-depth information out on the internet.

Research: There is the standard economic calendar offering you information on upcoming news events and which markets they may affect. There are also some daily feeds, however, these have not been updated since April 2019. Finally, there is some market analysis that can help you decide what to trade, again though this has unfortunately not been updated since April 2019.

Customer Service

The contact us page is quite empty, there is an online submission form for fill in and you should get a reply via email, there’s also a single email address, however, a second email address for the support team can be found at the bottom of the page.

We did not manage to test out the customer service team, but it would have been nice to see more options and a phone number would have been good to see too. We are also unsure of the opening times but we expect the customer service team to be closed over the weekend at the same time as the markets.

Demo Account

Demo accounts are available with CF Merchants however the details on them are unknown, we do not know the trading conditions or how long they last.

Countries Accepted

The following statement is available on the CF Merchants website: “CF Merchants (SV) Ltd does not provide services and accept applications from the residents of certain countries, such as the United States of America, Canada, Israel, North Korea, and Saint Vincent & The Grenadines. The statistics on this website is not directed at residents in any country or jurisdiction where such distribution or use would be contradictory to local law or regulation.” If you are unsure of your eligibility, be sure to get in contact with the customer service team to find out.

Conclusion

CF Merchants have decent trading conditions, they are in line with a lot of the competition, plenty of ways to deposit and withdraw along with no fees is also a good point, not to mention the vast number of tradable assets means you will always have something to trade. The main downside comes when we look at the support system, there is no phone number available and just a simple contact form and email address, it is vital to have clear lines of communication when using a financial institute, so it is up to you to decide if that is important to you or not.

Categories
Forex Forex Brokers

Real FXM Review

Real FXM is a UK based foreign exchange broker that is operating as a Straight Through Processing (STP) broker. They claim that some of the main benefits in using them include commission-free trading, access to advanced trading tools, negative balance protection on all accounts, access to a dedicated account manager, the use of straight-through processing, no dealing desk, the ability to use high leverage, free demo accounts and training, an array of instruments to trade, fund segregation and high levels of security. We will be using this review to see if all of the above is really offered and you help you decide if they are the right broker for you.

Account Types

When signing up with Real FXM there are three different accounts that you can choose from, we have outlined them below along with their requirements and features.

There are some features that come with all accounts including fixed spreads, economic calendars, real-time news, daily analysis, one-click trading, exclusive chart access, traders’ views, and analysis, and data security.

X-Standard Account: This account requires a minimum deposit of $200 in order to open, it has standard spreads and a leverage of 1:200. It only has Forex pairs available to trade and uses the X-Web trading platform. There is a free demo account that lasts for 2 weeks and there is limited personal training. You can have a maximum of 25 open trades or orders and there is limited access to online chat support and a personal account manager.

X-Premium Account: This account has a minimum deposit requirement of $2,000. It comes with premium spreads and leverages up to 1:400. It has Forex pairs and metals available to trade and uses the X-Web trading platform along with mobile apps. There is a free demo account that lasts for 1 month and there is complete access to personal training. You can have a maximum of 75 open trades or orders and there is access to online chat support and a personal account manager.

X-Pro Account: This account has a minimum deposit requirement of $5,000. It comes with premium spreads and can be leveraged up to 1:400. It has Forex pairs, metals and commodities available to trade and uses the X-Web trading platform along with mobile apps. There is a free demo account that is unlimited and there is complete access to personal training. You can have a maximum of 200 open trades or orders and there is access to online chat support and a personal account manager.

Platforms

X-Web is the only platform available to use from Real FXM, the platform is easy to use and does not require any installation or download it can be accessed by clients through a PC or Laptop from anywhere in the world.

A few of its many features are its customization, chart analysis, and trading, news and analysis, one-click trading, built-in the economic calendar, and automated trading. It also comes as a mobile application that offers the ability to trade on the move, it’s easy to use and is optimized for mobile devices.

Leverage

The leverage you are able to use depends on the account you use. If you use the Standard account you can have the account leveraged up to 1:200, using the Premium or Pro accounts will allow you to use leverage up to 1:400. The account leverage can be selected when opening up an account and should you wish to change it you can do so by contacting the customer service team with the request.

Trade Sizes

Trade sizes on all three accounts start from 0.01 lots which are known as a micro lot and equates to 1,000 currency units. The trades then go up in increments of 0.01 lots until it reaches the maximum. Unfortunately, we do not know what the maximum trade size is for any of the accounts or how many open trades and orders you can have at any one time.

Trading Costs

All three accounts use a spread based system (that we will look at later in this review) and so there are no added commissions added to the accounts or trading. There are things called swap charges though these are fees that are charged when you hold a trade overnight, they can be both positive or negative and can normally be viewed within the trading platform that you are using. Some brokers offer swap-free accounts but we did not see a mention of them here at Real FXM.

Assets

Sadly, there isn’t a full breakdown of the available assets or a product specification available, there is however a small section indicating some of the available assets which we will briefly go over.

Forex: We do not have a full breakdown but Real FXM gives you the opportunity to trade major currency pairs like EUR/USD, GBP/USD, USD/JPY and also exotic currencies like USD/MXN (Mexican peso), USD/TRY (Turkish lira).

Metals: Through CFDs, you can also trade metals like Copper etc. and you can also trade precious metals like Gold, Silver & Platinum at a much lower cost than the physical purchase of them.

Commodities: Soft commodities like Sugar, Coffee, and Crude Oil are available to trade, there seems like there will be more but those are the only ones mentioned by name,

Indices: A selection of major global indices in the UK, US, Europe, Asia, and Australia is available to trade. Some examples given are France 40, Nifty 50 and UK 100.

Shares: Shares from all over the world are available including shares from the UK, US, Europe, and Asia.

Spreads

We do not fully understand the spreads, we know that the higher tier account you get the lower your spreads will be but we do not have any specific examples of actual spreads. The Standard account gets standard spreads, the PRemium account gets premium spreads and the Pro account gets pro spreads, what these actually equate to we do not know, so ultimately, we do not know what the overall trading cost of trading with Real FXM is.

Minimum Deposit

The minimum amount required to open up an account is $200, this will allow you to access the Standard account, if you want the Premium account when you will need to deposit at least $2,000 and $5,000 if you want to use the Pro account. Usually, once an account has been opened the minimum deposit amount reduces, unfortunately, we do not know if that is the case here with Real FXM.

Deposit Methods & Costs

There are a few different methods available to deposit with, these are Bank Wire Transfer, Credit/Debit Card and Neteller.

The deposit information page talks a lot about when you should deposit (after opening an account) but it does not mention anything to do with fees, so we are not sure if there are any added. What we are sure of, is that you should check with your own bank or card issuer to see if they will add any outgoing transfer fees of their own.

Withdrawal Methods & Costs

The same three methods are available to withdraw with, for clarification those are Bank Wire Transfer, Credit/Debit Cards and Neteller. When using a Credit or Debit card you can only withdraw the same amount that you deposited, any extra will need to use one of the other available methods. There is an added withdrawal fee of $20 depending on your country when using Bank Wire Transfers. There is no indication for any fees for the other two available methods.

Withdrawal Processing & Wait Time
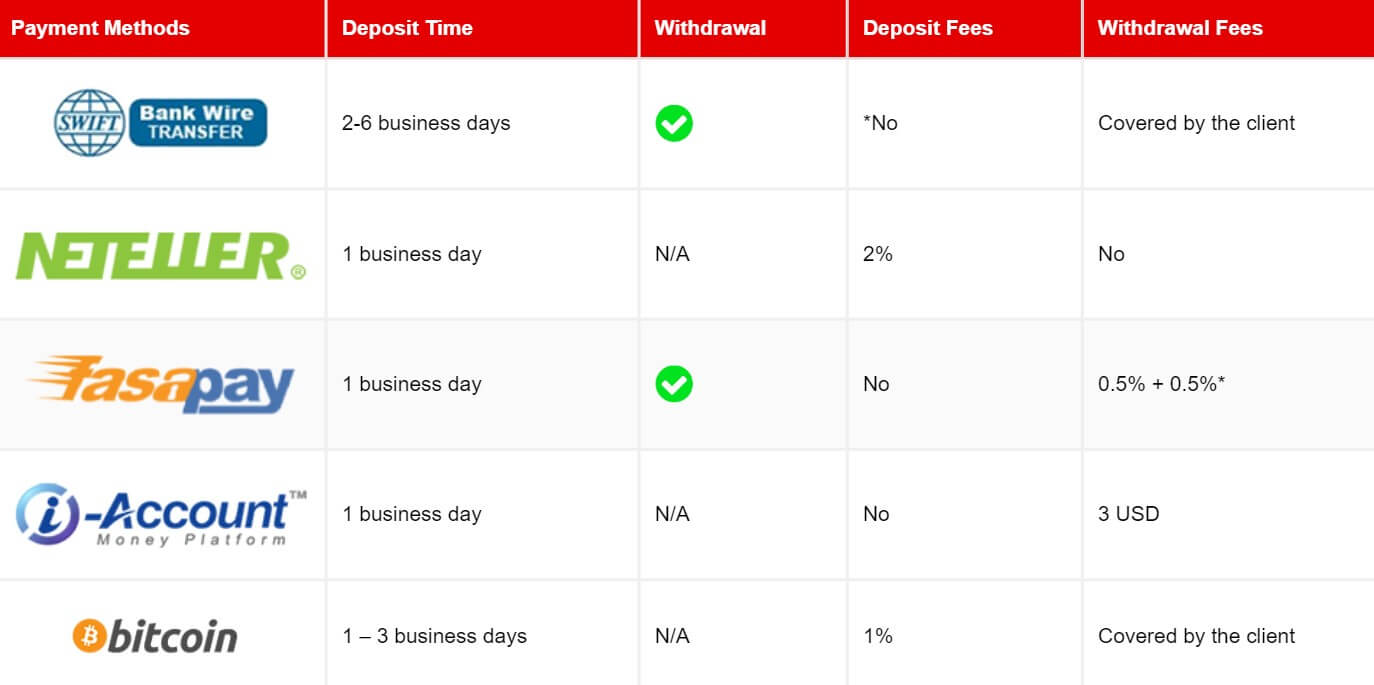
The withdrawal processing time is not indicated on the site, we would hope that Real FXM would process any requests within 48 hours of the request being made, once it has been processed by Real FXM it will then take an additional 1 to 5 working days for the funds to be fully processed by your bank, this time will vary from bank to bank.

Bonuses & Promotions

There are a few little bonuses available to sue, the first one is a referral scheme which is just like any other, there is also an introducing broker scheme which works much the same but on a larger scale.

The main bonuses available are an exclusive deposit bonus. You can get this bonus on your first deposit of $500, you will get an additional 25% bonus and reduced spreads on an instrument of your choice. You can then get up to a 50% bonus on further deposits depending on your account. We do not know the terms of these bonuses such as how to convert the bonus funds into real funds.

There is also a social media promo, simply like and connect with Real FXM through Facebook, Twitter or Instagram and get access to weekly promotions such as a $25, $50 or $100 bonus, again the terms of these bonus funds are not known to us.

Educational & Trading Tools

There is a forex school part to the site, unfortunately once the first overview page loads, any additional pages are giving an error stating that the page cannot be found. This is a shame as it would have been good for their clients to have some learning materials to help them improve their trading, so with it not working, the section may as well be removed from the site.

Customer Service

The customer service team can be contacted 24 hours a day 5 days a week, they close over the weekend and on bank holidays.

You can use the online submission form, fill it in with your query or request and you should then get a reply via email. You can also use the provided postal address, phone number, support email, compliance email or Skype username.

Address: C B C House Realfxm, 24 Canning St, Edinburgh EH3 8EG, United Kingdom.
Phone: +441316189330
Support Email: [email protected]
Compliance Email: [email protected]
Skype Username: realfxm.Support, Realfxm

Demo Account

Demo accounts are available but there isn’t much information about them as you need to be fully logged into your website account in order to open one up. The demo accounts allow you to test out market conditions and strategies without any real risk, we do not know the full details or conditions of the demo account at Real FXM such as which account it mimics or if there is an expiration time on the accounts.

Countries Accepted

This information is not readily available on the website, so if you are thinking of joining Real FXM, we would recommend getting in contact with the support department before you do, just to be sure that you are in fact eligible for an account with them.

Conclusion

The available accounts offer a range of conditions, unfortunately, when it comes to the cost of trading we do not know as we do not have a full understanding of what the spreads are, we know that the higher tier accounts have lower spreads, but no indication of what they actually are, some of that lack of information is due to there not being an asset breakdown or specification.

There is also a limited number of ways to deposit and withdraw, it does not seem like there are any fees for depositing but there are for withdrawing via Bank Wire, it’s not the biggest fee but it is still present. Plenty of ways to get in touch with the customer service team. The site is well laid out, but the main downside is the lack of the finer details, product specification, things like the bonus terms and conditions are not shown and other smaller details are what let the site down.

Categories
Forex Market Analysis

Crude Oil Boosts Amid Massive Output Cut Sentiment – OPEC Meeting In Focus! 

A day before, the WTI crude oil prices were boosted by reports that massive output cuts would be agreed upon when OPEC and its allies, including Russia, meet later today. U.S. Nymex crude oil futures jumped to trade $27.09 a barrel. 

Meanwhile, the U.S. Energy Information Administration reported that crude oil production in the country sank to a six-month low of 12.4 million barrels per day last week. The agency also said crude oil stockpiles increased 15.2 million barrels, much higher than a build of 8.4 million barrels expected.

Declining demand due to coronavirus fears and lockdowns, Russia’s announcement comes at a suitable time. Whereas, the Energy Information Administration (EIA) said overnight that the U.S. crude oil inventory has grown by 15.2 million barrels for the week ending April 3, against analyst expectations of a 9.37-million-barrel build. The American Petroleum Institute (API) also estimated a build of 11.9 million barrels yesterday. 

OPEC meeting will likely be more successful than their meeting in March, where they failed to agree to continue supply cuts and fueled a price war between Saudi Arabia and Russia.

Apart from the OPEC+ meeting, energy ministers from the Group of 20 major economies are expected to meet in order to find new ways to help ease the impact of the COVID-19 pandemic on global energy markets.

Daily Support and Resistance

  • S1 24.14
  • S2 26.37
  • S3 27.77

Pivot Point 28.59

  • R1 30
  • R2 30.82
  • R3 33.05

Crude oil is on a bullish run, trading around 27.15 level. The U.S. oil is likely to face immediate resistance around the triple top level of 28.86. Today, crude oil may find immediate support around 25.45 level, and above this, the WTI crude oil prices can show a bullish bias until 28.85 resistance. A bullish breakout of 28.85 level can lead WTI prices further higher until the next resistance area 30.22. The bullish bias remains dominant, and we should look for buying trading over 26.15 today. Good luck!

Categories
Forex Forex Brokers

TopGrowth Futures Review

Topgrowth Futures is a brokerage company that was formed in 2003, based in Indonesia and aimed towards those living in the same jurisdiction. They do not give a lot of information about themselves, some of their main emissions are to become a leading foreign exchange broker through building a transparent platform, good customer service, and a continuous education program. We will be looking into the services that are being offered to help find out a little more about them and the service that they provide their clients.

We had some issues loading the site with Google Chrome so we had to switch over to a different browser, we have noted this just in case you have a similar issue.

Account Types

There are two different accounts available, they are not providing a lot of information about them but the information we do have is below.

Mini Account: A minimum deposit of 5 million Indonesian Rupiah ($500 for USD users) is required to open up the account, it comes with a minimum trade size of 0.1 lots and a maximum trade size of 5 lots. The account uses Meta Trader 4 as its trading platform.

Regular Account: A minimum deposit of 100 million Indonesian Rupiah ($10,000 for USD users) is required to open up the account, it comes with a minimum trade size of 1 lot and a maximum trade size of 50 lots. The account uses MetaTrader 4 as its trading platform.

Platforms

While they do not have any information surrounding it, we do know that Topgrowth Futures uses MetaTrader 4 as its trading platform. MT4 is an extremely popular trading platform used by millions all around the world, it comes with a lot of customization to help make it a trading platform that can suit your needs. It has multiple charts, timeframes and is compatible with thousands of expert advisors and indicators to help with both auto trading and your analysis. It can also be accessed via a desktop download, mobile application or web trader so you know you can always have access to your trades and accounts.

Leverage

We, unfortunately, we do not have any information surrounding the available leverage so we cannot comment on what the maximum leverage for either account type may be.

Trade Sizes

Trade sizes on the Mini account start from 0.1 lots and go up to 5 lots. The Regular account has trades starting at 1 lot and they go up to 50 lots. There is no indication as to how many trades you can have open at any one time.

Trading Costs

Trading costs are another aspect that we do not have any information on, this goes for both commissions and swap charges. Due to this, we do not really know how expensive it could be to trade at this broker. While there is no mention of any swap charges, we would expect there to be any unless stated otherwise, they would be charged for holding trades overnight and can be viewed within the MT4 trading platform.

Assets

There is a small breakdown of the available trading assets, we are not sure if they are the entire list as it would be pretty small if it is, however, there is a chance that this is all that is available, we have outlined them below for ease of reading.

Forex: EURUSD, USDJPY, GBPUSD, USDCHF, AUDUSD, NZDUSD, USDCAD, EURGBP, EURJPY, GBPJPY, CHFJPY, and AUDJPY.

Spot Metals: Gold and Silver only.

Commodities: It seems that only gold is available as a commodity, you are able to trade in different sizes from different exchanges using contracts.

Indices: Only three are mentioned which are the Nikkei 225, HK 150 Hang Seng, and the KOSPI 200. It is unknown if there are more available.

CFDs: Lastly, there are CFDs, these include the likes of Dow Jones, S&P 500, Nasdaq, FTSE, Dax, and Crude Oil.

Strangely, some instruments we would expect to see in different categories, but this is how they have been set out on the site.

Spreads

This is yet another aspect of the trading conditions that we do not know, the front page of the site states that there are low costs, which we would assume is relating to the spreads, however, there are not any examples of the spreads and as there is no product specification, there are no details of the spreads there either.

Minimum Deposit

The minimum amount required to open an account is 5 million Indonesian Rupiah or $500, this will allow you to use the Mini account, if you wish to use the Regular account then you will need to deposit at least 100 million Indonesian Rupiah of $10,000 if using dollars.

Deposit Methods & Costs

There doesn’t seem to be any information on the site regarding deposit methods, this includes the methods available or any potential fees that may come with them.

Withdrawal Methods & Costs

This information is also not available, this is often vita as it allows potential clients to see how they can get their money back out and also if it will cost them anything, not having this information available long with the deposit methods makes it hard to judge if it is worth signing up and doesn’t help to build trust between the broker and client.

Withdrawal Processing & Wait Time

As we do not know how to withdraw, we also do not know how long it will take, we would hope that any withdrawal requests would be fully processed within 7 days of the request being made but we cannot say this for sure.

Bonuses & Promotions

While looking through the site we did not come across any information on bonuses and withdrawals, so if you are interested in them we would suggest contacting the customer service team to see if there are any coming up that you could take part in.

Educational & Trading Tools

Education is an aspect of the broker that they seemed to mention as a big plus, so let’s see what they offer. To be honest, not a lot which is a real disappointment. There is a page with a few tutorial videos on how to use the Topgrowth Futures platform and website, there is a section for Trading for Beginners, however, the page is blank and so there is nothing to learn. There are then some more videos on how to use the trading platforms and a Webinar section, which again is blank. On the front page, there are some links to daily analysis that are up to date and being updated.

There is a separate news site called Topgrowth News which is from the same company, however that is not directly part of the broker so we won’t go into much detail on it, it does seem that the majority of the educational material is found on this news site.

Customer Service

Another aspect that Topgrowth Futures pride themselves on is their customer service team, there is no indication as to their opening times but we would expect them to be closed over the weekends when the markets are also closed.

You can get in touch using the online submission form, fill it in and you should get a reply via email, there is also a postal address and phone number available to use. At the bottom of the site, there is also an email address present.

Address: Sahid Sudirman Center, Lantai 40, Unit F-G, Jl. Jend Sudirman Kav. 86, Jakarta 10220 Indonesia
Phone: +62 21 2788 9393
Email: [email protected]

Demo Account

Demo accounts are available however there is no information available on the trading conditions of the demo account. You can sign up by creating an account and it uses MetaTrader 4 but that is all we know, we do not know if there is an expiration time on the account. Demo accounts are great as they allow clients to test out the markets as well as new strategies without any real risk to their own capital.

Countries Accepted

This information is not present on the site, however, it seems like the broker is aiming more towards those that are from Indonesia, however, if you are interested in joining we would recommend contacting the customer service team to see if you are eligible for an account, prior to opening one up.

Conclusion

There is a lot of helpful information missing from the Topgrowth Futures site, we do not know what the trading conditions are, leverage spreads and commissions are all missing, so the total cost of trading is also unknown. There is also a complete lack of information surrounding deposit and withdrawal methods, it is important for potential new clients to know how they can get their money in and out and also how much it will cost them to do so. Without any of this information being readily available, it is hard for users to recommend Topgrowth as a broker to use.

Categories
Forex Assets

BTC/USD – Trading Costs Involved While Trading This Crypto-Fiat Pair

Introduction

Apart from currencies pairs, exchanges allow trading of cryptocurrencies as well. Cryptocurrencies can be bought and sold in the exchange market through Forex brokers. Trading cryptocurrencies can be closely related to Forex trading but not stock trading. This is because cryptos are traded as pairs and not individually. In this series, we will be analyzing the trading costs involved while trading cryptocurrencies that are paired with fiat currencies (Ex: USD).

BTC/USD is a cryptocurrency pair where BTC stands for Bitcoin, and USD stands for US Dollar. This pair is traded through Forex brokers as CFDs, or through cryptocurrency exchanges where cryptos are bought and sold exclusively.

Understanding BTC/USD

The price of BTC/USD in the exchange market represents the value of the US Dollar equivalent to one 1 Bitcoin. It is quoted as 1 BTC per X USD. For example, if the current market price of BTCUSD is 7356.50, then it can be said that one Bitcoin is equal to the US $7356.50.

BTC/USD specifications

Spread

Spread is the difference between the bid and the ask price in the exchange market. It is determined by the brokers and exchanges, and it hence varies from time to time. Typically, the spreads for trading cryptocurrencies are very high. In recent years, the spread of coins having two decimal places is between 1500-6000 pips. The approx. spread on ECN and STP accounts are given below.
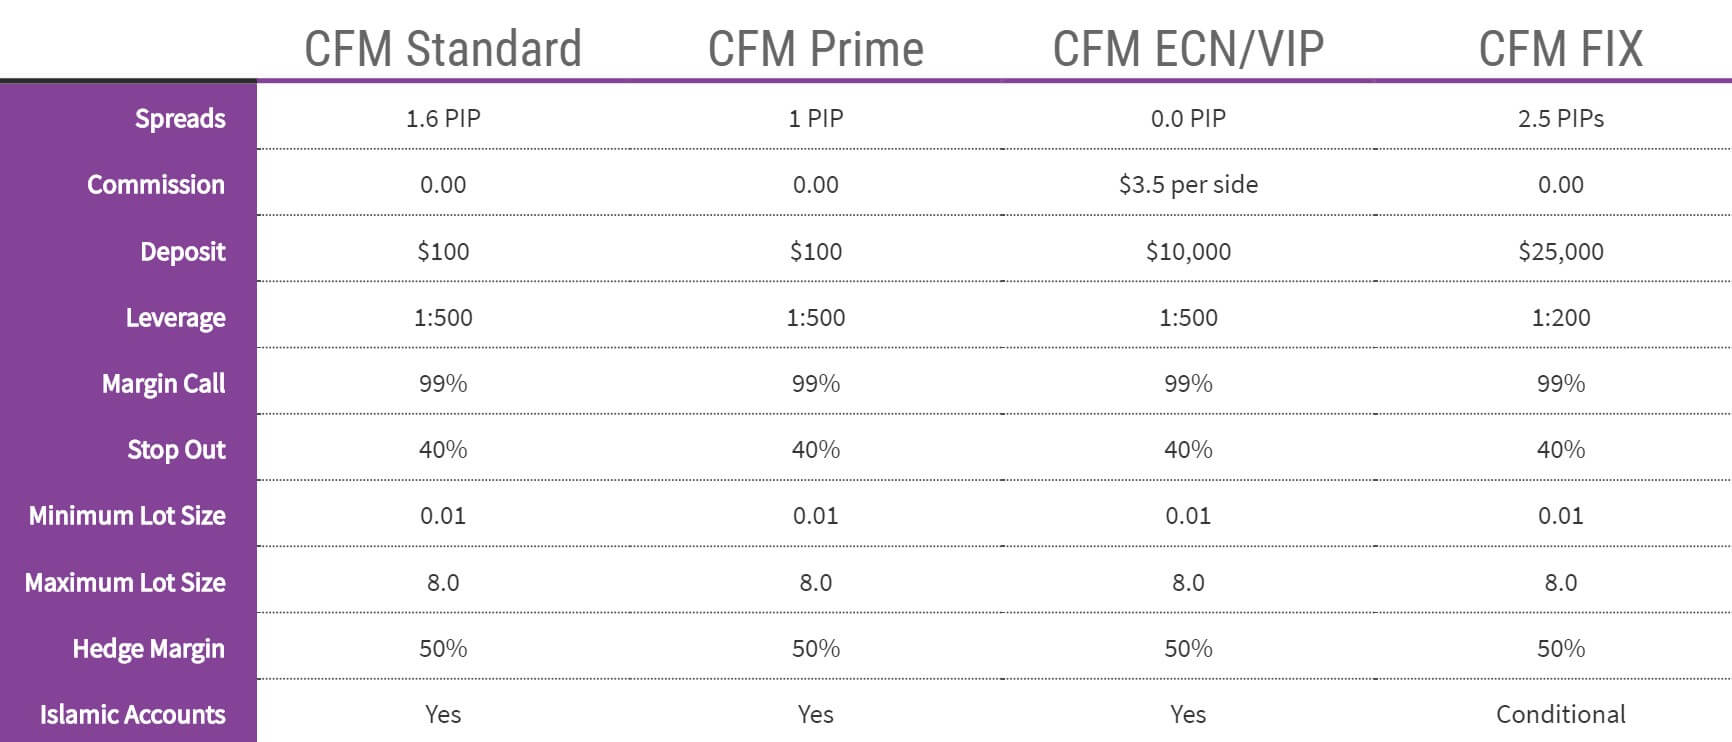
  • Spread on ECN: 3000 pips (30 USD)
  • Spread on STP: 3050 pips (30.5 USD)

Fees

The fee is simply the commission paid for the position a trader takes. It is charged only for ECN and Pro accounts and not for STP accounts. For our analysis, we shall keep the fee at 45 pips.

Slippage

Slippage is the difference between the price at which a client executed trade and the price which was actually given by the broker. This difference occurs either because of high market volatility or speed of trade execution.

Trading Range in BTC/USD

The trading range is the representation of the pip movement in the pair for different timeframes. The values are calculated using the average true range indicator. And the procedure to assess it is given below as well.

Procedure to assess Pip Ranges

  1. Add the ATR indicator to your chart
  2. Set the period to 1
  3. Add a 200-period SMA to this indicator
  4. Shrink the chart so you can assess a large time period
  5. Select your desired timeframe
  6. Measure the floor level and set this value as the min
  7. Measure the level of the 200-period SMA and set this as the average
  8. Measure the peak levels and set this as Max.

BTC/USD Cost as a Percent of the Trading Range

Cost is a factor that varies with the change in the volatility of the market. By finding the ratio between the total cost and volatility, the variation in the costs is measured.

ECN Model Account

Spread = 3000 | Slippage = 25 |Trading fee = 45

Total cost = Slippage + Spread + Trading Fee = 25 + 3000 + 45 = 3070

STP Model Account

Spread = 3050 | Slippage = 25 | Trading fee = 0

Total cost = Slippage + Spread + Trading Fee = 25 + 3050 + 0 = 3075

The Ideal way to trade the BTC/USD

It is a general impression that trading cryptos are very risky because of its high volatility. But it is not completely true. To clear the misconception, consider the following example.

The pip value of BTC/USD per lot is 0.01 USD. That is, for every pip up or down, you will gain or lose 0.01 USD. The average pip movement in the 1H timeframe is 9100 pips. So, if you trade one lot of BTC/USD, you will win or lose about $0.01 x 9100 = $91 in a time frame of one hour. Hence, though the pip movement seems to be high, the profit/loss remains within decent boundaries.

Considering the cost variation in the above tables, it can be inferred that the costs are more for low volatile markets and less for a highly volatile market. But, the cost for average volatility acts as a median. Hence, trading when the volatility is around the average values is recommended. Furthermore, costs can be lowered by trading via limit orders instead of market orders. In doing so, the slippage on the trade will be nullified and will not be included in the total cost. In the above example, the total cost would reduce by 25 pips.

That’s about the trading costs involved while trading the BTC/USD pair. We will be discussing more Crypto/Fiat pairs in the upcoming articles. In case of any queries, let us know in the comments below. Cheers!

Categories
Forex Fundamental Analysis

‘Producer Price Index’ & The Degree Of Its Impact On The Forex Charts

Introduction

Producer Price Index PPI, which sounds very similar to the Consumer Price Index CPI is also an equally important indicator. It is widely used as a leading indicator to predict the upcoming CPI and thereby draw economic conclusions accordingly ahead of time. Hence, understanding the Producer Price Index, its history, and the resultant effect it has on the market is significant for traders who trade on Fundamental Analysis.

What is the Producer Price Index?

As the name suggests, the calculation of this index is from the viewpoint of the Producer, i.e., a manufacturer or maker of goods and services. Producer Price Index, in the simplest sense, measures the average of the selling prices of the goods and services at the manufacturing end place. In other words, it is the average of the prices at which the manufacturer sells his products and services to the retailers, who then take it to the local markets and make it available to the general public.

Understanding the difference between what Producer Price Index and Consumer Price Index represent is the key here. Consumer Price Index CPI represents the cost at which goods and services are made available to the general public. Hence, CPI is the measure of average weighed in COST PRICE of finished goods while the Producer Price Index represents the weighted average of SELLING PRICE of the manufactured goods. CPI represents what the end consumer or customer pays, and PPI represents what the manufacturer receives for his commodities.

An item when manufactured and sold from the place where it got manufactured incurs certain costs before it reaches the end consumer. These costs include transportation fees, some specific goods & service taxes, storage costs, etc. Hence, Producer Price is a more rudimentary or cruder form of CPI, and there is an inherent correlation between both. For this reason, PPI is considered an advanced signaling tool to assess CPI and make informed economic decisions by various groups.

How is the Producer Price Index PPI calculated?

The Bureau of Labor Statistics (BLS) surveys almost all industries in the goods manufacturing section and a majority of service sectors. This organization continues to include more and more divisions as time progresses. Producer Price Index of BLS is calculated by first collecting data from all the listed industries by field economists. These people collect data through various means like an onsite visit, phone calls, or even emails, etc.

The producer Price Index uses an altered version of the Laspeyres index. For any given set of goods, it compares the base period revenue to the current period revenue.

Producer Price Index =  (∑QoPo(Pi/Po)) / (∑QoPo)  ×100
  • Qo: Commodity Quantity shipped in the base period
  • Po: Commodity Price in the base period
  • Pi: Commodity Price in the current period

The above equation tells clearly that based on size & importance, items are weighted. The base price corresponds to 100 for which the base year corresponds to 1982. The PPI is published as a percentage increase or decrease with regards to the previously released number, which may be monthly, quarterly, and annually.

Why is the Producer Price Index important?

CPI measures consumer inflation, and PPI measures business inflation. The significance of the Producer Price Index is many-fold. First are the range and history of the data. The index data set goes way back in time. For example, PPIFGS (Producer Price Index by Commodity for Finished Goods) goes as far back as 1947. With such huge data, the reliability of the data set is high, and it usually depicts the macroeconomic picture of country and industrial health with good confidence.

Also, The PPI program is the oldest continuous series of the Federal Government going back to 1902. Second is the frequency & direct ground-level nature of the statistic meaning this data is a real-time reflection of the current industrial health. Thirdly, PPI is very closely related to CPI in the sense that it is an index of the same goods at an earlier stage of the life cycle.

While CPI shows the stats for a product at the near-end of its transaction life cycle in terms of changing hands, PPI shows the stats at the first transaction life cycle, which is very helpful. In this Index, there are many subcategories, wherein certain goods and services get included or excluded from the basket to give a more accurate picture of the concerning market in absolute or relative terms. For example, PPILFE Producer Price Index Excluding Food & Energy (Core PPI) strips away food, gas, and oil prices from the equation whose prices are volatile and measures the absolute changes.

How can the Producer Price Index be Used for Analysis?

The range of PPI is such that there is something for everyone here. Narrowing down into the PPI, any industry can be analyzed. Broadly there are three most popular classifications:

Industry classification: Here, groupings of commodities are done based on the industry sector they represent. The PPI releases about 535 indexes with more than four thousand specific product lines and product category sub-indexes.

Commodity classification: Here, the grouping of items is done based on the similarity of goods and services in terms of their making.

Commodity-based Final Demand-Intermediate Demand (FD-ID): Here, Based on the consumer group, the commodities are classified and are one of the most used PPI stats.

Due to the diversity in the statistics, different sectors of economists can isolate and use the Producer Price Index for their purposes.

Producer Price Index is a widely used indicator for predicting Consumer Price Index. Manufacturers and Industrialists also use these PPI to adjust pricing on the goods and services they buy and sell to fellow manufacturers to avoid having fixed pricing or unfair price changes during the duration of their business contract, which usually tends to be very long periods.

Sources of Producer Price Index

The U.S. Bureau of Labor Statistics releases all the indexes as mentioned above here

You can also find out the same indexes along with many others with a comprehensive summary and statistics of various categories on the St. Louis Fed website.

Impact of PPI’s news release on the Forex market 

After understanding the definition and significance of the Producer Price Index (PPI) in an economy, we shall look at its importance on price charts. For analysis purposes, we have taken the PPI data of Japan, where the survey responses from large Japanese manufactures provide the data for the report. Even though the PPI is a key indicator of the manufacturing sector of the economy, currency traders do not consider it to be the most important indicator of the overall economy. The below image The Business Manufacturing Index (BSI), along with PPI, measures the business sentiment in manufacturing.

The PPI data is released by ‘Bank of Japan’ that measures the change in selling prices of goods purchased by Japanese Corporations. A higher than expected PPI is considered to be positive for the currency and vice versa. The PPI data is released on a monthly, quarterly, and yearly basis, but the highest importance is given to the year-on-year data. The below image shows the latest year-on-year PPI data of Japan that was released in the month of March. As we can see, there is so much variation in the data from ‘previous’ to ‘forecasted to the ‘actual.’ This means, there are many other factors that influence the manufacturing industry that it is difficult to measure for the economists.

EUR/JPY | Before The Announcement

The above chart is that of EUR/JPY, and since the Japanese Yen is on the right-hand side, a down-trending market indicates the strength of the Japanese Yen. The reason behind this downtrend before the news release is because of the bullish expectation of the PPI data from market players. Traders have already forecasted the PPI to be around 1%, which 0.5% lower than the previous reading. Since it is lower, we should expect weakness in the Japanese Yen, but 1% seems to be a good PPI figure for the Japanese economy, hence the downtrend. We need to remember that a higher PPI data is not compulsory to take the currency higher, but rather sometimes the data alone plays importance.

EUR/JPY | After The Announcement

After the PPI numbers are announced, the price barely goes above the moving average line, and there is not much change in the volatility. As the PPI is not an impactful event, the volatility is as expected. A reduction in PPI is bad for the currency, but even though the PPI was reduced, the Japanese yen did not get weak. Therefore, we should just not be paying attention to the news but also use technical analysis to take trades. In this example, we can go long in the market only if we get ‘reversal’ signs, but we don’t see any such patterns. Thus, we should be looking for trend continuation patterns and join the downtrend.

GBP/JPY | Before The Announcement


GBP/JPY | After The Announcement

The above image represents the GBP/JPY currency pair, which shows similar characteristics as that of EUR/JPY, where the downtrend is much stronger than the latter. Since the downtrend is prominent, only a much worse PPI than before can take the currency higher. Even if the PPI was very low, the uptrend would not last as it is not an important measurement of the economy. After the news announcement, there is hardly any effect on the currency pair, and the volatility is in the same range. The PPI data was almost the same as that was forecasted by traders, and we can say that it was as per the market expectations. This made the Japanese Yen to strengthen more and downtrend extended on the downside after a bit of consolidation. Once the market slips below the moving average, a ‘short’ trade can be taken with a stop loss above the ‘news candle.’

USD/JPY | Before The Announcement


USD/JPY | After The Announcement

This is the USD/JPY currency pair, where the chart characteristics are a little different than the above two charts. Here we don’t really witness a downtrend but rather a ranging nature of the market. Since we are near the resistance area, any positive news release should be taken as an opportunity to ‘short’ in this pair. This is the way we should combine fundamentals with technical analysis. After the news is released, we don’t see any change in the volatility, and the ‘news candle’ leaves a wick on the top. The PPI data was again positive for the Japanese Yen, where the price crashed right after the ‘news candle.’

That’s about PPI and how the Forex price charts get affected during the news release of this fundamental indicator. Let us know if you have any questions in the comments below. Cheers!

Categories
Forex Course

97. Where Are The Pivot Point Levels Put To Use?

Introduction

In our previous two discussions, we enlightened you with different strategies for using the pivot points. If you noticed, there we focused only on the pivot support and resistance levels. We didn’t really touch base on the Pivot Point (P) level. So, in this chapter of pivot points, we shall understand how the pivot point level is useful.

The usefulness of Pivot Point

The pivot point is used to measure market sentiment. Yes, with pivot points, we can even gauge the sentiment of the market. In other words, the pivot point helps us determine the direction of the market. It tells us in which direction is the money flowing in the market. So, basically, it indicates the trend of the market. Now, let’s take a few examples to understand the use of pivot points.

What does a Pivot Point tell us?

We know that the pivot point determines the type of market we are in. Inferences are made when the price falls below or above the pivot point.

  • When the market breaks below the pivot point (P), it indicates a bearish market or a market where the sellers are under control.
  • When the market breaches above the pivot point (P), it indicates a bullish/buyer’s market.

Bearish Example

Consider the chart below representing the GBP/JPY on the 15min timeframe. The pivot points are indicated as shown. Initially, we can see that the market was holding above the Pivot Point (P). Later in the day, it broke below the pivot point and then continued to move south. Also, it didn’t even respect the support levels. From this, we can conclude that the support levels do not work every single time. It perfectly fine when it is combined with other tools of analysis. However, a breakout trader would’ve profited the most from it.

Most importantly, one must not use this pivot point level as a tool to enter a trade. It is only an indicator that determines the sentiment of the market. It only tells us if the buyers are showing interest in the currency pair or the sellers. And with information in hand, we use other trading techniques to time the market.

Bullish Example

In the below chart, we can see that the market was trading below the pivot point level. Then it shot up and broke the pivot level as shown. This marks the start of an uptrend. And it is clearly visible that the market headed north by breaking through R1 as well as R2. But at R3, it found resistance. Now since the market is trending up, one can look at the price drop from R2 as a discount and anticipate buying at the R2 level, which is ‘resistance turned support.’

Similarly, traders can determine the direction of the market using the pivot point level and time their entry based on other technical tools and ideas. We hope you found this lesson informative and interesting. Cheers!

[wp_quiz id=”69915″]
Categories
Forex Daily Topic Forex Price-Action Strategies

Breakout Length: Key to Trend’s Strength

In today’s lesson, we are going to demonstrate the relation between the trend’s strength and breakout length. The breakout length usually represents one-fourth of a potential trend. If the breakout length is 25 pips, the trend may sustain up to 100 pips before making a big correction or long consolidation. It is important for breakout traders since the market often makes a breakout; confirms the breakout. However, the price does not head towards the trend direction. Let us clarify this by the examples below.

The price has been bearish upon making a bearish engulfing candle. The last swing low is quite far. This means the breakout length looks good for the sellers. The more the breakout length, the better it is for the traders.

The chart produces a bullish engulfing candle in between. This is bad for the sellers. The price may find its new resistance to produce a bearish reversal candle to make a breakout at the lowest low. This means the breakout length most probably needs to be adjusted.

The price seems to have found its new resistance here. It produces a do candle followed by a bearish engulfing candle. This means it produces an evening star. If the price heads towards the South and makes a breakout, the sellers may go short upon breakout confirmation. However, they must calculate new breakout length from the new resistance to the lowest low.

Here comes the breakout candle. This is an explicit breakout. The sellers are to wait for the price to make a breakout confirmation. If the next candle closes below the breakout candle, the sellers may trigger a short entry.

The confirmation candle looks to be an A+ breakout confirmation candle as well. However, do not forget the distance the price has already crossed. The price has crossed about 70% length considering the breakout length. Thus, the price may make a bullish correction. It usually happens when the price finds a new level of support/resistance. Let us proceed to the next chart.

The chart produces a big bullish engulfing candle, which changes the entire scenario. It happens when the price is about to make a correction. Sometimes corrective wave changes the trend. The sellers if the blindly trigger a short entry after the breakout confirmation without calculating breakout length and trend’s strength, they are to take a loss here.

Breakout strategy traders must calculate breakout length to determine how far the price could go. If it crosses more than 50% to confirm the breakout, it is better to skip such entries.


Categories
Forex Market Analysis

Daily F.X. Analysis, April 09 – Top Trade Setups In Forex – Brace for High Impact Events! 

On the forex front, the U.S. dollar stabilized against its major peers on Wednesday, as the ICE Dollar Index gained 0.2% on the day to 100.16. Eyes will remain on the German Federal Statistical Office, which is due to report February trade balance (16.5 billion euros surplus expected) and current account balance (17.0 billion euros surplus expected).

The U.K. Office for National Statistics will post February monthly GDP (+0.1% on month expected), industrial production (+0.1% on month expected), manufacturing production (+0.1% on month expected) and trade balance (1 billion pounds surplus expected).

Economic Events to Watch Today     


 EUR/USD – Daily Analysis

The EUR weakened against the U.S. dollar on reports that European Union finance ministers failed to agree on a coronavirus relief package. EUR/USD slid 0.3% to 1.0862.

German leading institutes expect the country’s GDP to slump 9.8% in the second quarter compared with the prior quarter and drop 4.2% for the whole year, citing the coronavirus pandemic. Meanwhile, the Bank of France sees the first-quarter GDP shrinking 6% from the previous quarter, the largest decline since World War II, amid nationwide lockdown due to the coronavirus outbreak.

Moving on, the shared currency may face deeper losses if a discussion about the stimulus package again fails to happen on the day or end on a sour note. It’s worth noting that the ECB is already running a negative interest rate policy and a massive asset purchase program. As a result, markets are increasingly expecting governments to do their bit by providing fiscal stimulus. 

Looking forward, the ECB minutes, which are scheduled to happen at 11:30 GMT, are expected to repeat downside risks to the economy and willingness to do more if required. On the data front, Germany is set to report trade figures for the month of February at 07:00 GMT. 

Daily Support and Resistance

  • S1 1.0742
  • S2 1.08
  • S3 1.0829

Pivot Point 1.0858

  • R1 1.0887
  • R2 1.0917
  • R3 1.0975

EUR/USD– Trading Tips

The EUR/USD continues trading within a symmetric triangle pattern, which is keeping the pair within 1.0922 – 1.0765 trading zone. At this moment, the EUR/USD is holding at 1.0866, having an immediate support level of around 1.0835, where the bearish breakout of this level can extend selling until the next support level of 1.07990 and 1.0765.

The MACD has still tossing above and below 0, converting the bearish sentiment into bullish. At the same time, the 50 periods exponential moving average is also keeping the EUR/USD in a neutral mode, extending an immediate resistance around 1.08856. So, let’s consider taking selling trades below 1.0835 to target 1.0775 and bullish above the same to target 1.0910 and 1.0970 today.

GBP/USD– Daily Analysis

The GBP/USD rebounded for a second straight session, gaining 0.4% to 1.2392. U.K. government spokesman James Slack said Prime Minister Boris Johnson is in a stable condition and responding to coronavirus treatment in hospital. 

Later today, U.K. monthly GDP data and manufacturing production for February will be released (both +0.1% on month expected). Whereas, the market risk sentiment getting heavy due to the rise in the U.S. cases, marked as a second highly infected nation, after Italy, in the world. 

As in result, early Asia risk-on sentiment, mainly due to U.S. President Donald Trump’s push for restarting the economy, failed to extend while the U.S. 10-year treasury yields dropped 2-basis points to 0.746% with stocks in Asia flashing mixed results.  

Looking ahead, the traders may not give any major attention to the U.K.’s data-dump comprising Manufacturing Production, Industrial Production, and monthly GDP due to being before the virus outbreak period. 

However, the weekly release of U.S. Jobless Claims and speech from the Federal Reserve Chairman Jerome Powell will be essential to watch. Apart from this, virus updates will not lose its importance and will be essential to watch for new directions.

Daily Support and Resistance

  • S1 1.2104
  • S2 1.2236
  • S3 1.2315

Pivot Point 1.2368

  • R1 1.2447
  • R2 1.25
  • R3 1.2632

GBP/USD– Trading Tip

On Thursday, the GBP/USD soars to trade around 1.2398 within a sideways channel. The channel is supporting the Cable at 1.220 and along with resistance around 1.2490. The release of GDP figures from the U.K. can help drive a breakout in the market. In the case market breaks bellow 1.2278, we may see GBP/USD prices heading into the selling zone until 1.2100 and 1.2005. 

Whereas, the chances of buying remains solid over 1.2275 until 1.2520. The MACD and 50 EMA are also supporting the neutral bias, so let’s consider taking buying trades over 1.2368 with a target of 1.2470 and sell trades below 1.2368  

USD/JPY – Daily Analysis

During Thursday’s Asian session, the USD/JPY currency pair flashing green and continued its previous session recovery rally toward above the 109.00 level. The currency pair rose from 108.60 to 109.06, mainly due to the recent risk reset market sentiment. 

Currently, the USD/JPY is currently trading at 108.94 and consolidates in the range between the 108.80 – 109.06. However, the Japanese yen earlier weakened caused by risk-on market sentiment in the wake of expectation of further stimulus and an easy run for the favorite candidate for the U.S. President’s post.

During the Newyork trading session, the attention was on the Federal Reserve Open Market Committee’s minutes of the unscheduled meeting on March 15. The minutes indicated anxiety about the virus and the extremely large degree of uncertainty. There was a muted reaction to the minutes because they didn’t show anything that hasn’t already been priced in by market traders. They just decided to cut the benchmark rate to nearly zero and restart bond-buying programs.

Moreover, Japan’s Prime Minister Abe has announced a state of emergency in Tokyo and 6-other provinces. He plans to control the economic fallout of COVID-19 as well as a substantial fiscal stimulus package. The package, worth ¥16.5trn, equates to 20% of GDP. Consequently, the USD/JPY currency pair is moving nowhere as investors seem confused about whether to buy USD/JPY over a stronger dollar or sell over the increased safe-haven appeal. 

As per the latest comments from the U.S. and Japanese policymakers also indicated that more stimulus to control the coronavirus (COVID-19) is on their way. On the flip side, Bernie Sanders turned from the U.S. Presidential Candidate’s race, giving an edge to the market favorite Joe Biden and helping to improve the trading sentiment.

Daily Support and Resistance    

  • S1 107.84
  • S2 108.34
  • S3 108.59

Pivot Point 108.85

  • R1 109.09
  • R2 109.35
  • R3 109.86

USD/JPY – Trading Tips

On Thursday, the USD/JPY’s symmetric triangle pattern continues to play due to a lack of high impact economic events. Choppy sessions continue to trade around 108.884, and it’s strictly following a narrow trading range of 108.650 – 107.250. The technical side of USD/JPY is mostly the same as the USD/JPY’s pair continues to find support around 108.700. On the 4 hour timeframe, the Japanese pair has closed a bullish engulfing candle over 50 EMA, which is suggesting odds of more buying in the USD/JPY currency pair. The USD/JPY may exhibit further room for buying until 109.680, and violation of this can open more room for buying until 110.500 and 111.450. On the lower side, support continues to hold around 108.750. Let’s look for buying traders over 108.850 today.  

All the best for today!