Introduction
Contrary to the case of impulsive waves, corrections do not require a sequence of retracements. The confirmation of the corrective patterns depends on the lengths of waves A and B within the correction.

The validation of a corrective structure is defined in two stages. If both stages are verified, then the wave analyst will be sure that the corrective formation is correct. It should be noted that there is the possibility that only one of the two stages is validated; this does not limit that the pattern being valid.
Flats and Zigzag Patterns
Case 1 – Wave A is Larger than Wave B
In this case, the wave analyst must draw a trendline linking the origin of waves A and the end of B.
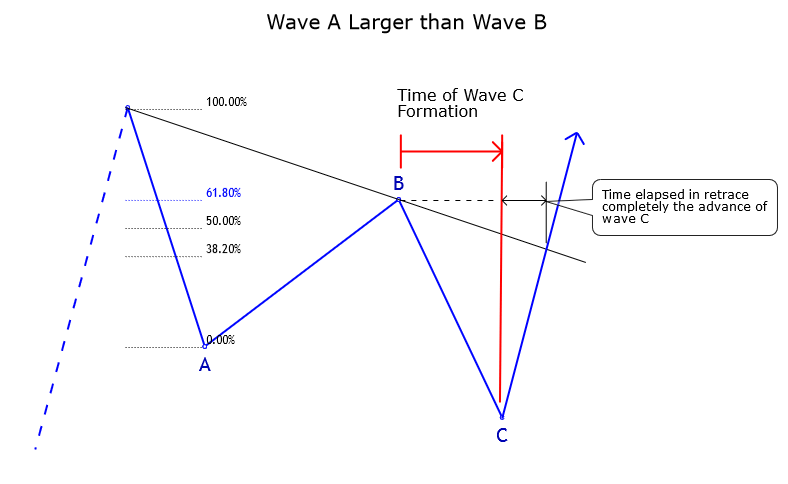
The first stage will verify the authenticity of the corrective formation if the price action violates the trendline O-B within a period equal to or less than the interval of wave C formation.
In case the time-lapse is longer, then the price action could be developing a terminal structure, or wave 4 of wave C could be incomplete, or the corrective pattern analyzed is not correct.
If the analyzed pattern is correct, then the second stage must be revised. In this stage, the wave analyst must study time lapsed in the complete retracement of wave C, which must be in a time equal to or less than the time spent in the formation of the wave C.
Case 2 – Wave B is Larger than Wave A
In this case, the first stage would fulfill if the wave C undergoes a complete reversal in the same or shorter time when the time lapsed in the wave C construction.
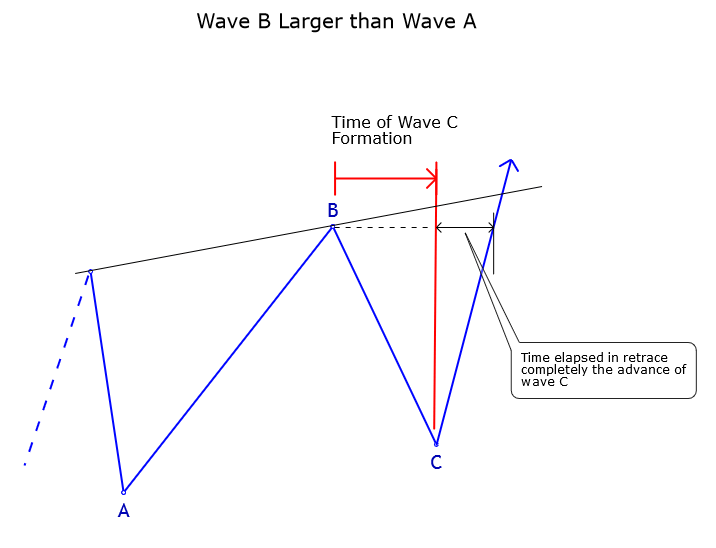
The second stage will fulfill if the price action exceeds the trendline O-B in a period less than or equal to the time that took the wave C formation.
Triangles
As we have seen in previous articles, there are two types of triangles, contracting and expanding. Unlike flat and zigzag patterns, where the first stage of validation consists of the violation of the trendline O-B, in the case of triangles, the trendline B-D violation is the one considered.
Contracting triangles are the easiest to validate after the violation of the trendline B-D. However, this does not happen in the same way in expanding triangles.
In expanding triangles, validation comes determined through the “no confirmation.” That is, once the wave E finishes, the price action should not reverse the advance of wave E completely.
Therefore, this retracement would discard out any possible violation of the guideline B-D, or it would take longer to reverse the advance of the wave E than the duration of the wave E.
Validation of a Contracting Triangle
As mentioned above, in the case of triangles, the guideline B-D is used instead of the line O-B. The first stage of validation of the contracting triangle pattern will occur if the price exceeds the line B-D for a period less than or equal to the time it took to construct the wave E.
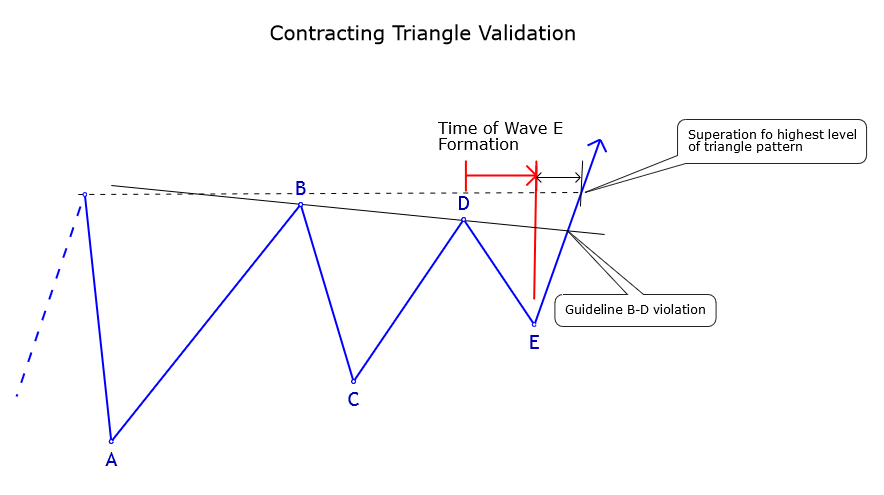
The second stage is defined by the thrust that occurs after the wave E in a triangle, which should exceed the highest (or lowest) price achieved by the triangle. In turn, the thrust should finish within a time range that not exceeding 50% of the duration of the triangle.
Conclusions
In this educational article, we have seen that the criteria for validation of corrective waves differ from impulsive waves in terms of the conditions to consider for a valid pattern.
Also, we reviewed the importance of validating each structure under analysis. That will help the wave analyst to verify if the pattern identified is correct or not.
This knowledge will allow the analyst to facilitate the realization of forecasts on the potential next movement of the market.
In the next educational article, we will review some key concepts for the process of analyzing waves such as wave compaction, degrees, and introduce the concept of complexity in the wave analysis.
Suggested Readings
- Neely, G.; Mastering Elliott Wave: Presenting the Neely Method; Windsor Books; 2nd Edition (1990).