
Introduction
As we commented in previous articles that cover the corrective structures, R.N. Elliott considers its study as a key to understand the current market situation and what to expect for the next path.

In this educational article, we expand the observations of the flat and the zigzag pattern.
Corrective Patterns in Action
In the first part of this four-part series, we commented that impulsive waves create trends. Corrective waves correct or retrace the progression of the trending movement developed by the motive waves. A corrective structure will never appear in a wave 1, 3, 5, in a wave A and C of a zigzag, and wave C of a flat pattern.
The Flat Pattern
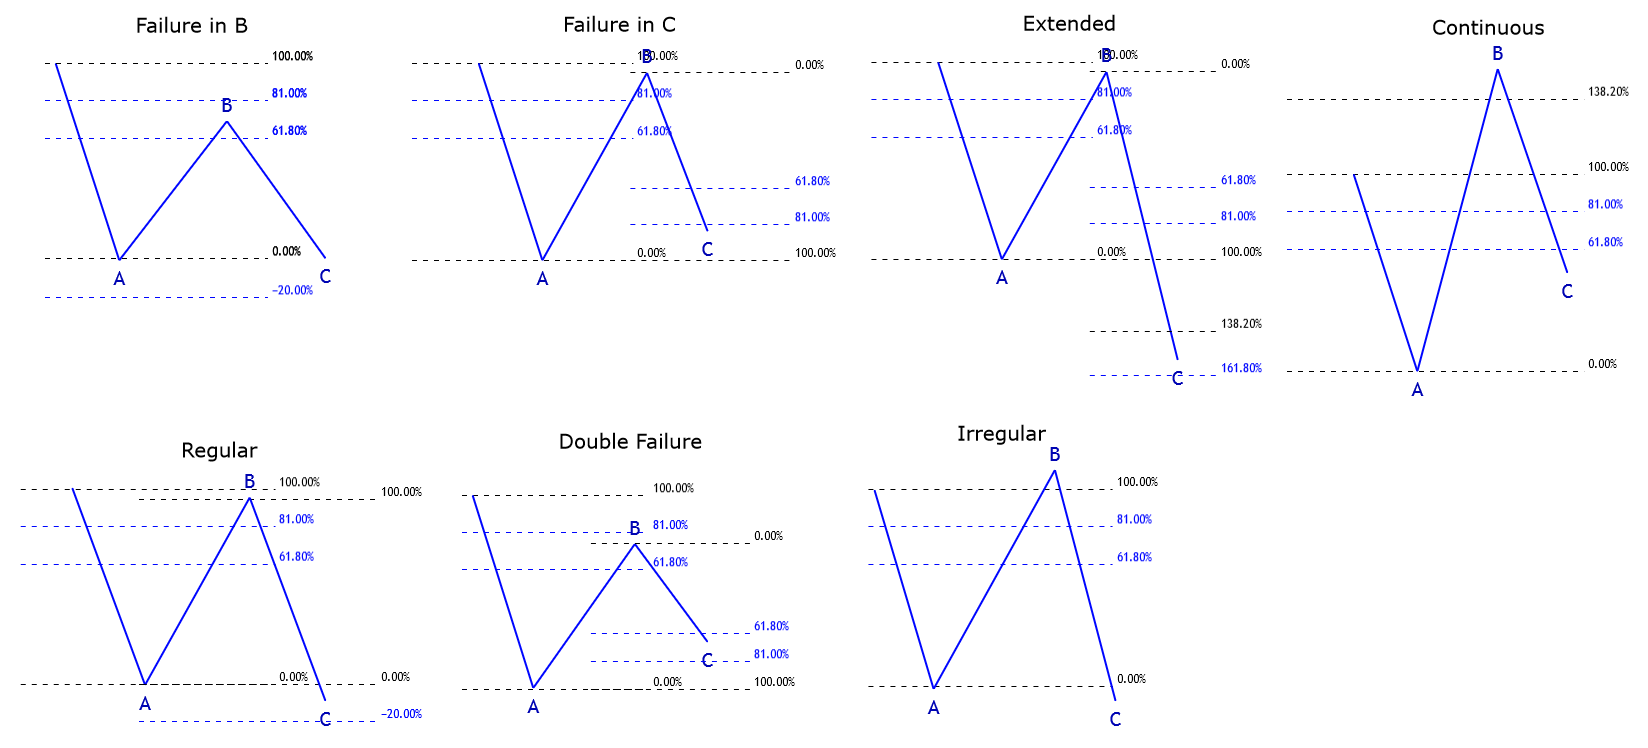
The flat pattern develops different variations depending on the strength of the trend or the level of complexity of the correction in progress. In its fundamental nature, the flat follows an internal sequence as 3-3-5.
On the other hand, variations in the flat pattern surge in the extensions of its waves B and C. In brief words, as wave B extends more than the 100% of wave A, wave C will tend to be short. And the lesser the retrace of wave A by wave B, the larger wave C will be.
- Failure in B. This case represents the scenario when wave B retrace between 61.8% and 81% the progress of wave A. If wave B extends beyond 81%, it means that the market is temporarily weak. Wave B will fail when the wave A be a double zigzag or a double combination. Wave C will tend to retrace the advance of wave B entirely. This variation could appear in waves 2, 4, A, B, or inside a horizontal triangle in its legs C, D, or E.
- Failure in C. This type of failure tends to occur when wave A experiences a complete or almost complete retracement made by wave B. When the price movement fails in wave C, the market shows a signal against the dominant trend. In this context, this pattern will appear in a terminal sequence. Wave C duration will be shorter than wave B and will show a similar duration than wave A. This variation could arise in waves 2, 4, A, B, or the wave 5 of a terminal impulsive wave.
- Regular. This formation is the typical flat pattern. Wave B retraces at least 81% of wave A, and wave C will advance wave B entirely. Also, this wave could extend between 10% and 20% beyond the end of wave A. In this variation, wave B will tend to be a complex structure, and its extension in time will be longer than waves A and C. The regular flat could rise in waves 2, 4, A, B, or in waves C, D, or E in a terminal impulsive wave.
- Double Failure. This scenario is infrequent; however, the double failure occurs when wave B to retrace beyond 81% of wave A, and wave C doesn’t extend beyond 100% of wave A. The double failure variation will look like a contracting triangle. Finally, this scenario will tend to appear in waves 2, 4, in wave A inside of a triangle or an irregular flat. When it happens in a wave B, it could belong to a zigzag, a regular on in an extended flat.
- Extended. This configuration occurs when wave C advance reaches between 138.2% or beyond 161.8% of wave B. Waves A and B must be similar in terms of price and time. This variation should tend to appear in waves 1, 3, or 5 as an impulsive terminal wave. In waves A, B, C, or D in a horizontal triangle, or wave E of an expanding triangle.
- Irregular. This is the most straightforward variation of the flat pattern. At the same time, it isn’t easy to find it in the real market. This pattern is indicative of the strength of the previous move. Wave B must be higher than wave A in price. Generally, wave C will be equal to wave A in price and time relation. This variation tends to appear in waves 2, 4, in wave B before the extended wave C of a flat, or as the wave B in a zigzag when wave C moves beyond 161.8% of wave A.
- Continuous. This correction is the most powerful variation of the flat pattern. This type of formation tends to imply volatile movements of the same degree. The continuous flat pattern tends to emerge in the second wave after an extended third wave. When it appears in the fourth wave, this variation could occur before a fifth extended wave. In a wave B, it surges before an extended wave C; in a triangle pattern, it could happen in the a-b-c series, or in a wave B of a zigzag that forms a triangle structure.
The following figure represents the seven flat pattern variations.
The Zigzag Pattern
The main difference between zigzag and flat pattern is that zigzag does not have a wide variety. The central aspect to take in consideration with the zigzag pattern is the extension of wave C compared with wave A, and the subdivisions number of wave C compared with wave A.
- Wave A. This wave must have an impulsive structure; this means that its internal structure must contain five segments. The A wave of a zigzag formation shouldn’t experience a retrace beyond 61.8% by wave B. If the wave B retraces beyond 61.8%, this could be indicative that the market is developing a complex correction as a double zigzag or a double combination.
- Wave B. This wave must show a corrective structure with three segments in its construction. As stated earlier, its progression should not go beyond 61.8% of wave A. This wave never will present a continuous correction. If this situation occurs, then the zigzag moves inside a triangle pattern. In this case, the zigzag will be the second wave of an impulsive sequence. Consequently, if this scenario occurs, then the wave B could not be a complex corrective structure as a double or triple zigzag, nor any other type of combination of corrective structures.
- Wave C. This part of the zigzag pattern contains five internal segments. Its extension could be from 61.8% to 161.8% of wave A.
Conclusions
In this educational article, we presented the variations of the flat pattern and the zigzag. These variations can provide a significative clue to the wave analyst respecting to the market situation and what to expect for the following sessions.
In the next educational article, corresponding to the third part of the advanced applications in wave analysis, we will present the variations in the triangle pattern.
Suggested Readings
-
-
- Neely, G.; Mastering Elliott Wave: Presenting the Neely Method; Windsor Books; 2nd Edition (1990).
-