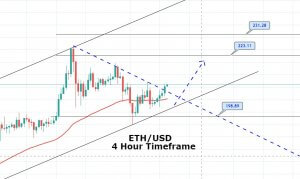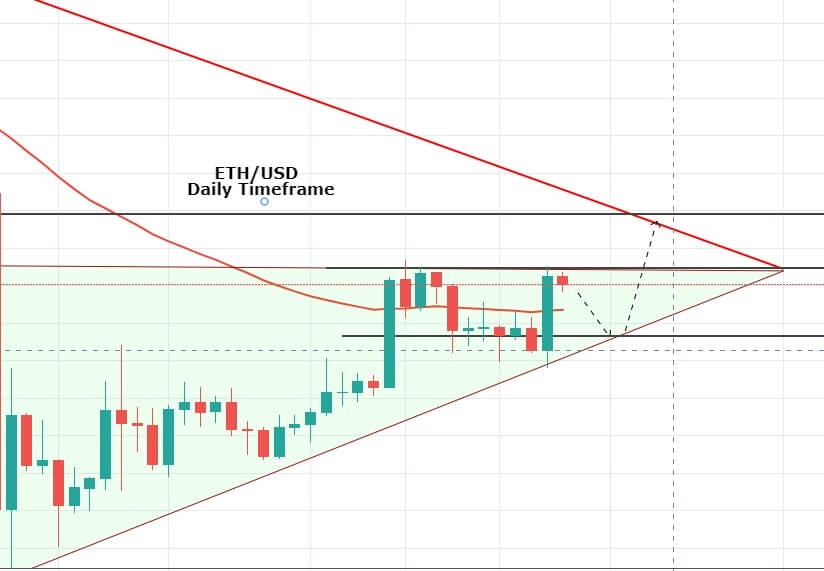
Yesterday on Thursday, the ETH/USD pair had exhibited dramatic bullish momentum on the daily timeframe, which leads Ethereum prices to soar to 174.68 resistance level. With this, the ETH/USD pair formed an ascending triangle pattern, which can be seen on the daily chart, and it is extending substantial resistance around 174.68 along with support at 164.
The support level of 164 is extended bu the 50 periods EMA which is suggesting chances of a bullish trend continuation on the Ethereum while the MACD is also suggesting chances of a bullish trend continuation in the market.
The recent bullish engulfing candle on the daily chart, formed on Thursday, is supporting odds of bullish trend continuation, therefore, the idea will be to place a buy stop above 177.16 with a stop loss below 165.16 and take profit at 192.16.
Trading Plan Summary
Buy Stop: 177.16
Protective Stop: 165.16
Profit Target: 192.16
Risk/Reward Ratio: 1.25