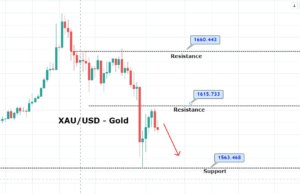
On Friday, the gold prices fell sharply from 1,724 level to 1,682 level as the demand for safe have assets faded after headlines from STAT news that Gilead Sciences experimental drug witnessed the fast recoveries in fever and respiratory symptoms which are linked with the coronavirus.
Finally, there is something positive from COVID 19 viewpoint, and it helped reduce the chaos in the market, driving risk-on sentiment. As in result, the market’s risk-tone remains upbeat and supports the U.S. 10-year treasury yields to improve further and to erase the previous day’s losses, currently near 0.67%.
Whereas, the U.S. dollar continues to lose its buying momentum across the board, as the U.S. stocks futures and the Asian equities are reporting green mainly after the renewed hopes for coronavirus treatment. Thus, this extends bearish pressure for precious metal gold.
On the other hand, the economic event from China, the world’s second-largest economy, had shown a decline in GDP. Chinese economy contracted 6.8% in the quarter year-on-year, slightly more than expected, and 9.8% from the previous quarter, driving selling bias for the gold.
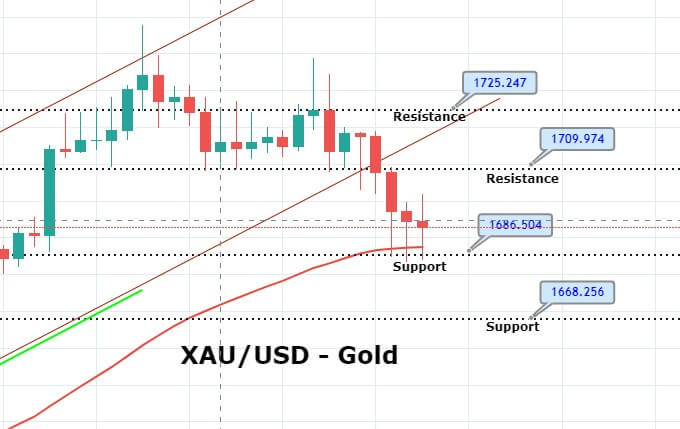
Technically, gold has violated the upward channel, and now it’s trading above 1,685 area. At the same price, the 50 periods EMA is proving it support, and gold has also closed a Doji candle followed by a hammer pattern, which can be seen on the 4-hour chart above. This setup demonstrates that investors are respecting 1,685 support areas, and gold prices may bounce off above this level until the resistance level of 1,700 and 1,709. In contrast, a bearish breakout of 1,685 level can cause further sell-off until 1,668. Good luck!