Introduction
Crude Oil is the primary mineral from which the most widely used petroleum products like Diesel, Petrol (or Gasoline) are produced. For most countries, Oil is a primary energy source. Any decrease or increase in the global production of Crude Oil creates significant Oil market price volatility.
There are many countries whose primary source of revenue is from Crude Oil production alone. Hence, changes in the Crude Oil Production levels hurt the buyers due to raised Oil prices and the sellers due to decreased income. Thus, Crude Oil Production statistics are critical metrics to predict expenditures of Oil Consumers and revenues of Oil Exporters.
What is Crude Oil Production?
Crude Oil
It is a naturally occurring, hydrocarbon mineral, unrefined petroleum product inside Earth. It is dark yellow-black in texture, and, based on the region of extraction, it can have different impurities with it. It is a non-renewable energy source and hence is limited.
If the impurities are more, it is called Sour/Heavy Oil and is generally abundant and is not preferred much due to the additional refining costs that are associated with it. If the impurities are less, it is called Sweet/Light Oil and is the preferred one over the Heavy one and is naturally costlier than its counterpart. Refining of Crude Oil and boiling it distills away the impurities to give useful petroleum products like Petrol, Kerosene, Diesel, etc.
Crude Oil Production
It refers to the process of Oil extracted from the ground after the removal of impurities and inert matter. It consists of Crude Oil, Natural Gas Liquids (NGLs), and additives. It is measured in a thousand tonne of Oil equivalent (toe). The final products, like Gasoline, are measured in the number of barrels produced. One barrel is equivalent to 42 Gallons, or 159 Litres, or 35 Imperial Gallons. The leading Oil Producing countries are the United States, Saudi Arabia, and Russia.
Organization of the Petroleum Exporting Countries (OPEC)
It is an organization of 12-oil major producing countries that make up 46% of the world’s oil production. They regulate the price of fuel to sustain this non-renewable resource for an extended period. In the early 21st century, the advent of new technologies (mainly Hydrofracturing) has led to a boom in the U.S. Oil production numbers, decreasing the influence of OPEC.
How can the Crude Oil Production numbers be used for analysis?
Crude Oil production is susceptible to the following factors:
Political Tensions: Many of the countries sitting on top of Crude Oil reserves are victims of political unrest. Crude Oil supply is drastically affected by political turmoil and wars. Iran-Iraq War, the Persian Gulf wars, Arab Oil Embargo, etc. are some typical examples.
Weather Patterns: Storms and Hurricanes have always threatened Crude Oil deposits and shipments. Oil spillage due to bad sea-weathers is the worst. An example would be the Deepwater Horizon Oil Spill in 2010, where approximately 480 tonnes of Crude Oil was spilled into the Ocean. This type of incident spikes the Crude Oil prices as the supply is reduced.
Exploration and Production: Crude Oil is a non-renewable energy resource. It will be exhausted after a certain period. Exploring new regions for drilling and extraction involves huge costs. Set up of Production units is also a hefty investment
Investments & Innovation: Poor technology and lack of funds can negatively affect Crude Oil Production. The United States gained back its dominance in Crude Oil Production through the innovation of Hydrofracturing that dramatically increased its Crude Oil Production.
Demand: Demand motivates companies and governments to invest more in Crude Oil Production. As the world starts to switch to other resources, it is the demand that will primarily drive the supply of Crude Oil in the long run. Application is linked to population growth and reliance on Crude Oil as an energy source. As emerging economies increase Oil consumption while alternate energy sources are being developed, the current Oil consumption is set to stay steady and, if not, increase more for now.
Impact on Currency
Investors purchase mainly two types of Oil contracts:
Spot Contract: In this, the price of Oil reflects the current market price of Oil. Commodity Contracts in the Spot market are effective immediately, i.e., Money is exchanged, and Oil delivery starts right then.
Futures Contract: This is the more common form of Contracts purchased by traders, as they speculate the price of Crude Oil based on many factors and algorithms. They agree to pay a certain amount for Oil at a set future date. Companies dependent on Crude Oil use these contracts to hedge the risk of price volatility.
In Northern America, West Texas Intermediate (WTI) is the benchmark for Oil futures traded on New York Mercantile Exchange (NYMEX). In the Middle East, Europe, the reference is the North Sea Brent crude exchanged on the Intercontinental Exchange (ICE).
A decrease in Crude Oil Production leads to a rise in oil prices, which is terrible for the economy and currency. As fuels become expensive, currency value depreciates. It creates inflationary conditions within the economy. All Oil dependent industries like textile, chemical, medicine industries increase the cost of their end-products to compensate for the price increase. Gasoline, Petrol, and Other Crude Oil end-products become less affordable.
A sufficient supply of Crude Oil is necessary to keep inflation in check. Hence, it is a proportional indicator. Although the Crude Oil market is more volatile than currency and stock markets, large scale price changes reflect in the currency and stock values over a period. The effect on currency is dependent on the degree of dependence of the nation on Oil. The more dependency, the more the volatility in the currency. Typically, Major currencies do not see a change in values as dramatic as the Oil price.
Economic Reports
Investors, economists, and traders closely watch OPEC’s Monthly Oil Market Report (MOMR). It is released in the middle of the month for the previous month. The International Energy Agency (IEA) Oil Market Report released monthly is also widely used by many. IEA was formed in 1983, and since then, it has been the source for official government statistics from all OECD and few non-OECD countries.
The Weekly Petroleum Status Reports from the United States Energy Information is also a famous report to monitor Crude Oil Inventory levels. The American Petroleum Institute’s Weekly Statistical Bulletin (WSB) reports the United States and regional Crude inventories and data related to refinery operations.
Sources of Crude Oil Production
The Global Crude Oil Production and Trade statistics can be found in the sources provided below.
OPEC – MOMR | IEA – Oil Market Report
Enerdata – Crude Production | Crude Oil Production – OECD | EIA – Crude Oil Production
EIA Weekly Inventory Status Report | API WSB Report
Impact of the ”Crude Oil Production” news release on the price chart
Crude Oil Production plays a significant role in the economic growth of a country and in determining the rate of inflation. It is especially important for monetary policymakers and Central banks who decide on the interest rates based on oil production. The fundamental factors of demand and supply influence the rise and fall of oil prices. This Crude Oil Production has a direct impact on the oil price.
Low production of crude oil increases the price of Oil, which increases the cost of production and transportation. This increases the cost of goods and services in the country and has an adverse effect on the value of a currency. As Crude Oil Production is such an important news release, it creates a great impact on almost currency pairs, but predominantly more on the U.S. dollar pairs.

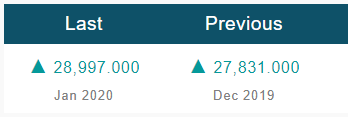
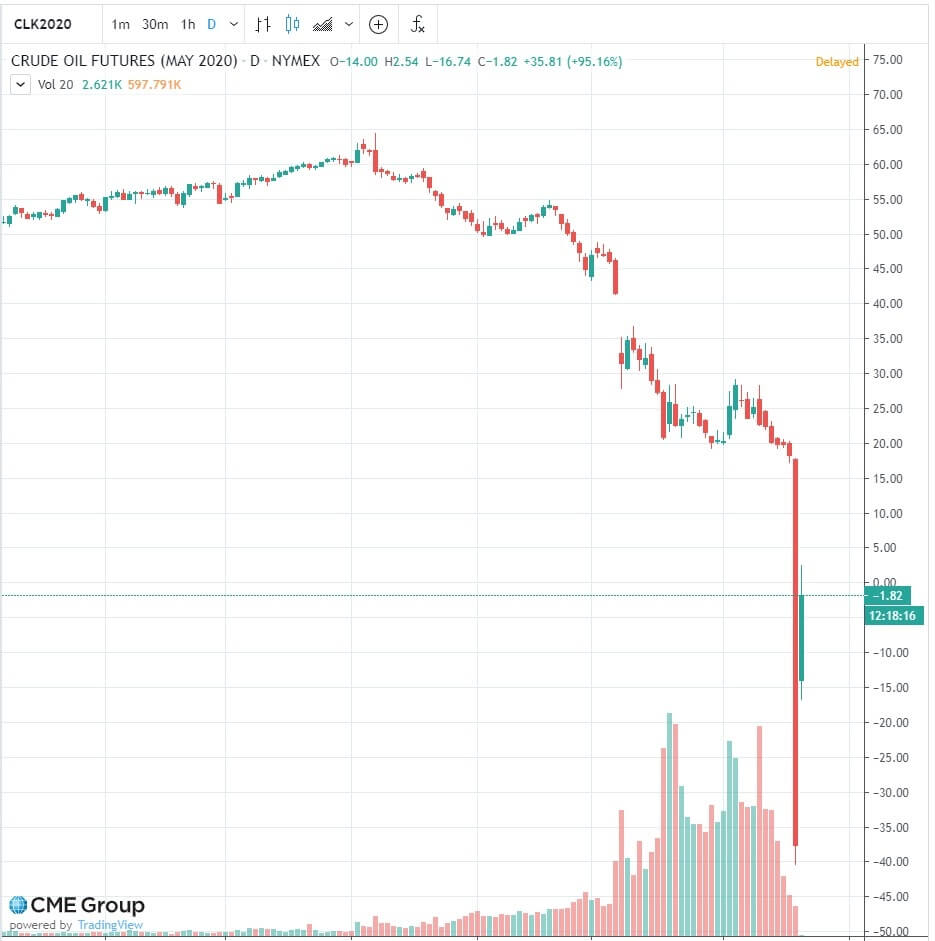
In today’s article, we will be analyzing the impact of Crude Oil Production in the Gulf, where the data is published by the Organisation of the Petroleum Exporting Countries, famously known as OPEC. The below image shows the quantity of Crude Oil Production in Barrels for the month of March.

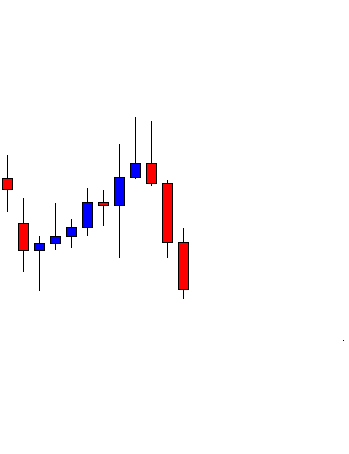
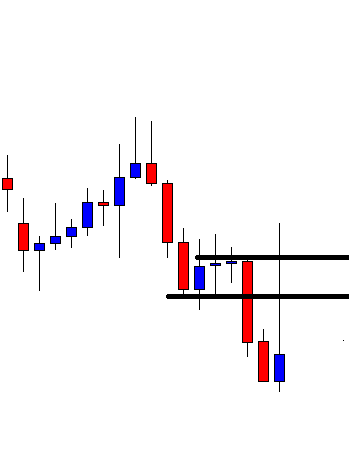
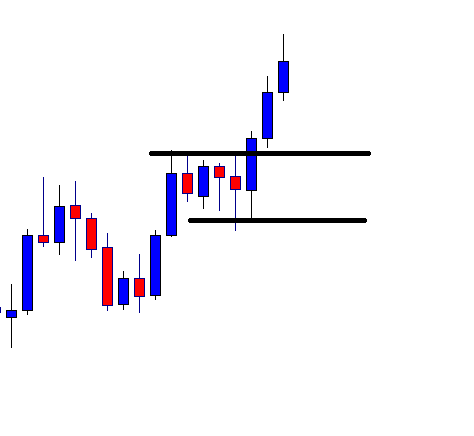
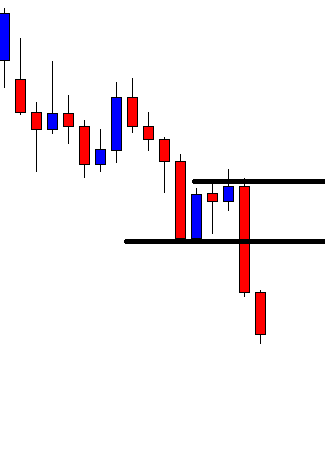
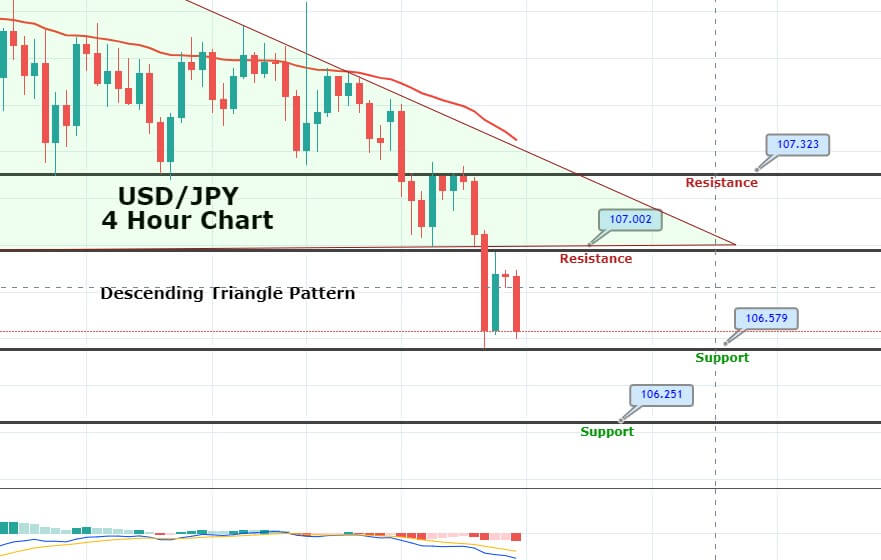
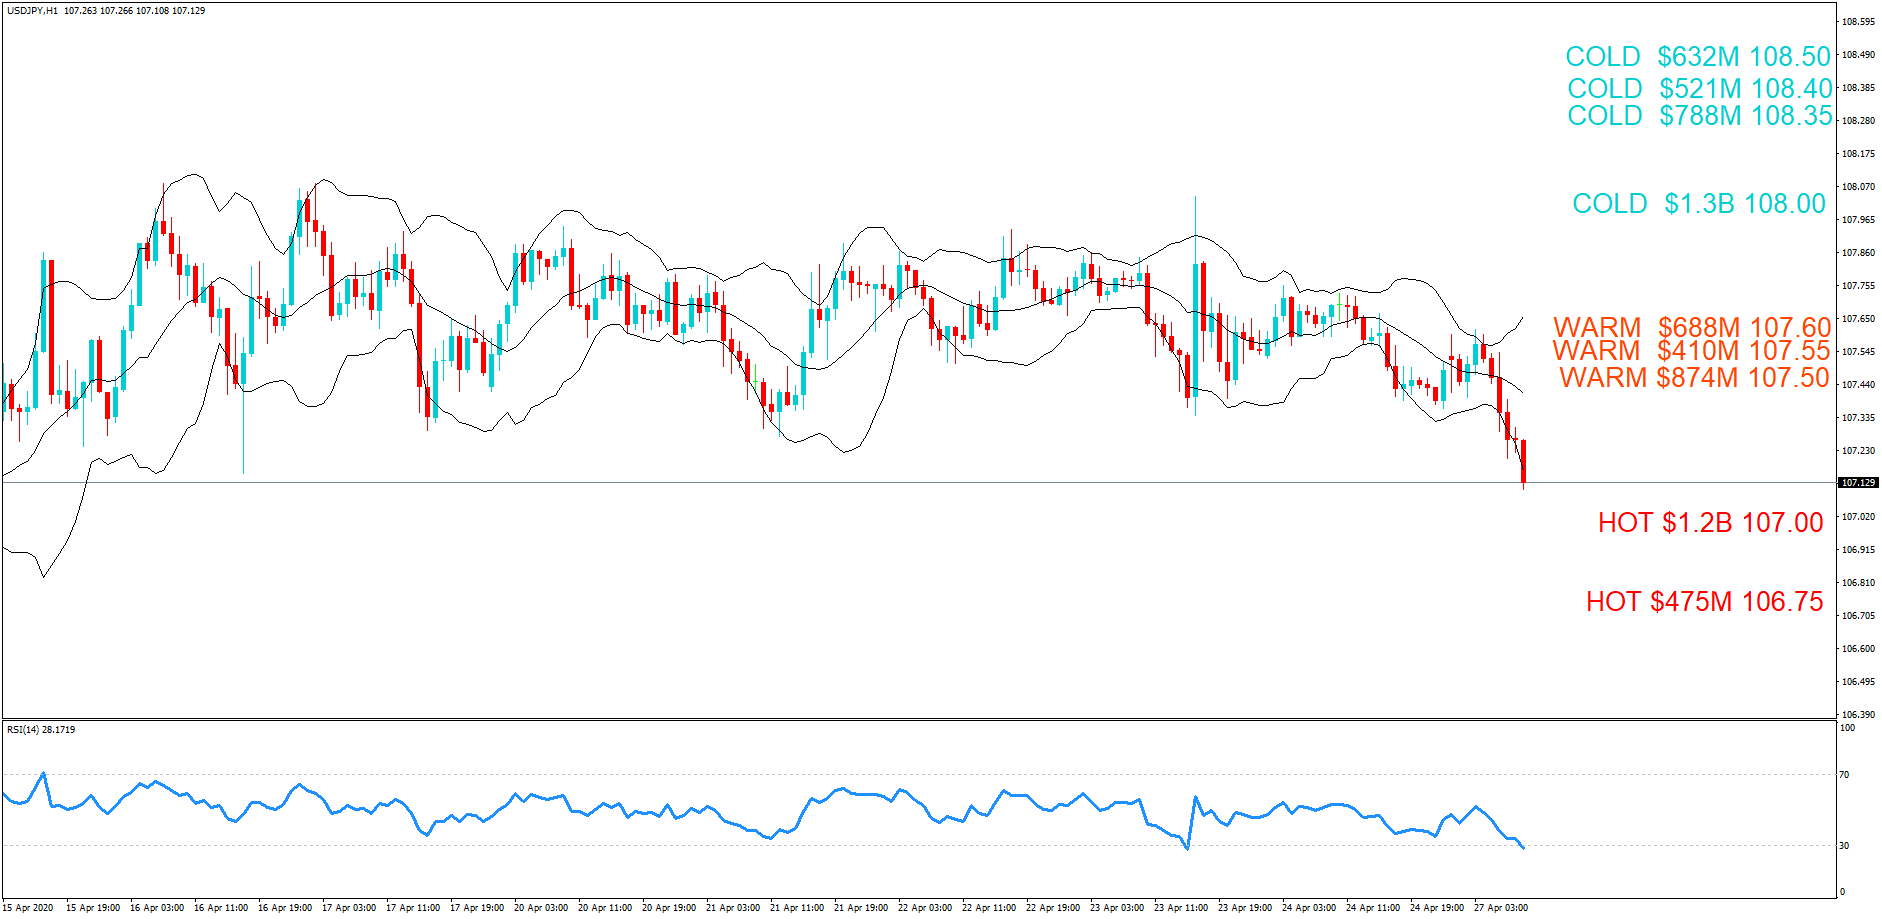
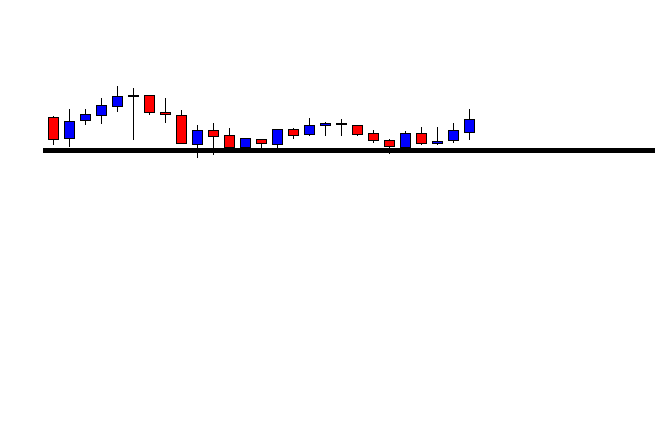
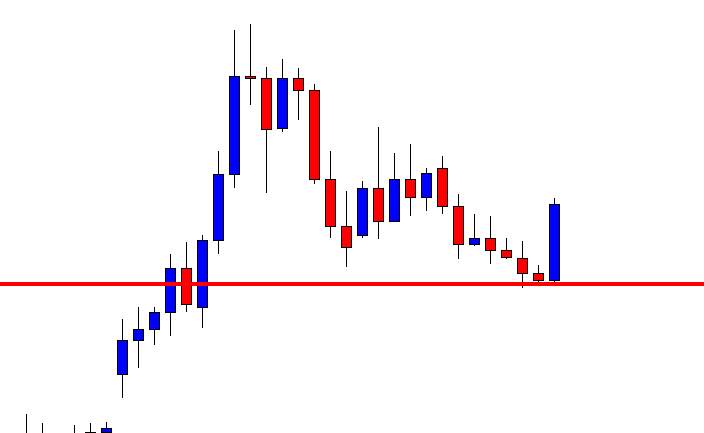
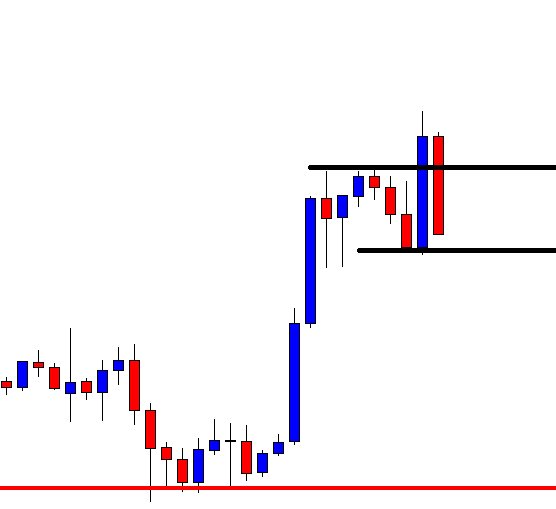
USD/JPY | Before The Announcement
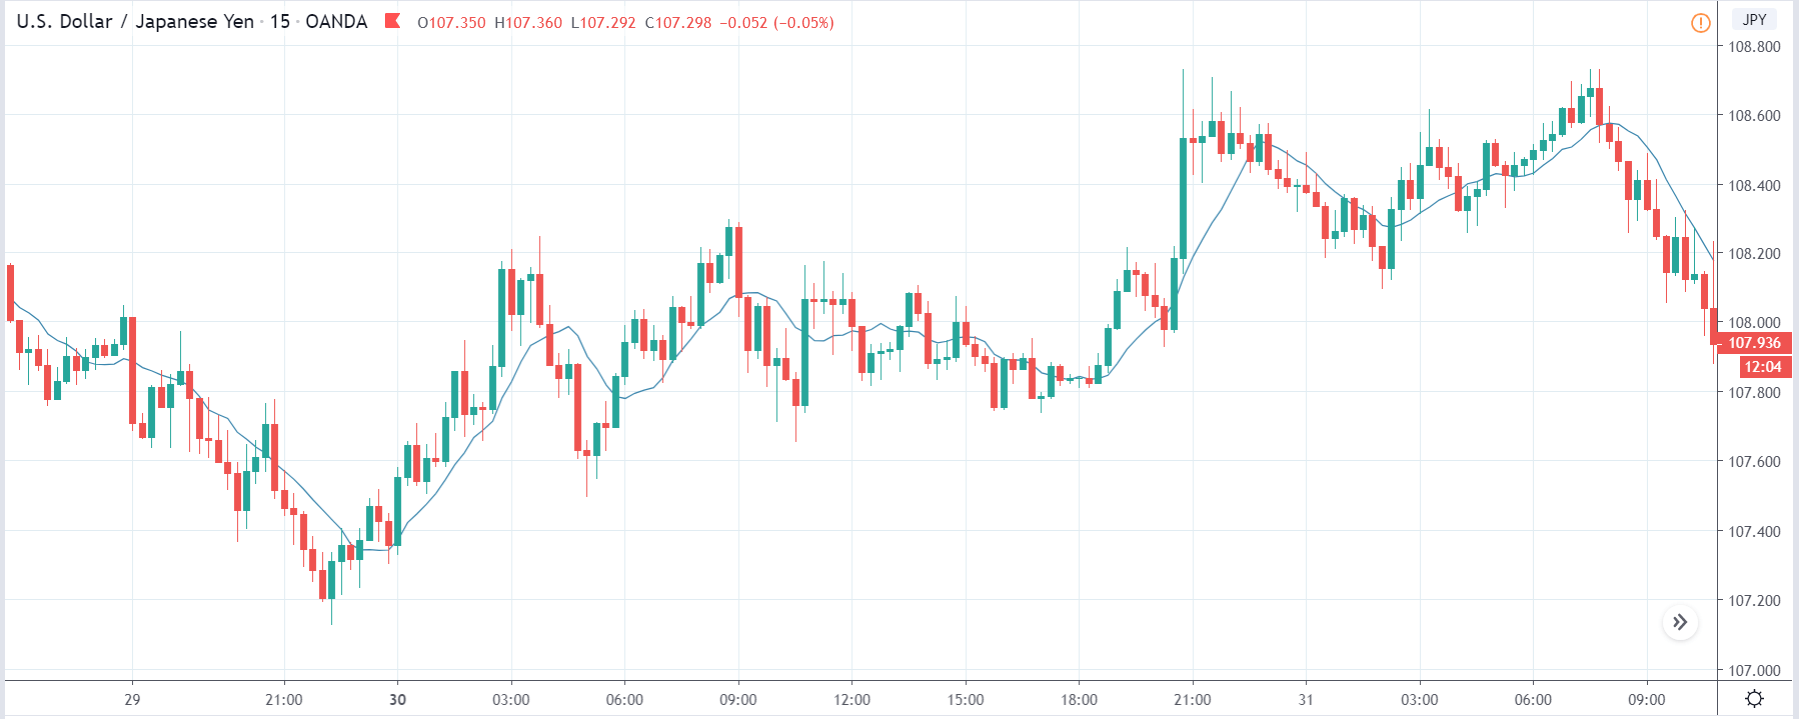
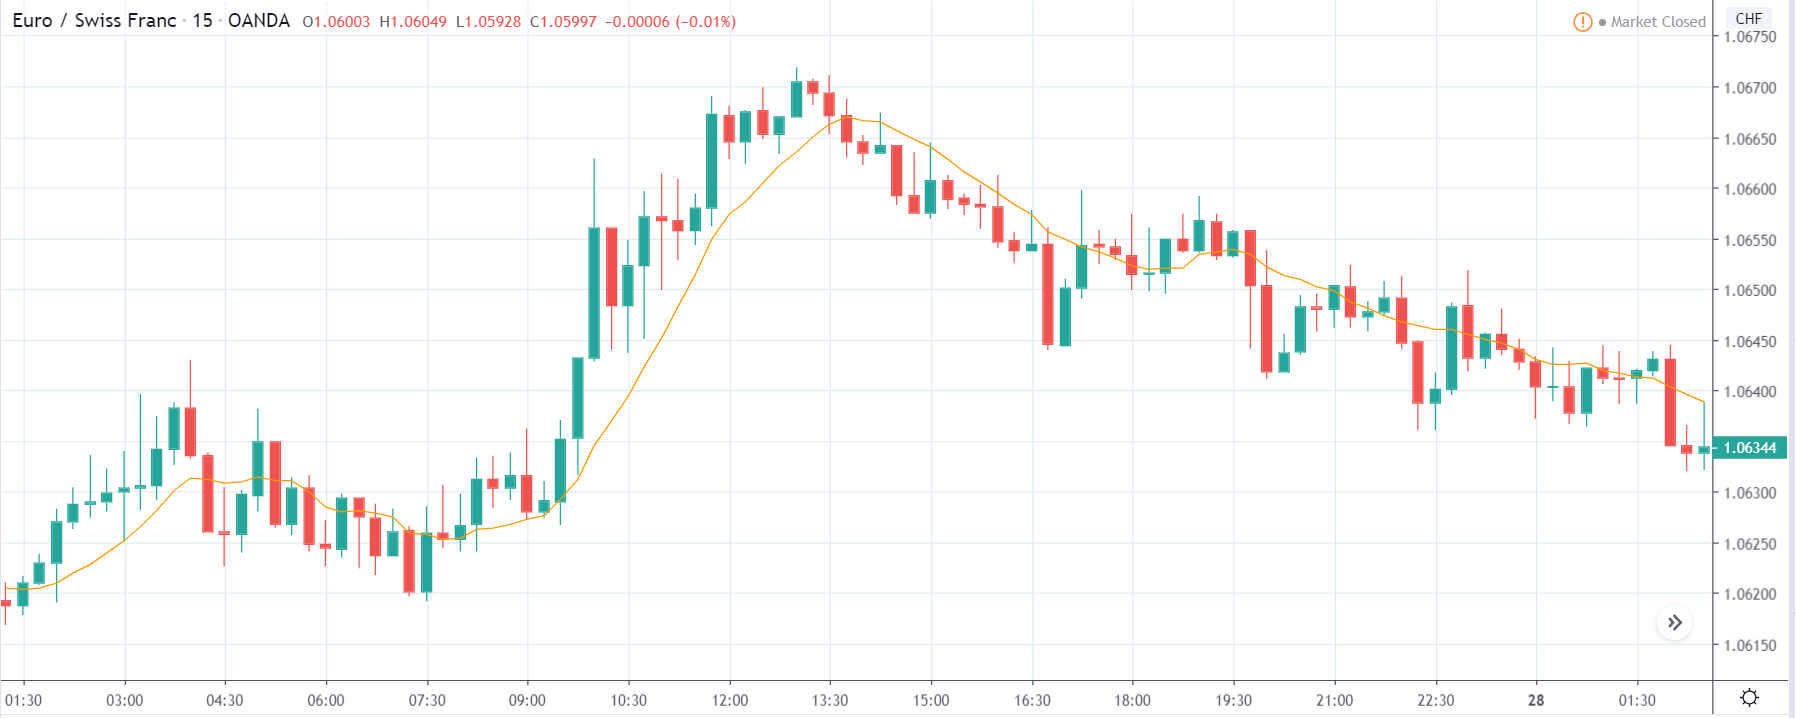
First, we shall analyze the USD/JPY currency pair, and the above image shows the state of the chart before the news announcement. Around three hours before the release, we see that the market is aggressively moving down, indicating a great amount of downward pressure. If we carefully observe, currently is at a place where this price was portraying as ‘support’ on the previous day. Therefore, we can expect ‘buying’ strength to come back into the market from this point.
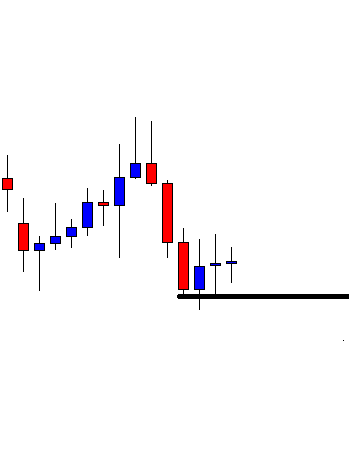
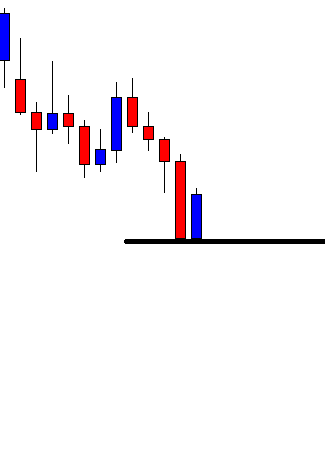
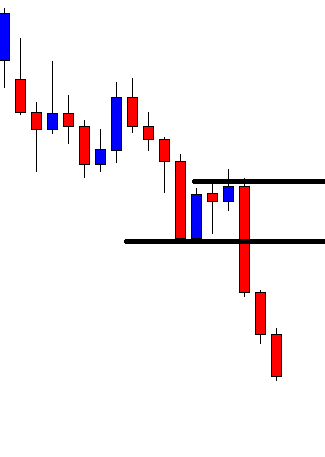
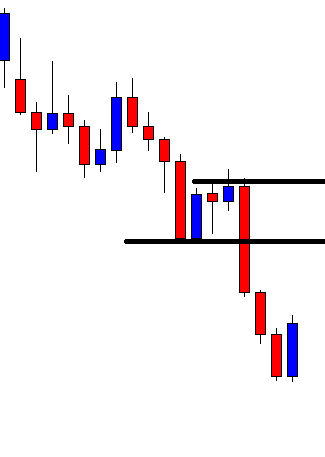
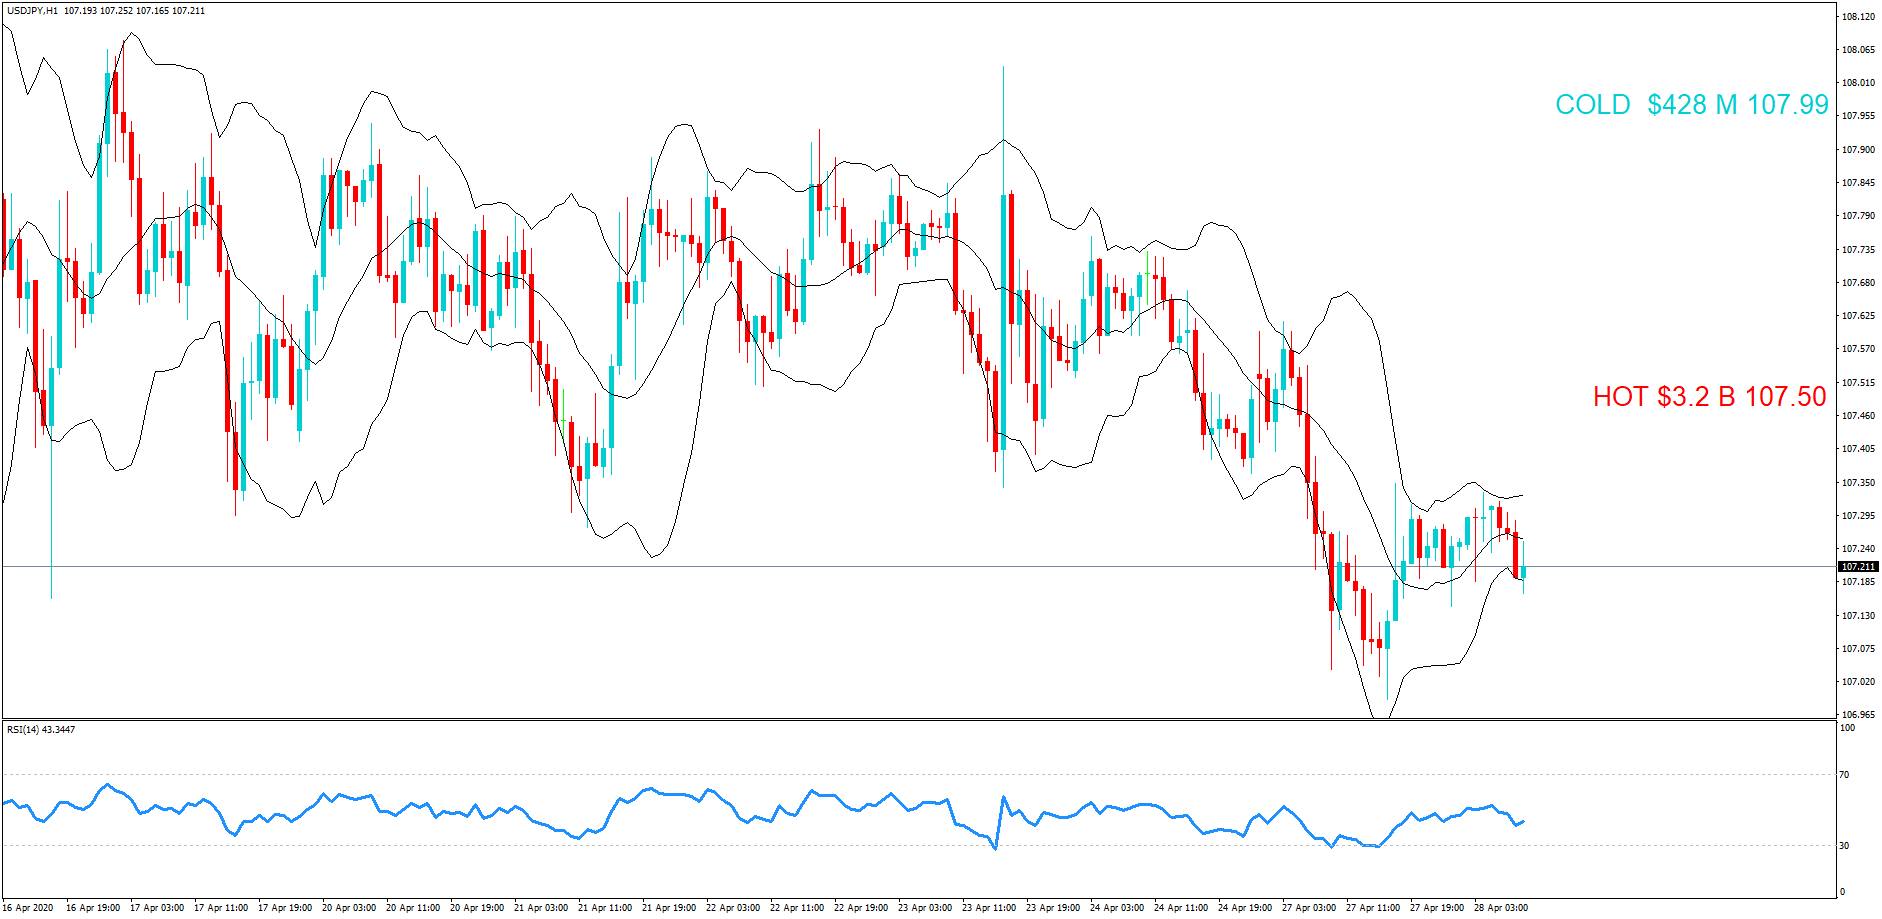
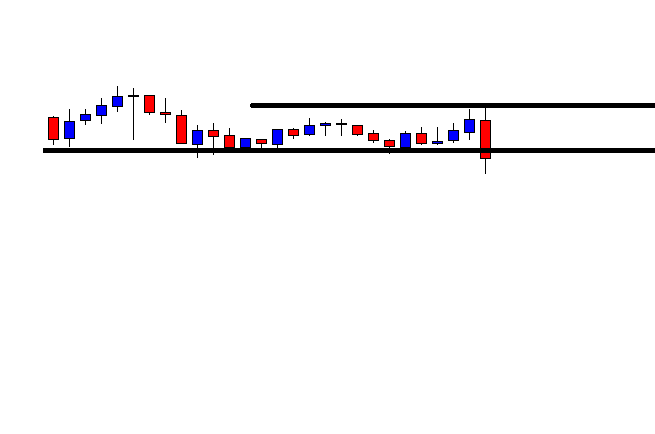
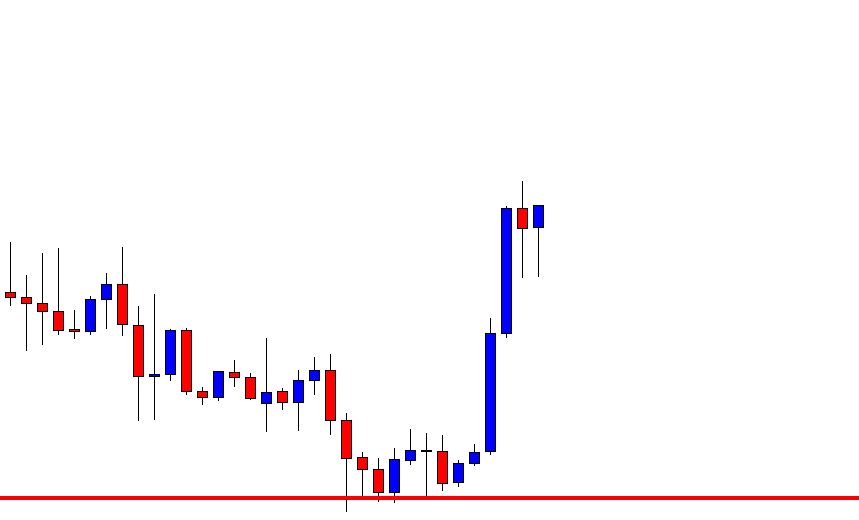
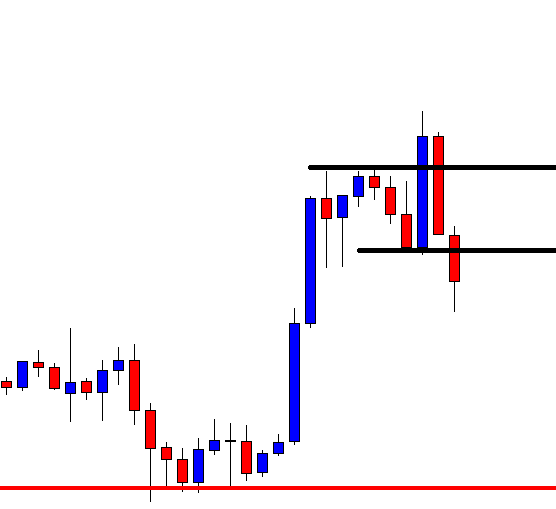
USD/JPY | After The Announcement
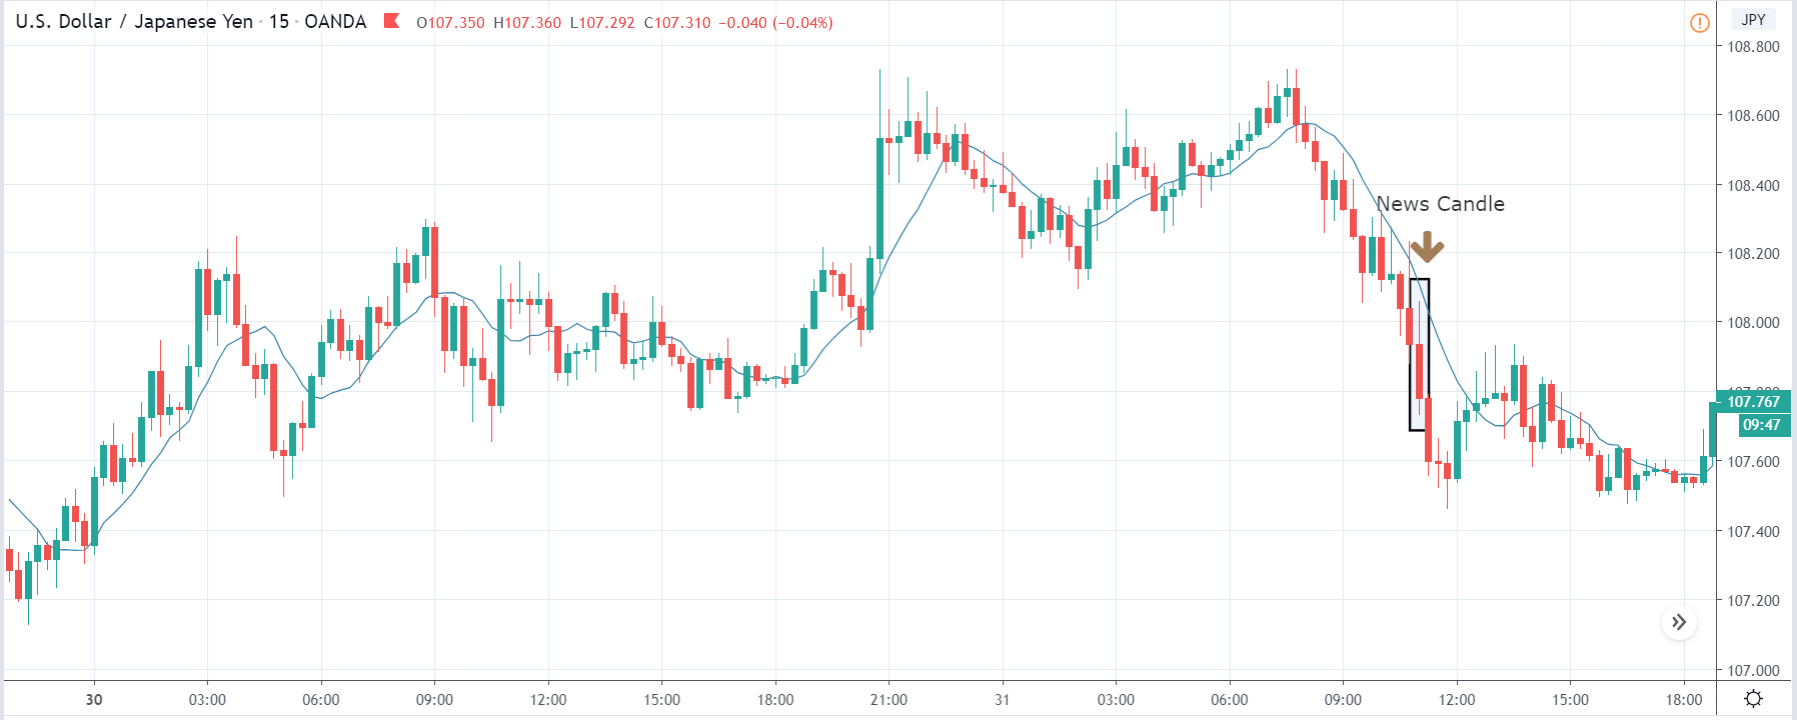
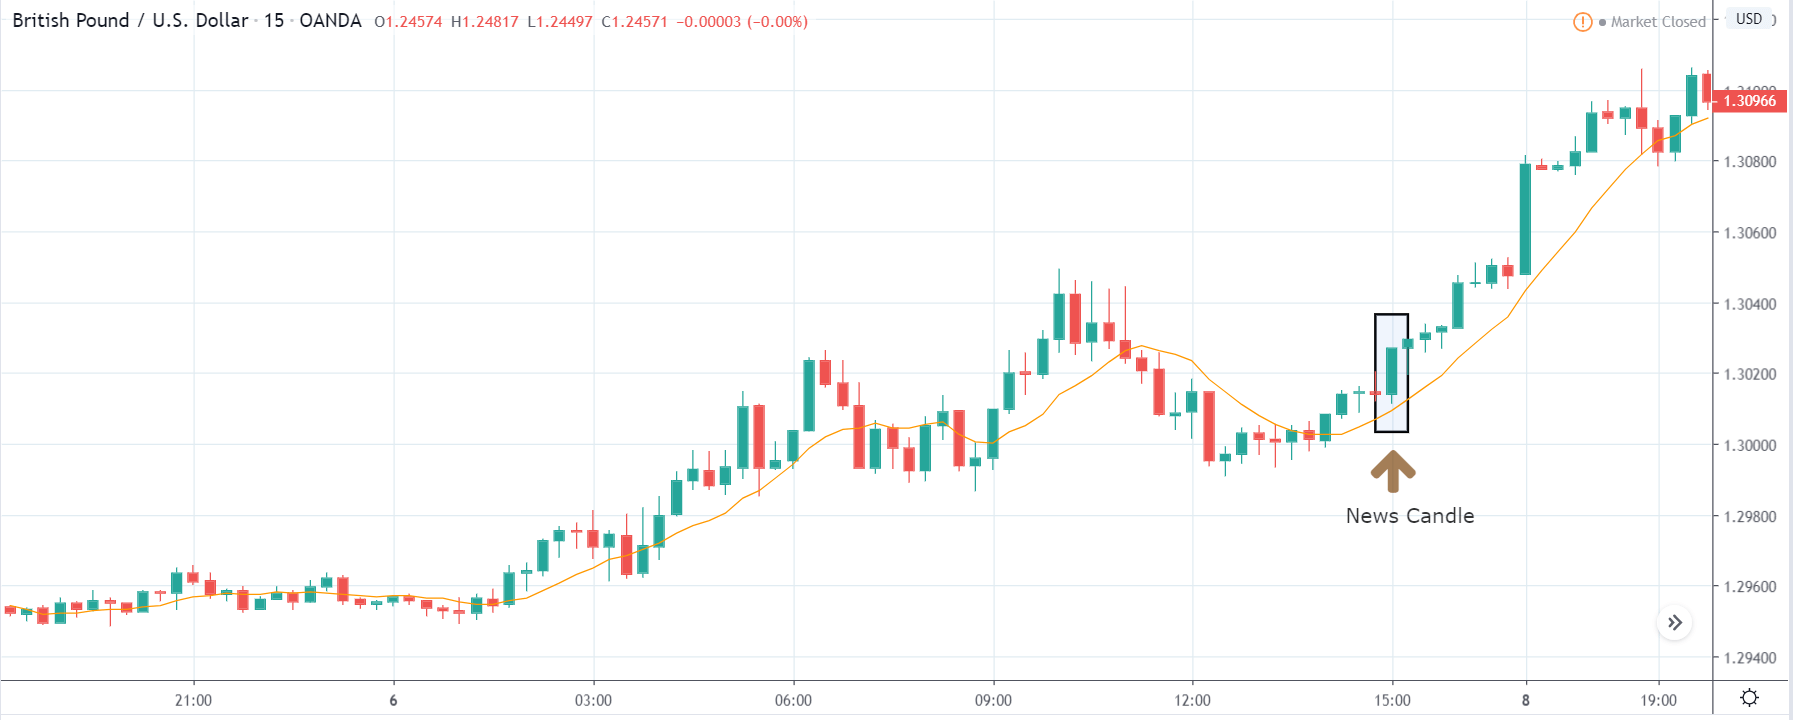
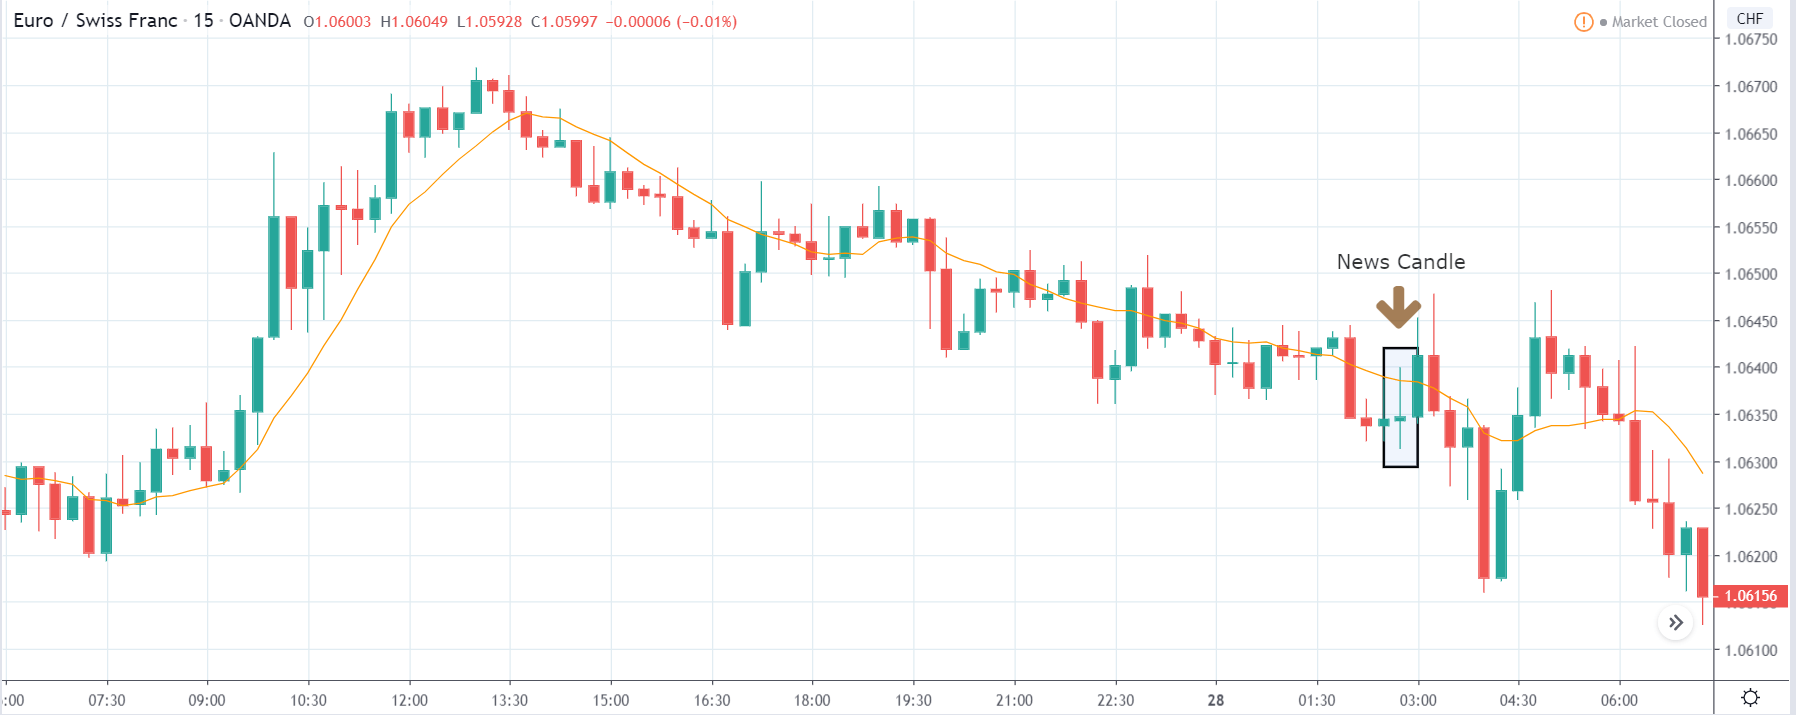
After the Crude Oil Production data is announced, the price falls drastically, and the ”news candle” closes as a strong bearish candle. The market reacted very negatively because the Crude Oil Production was lower as compared to the previous month. This impacted the U.S dollar adversely, and traders sold the currency, thereby increasing the volatility on the downside. As mentioned in the previous paragraph, since the price at the key ”support” level, taking a ”short” trade can prove to be risky at this point. It is safer to ”sell” after a suitable retracement.
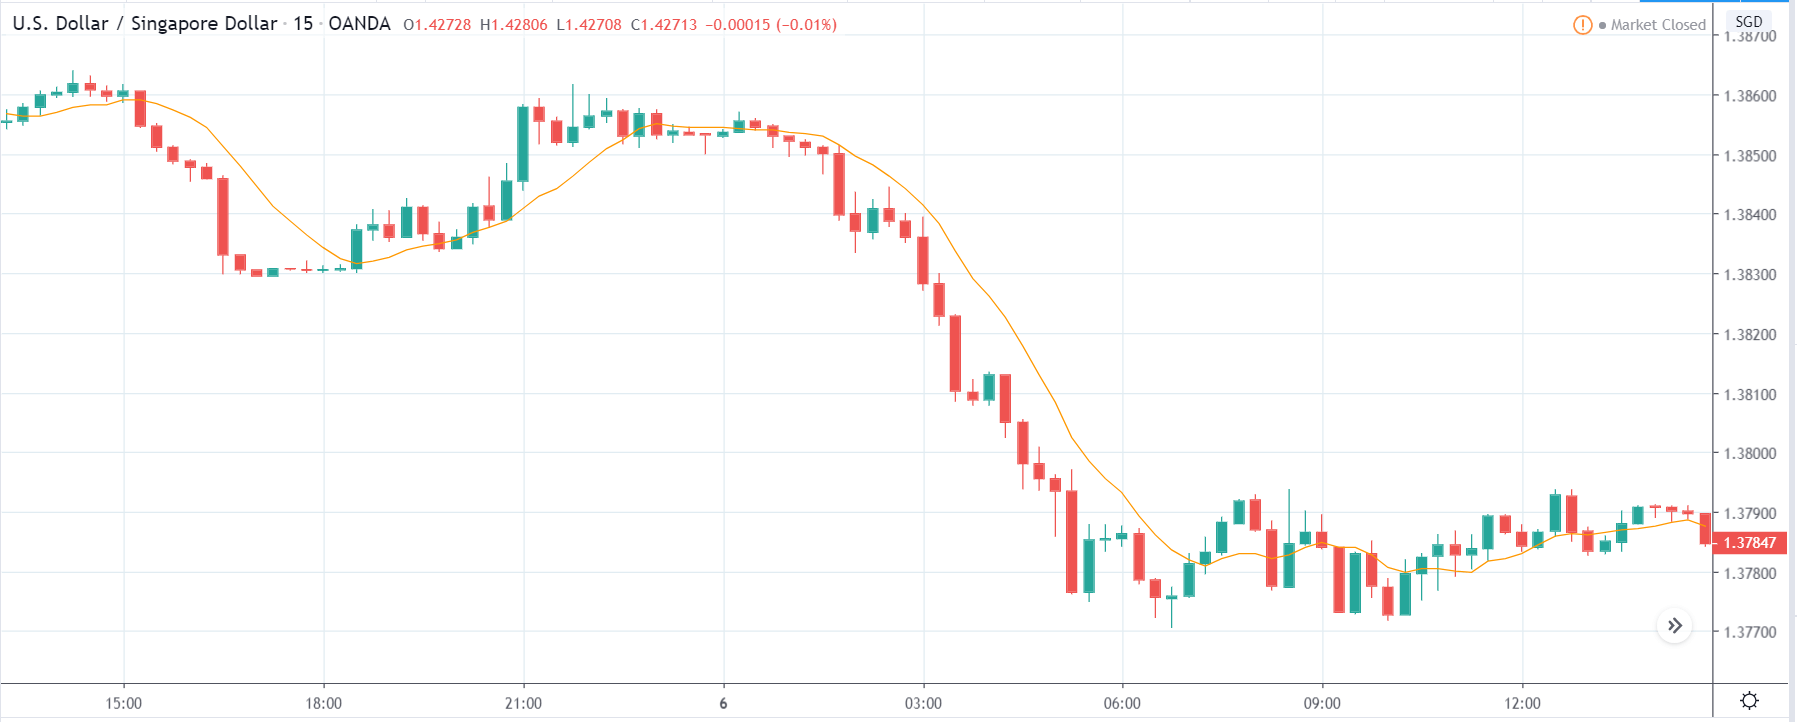
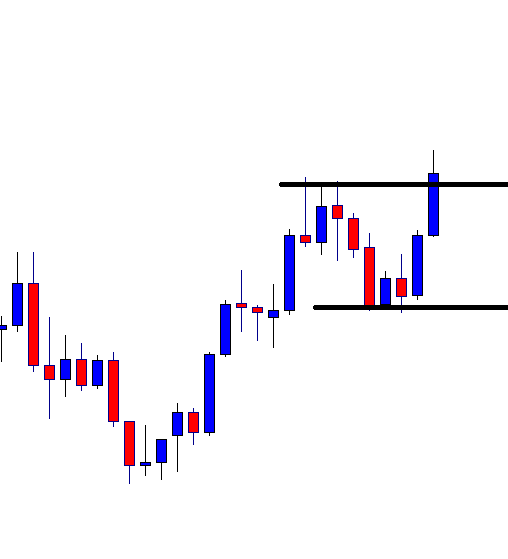
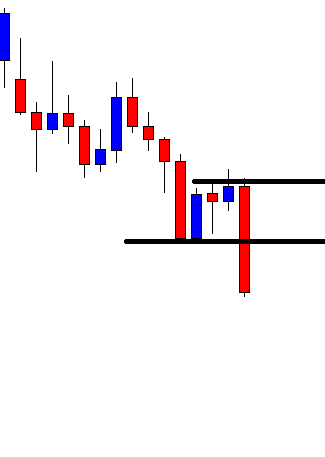
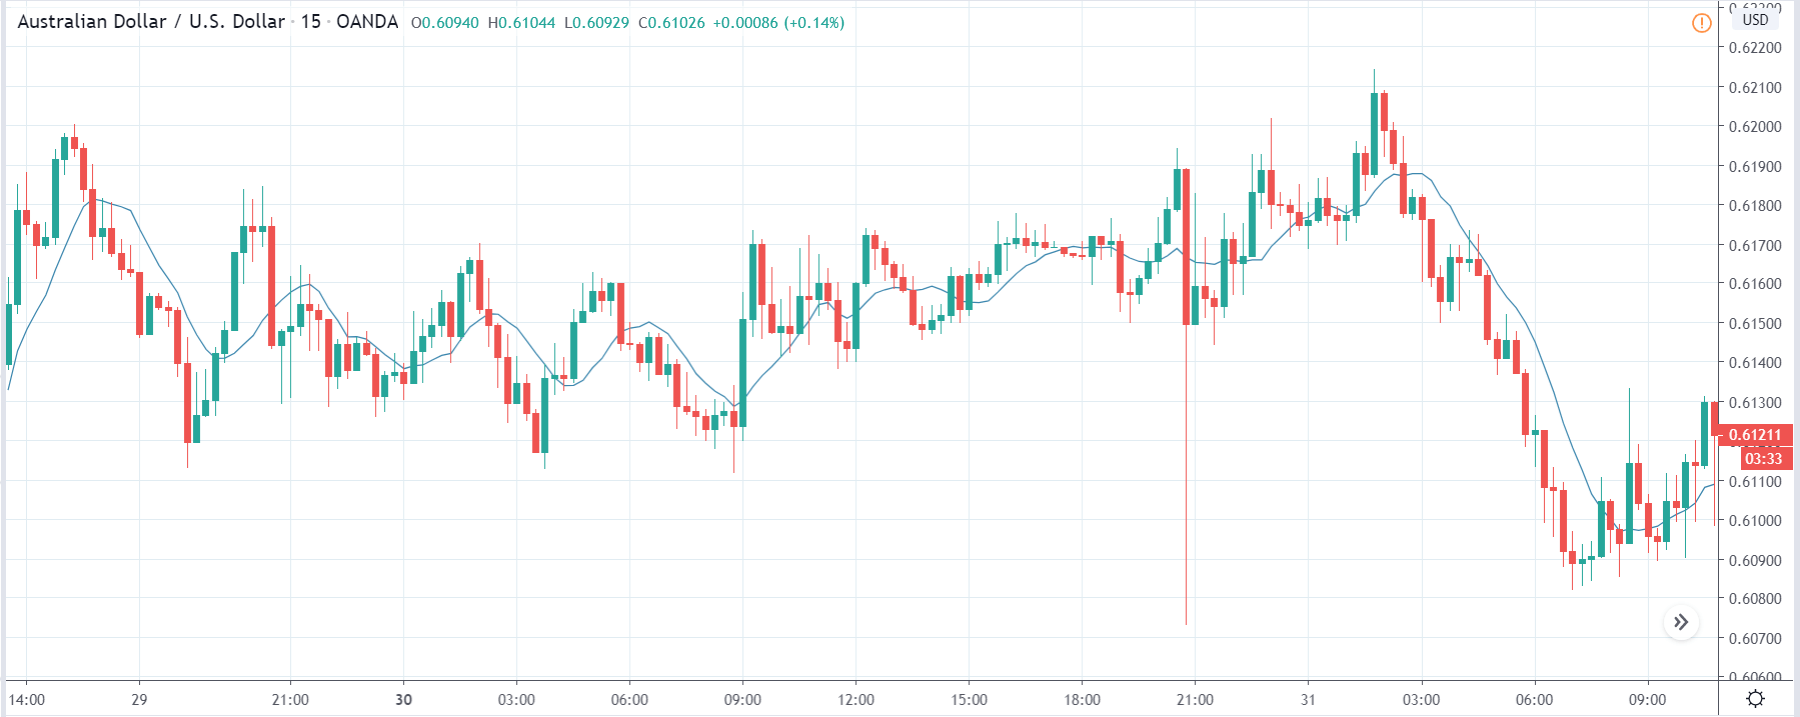
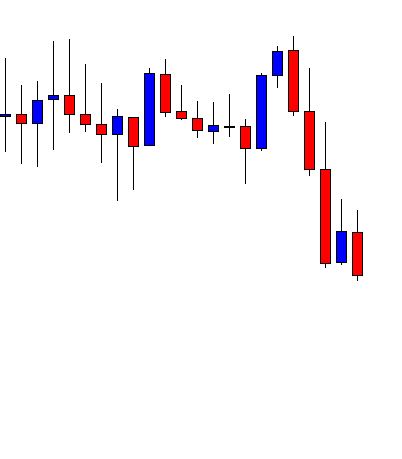
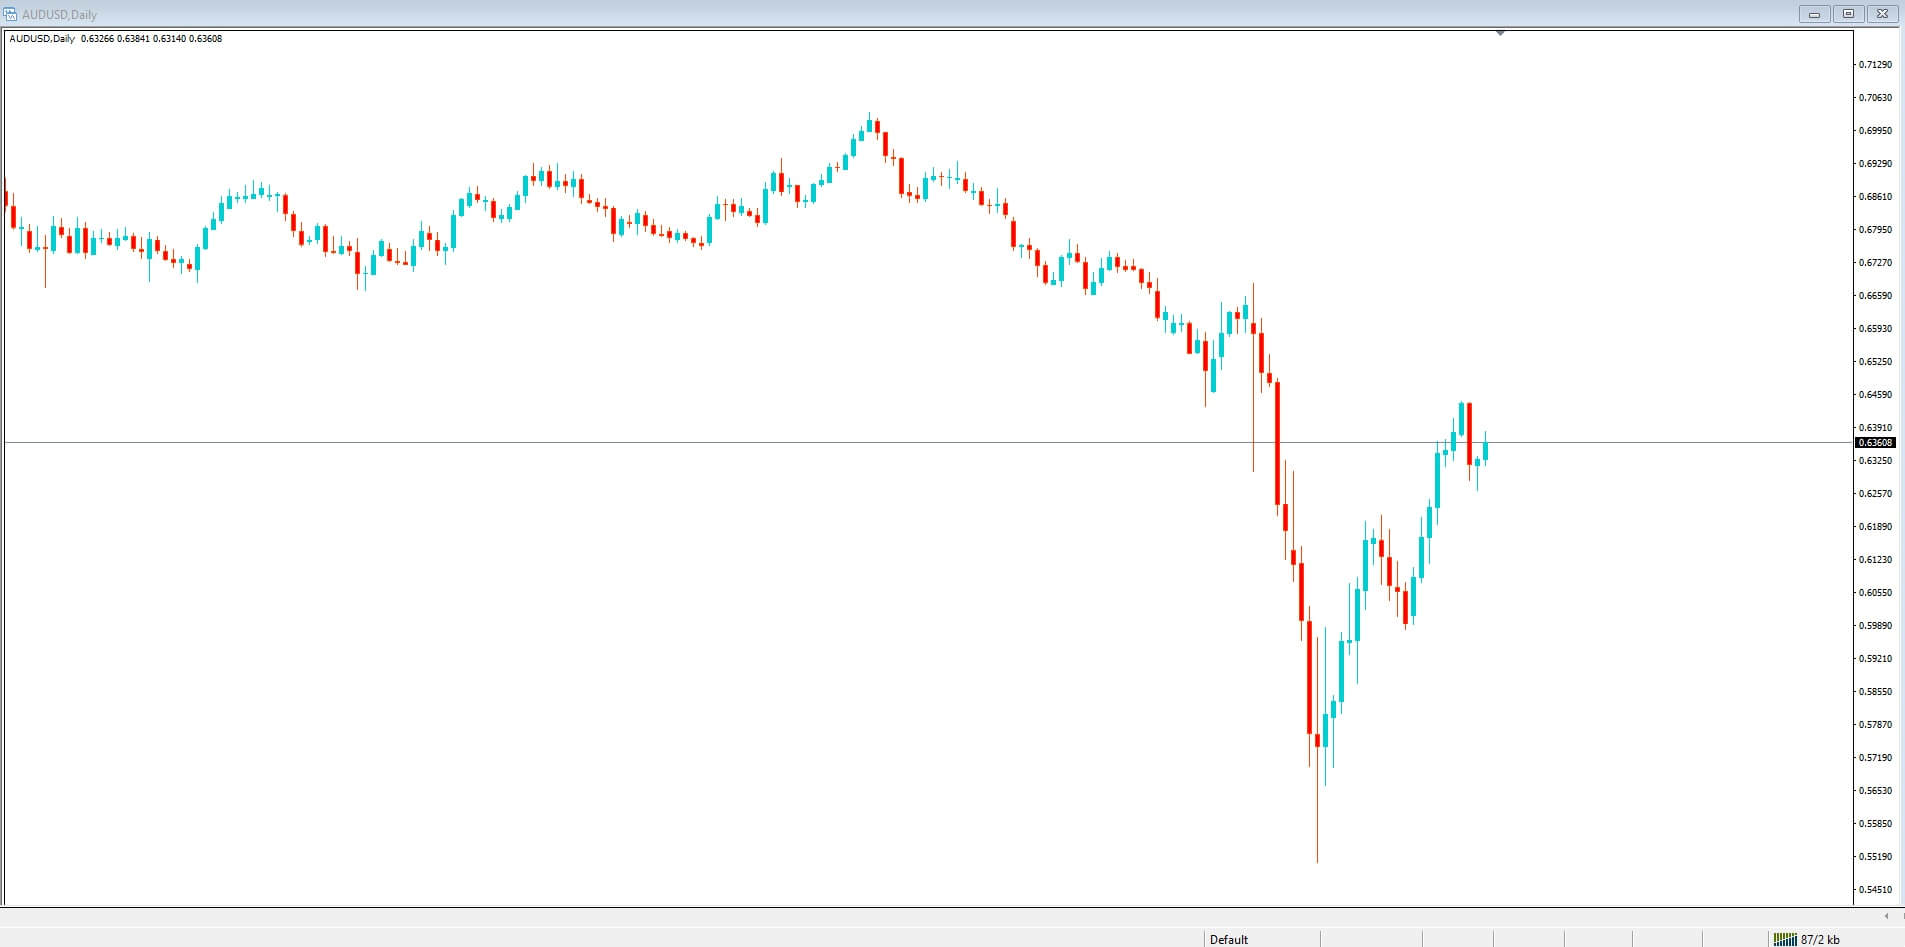
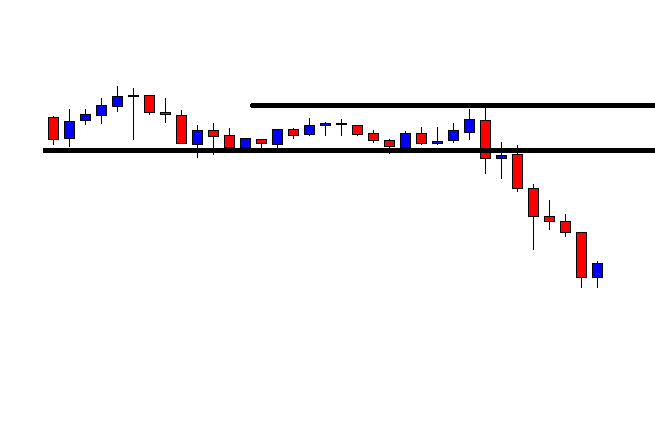
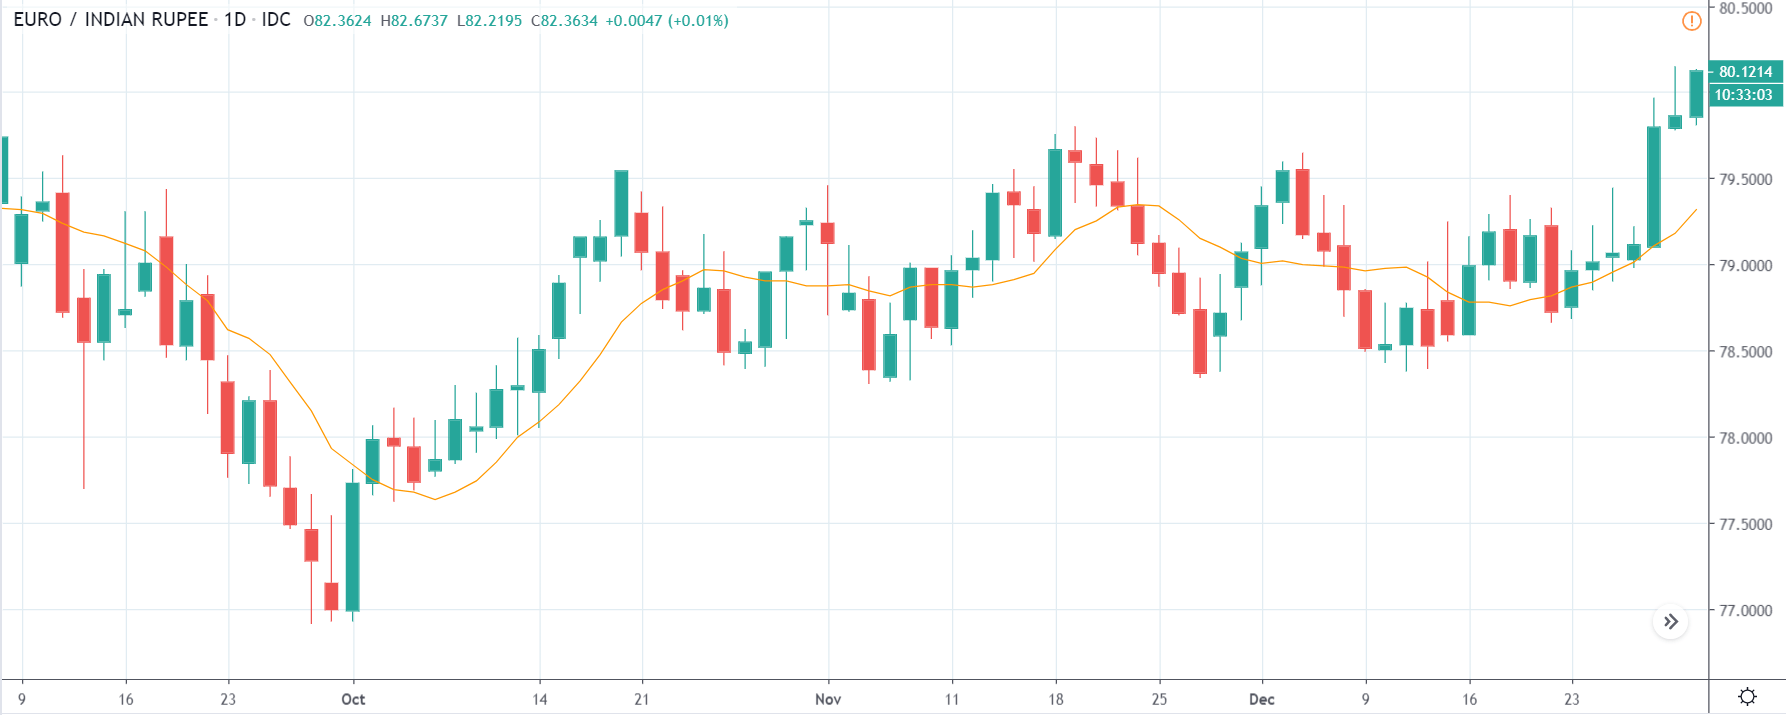
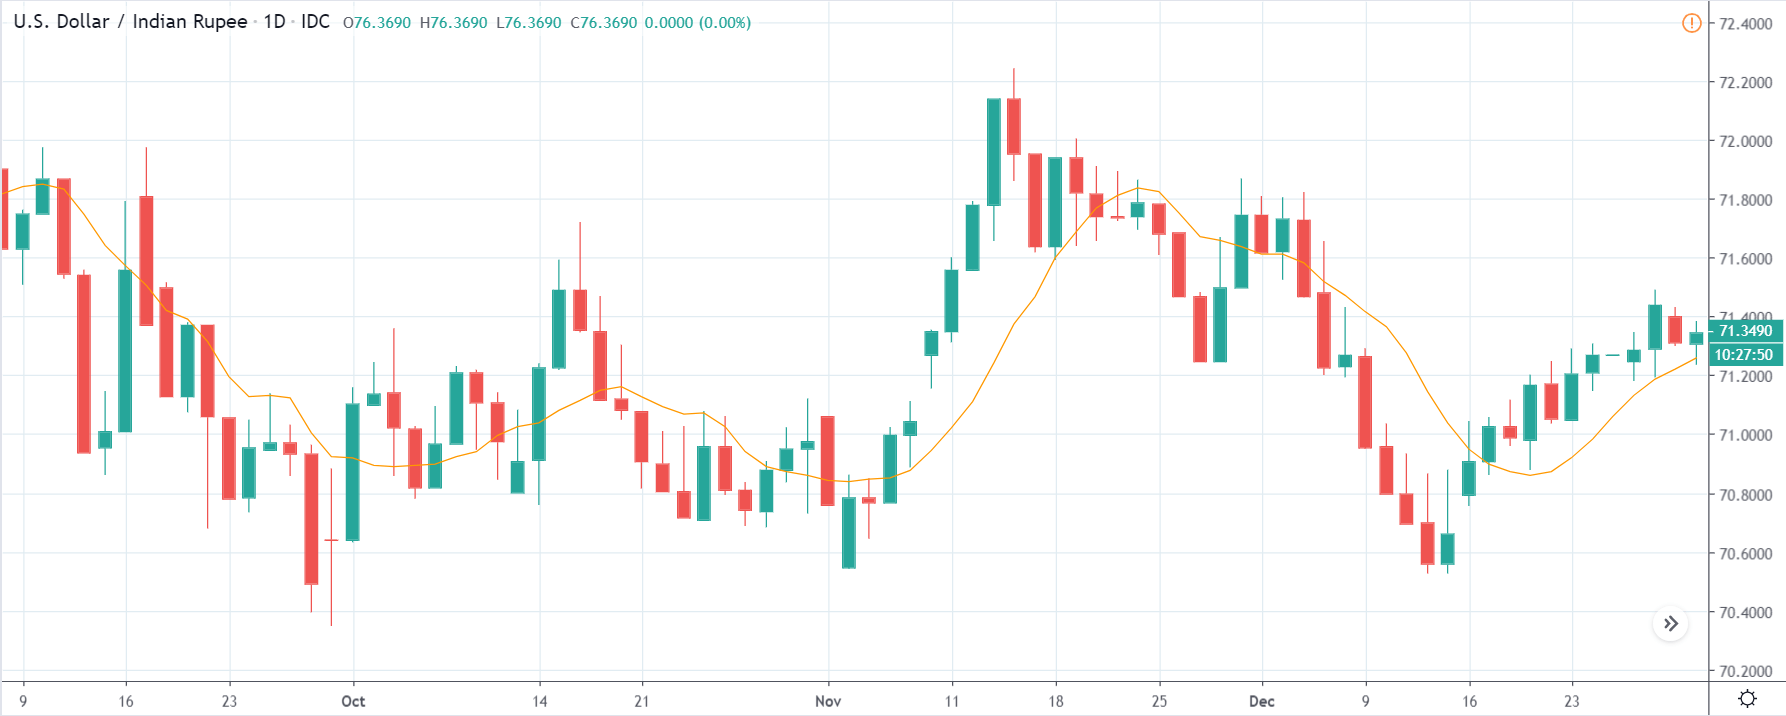
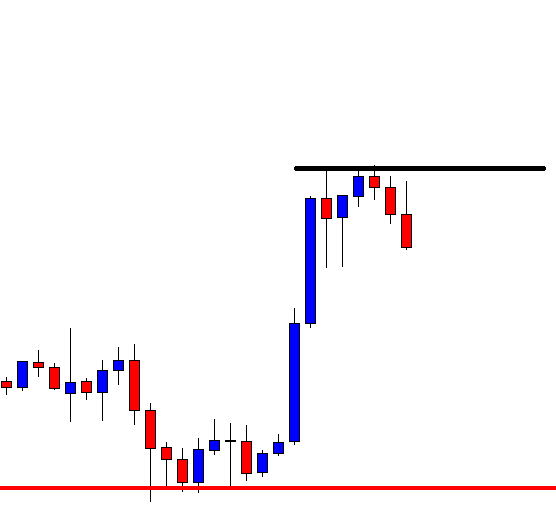
AUD/USD | Before The Announcement
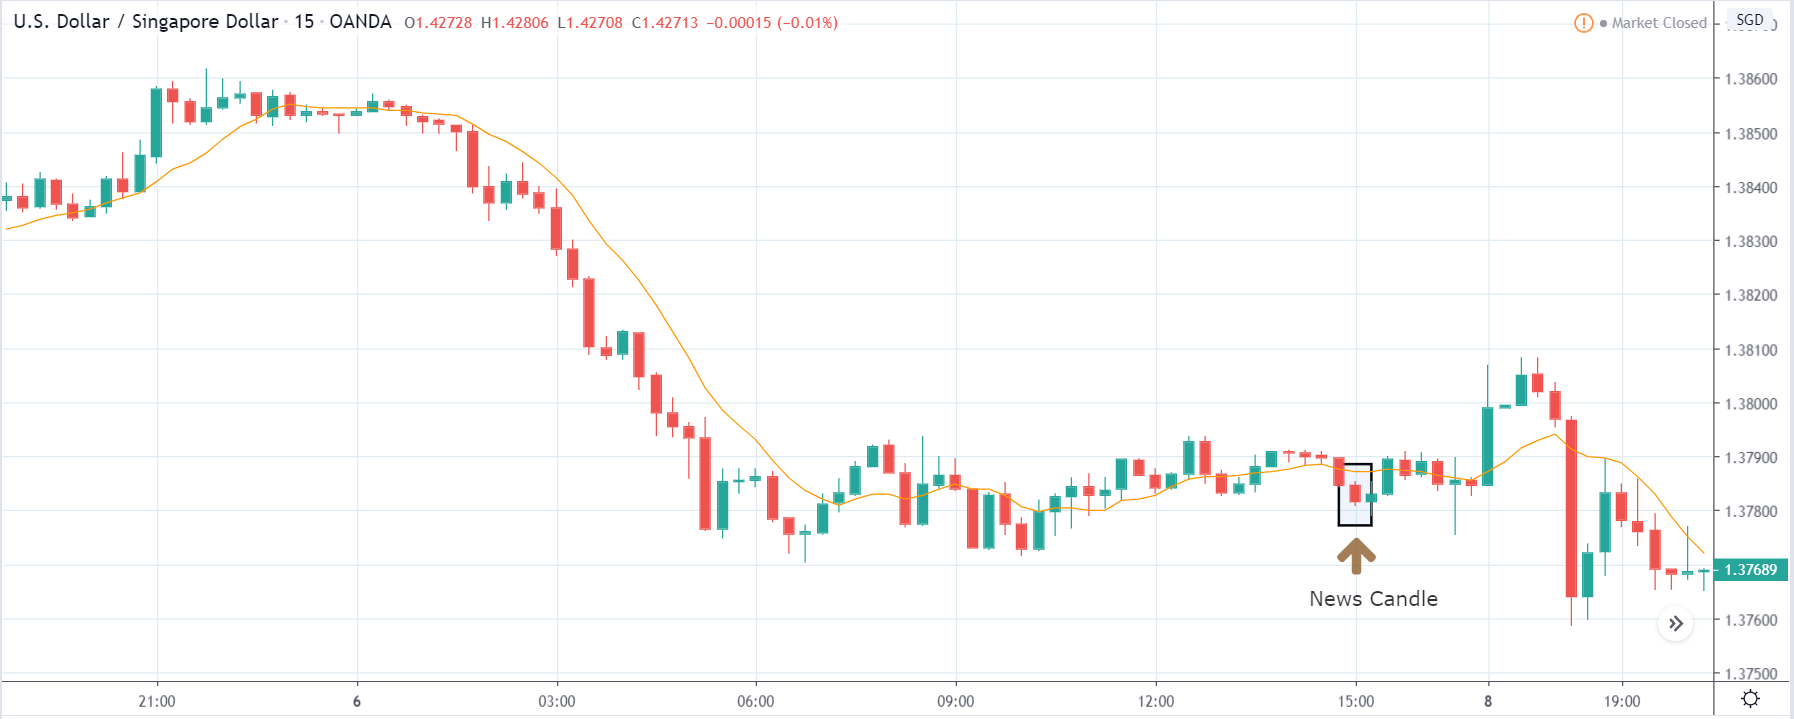
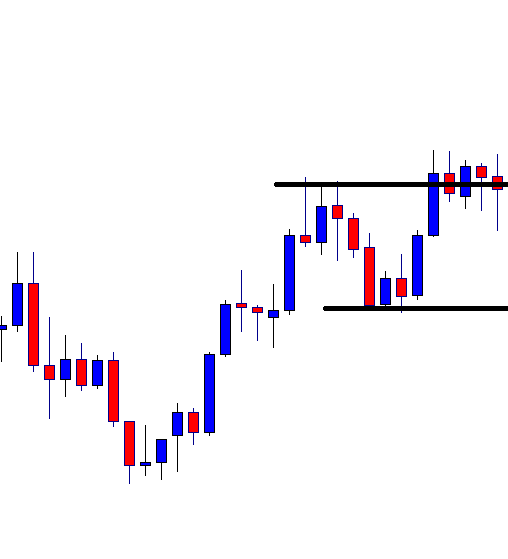
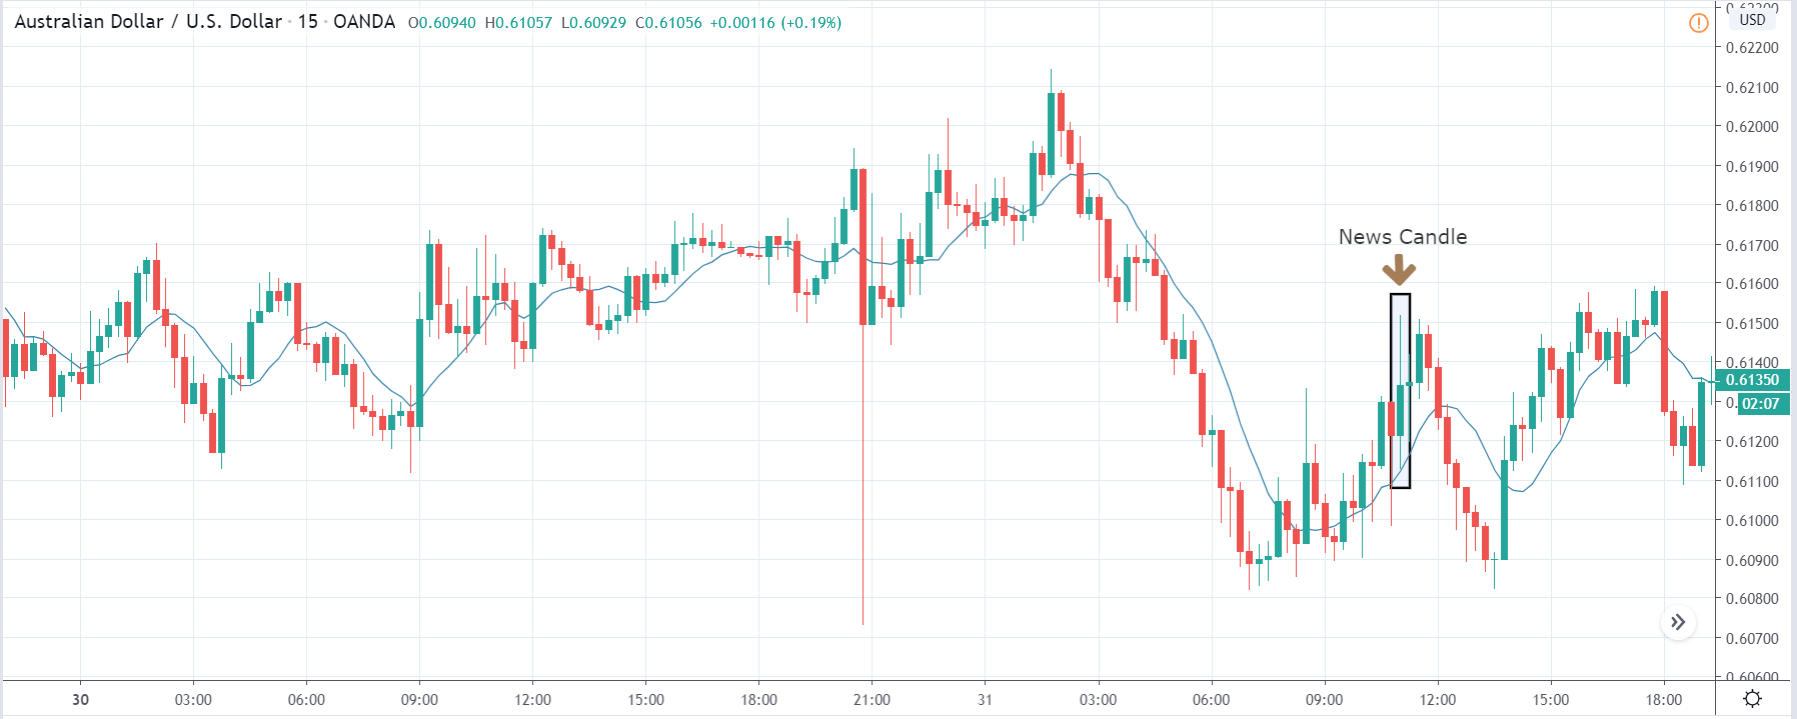
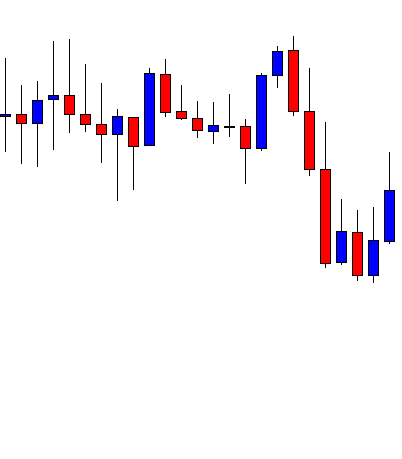
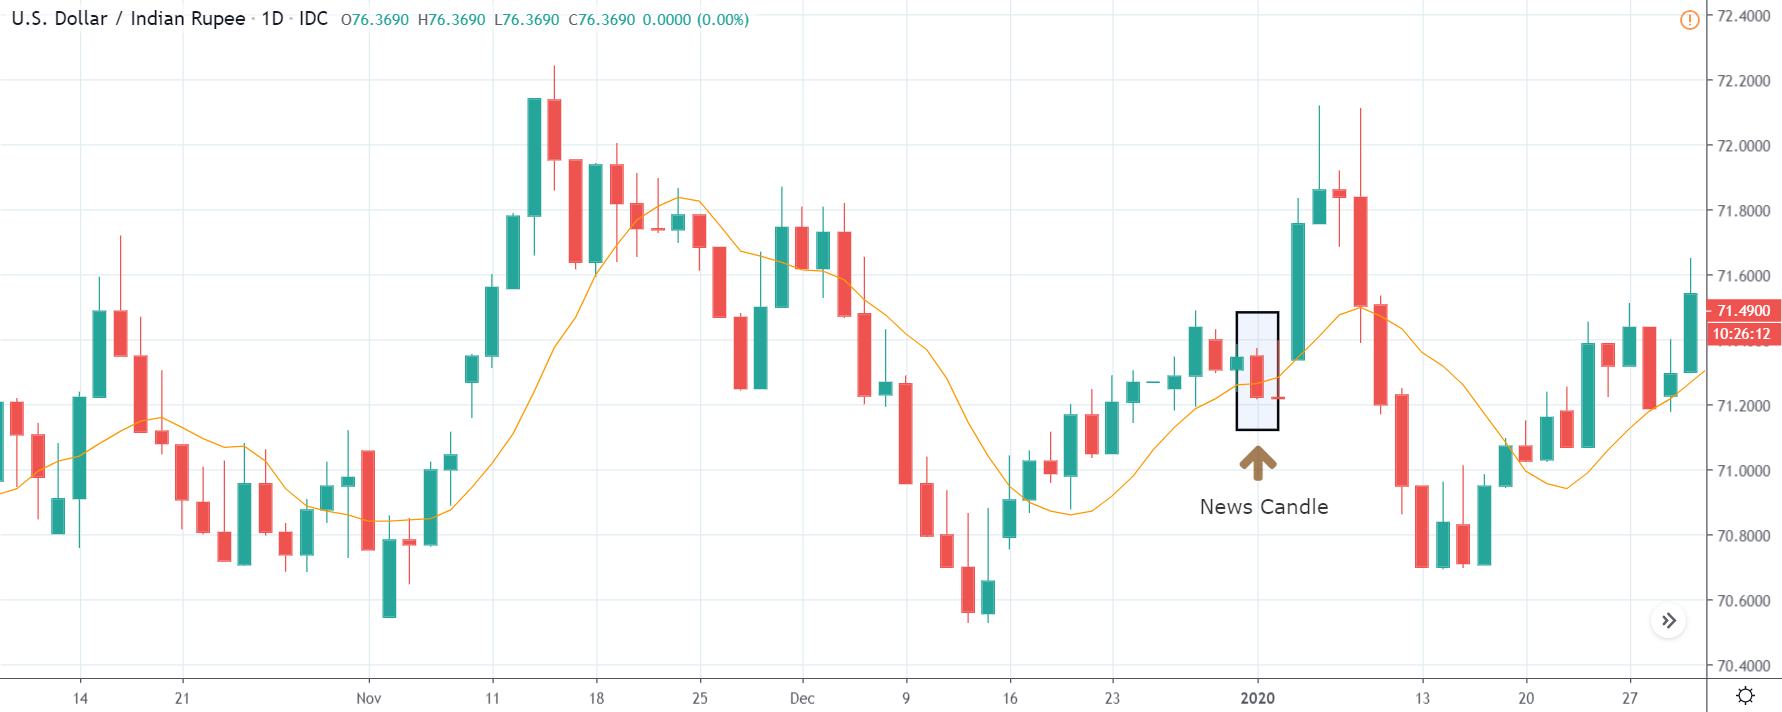
AUD/USD | After The Announcement
The above images are that of the AUD/USD currency pair, where we see that the market is in a strong downtrend, and recently the price has moved higher in the form of retracement. Technically, this is the ideal scenario for trend trading and going ”short” in the pair, but as there is a high impact news announcement in few minutes, the market could sharply move on any side. Therefore, it is wise to wait for the release and then trade based on the data and shift in volatility.
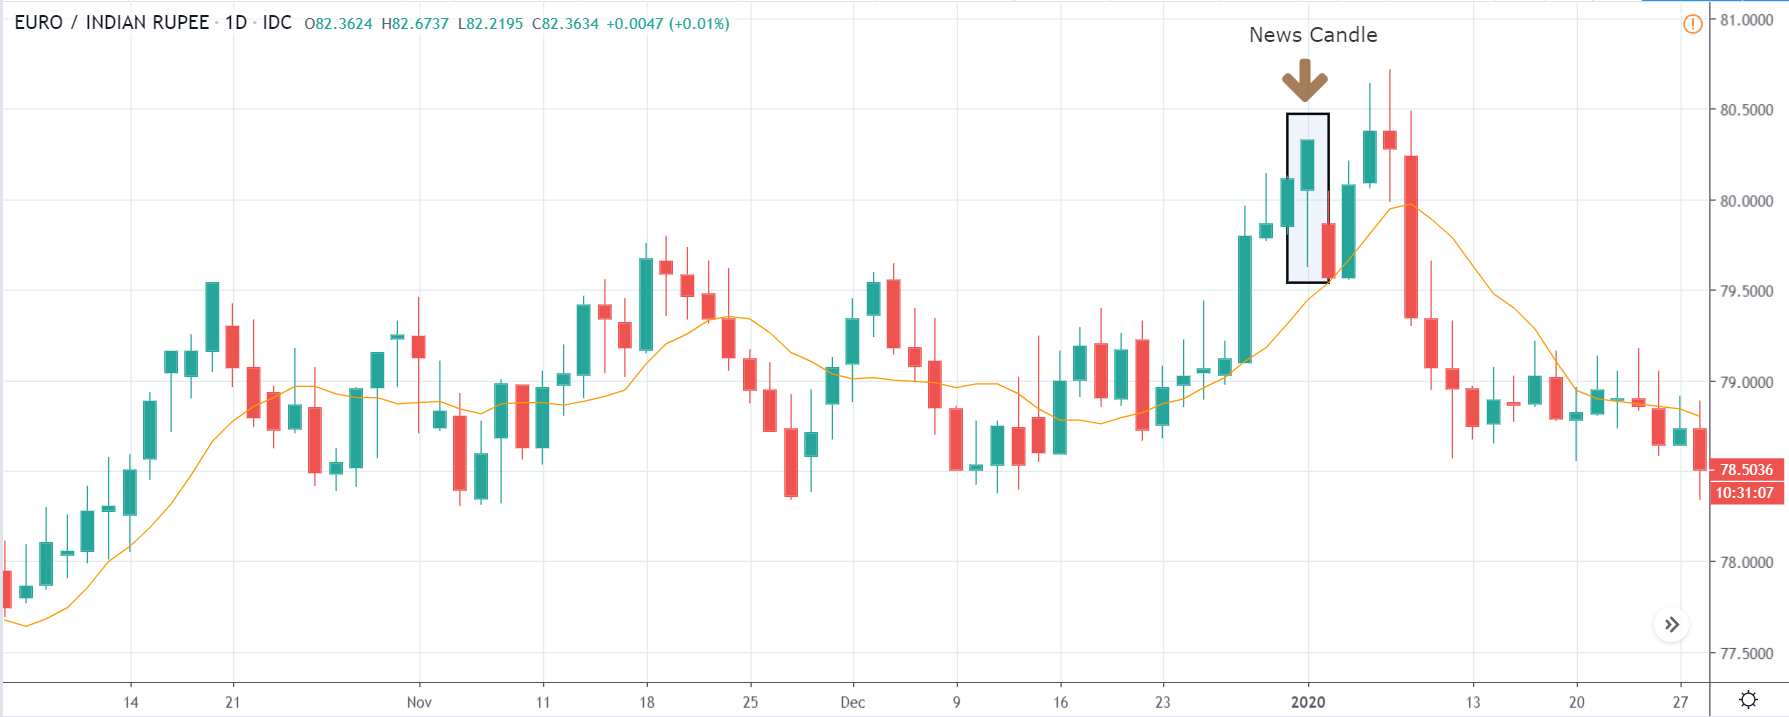
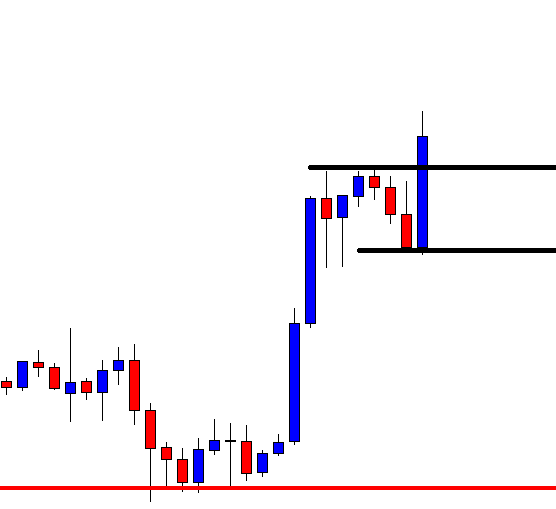
After the news announcement, the price suddenly surges and moves higher in the beginning, but the price sees some selling pressure from the top and closes with a large wick on the top. The sudden up move is because of the weak Crude Oil Production data, which made traders sell the U.S. dollar and cause a short-term reversal in the market. As the ”news candle” still closes as a bullish candle, one should not underestimate the buyer’s strength and go ”short” in this pair. We also cannot go ”long” in the currency pair due to the selling pressure seen later. Thus, we can only trade the pair after he/she gets a sense of clear direction.
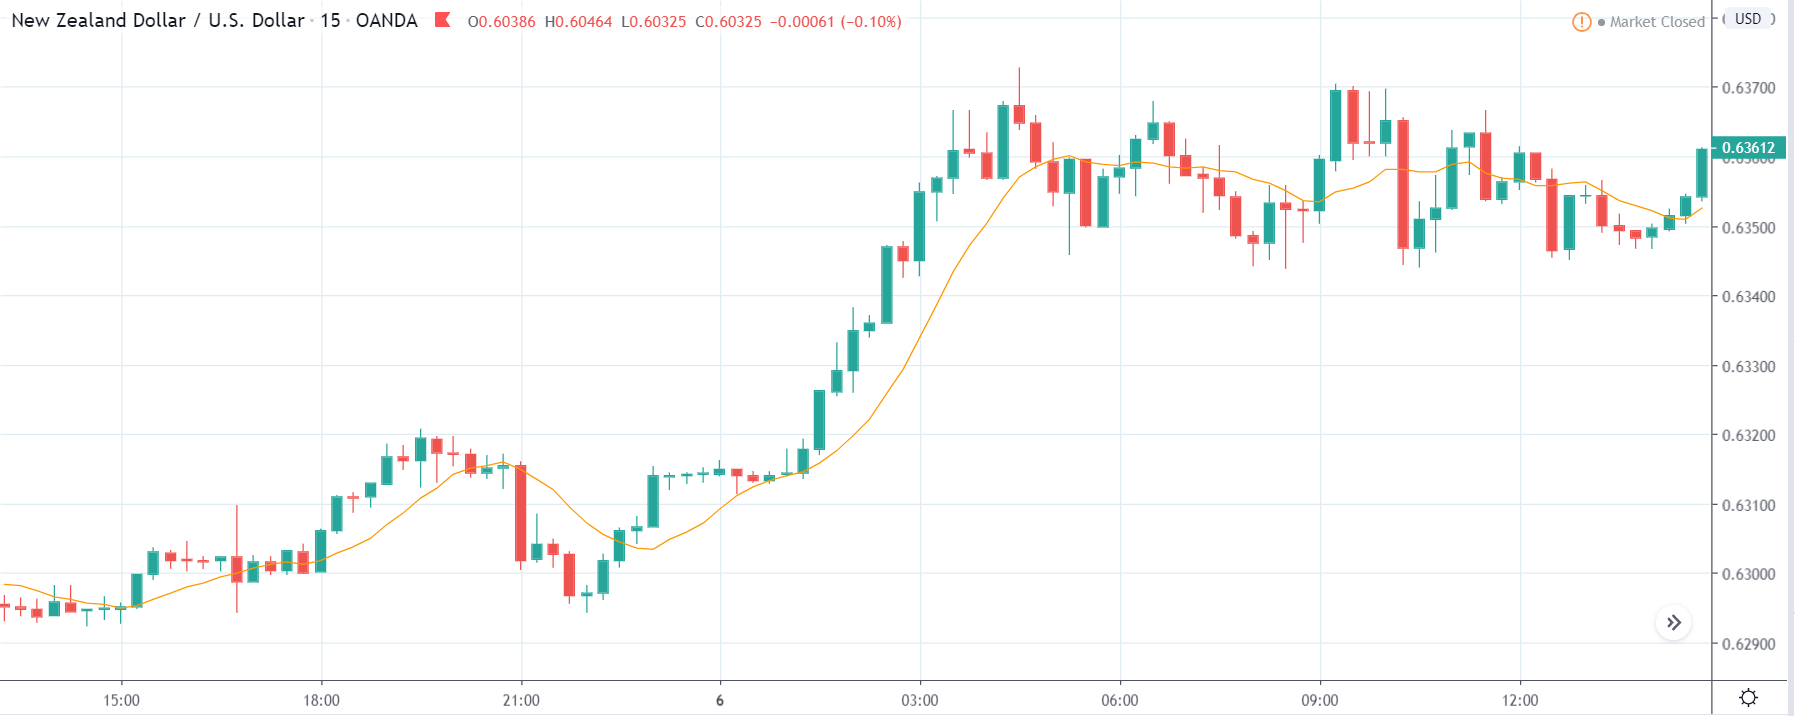
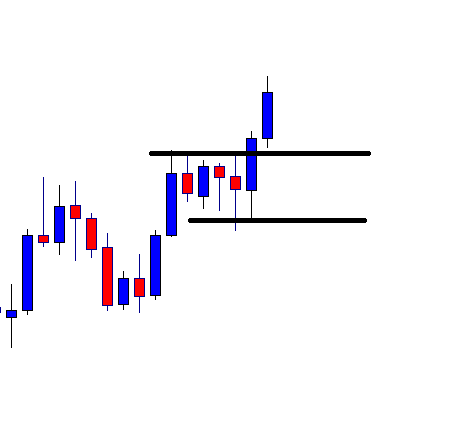
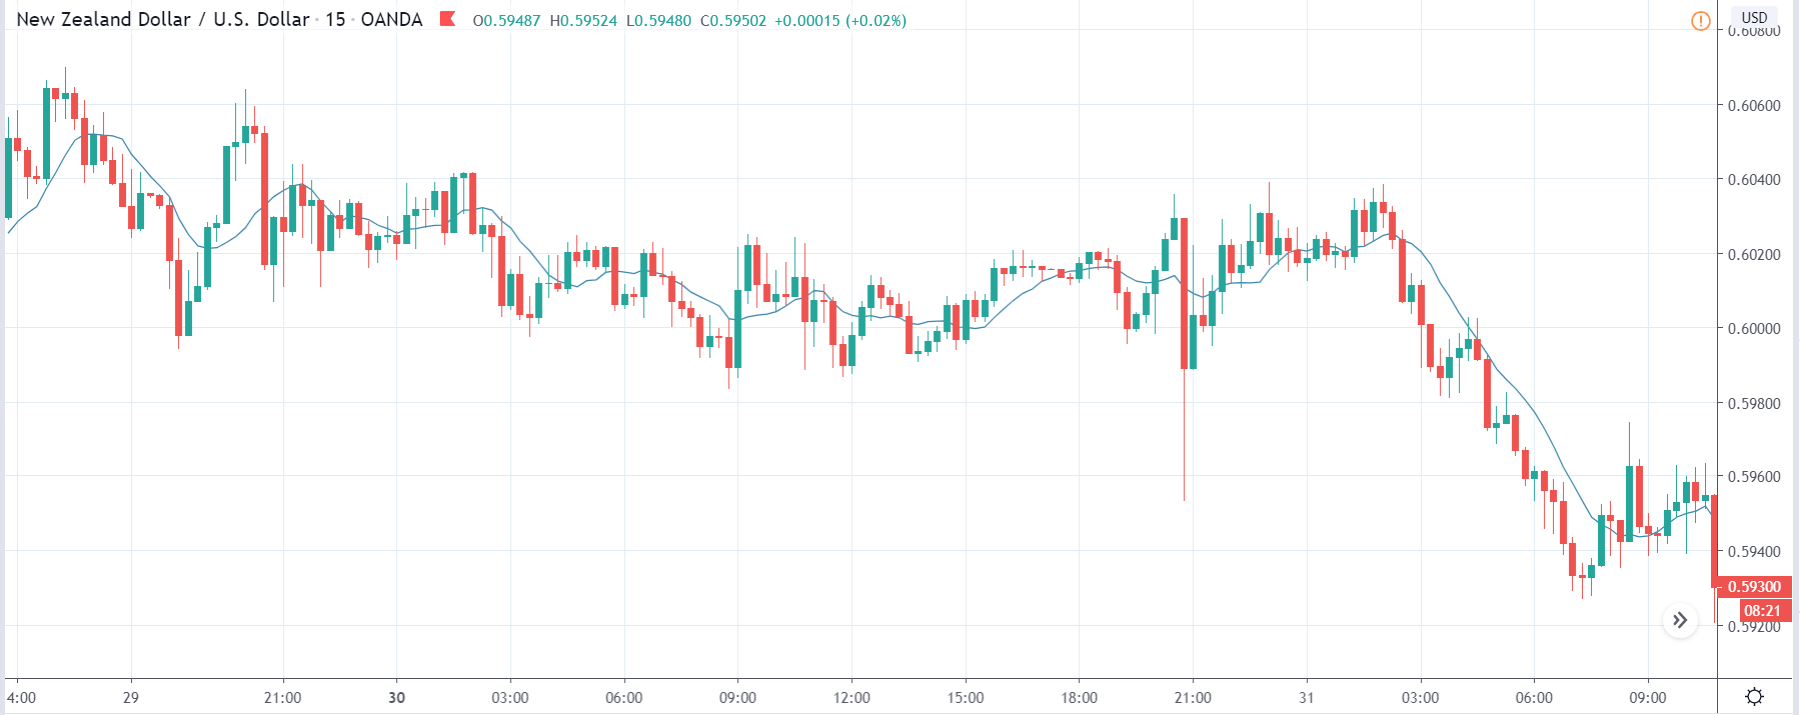
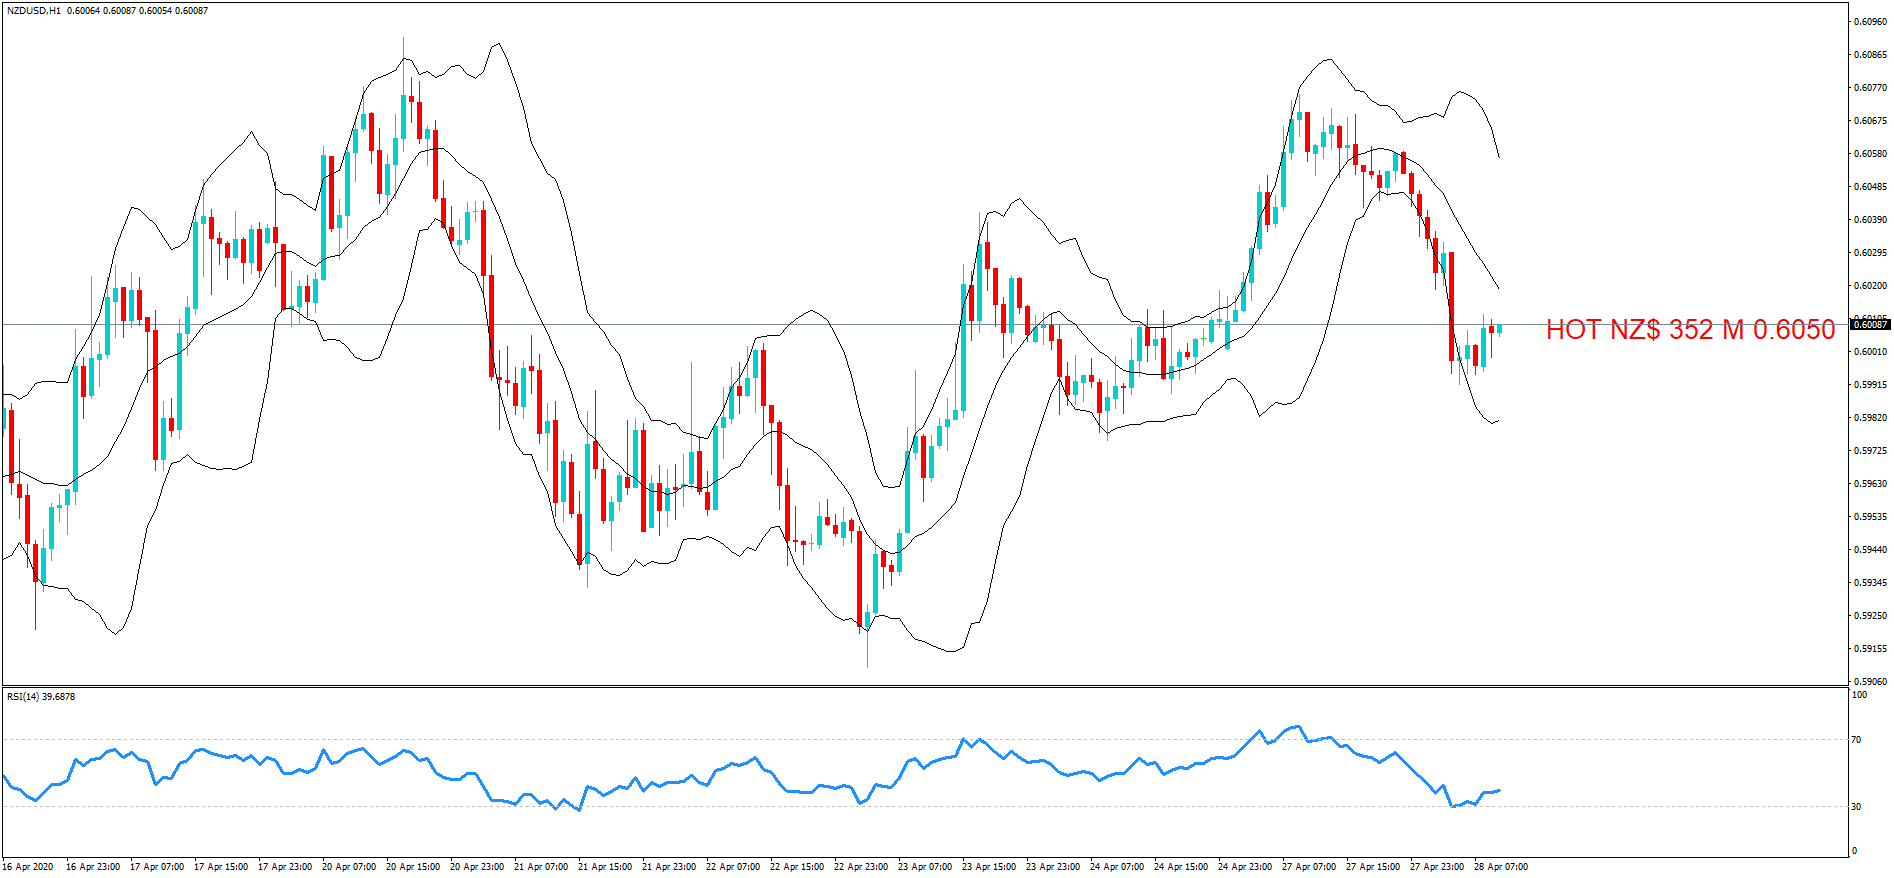
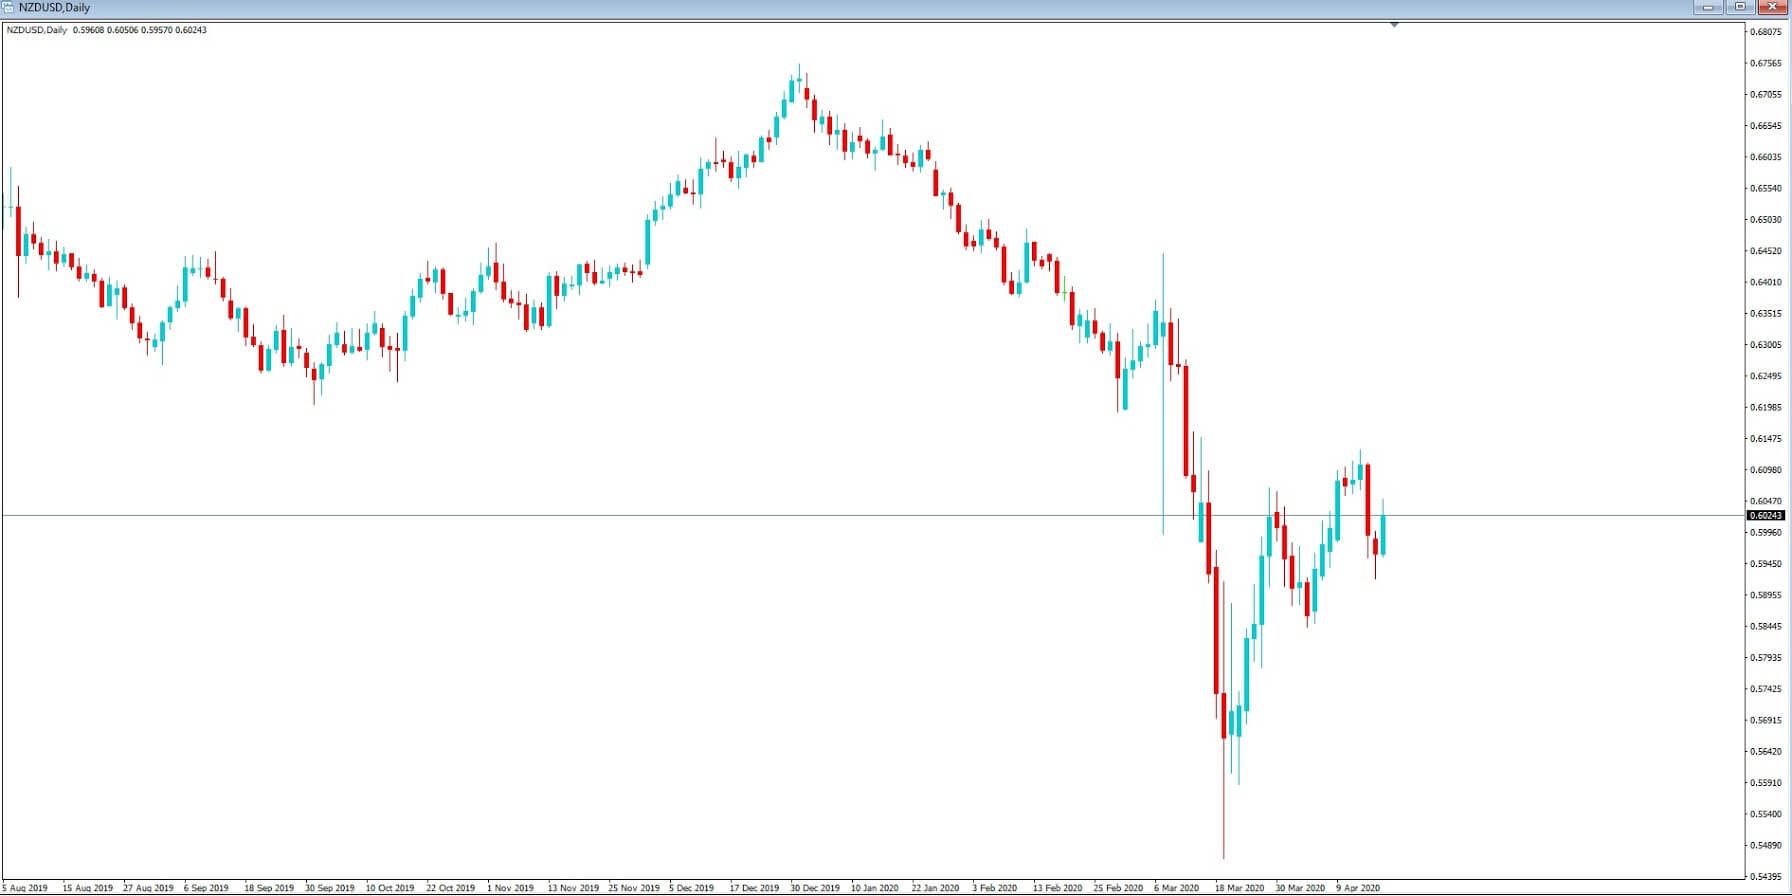
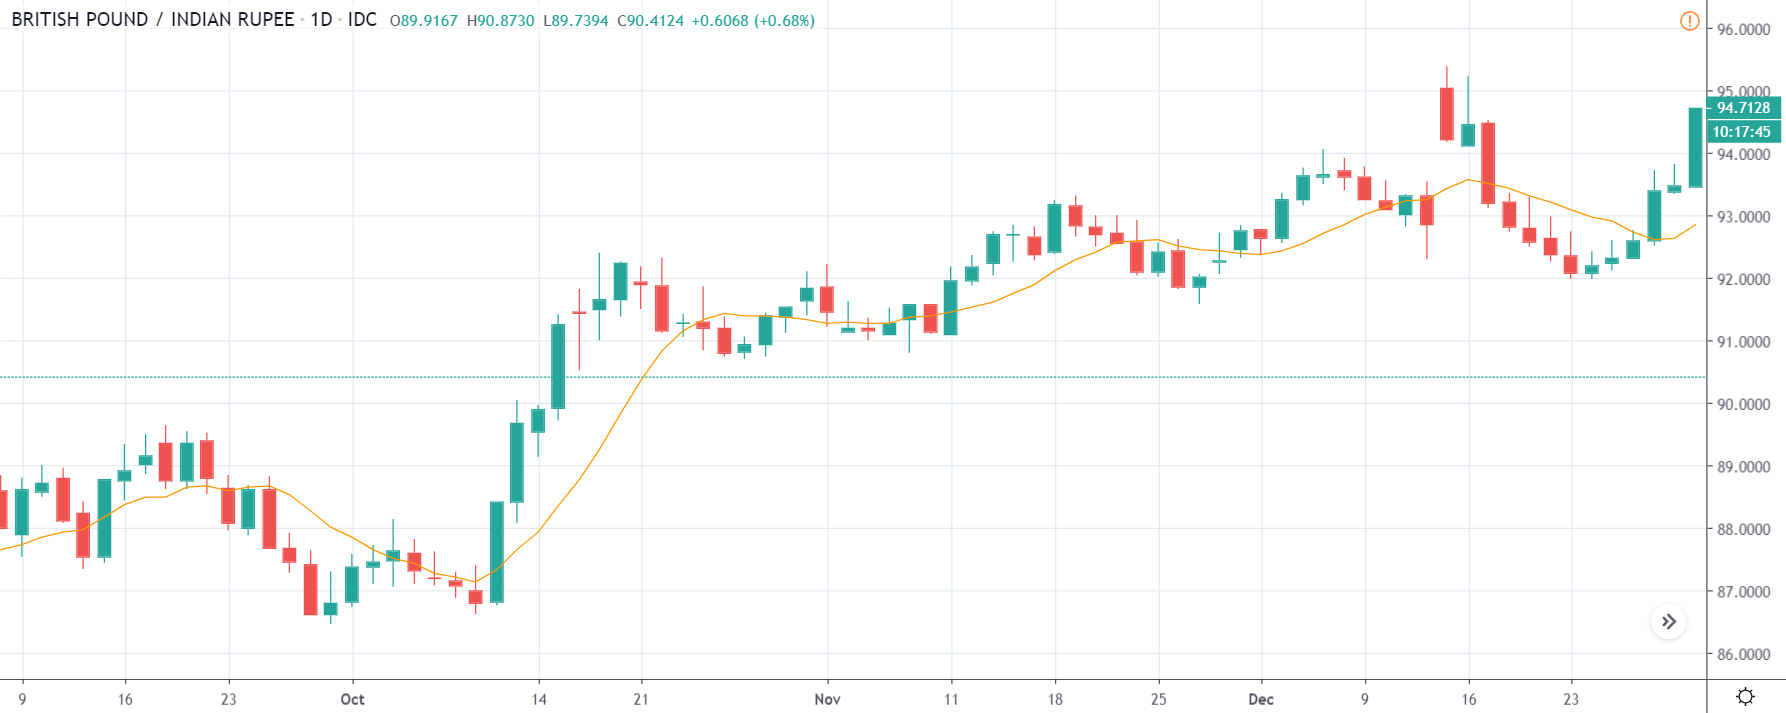
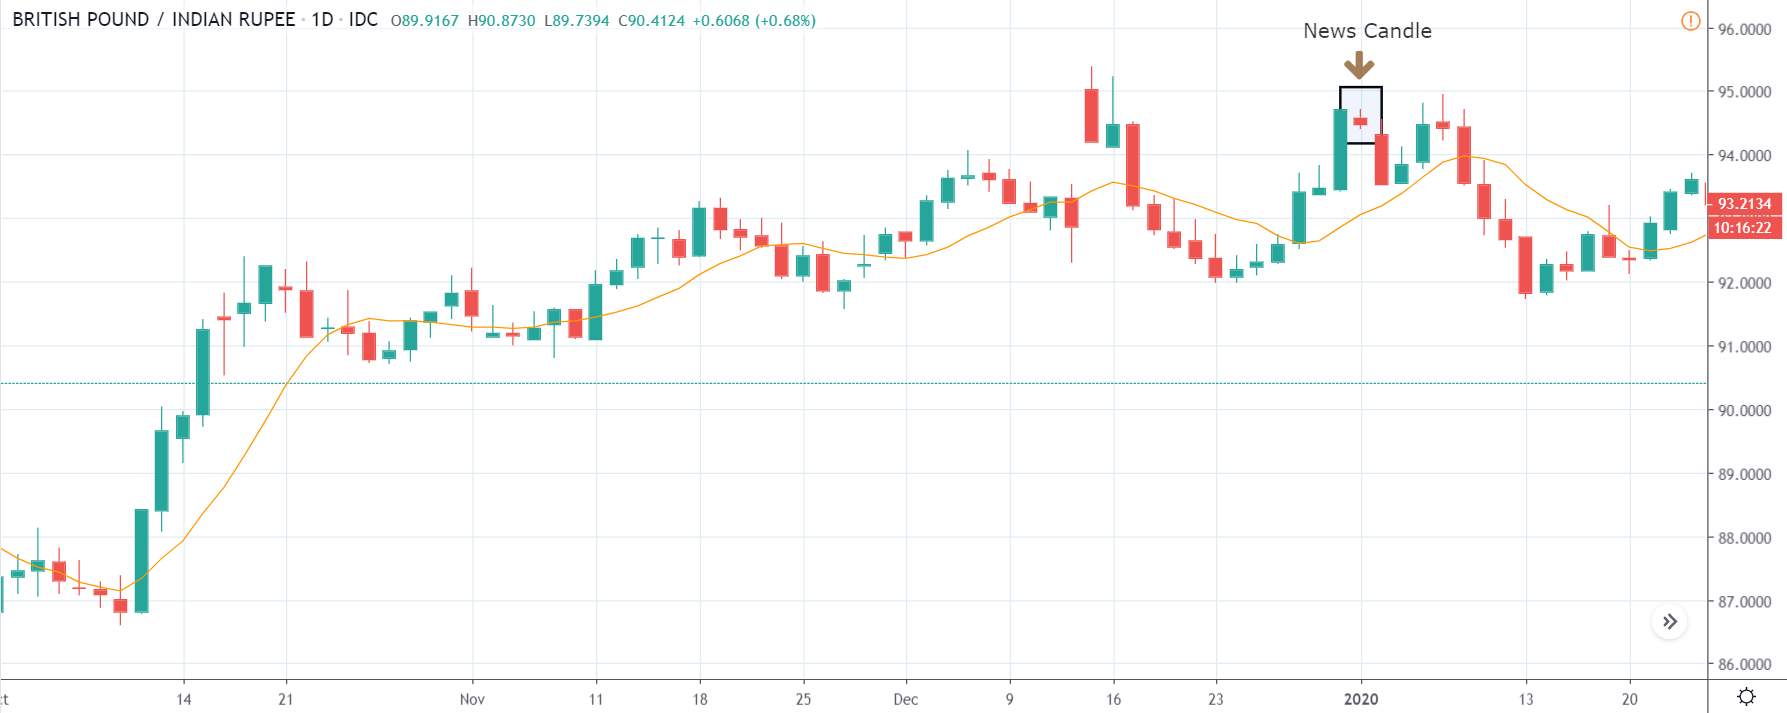
NZD/USD | Before The Announcement
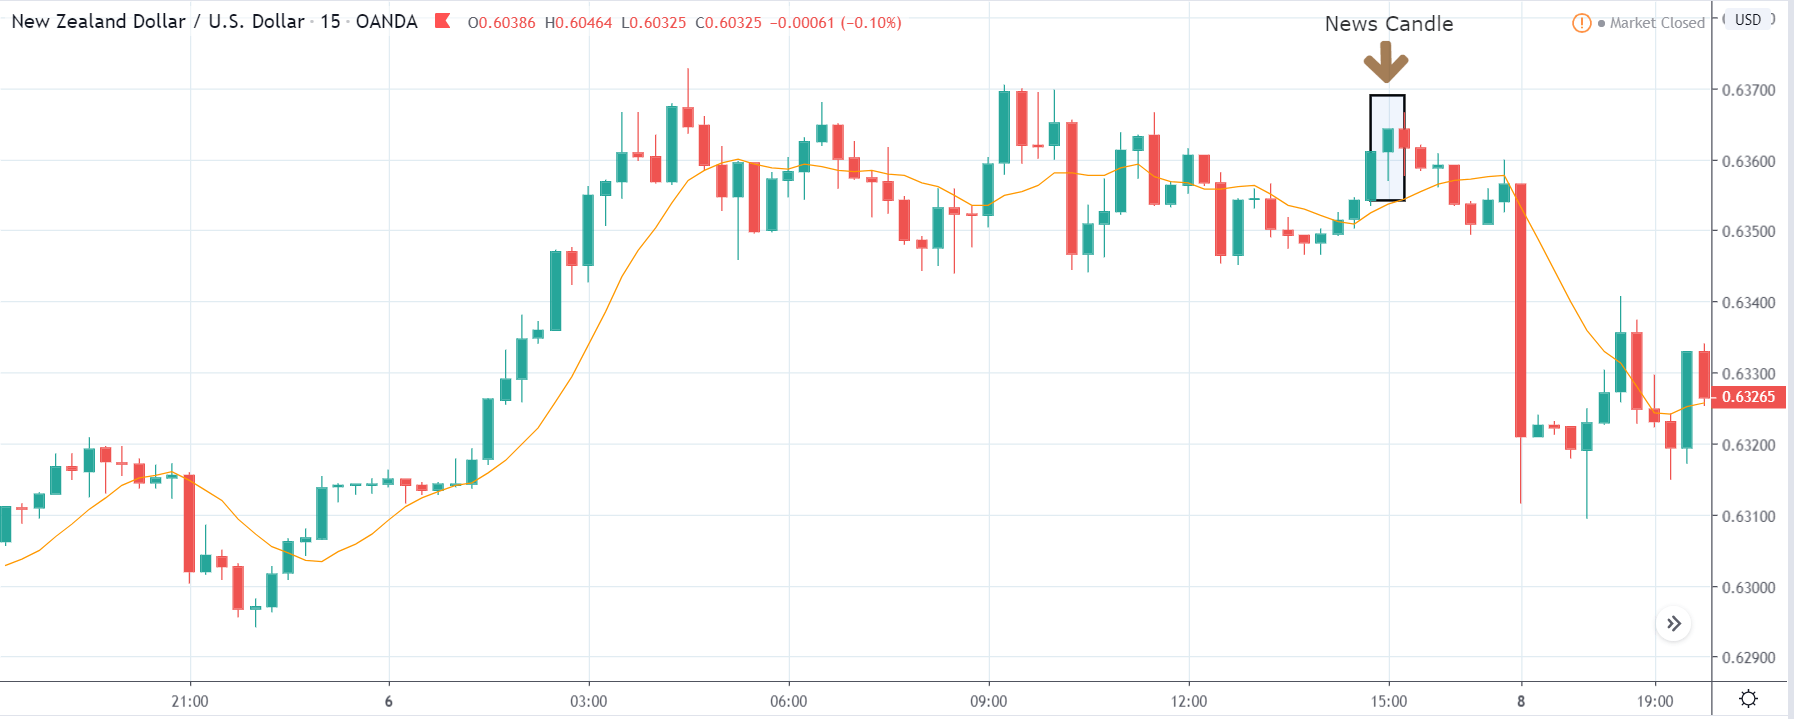
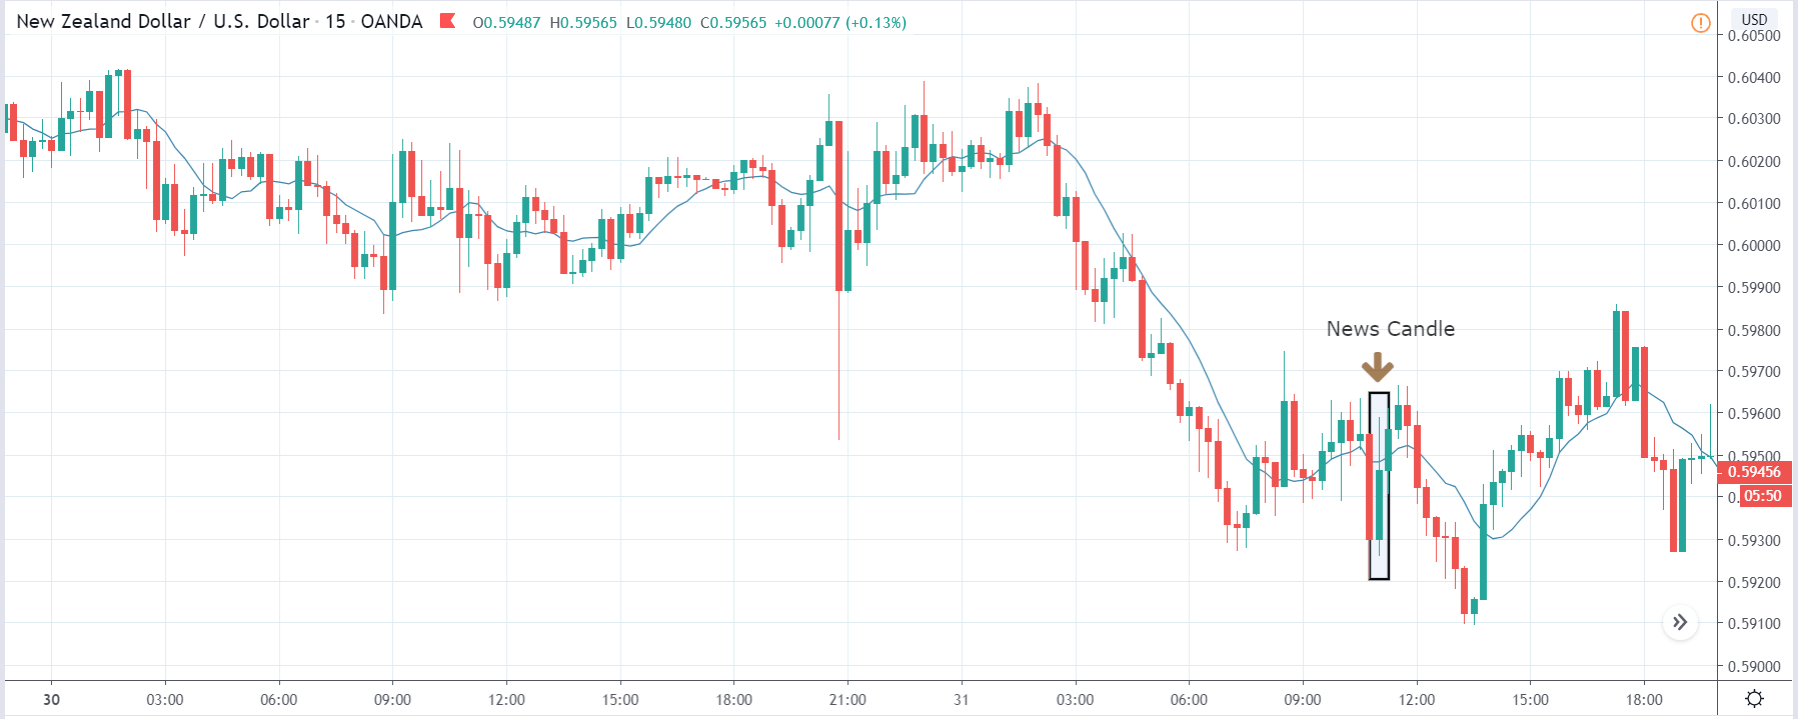
NZD/USD | After The Announcement
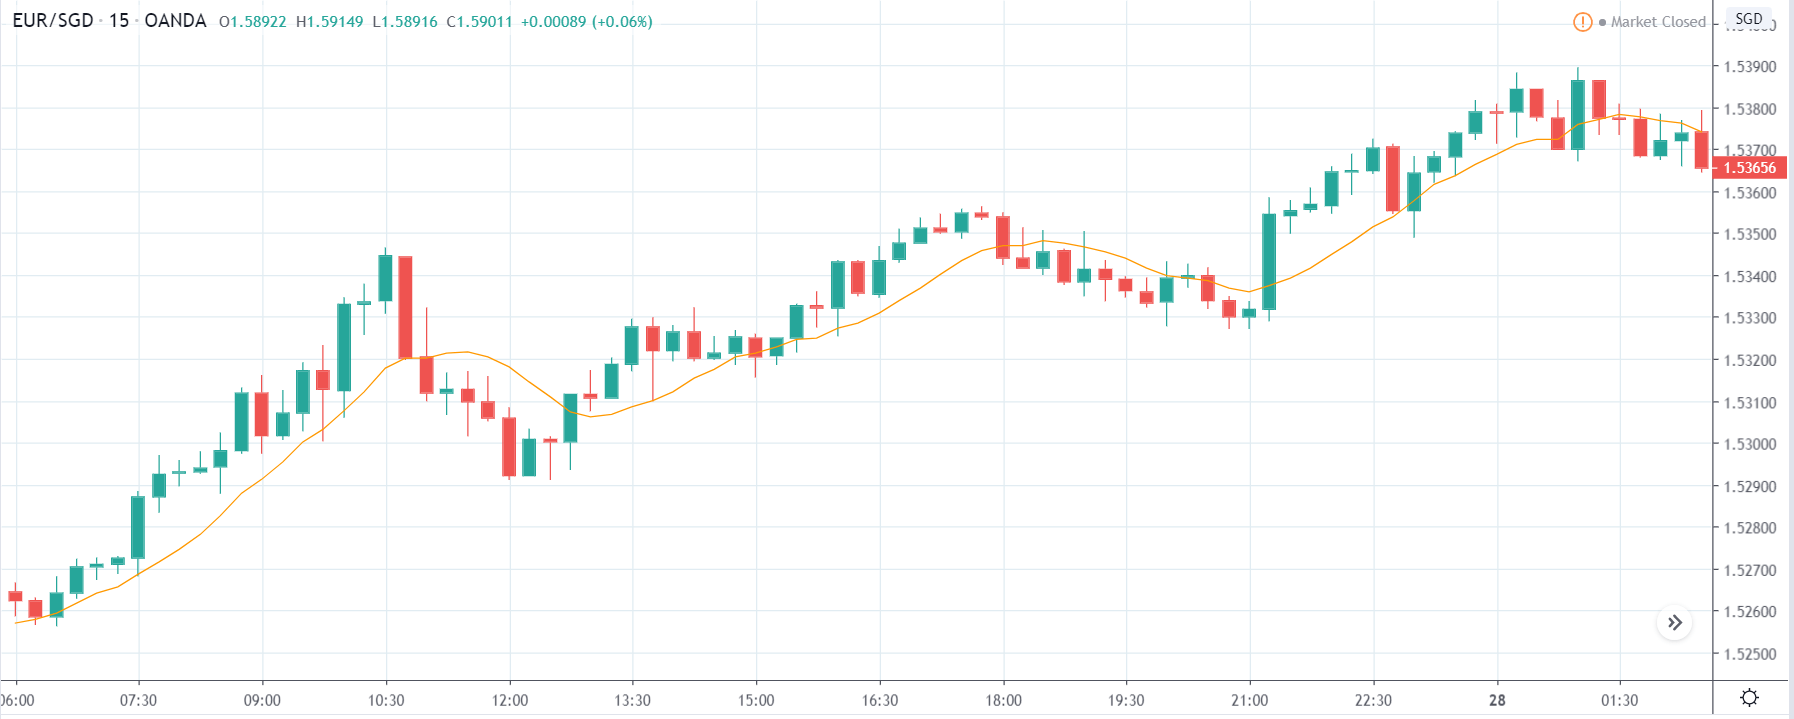
Lastly, we shall discuss the NZD/USD currency pair, where the first image shows the characteristics of the chart before the news announcement. As we can see, the pair is in a strong downtrend, and just before the release, it is at the lowest point. This indicates a great amount of strength in the U.S dollar, as it is on the right-hand side. If the Crude Oil Production is lower than before, the pair will continue to move lower, and we will not have a suitable trade entry.
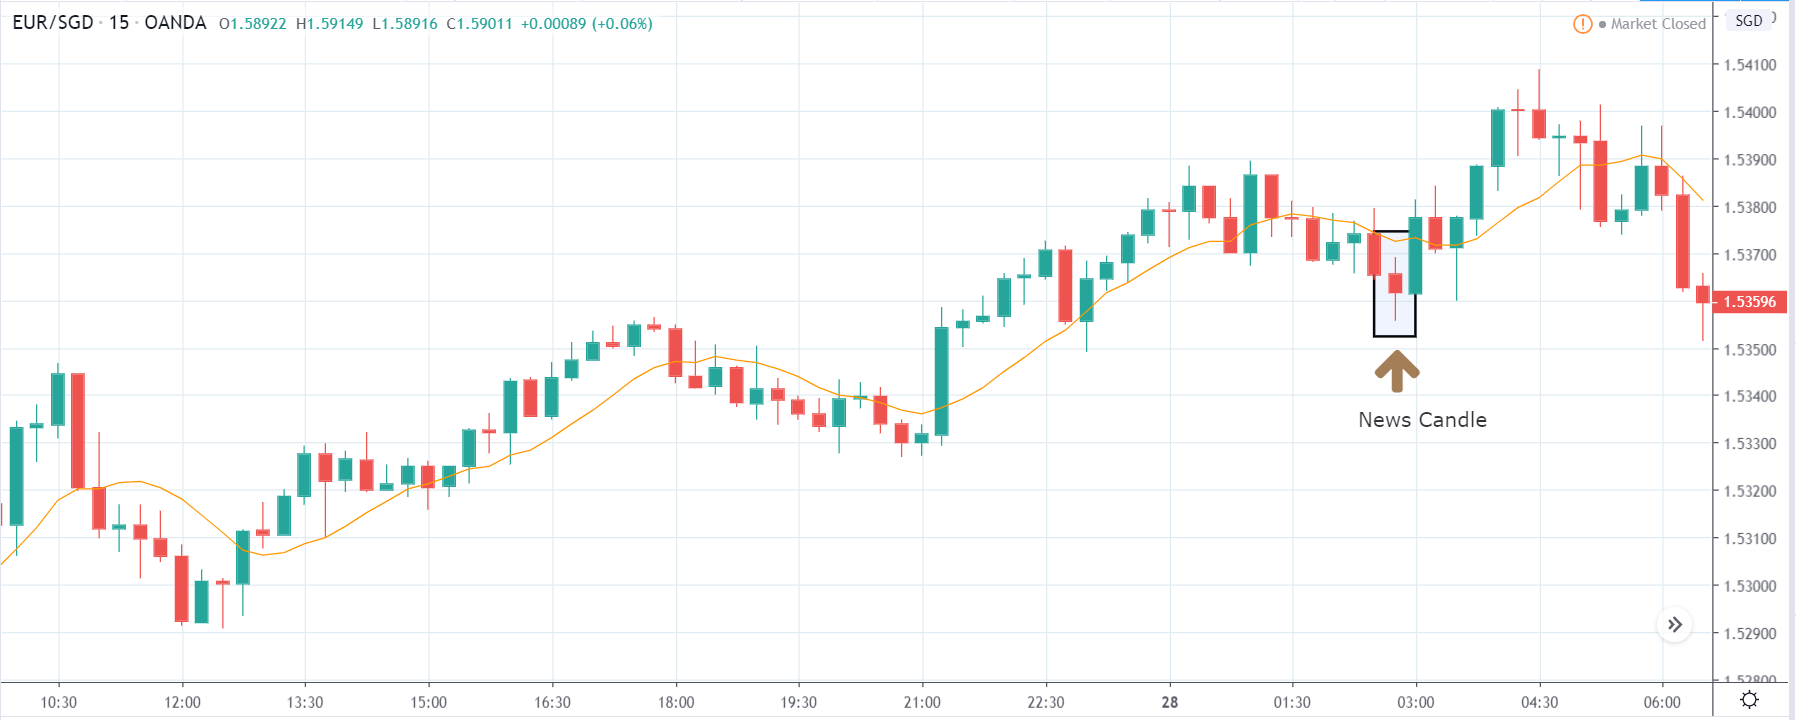
On the other hand, if the data is better than last time, we can only go ”long” in the market, if we see some reversal patterns. After the data is released, the market moves sharply higher, almost similar to the above pair, and again leaves a wick on the top. The bad news in the form of lesser Crude Oil Production increased the volatility on the upside and shot the price up.
That’s about ‘Crude Oil Production’ and its impact on the Forex market. Let us know if you have any questions in the comments below. Cheers.


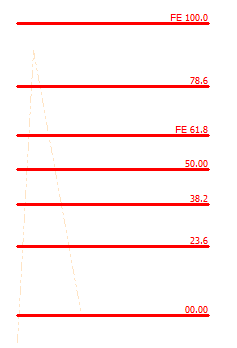
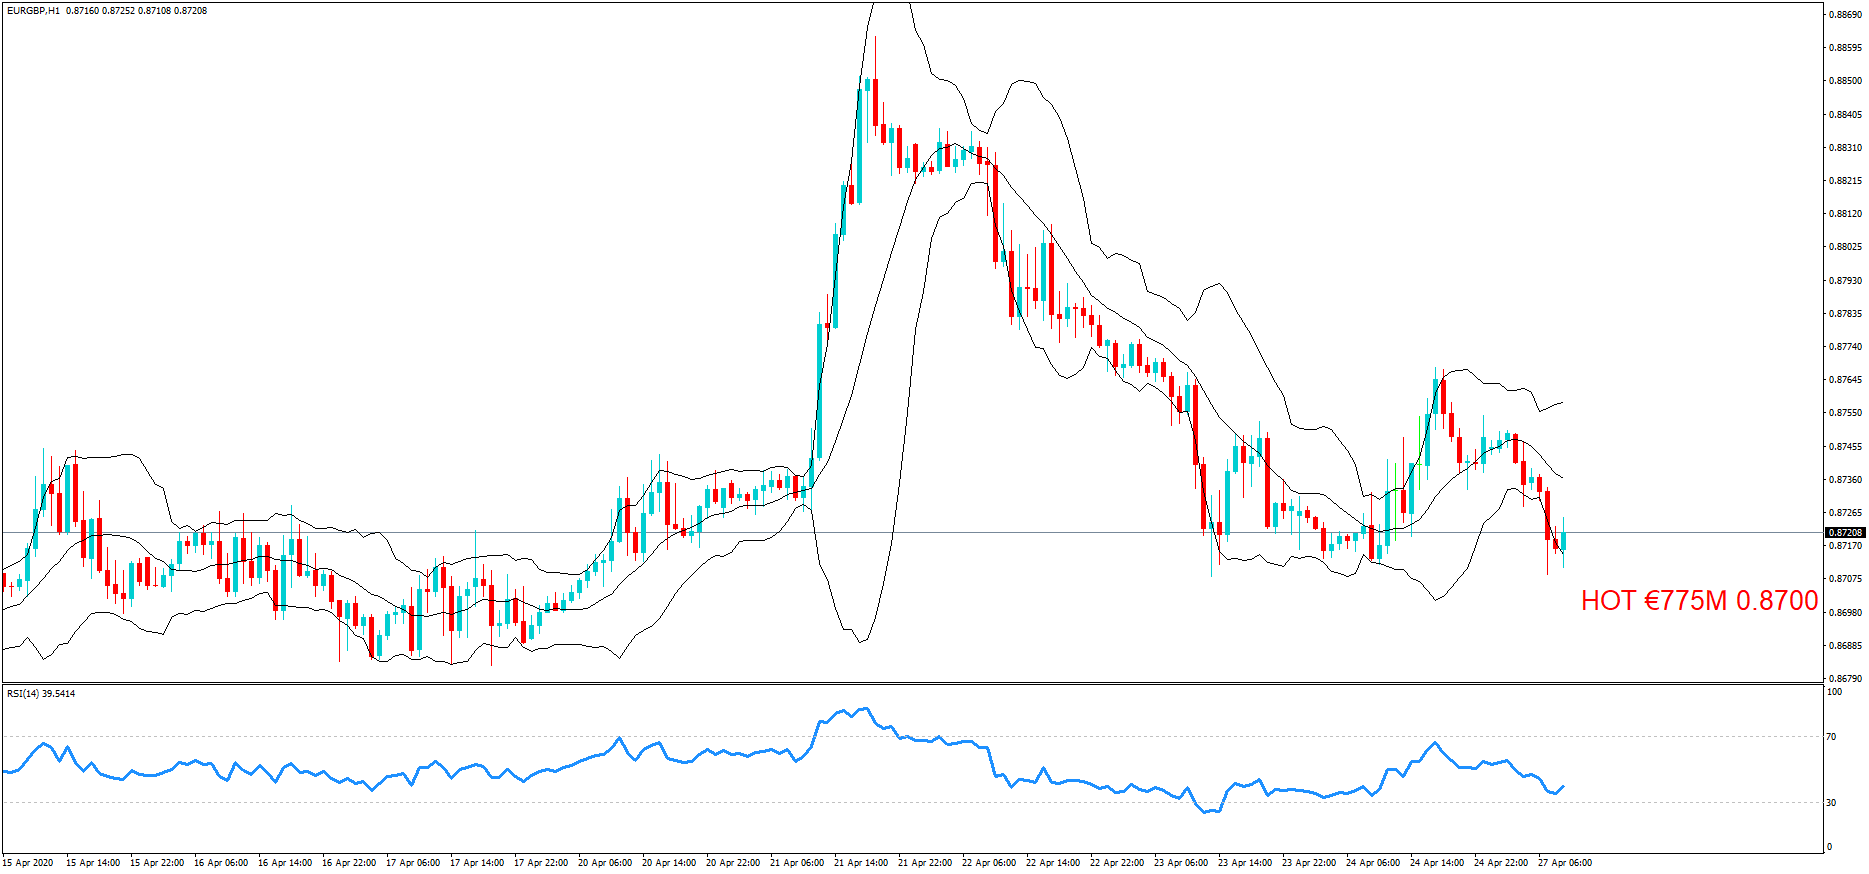
 Forex.Academy will be making these levels available to you, free of charge, and they can be accessed on the options drop-down menu of our home page. For your convenience, as and when


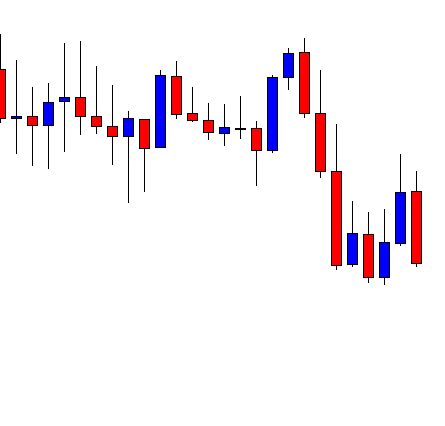


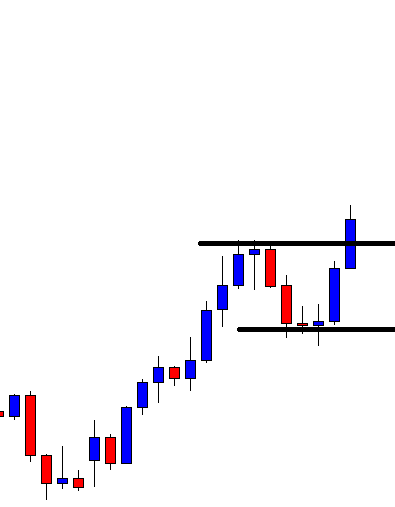
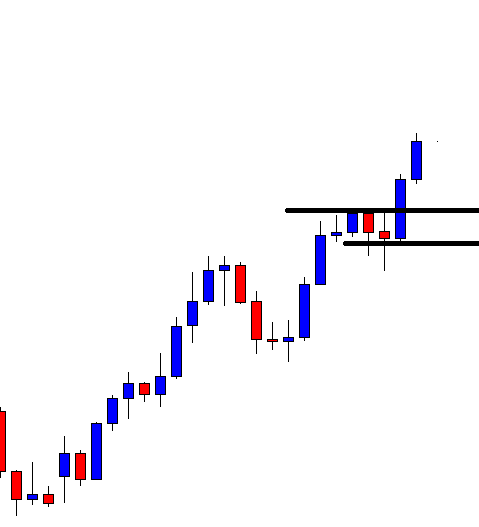
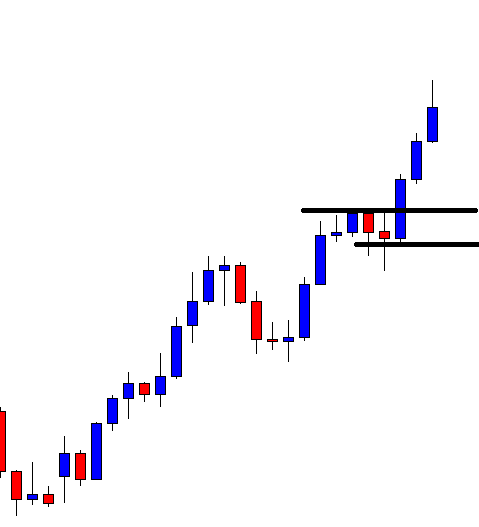


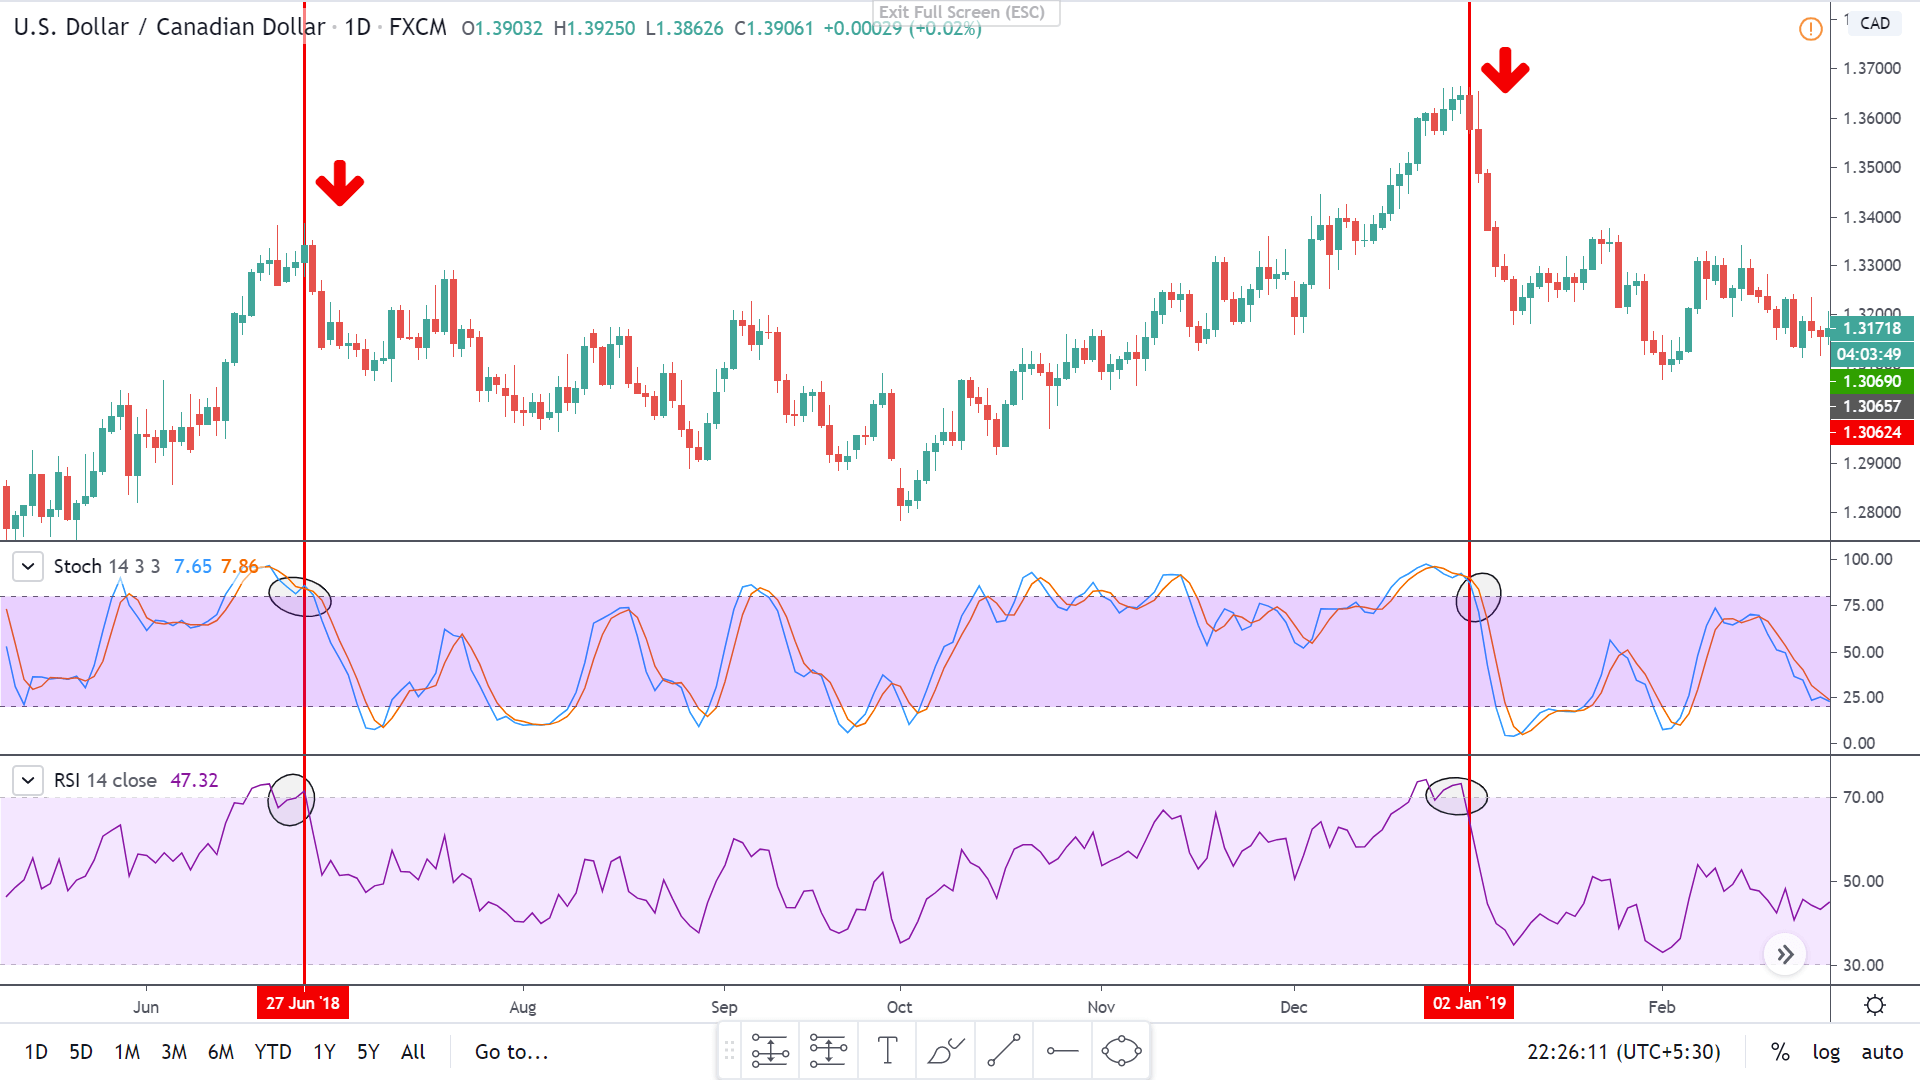
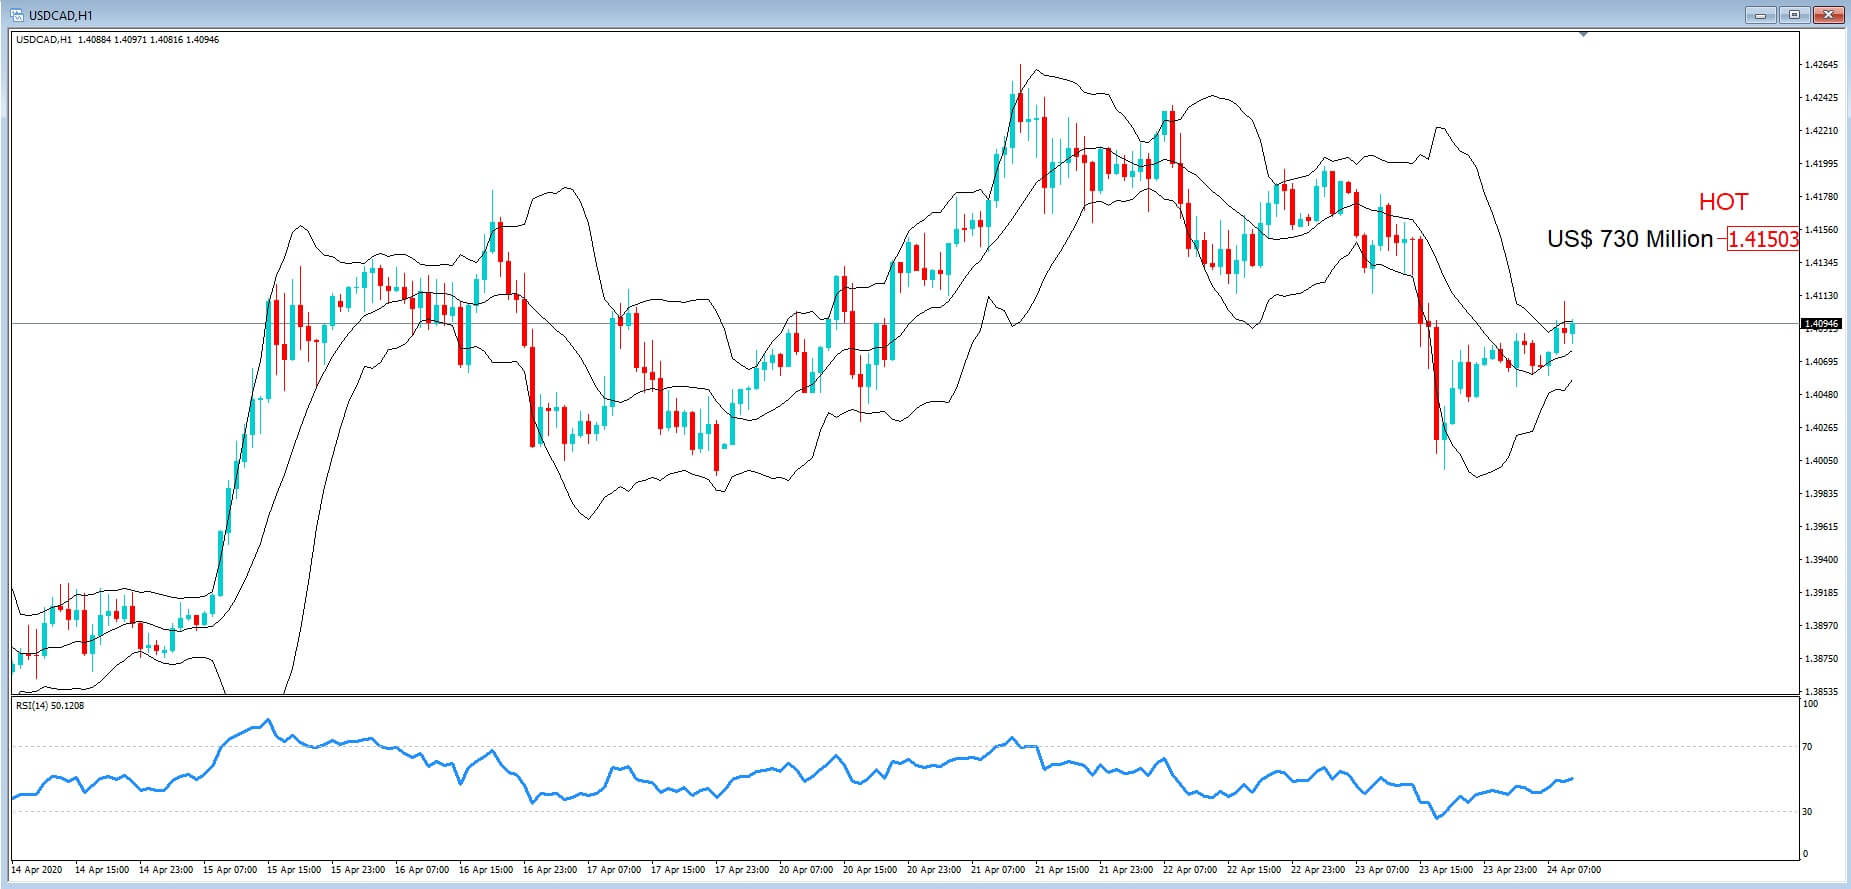
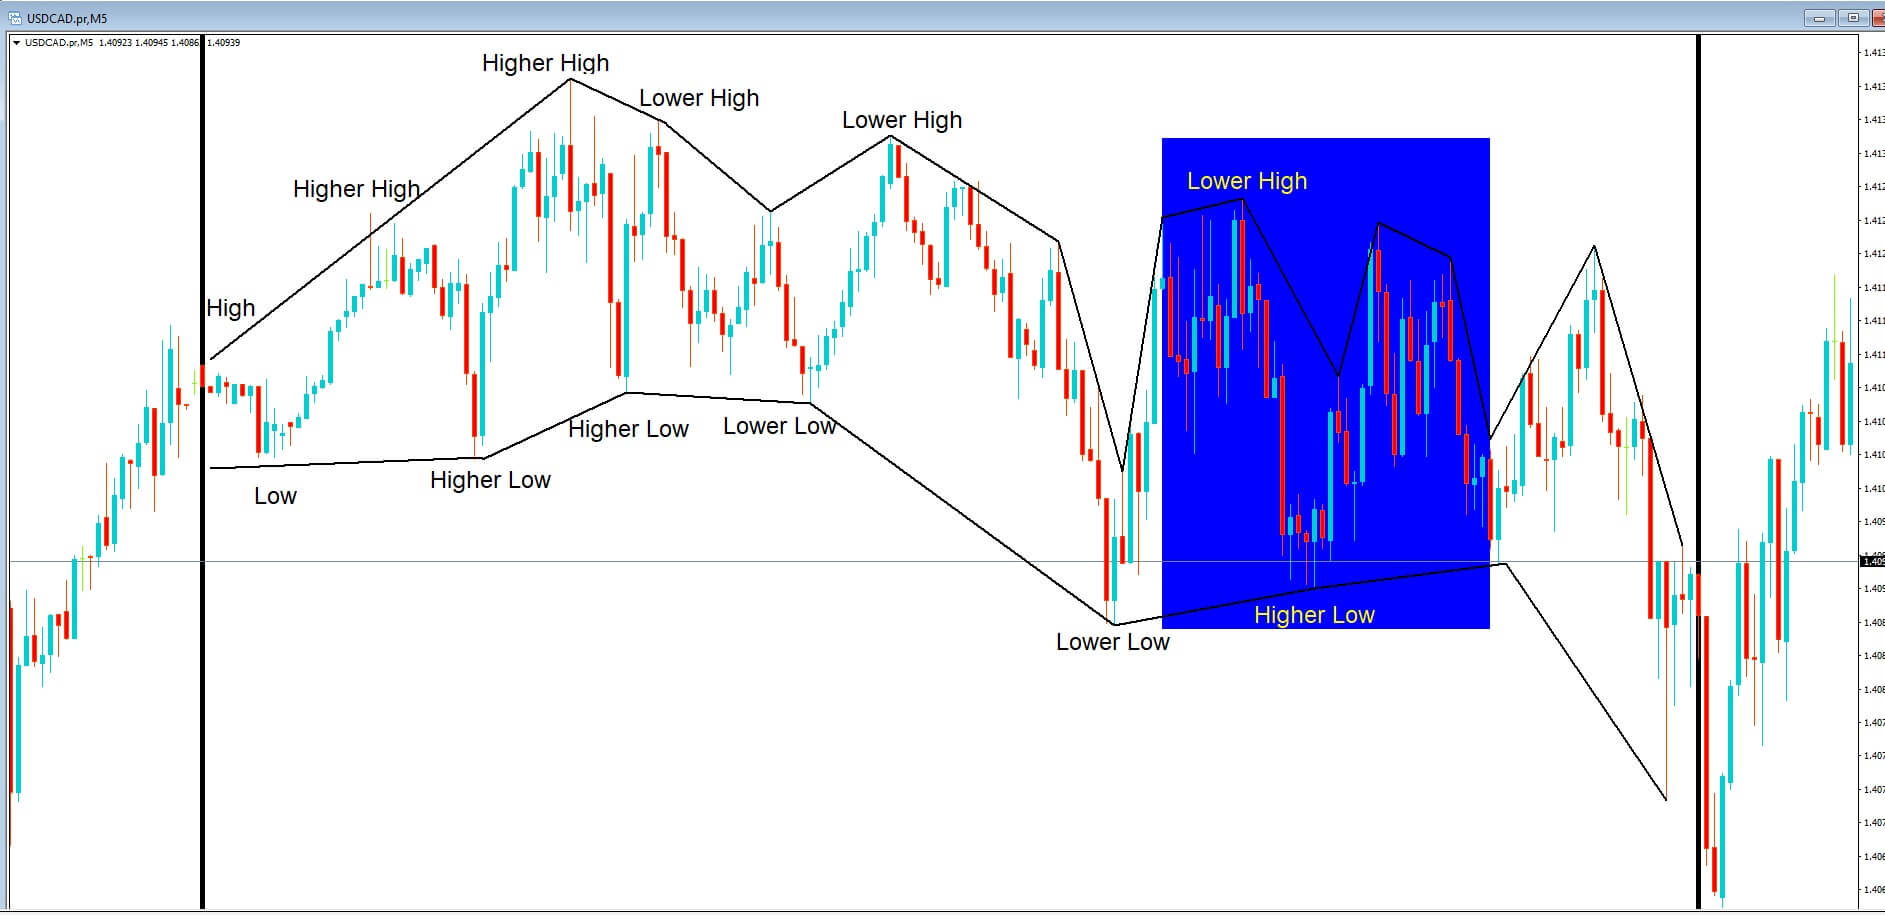
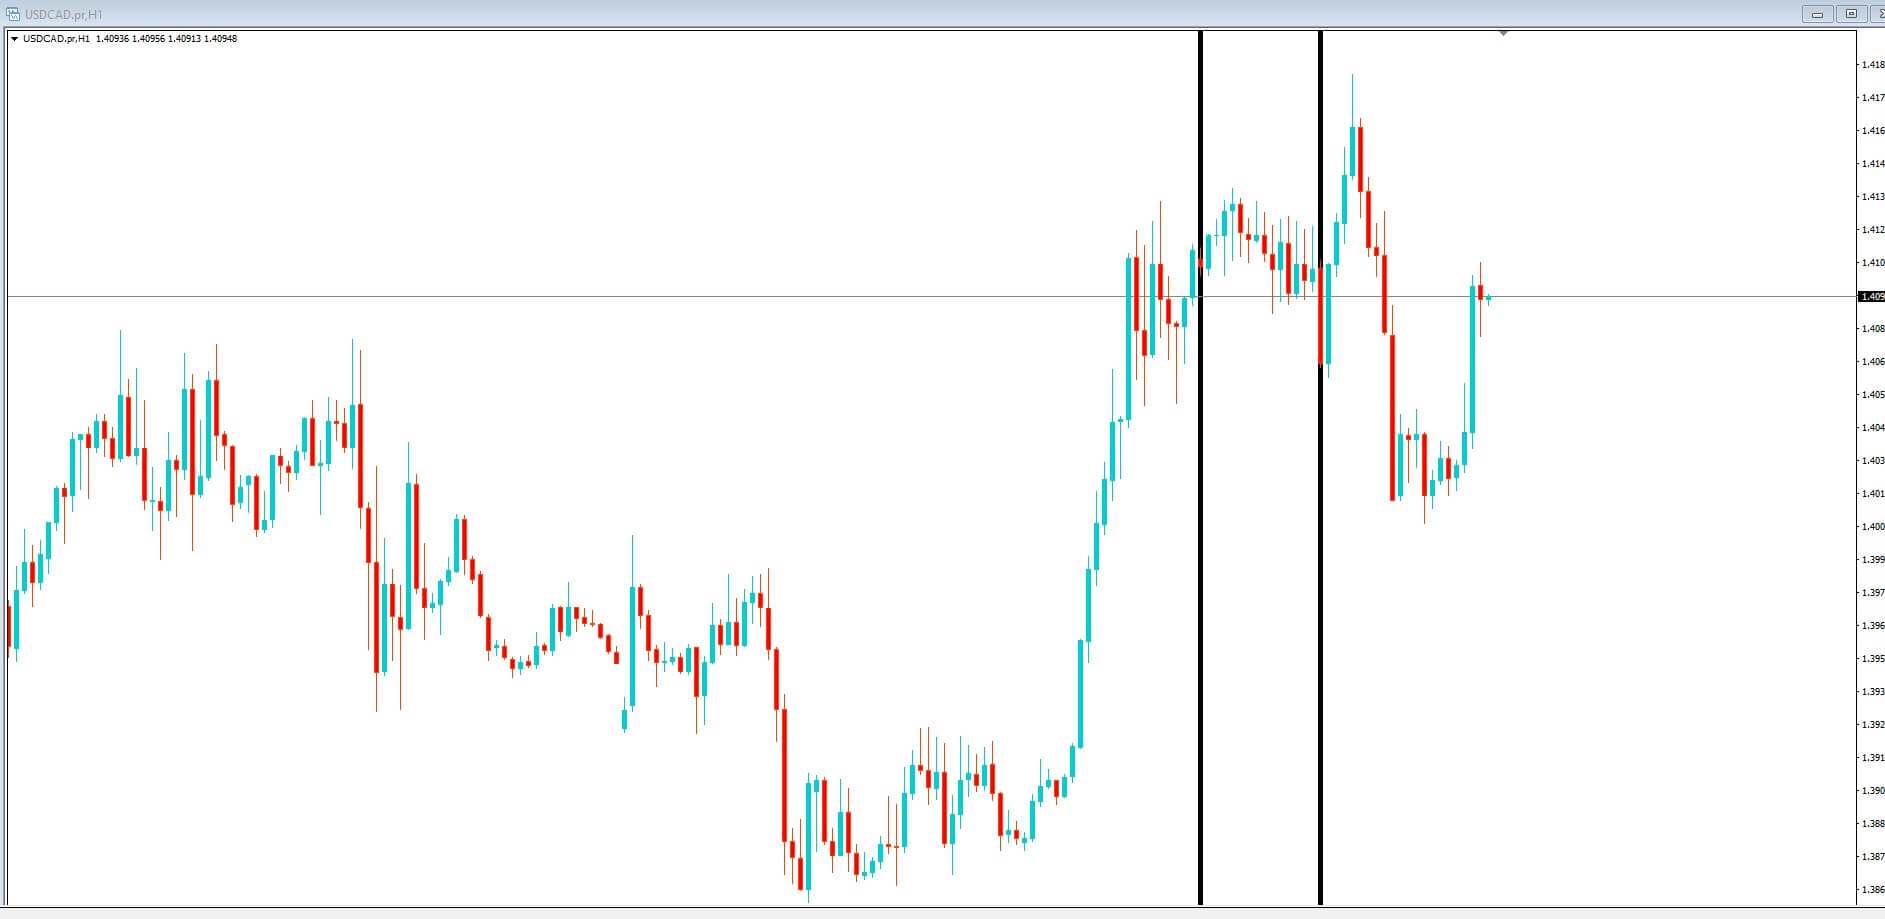
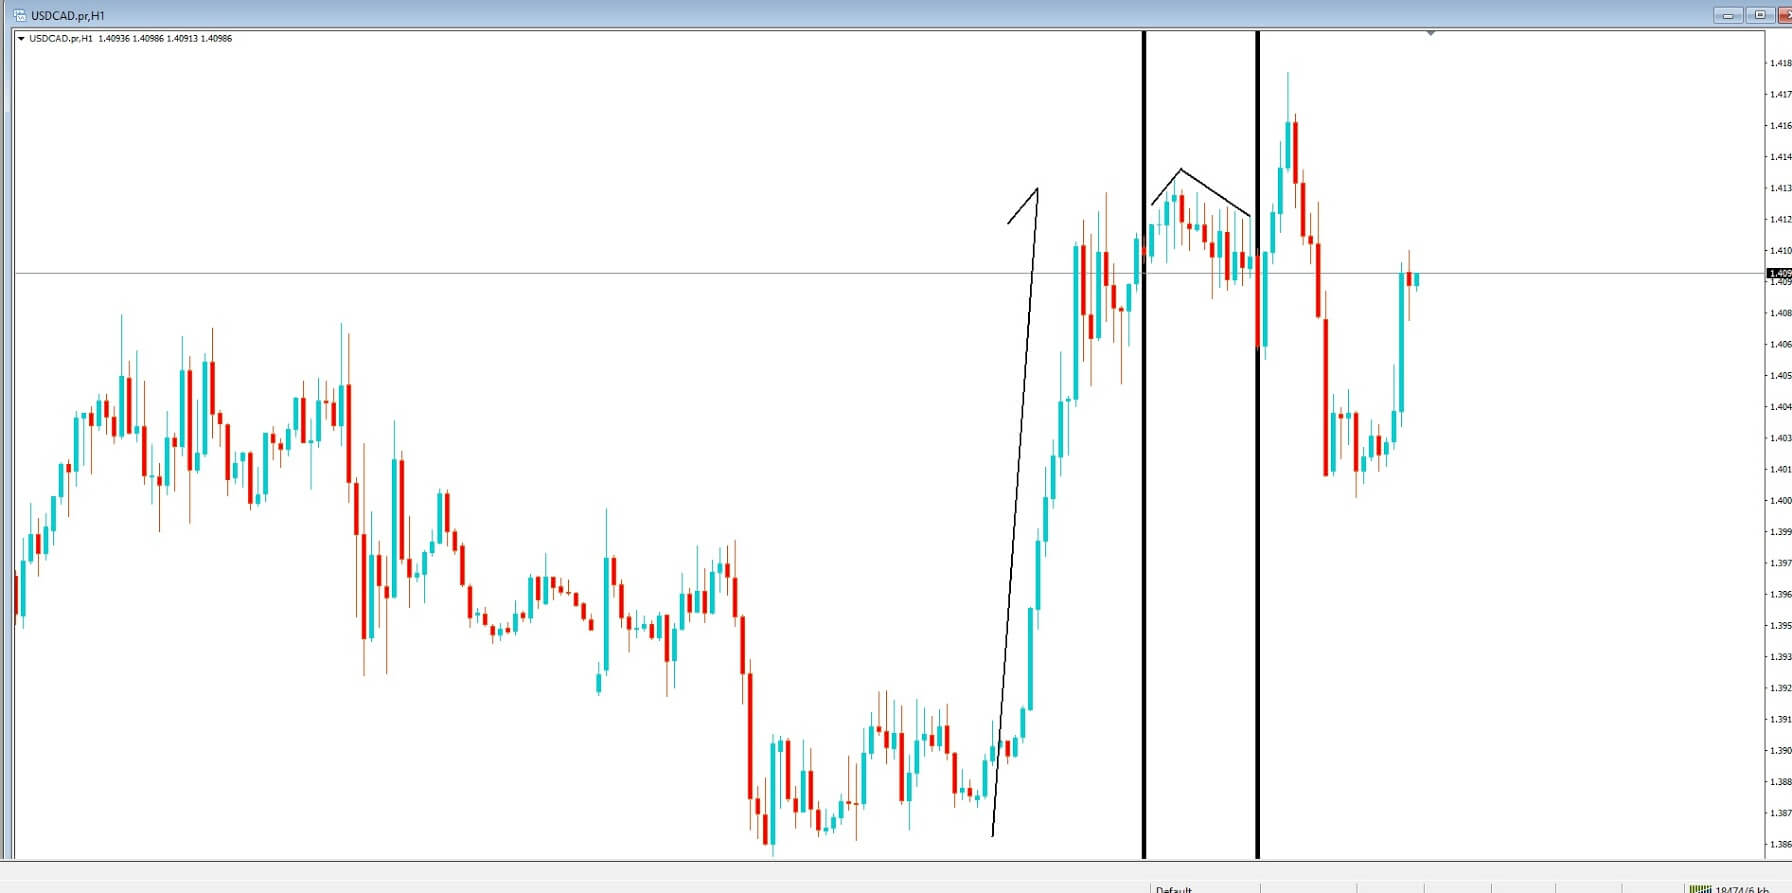
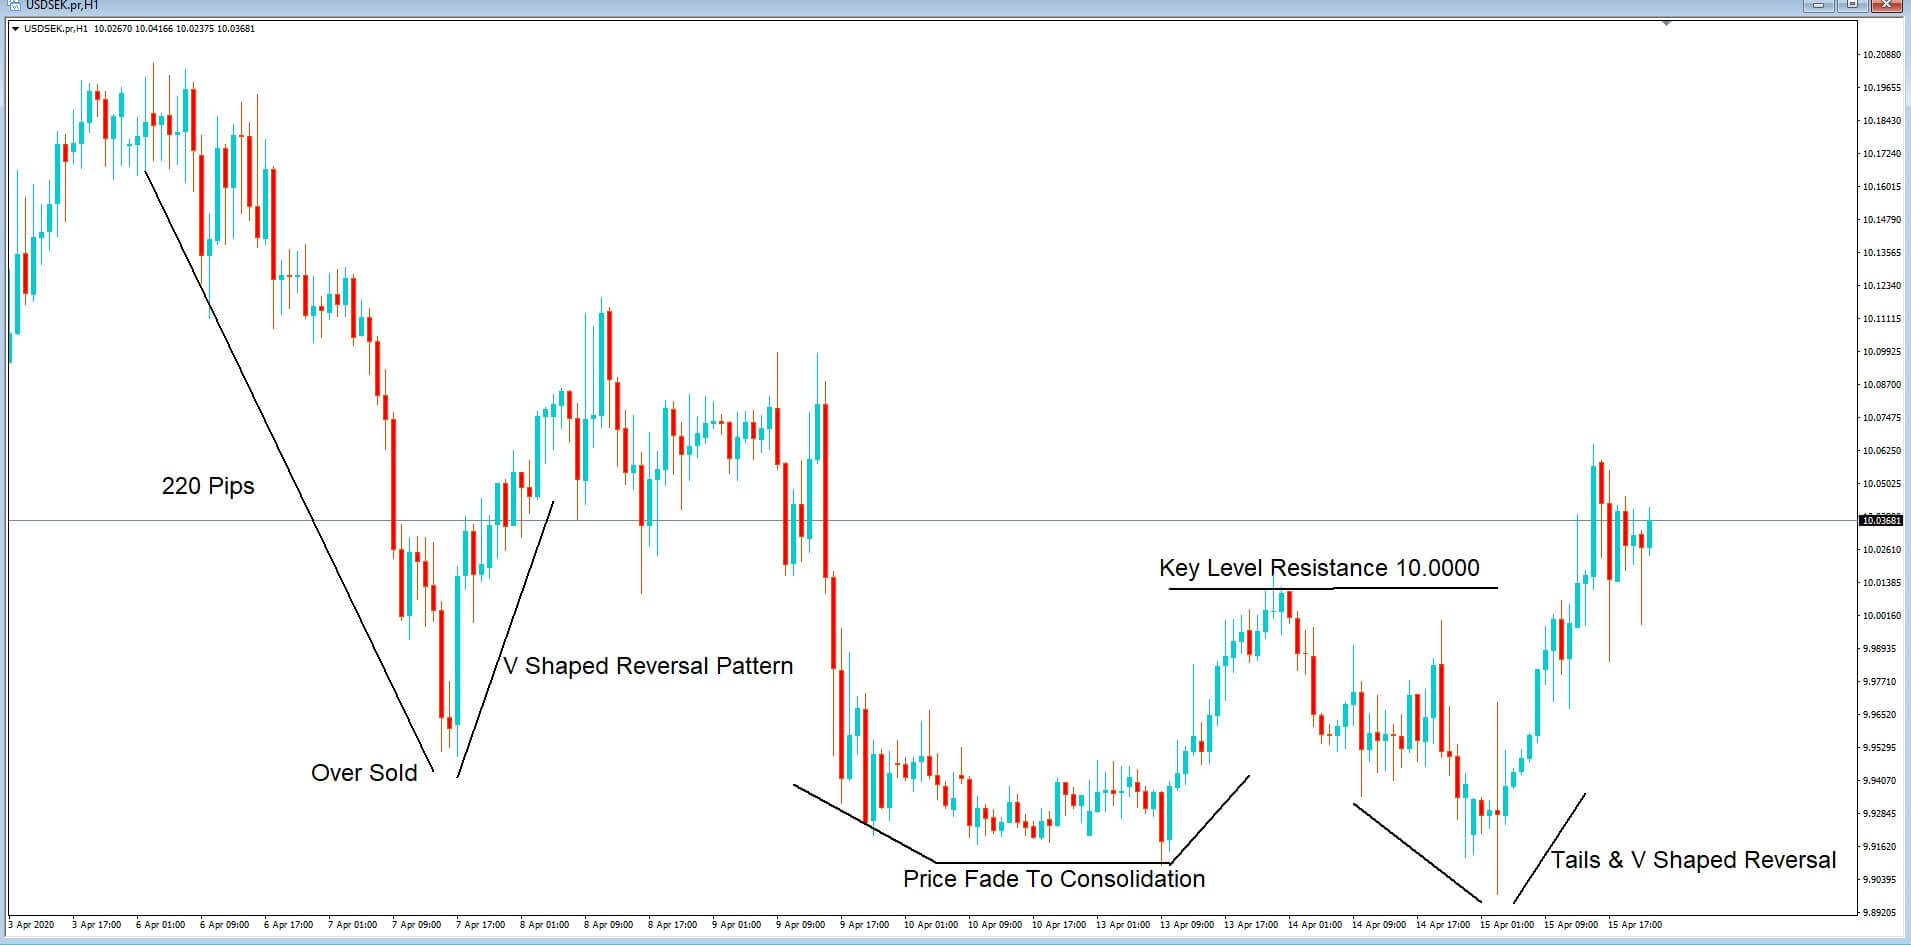 Here we have a 1-hour chart of the US dollar to Swedish Krona, or USDSEK, The first trend we see is a 220 pip move to the downside, which would have been considered as oversold and where price action is reversed in a classic v-shape reversal pattern.
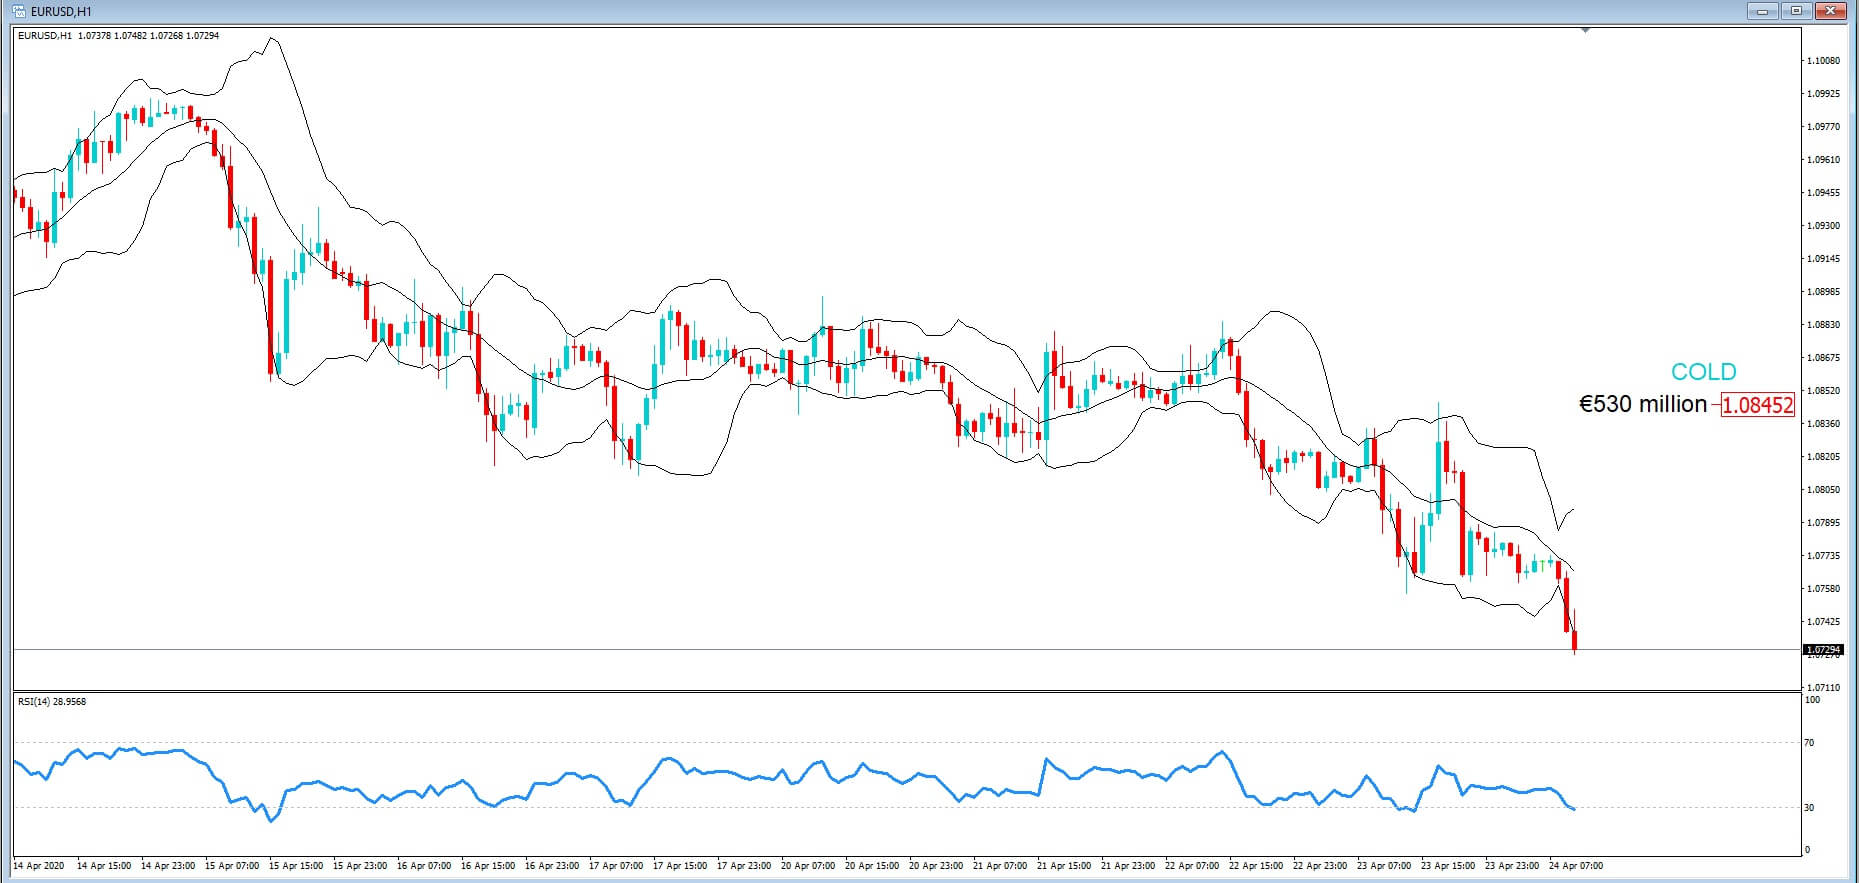


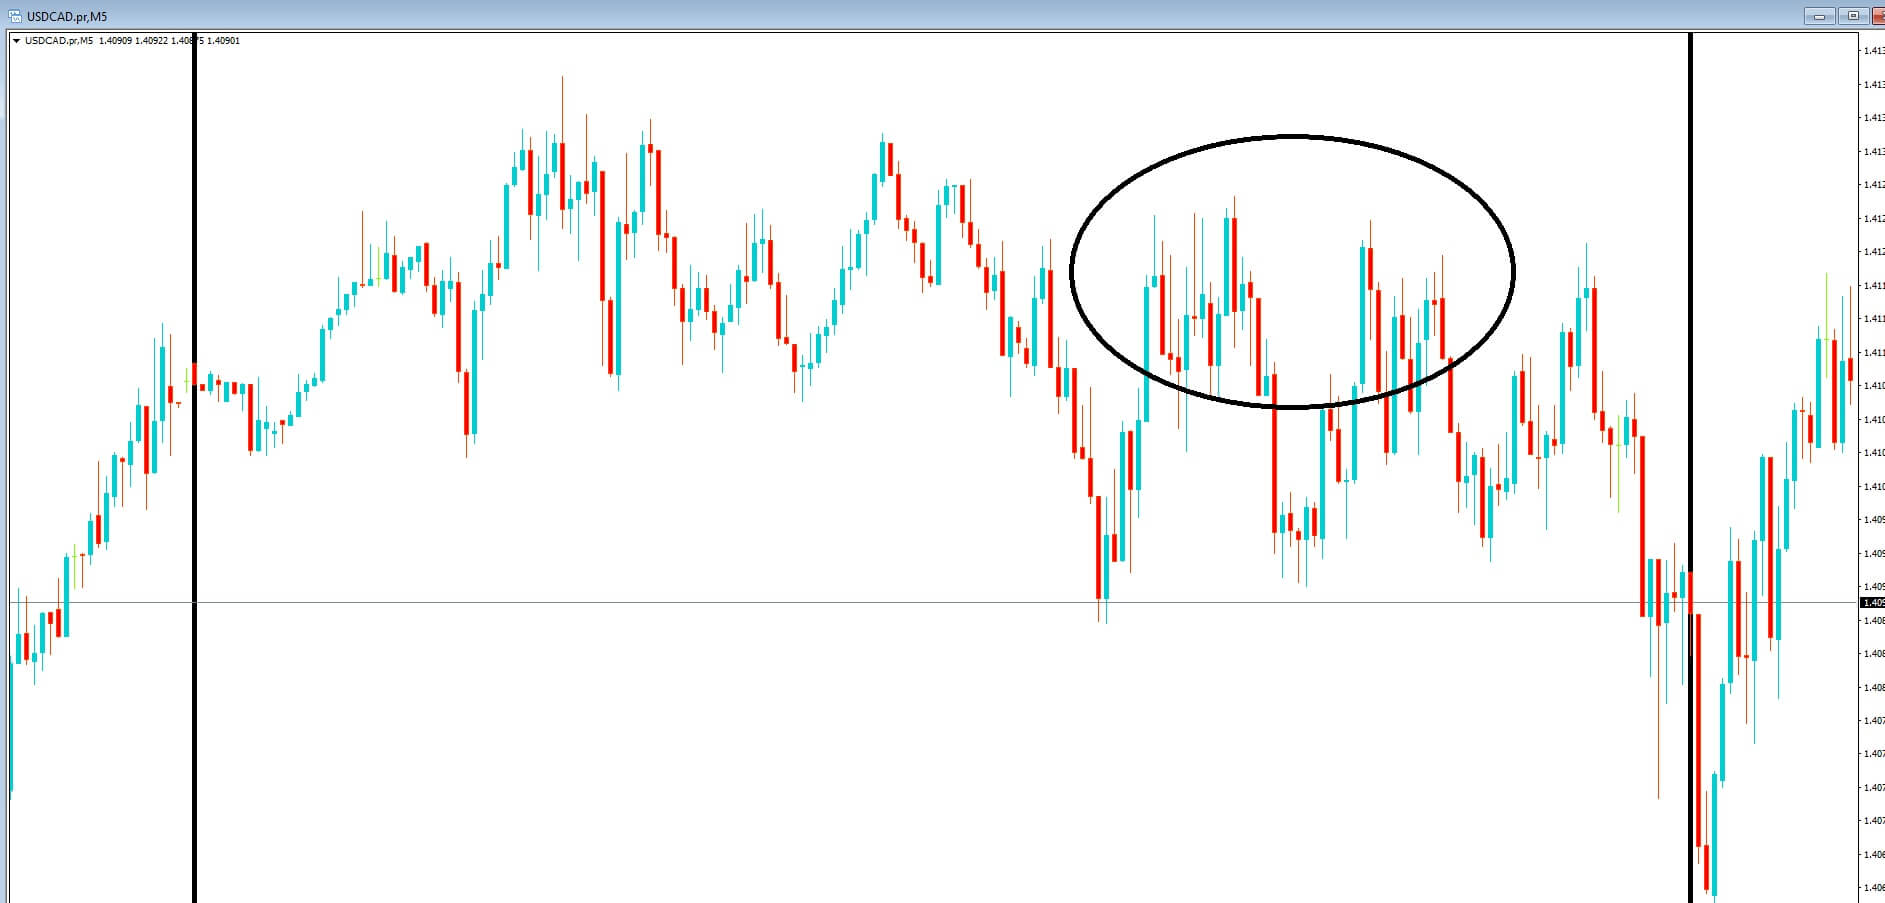


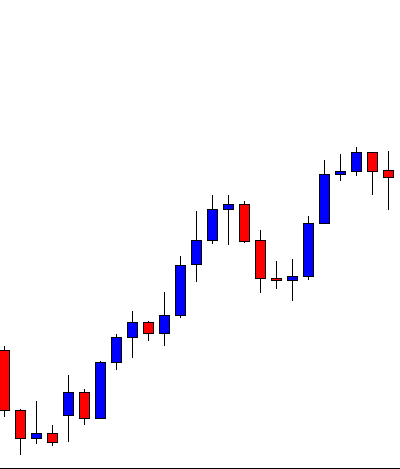
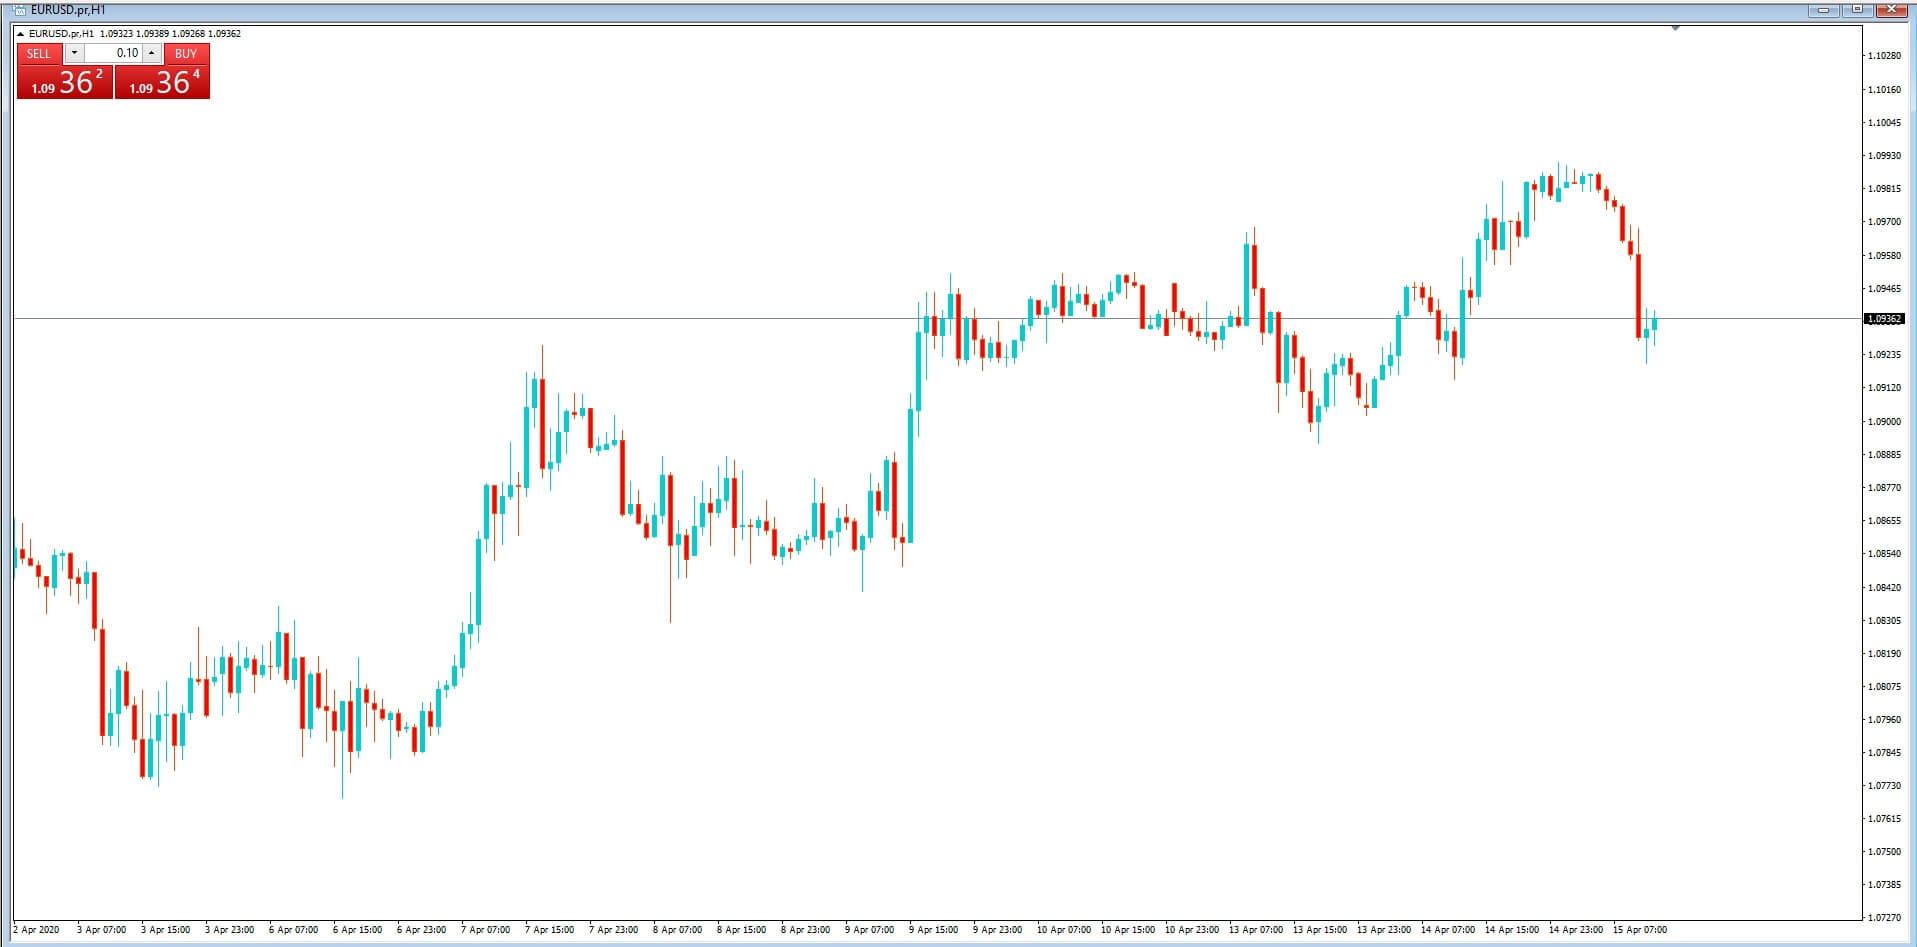 They flip flop from one chart to another looking for the opportunity which will give them a chance to bag a couple of hundred pips
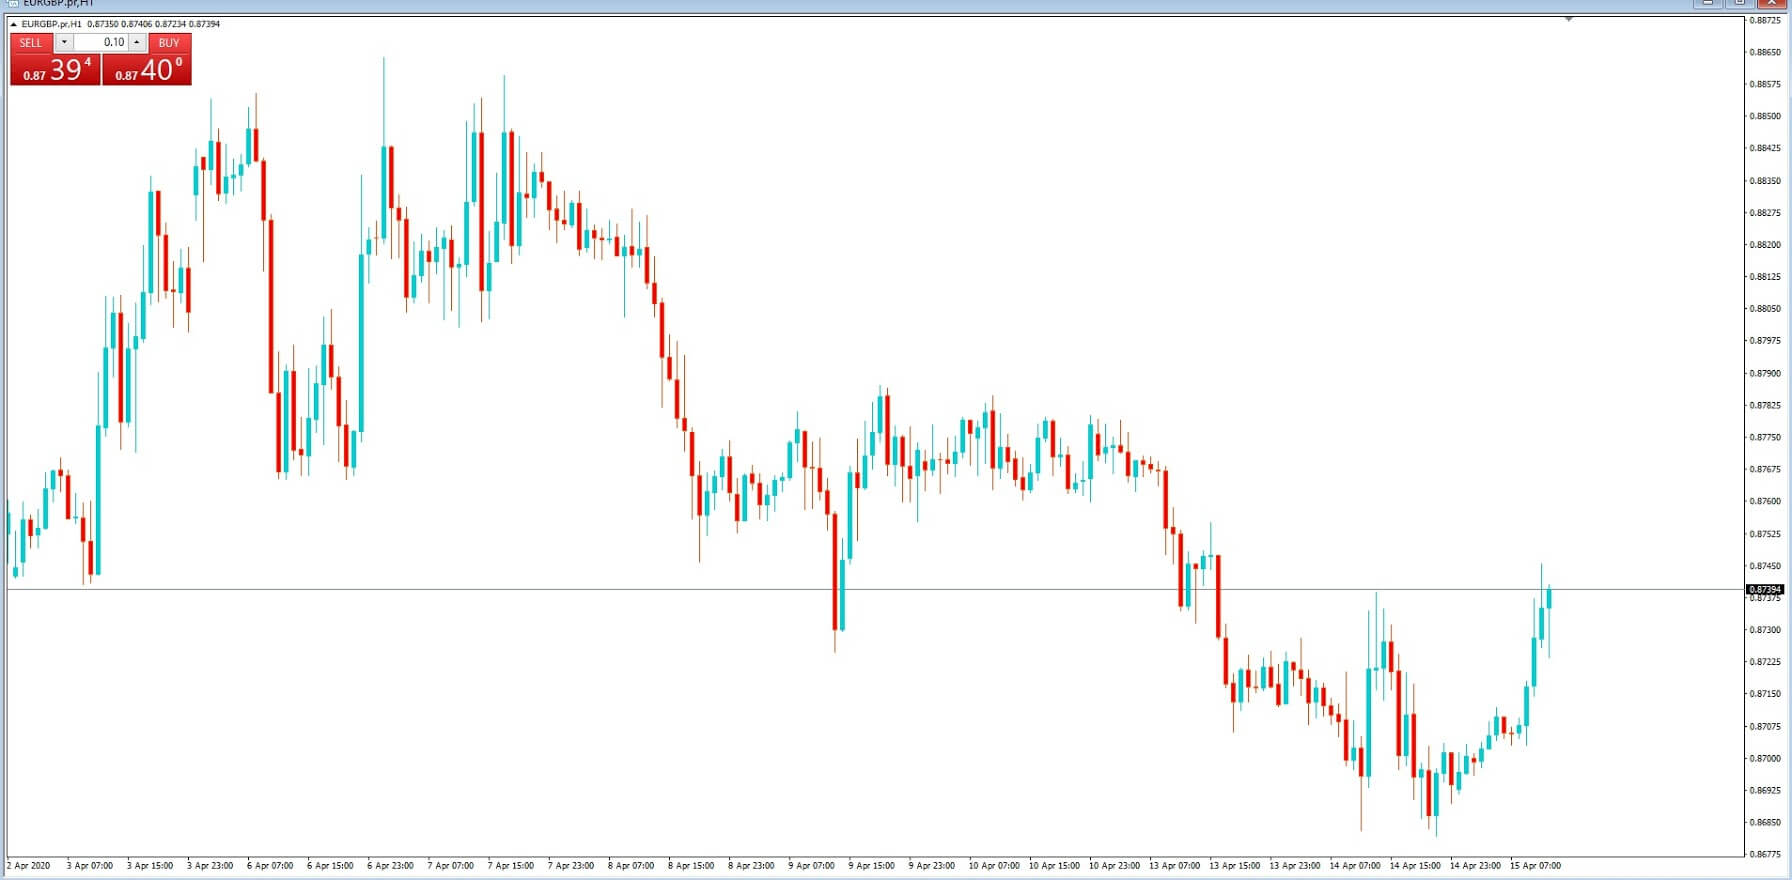
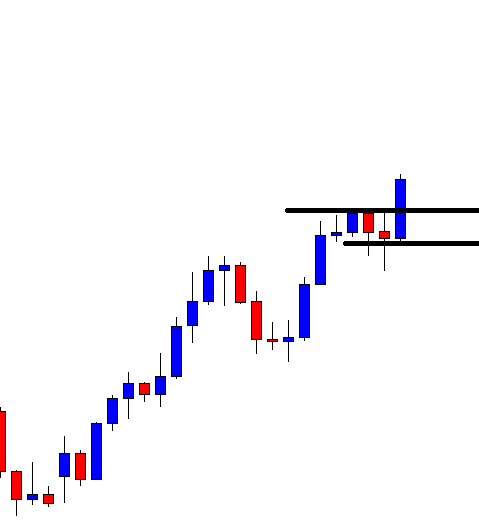
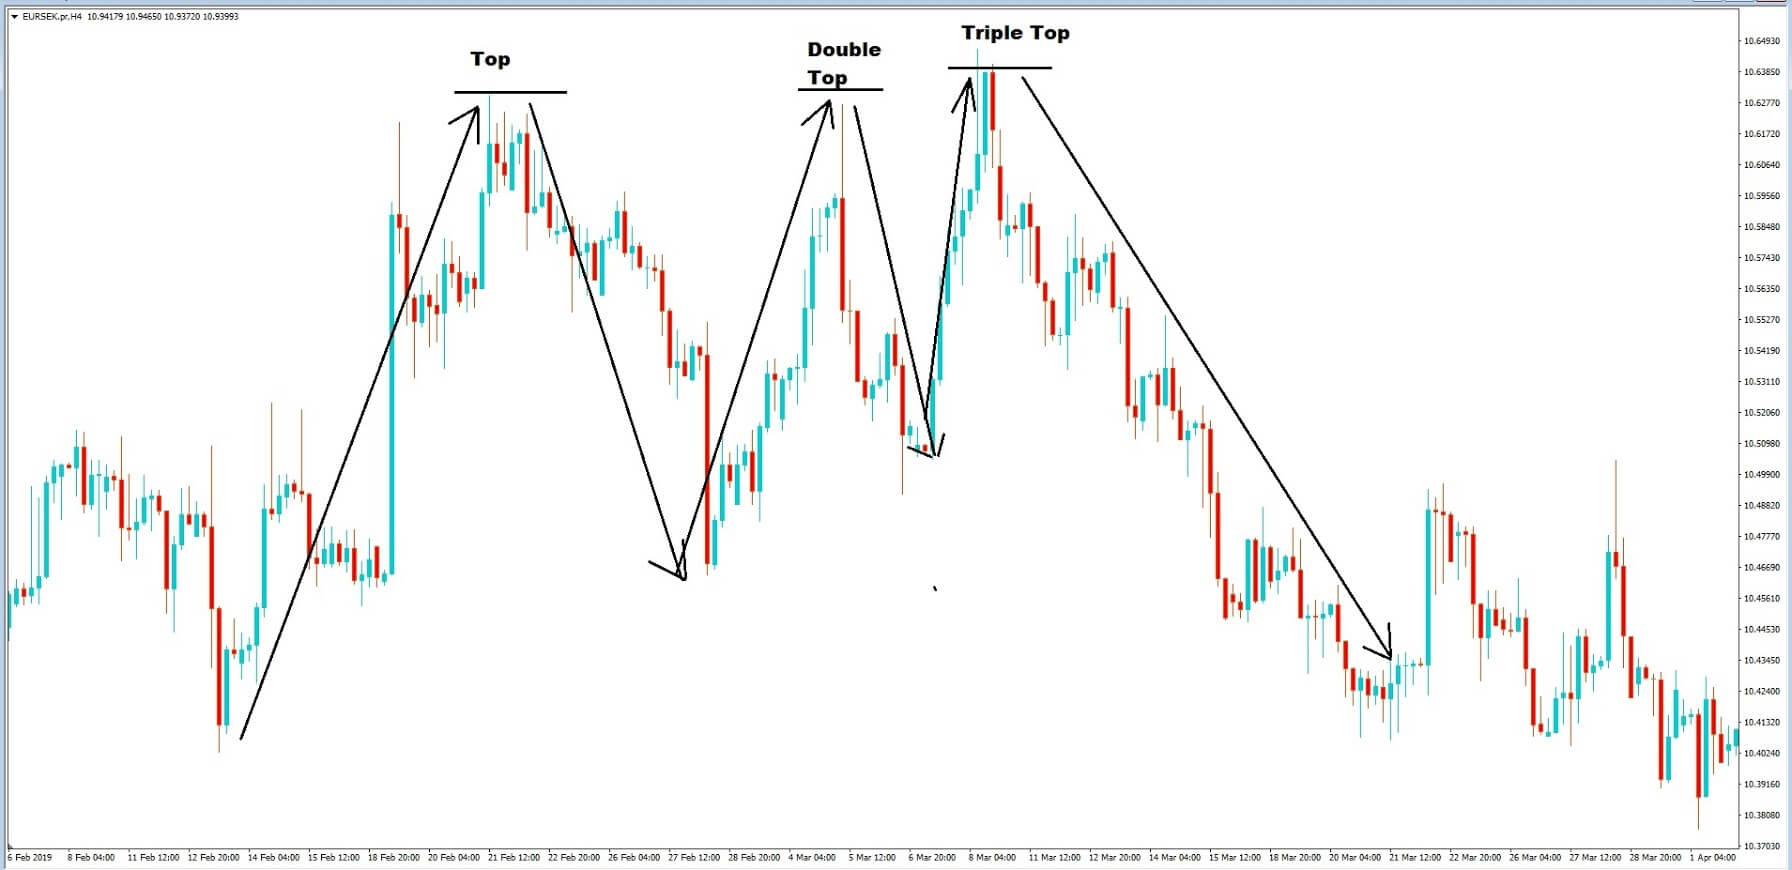
 They think they spot a trend and jump right in and execute a trade, thinking only of the money they could make. They often make the mistake of buying at the top of the market or selling at the bottom. Think they may have spotted a trend, and perhaps they have, or it might be that some news has just come out, and they make a split second impulsive decision to buy or sell a currency pair simply based on what they’ve seen or heard.
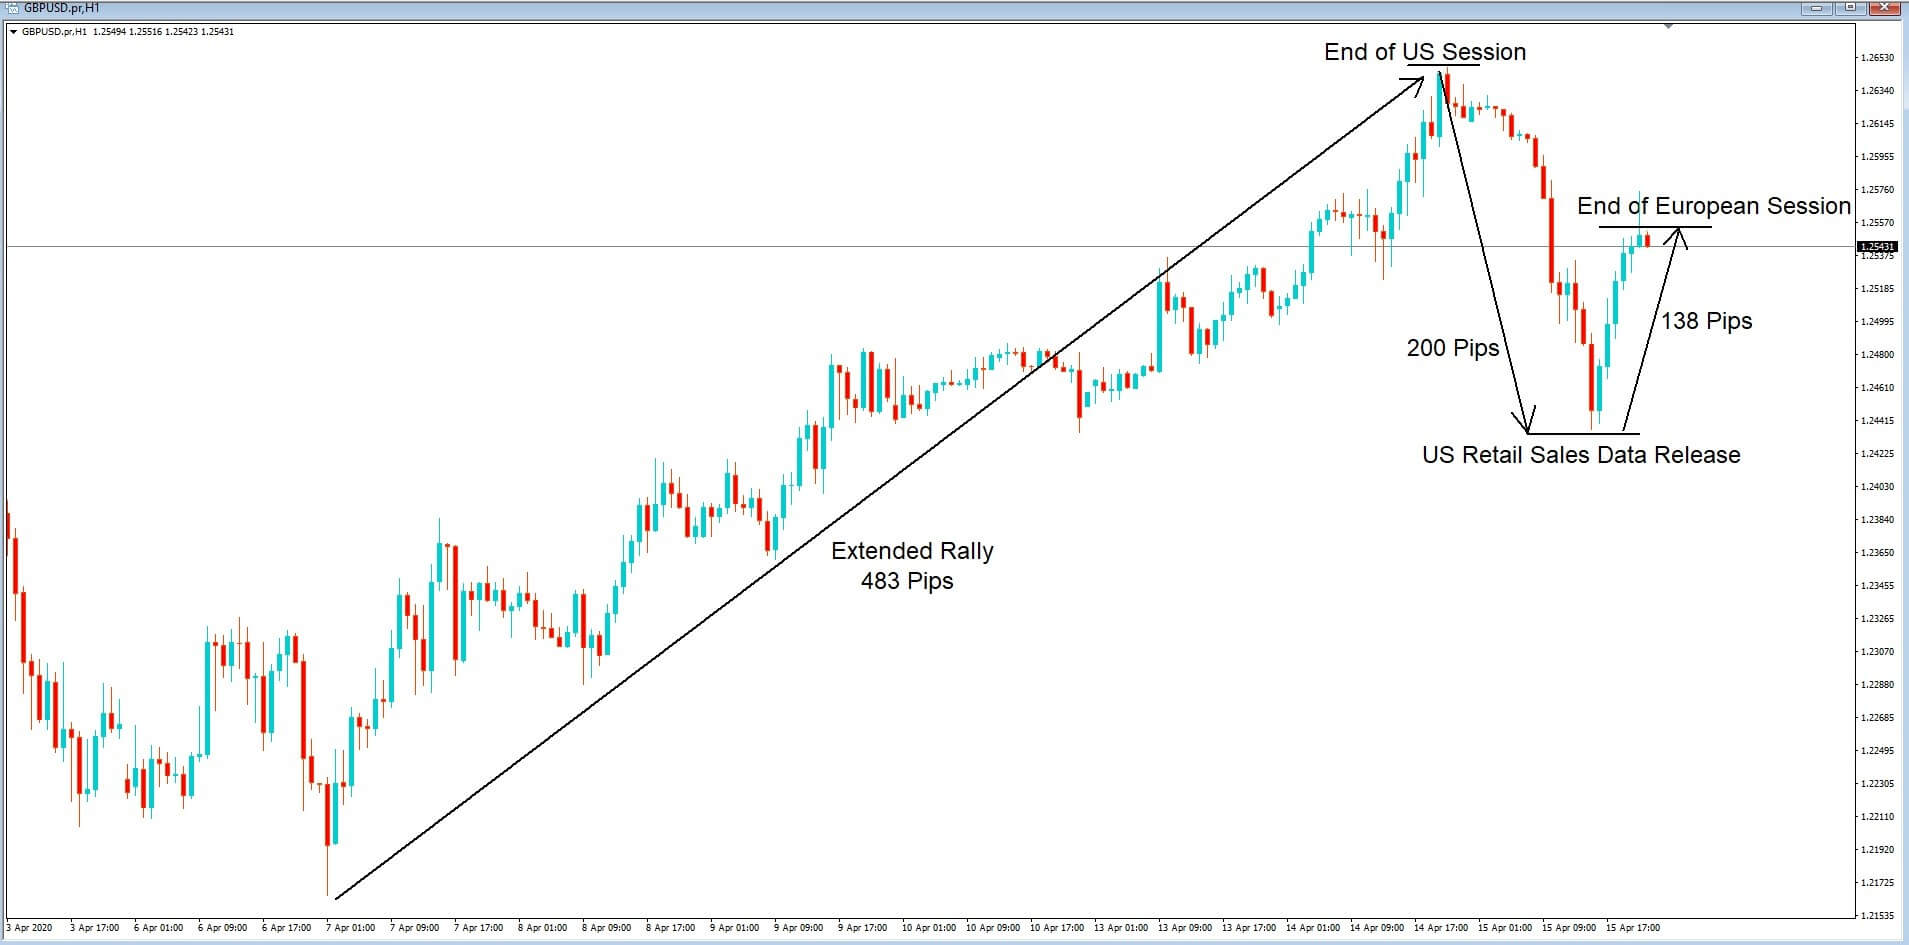
 So when are trends likely to end? Why do trends finish reverse or go into periods of consolidation? Typically trends will start to fade and finish at the end of