Impulsive waves are characterized by their directionality; thus creating trends; however, how the wave analyst can recognize the stage of the trend? To answer this question, we will present the canalization process.

Canalization
Until now, we presented a set of rules that allow that wave analyst to identify which kind of structure the price action is creating. However, these rules do not provide any clue about its target area.
To aid in solving this question, R.N. Elliott, in his Treatise, introduced the use of channels to identify the potential target zone of the next path.
Channels are a useful tool to recognize if an impulsive sequence is complete, and to identify the potential ending points of waves in progress.
In motive waves, there exist two kinds of base-line of channels; these are base-line 0-2 and 2-4. The way to trace them is as exposes the following figure.
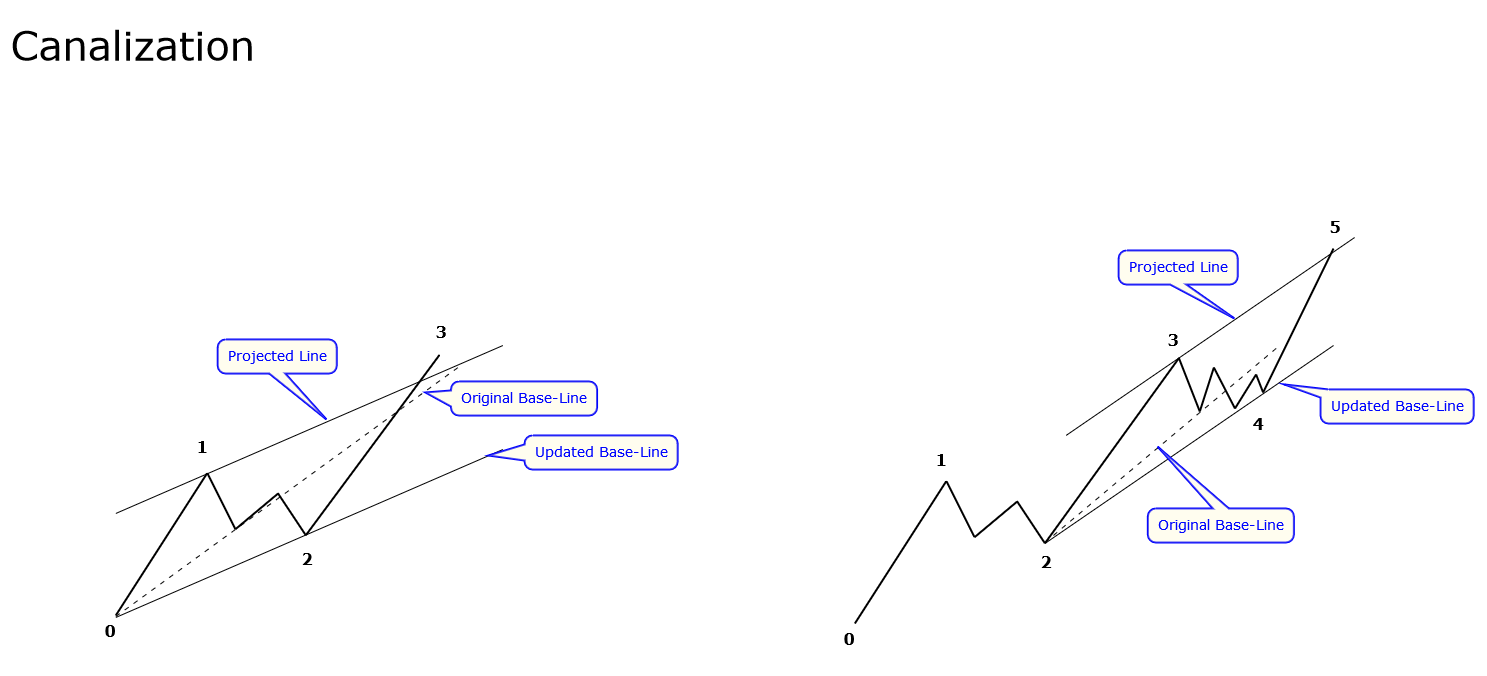
In the left-side figure, we observe the trace of the 0-2 line. The dotted line represents a preliminary 0-2 line that was violated by the price action. In this case, the wave analyst must update the base-line 0-2 until the confirmed end of wave 2.
Once the ending of the second wave and traced the base-line is validated, the wave analyst must project a line parallel to the 0-2 line at the end of wave 1, this channel will provide a potential target of the third wave.
Analogously, on the right-side figure, we distinguish the trace of base-line 2-4 and its projection at the end of wave 3. The channel projection will provide the potential end of the fifth wave.
The procedure for executing the canalization process is as described below.
Once the price has created the first impulse wave and, then, completed the second corrective wave, a base-line is projected linking the origin of the first impulse wave to the end of the second wave.
The base-line is then projected at the end of wave 1. This channel will provide the wave analyst with the potential target of wave 3.
When wave 3 is complete, the ends of wave 1 and 3 are joined, then a parallel line is projected towards the end of wave 2.
The projection of this channel will provide information about the possible end of wave 4.
Subsequently, once wave 4 is complete, the ends of waves 2 and 4 are joined, then the line parallel to the end of wave 3 is projected, this channel will provide the potential target of wave 5.
EURNZD – Channels Suggests a Five-Wave Sequence Completion
The following chart illustrates to EURNZD cross in its 4-hour timeframe. From the figure, we observe the rally developed by price action that began on January 24th, low at level 1.66642.

EURNZD made a first rally that boosted the price in five waves until 1.71764 level reached on last February 02nd. Once its first upward sequence has been completed, the price retraced in three waves.
The corrective process brought the price to find fresh buyers at 1.67854 on February 10th. The completion of waves (i) and (ii) allow us to trace the first channel in blue, from where the next path corresponds to wave (iii).
On the figure, we observe that the price extended its third upward sequence until 1.78755 level on March 02nd. Once this fresh higher high was reached, EURNZD started to consolidate in a fourth wave. The ending of this corrective structure drives us to trace the second upward channel in brown.
The upper-line breakout of the second ascending channel carried the EURNZD cross to complete its fifth wave that found resistance at 1.90725 level, reached on March 09th.
Once it peaked at 1.90725 level, the price action pierced the base-line of the second ascending channel, this movement could drive the cross to start a corrective sequence in the coming trading sessions.
Conclusions
In this article, we have seen how the use of channels can assist the wave analyst in the process of identifying impulse wave targets.
From the example exposed, we observed how the canalization process worked in the real market. It is essential to consider that the fifth wave can fail, and not surpass the upper-line of the ascending channel.
In this context, the wave analyst should consider the signals that can reflect the end of the five-wave sequence, for example, the base-line breakdown.
Suggested Readings
- Neely, G.; Mastering Elliott Wave: Presenting the Neely Method; Windsor Books; 2nd Edition (1990).
- Prechter, R.; The Major Works of R. N. Elliott; New Classics Library; 2nd Edition (1990).