
Corrective waves are formations produced between two impulsive movements. In this educational article, we’ll see the standard corrective patterns defined by R.N. Elliott.
The Basic Structure
R.N. Elliott, in his treatise, defined corrections as a movement that develops against the trend built by motive waves.
Corrective formations characterize themselves by having three internal segments. Its analysis process tends to be more difficult than on motive waves, due to different variations that can arise while the movement is in progress.
However, the corrective structure will be clear once the formation completes its internal sequence. In this context, the wave analyst has to be patient as the price action advances.
Rules Construction
In simple words, if price action doesn’t endorse the rules of an impulsive wave, as commented in our previous articles (read more), then the market advances in a corrective structure.
The basic, or standard, corrective patterns defined by Elliott are as follows:
- Flat (3-3-5)
- Zigzag (5-3-5)
- Triangle (3-3-3-3-3)
Similarly as the alternations on impulsive waves, corrective waves also alternate in terms of price and time.
Price: This kind of alternation applies only to the zigzag pattern. Wave A will alternate with B in terms of price; wave B will be a 61.8% or lower than the wave A length.
Time: The alternation in terms of time acquires more relevance. In particular, if the first segment elapses a specific length of time, the second leg will advance in a related 61.8% or 161.8% of the time spent by wave A.
Finally, the third segment will last similar to one of the previous sections or be 61.8 or 161.8% span of one of the two earlier waves.
Flat Pattern
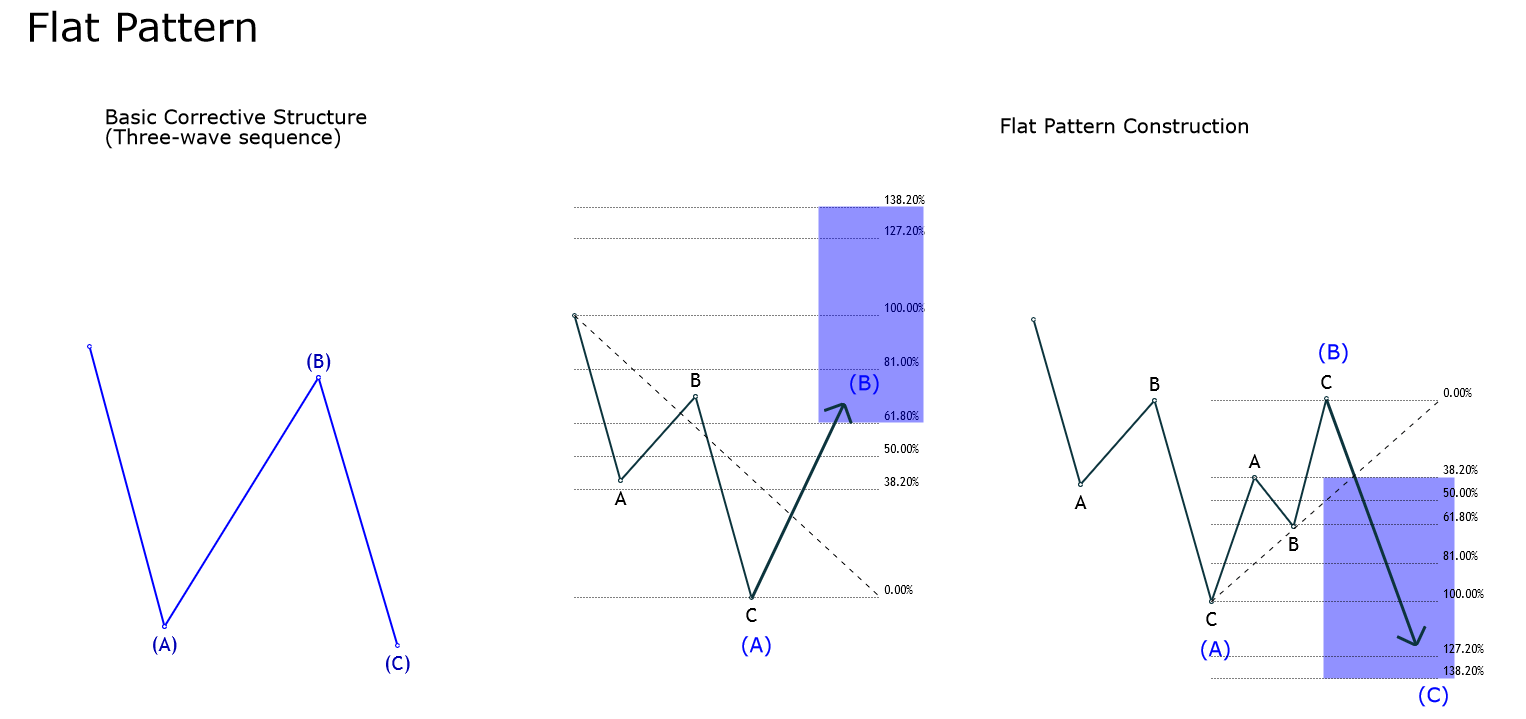
The flat pattern is characterized by having an internal subdivision that follows a 3-3-5 sequence. The next figure shows its structure.
Likely, its most important characteristic is that among the standard corrective formations, this pattern has the broadest kind of variations.
The construction process and its basic rules are as follows:
Once price completes its first movement against the trend, and its form holds an internal three-segment subdivision, the recovery developed by the next sequence has to be, also formed by three internal waves that advance at least 61.8% of the first decline.
Finally, the price progression of the C wave must be over 38.2% greater than wave A.
The flat pattern has several variations defined in terms of the strength of its wave B, wave C, or both.
To understand what type of flat formation and its depth the market is developing, we should trace two parallel horizontal lines from the A wave extremes. Thus, based on the obtained evidence, we can conclude that:
- If wave B moves between 61.8% and 81%, the flat pattern develops a weak wave B. In this case, the wave C should be at least 61.8% of wave B.
- If wave B moves between 81% and 100%, then the flat pattern advances in a normal wave B. In this scenario, there are two options for wave C, the failure, and the extended wave C.
- Finally, if wave B extends over 100% to 127.2% of the A wave, then we are in the presence of a strong wave B. In this case, waves A and C should be similar in terms of price.
The U.S. Dollar Index and its Flat Pattern
The U.S. Dollar Index (DXY), in its 2-hour chart, shows the progression that price developed in five waves from June 25th, 2019 low at 95.84.
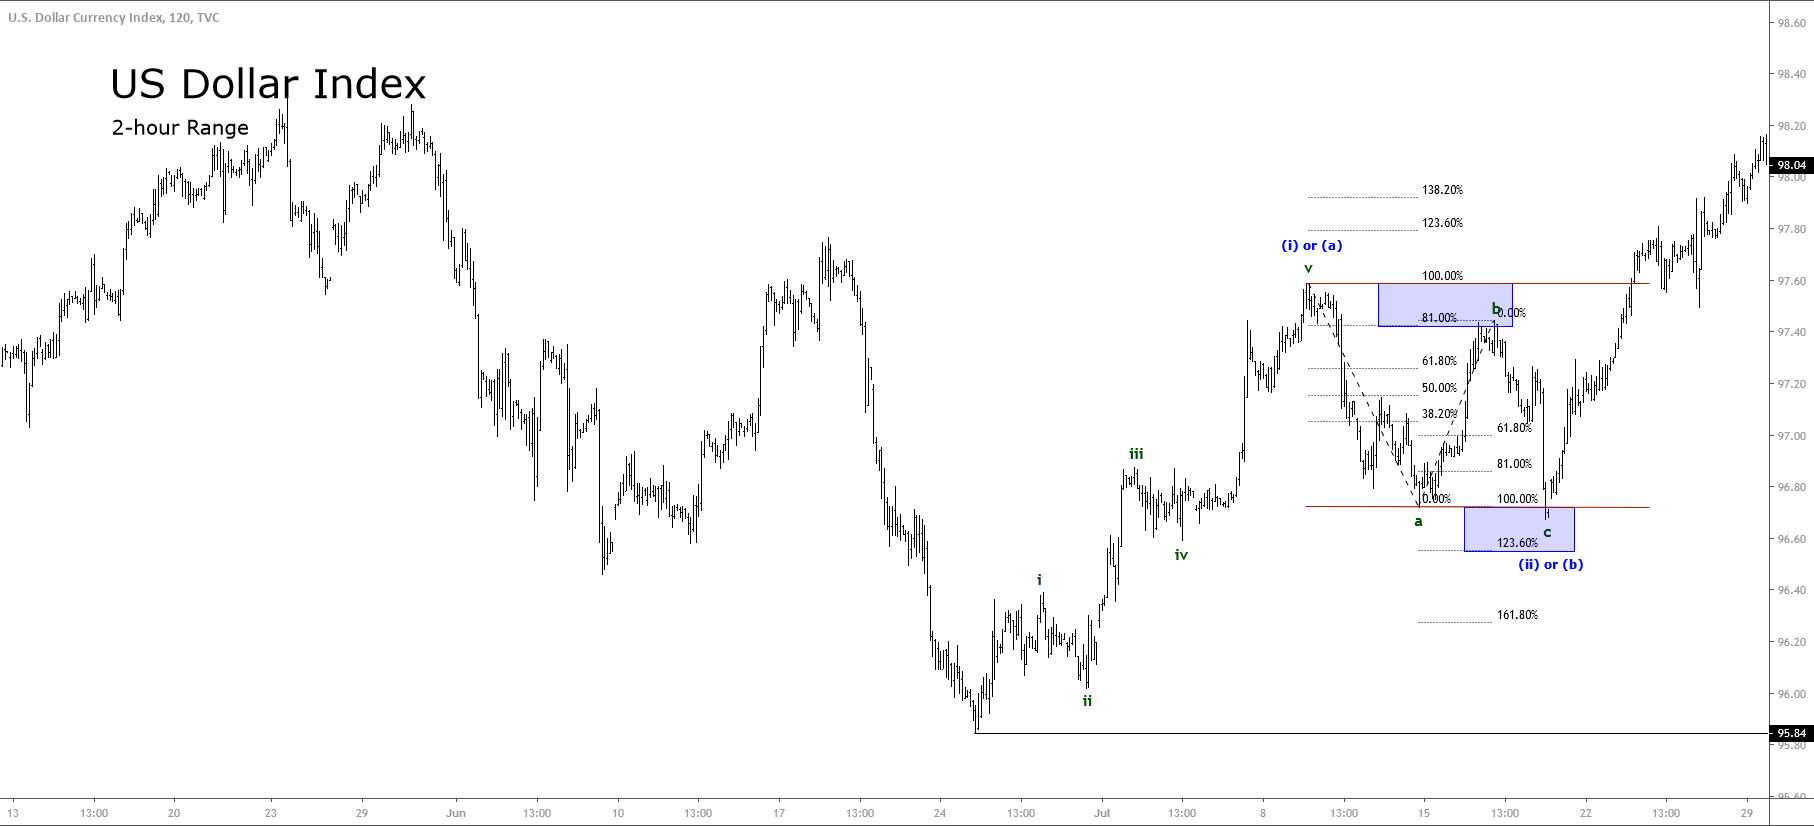
The five-wave sequence identified in green was completed on July 09th at 97.59, from where the Greenback began to retrace in three waves. The figure reveals that after having completed the first decline identified as wave “a” in green, DXY bounced slightly over 81% of wave a, which makes us conclude that the U.S. Dollar index runs in a potential normal flat pattern.
The next decline corresponds to wave c; the figure shows that once pierced slightly below the end of wave a, the price found fresh buyers at 96.67 completing the three-wave sequence of the flat pattern.
Conclusions.
In this educational article, we review the concepts of corrective waves and its rules of construction. Similarly, we presented how corrective waves alternate in terms of price and time. These new concepts of alternation add to the definitions given in our basic level article on corrective waves.
On the other hand, we presented the flat pattern that the Dollar Index has recently developed and how this formation did not achieve the Fibonacci levels as stated by Gleen Neely in his work “Mastering Elliott Wave.”
In the next article, we will present the zigzag pattern and its analysis process.
Suggested Readings
- Neely, G.; Mastering Elliott Wave: Presenting the Neely Method; Windsor Books; 2nd Edition (1990).
- Prechter, R.; The Major Works of R. N. Elliott; New Classics Library; 2nd Edition (1990).