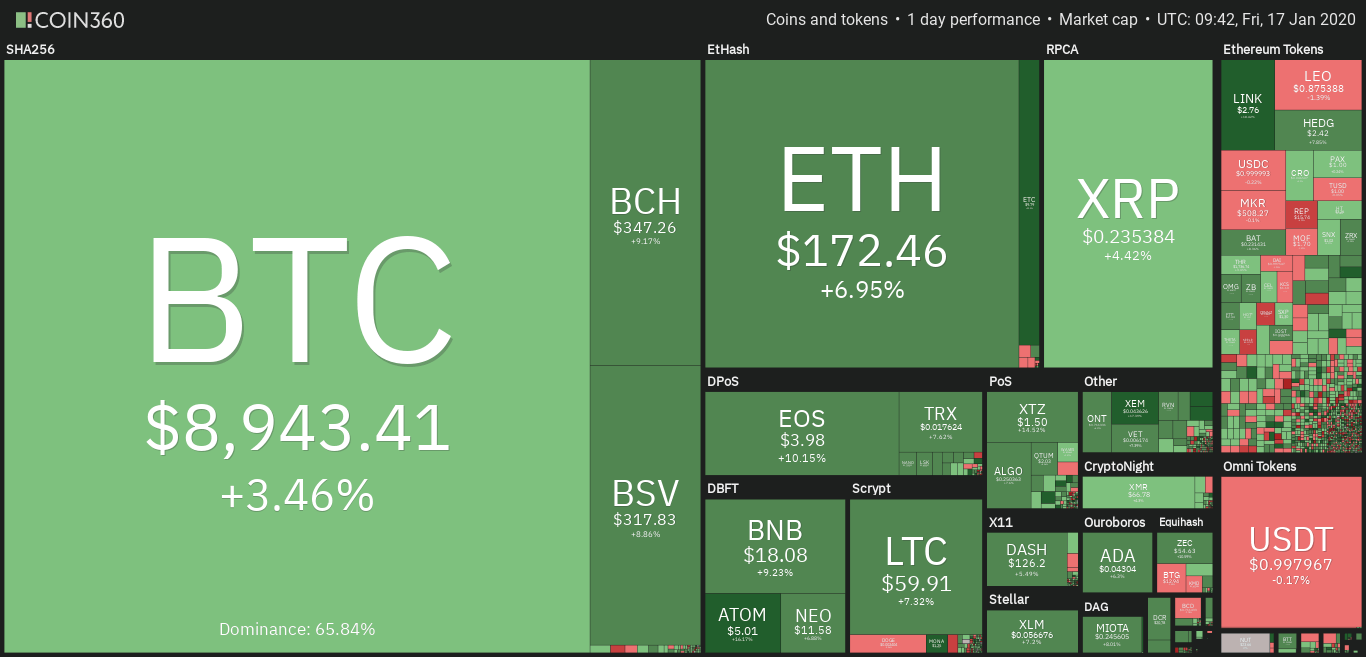
The crypto market is having a great weekend so far. Bitcoin, as the most prominent cryptocurrency, stepped above $9,000 level and is comfortably above it. Bitcoin’s price went up 3.45% on the day. It is currently trading for $9,359. Meanwhile, Ethereum gained 3.49% on the day, while XRP went up 2.97%.
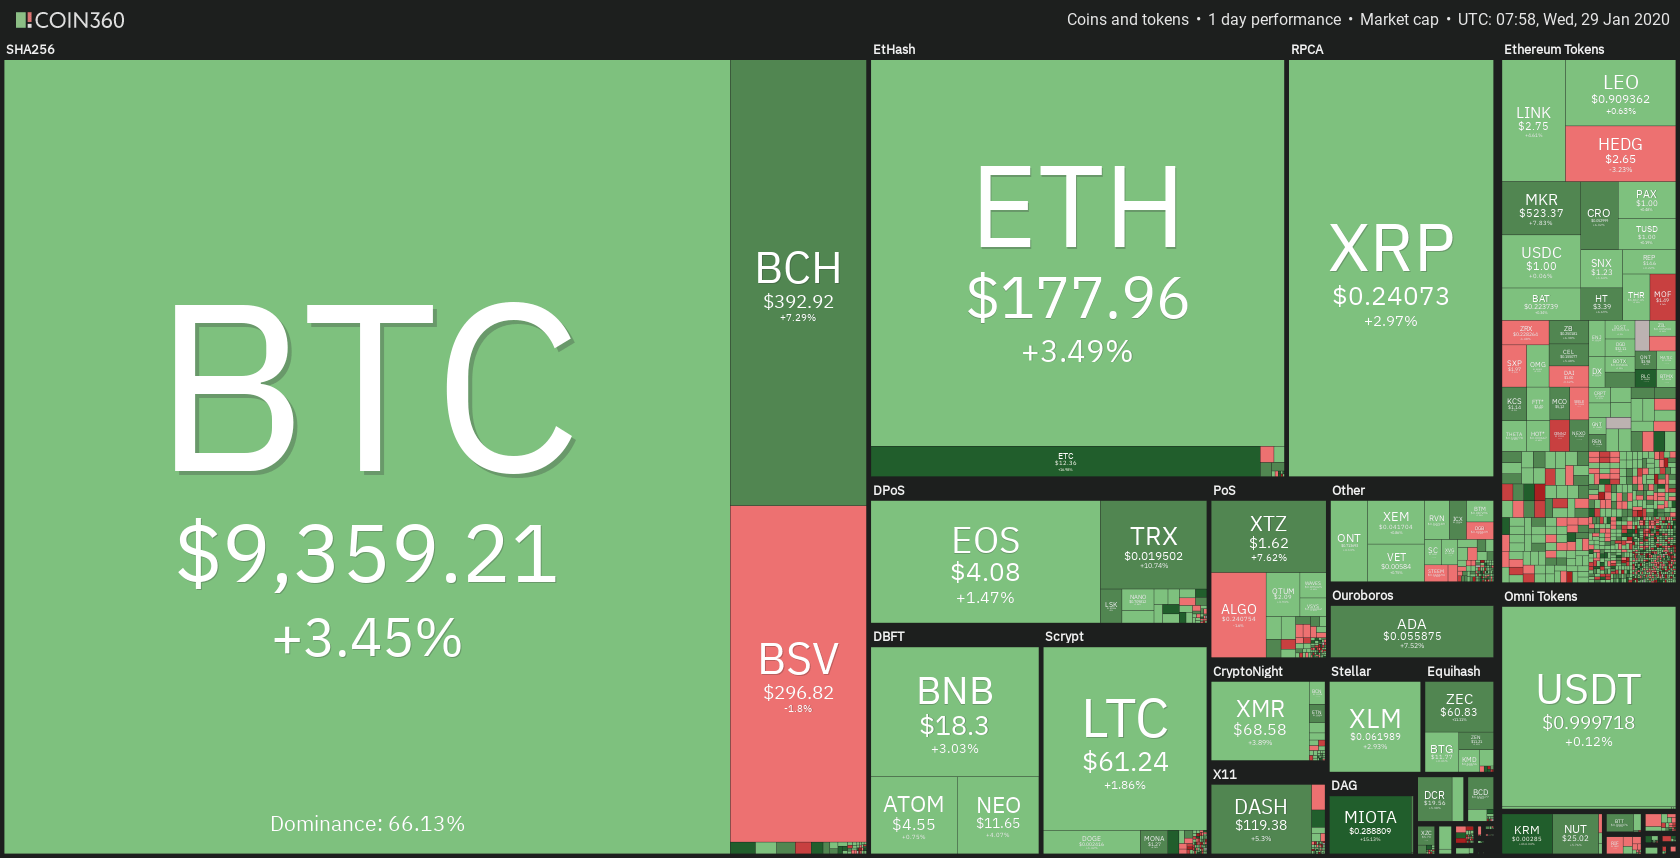
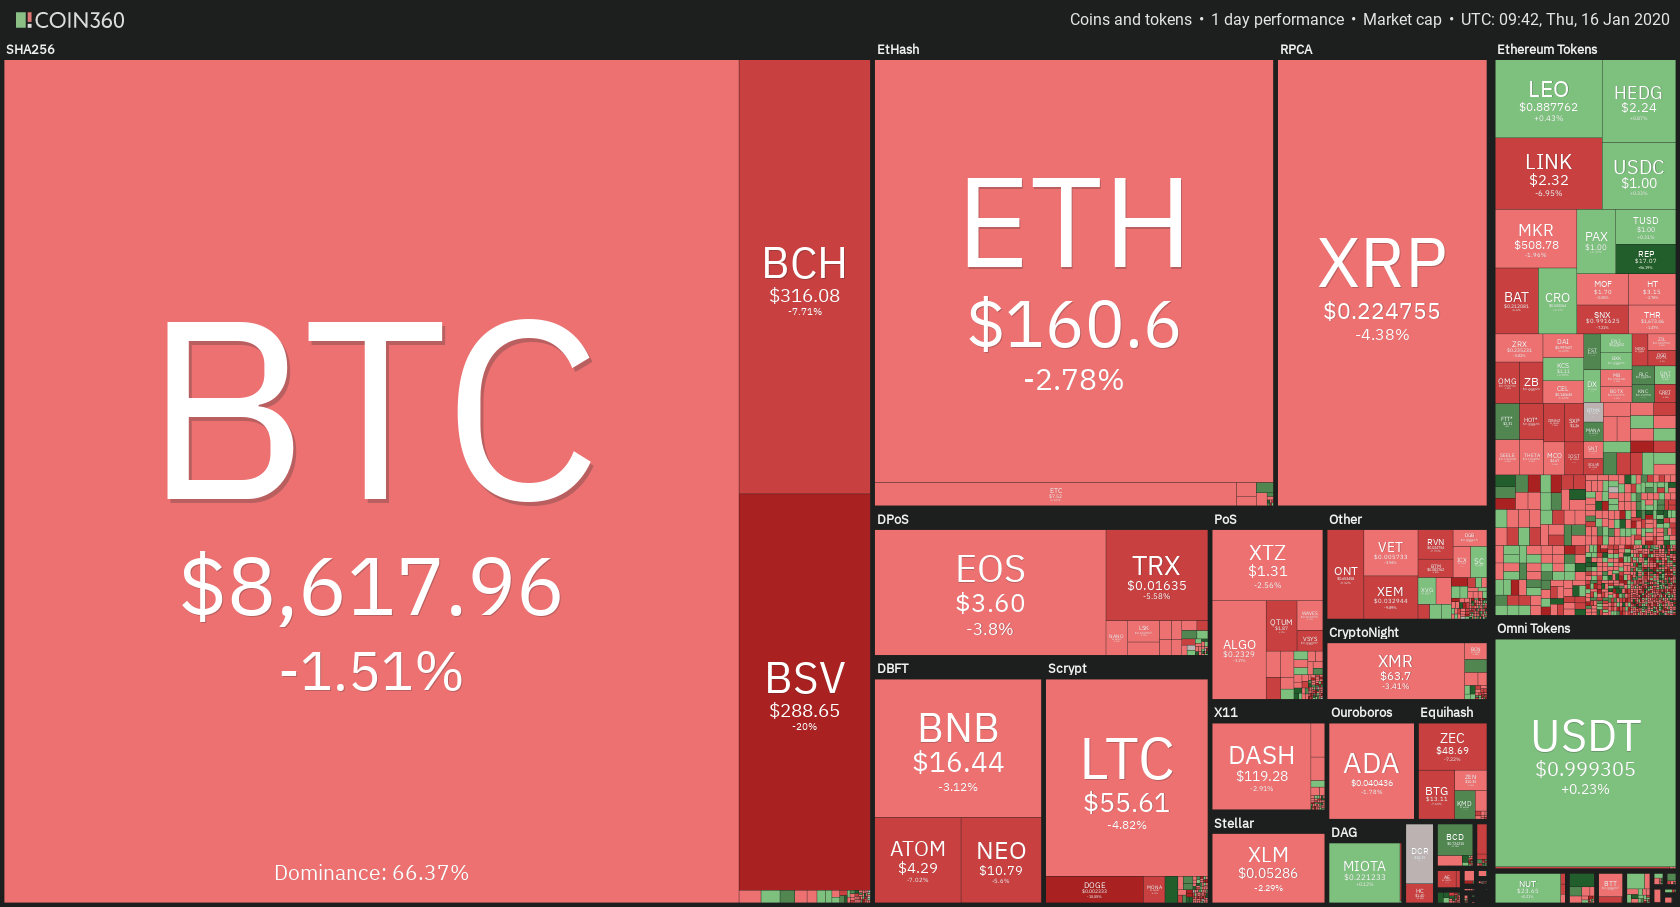
BlockStamp took today’s most prominent daily gainer title with gains of 104.92%. On the other side, Molecular Future lost 7.90% on the day, which made it the most prominent daily loser.
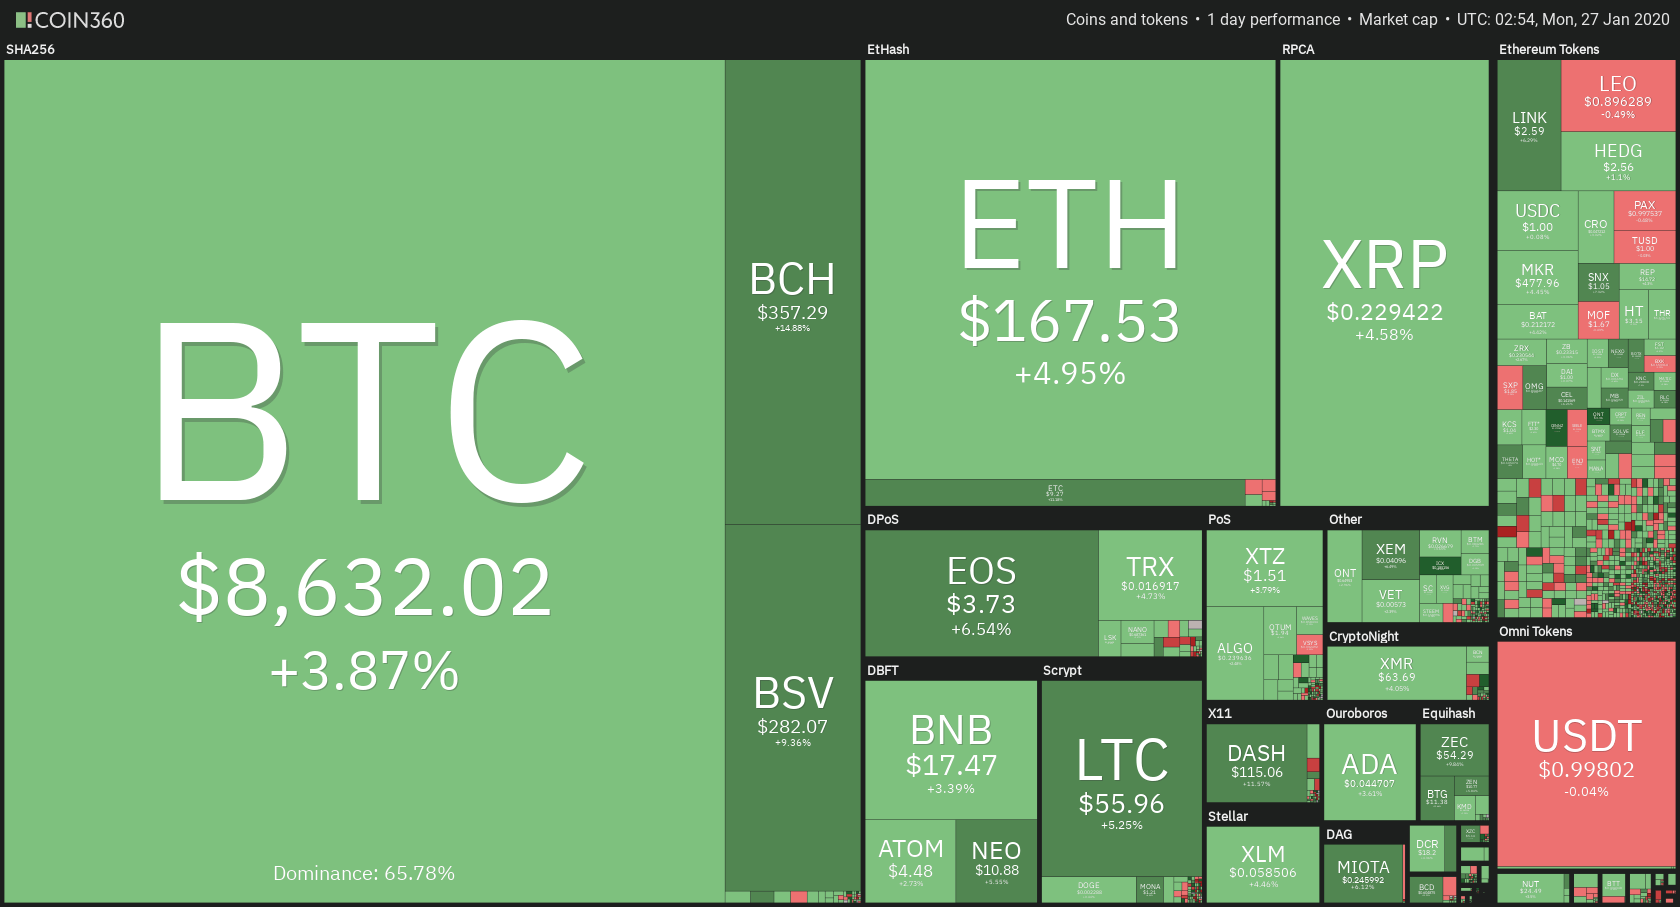
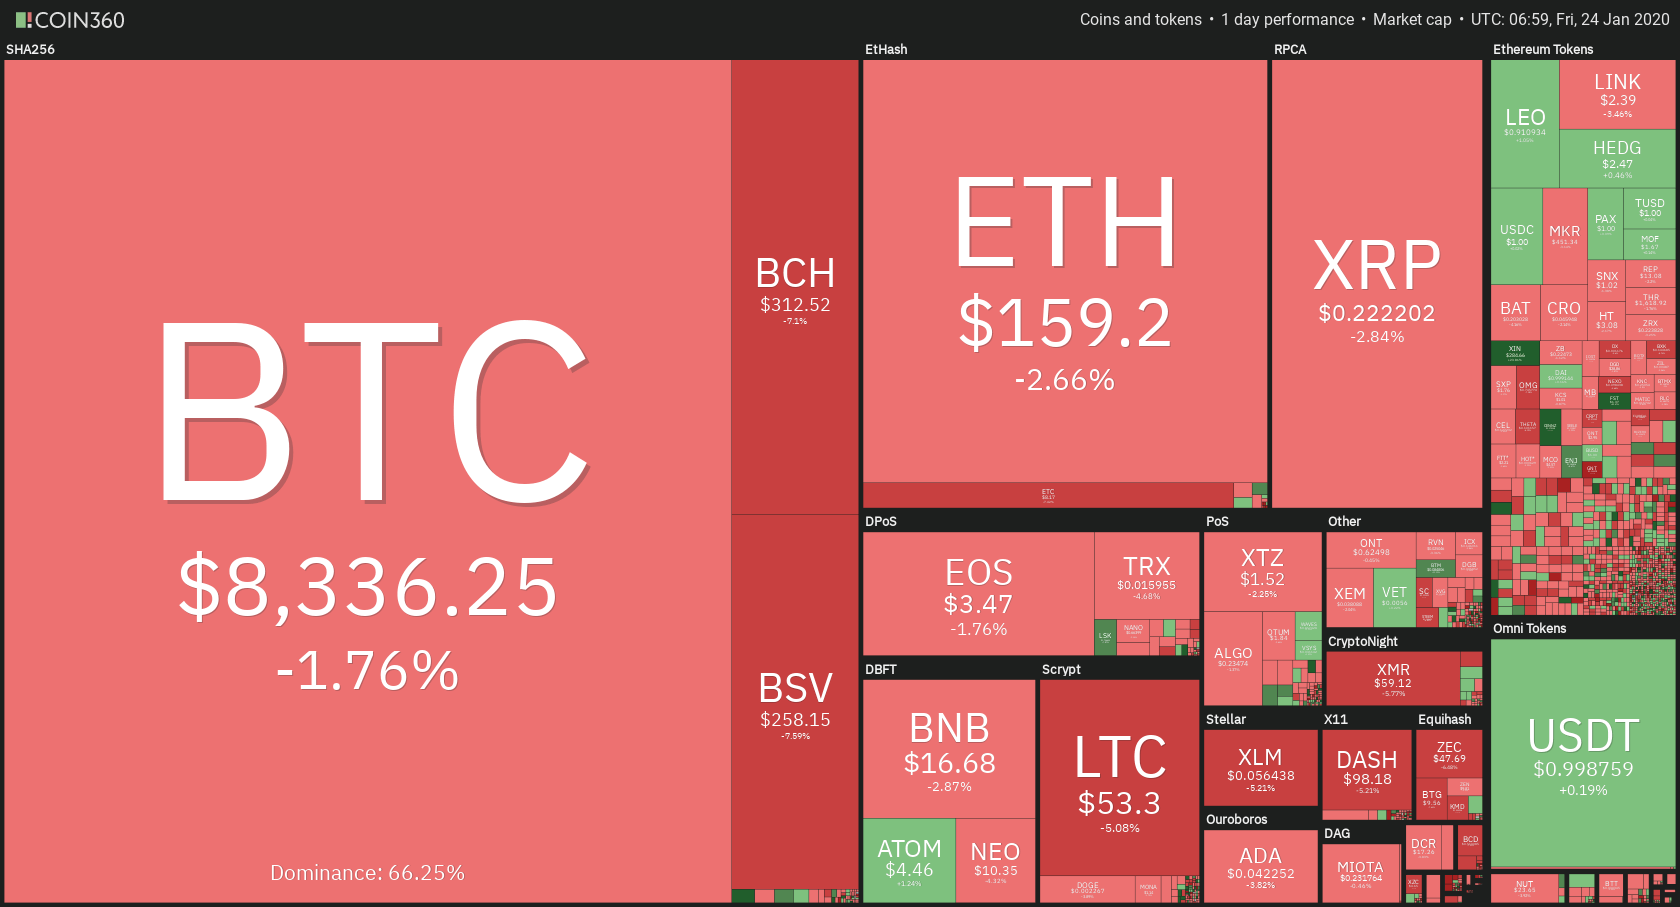
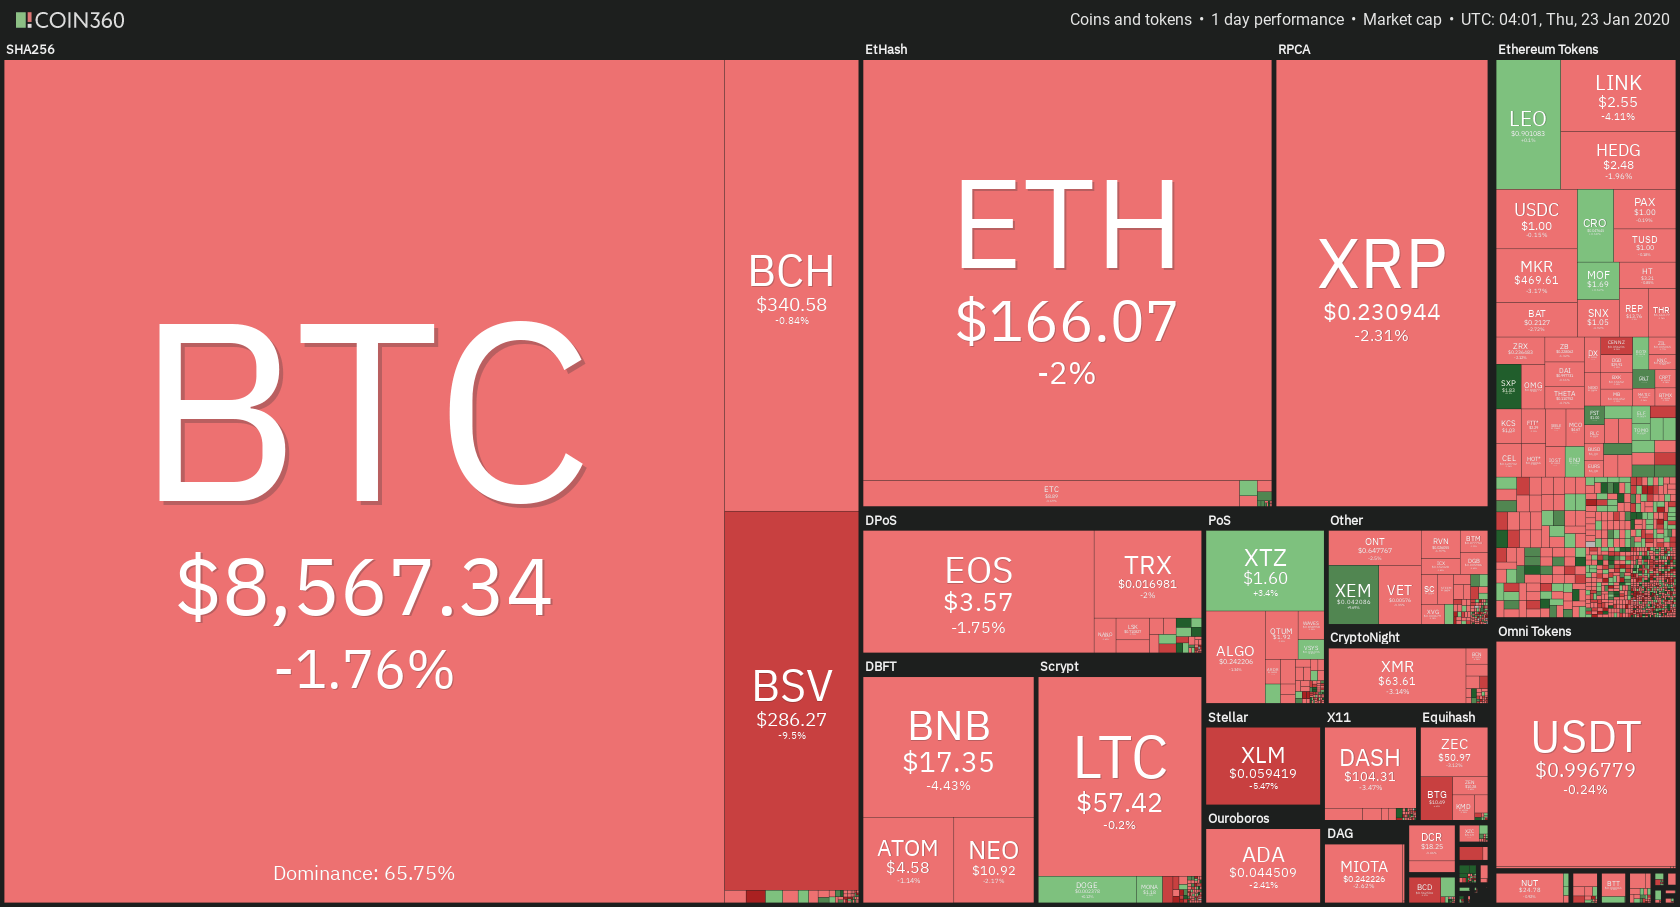
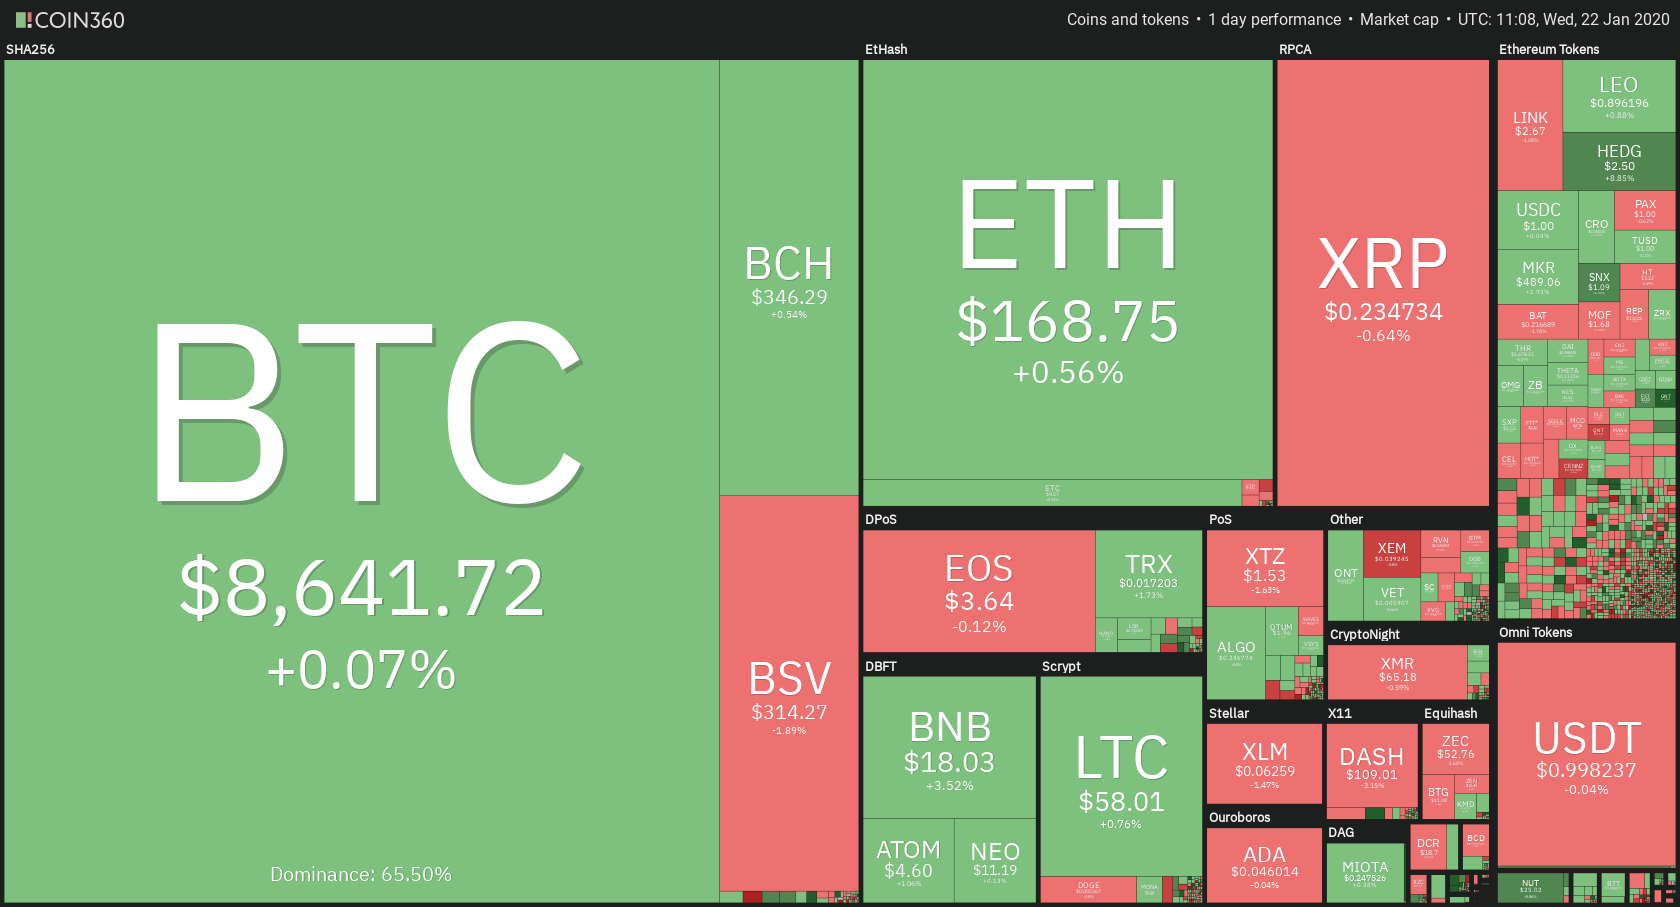
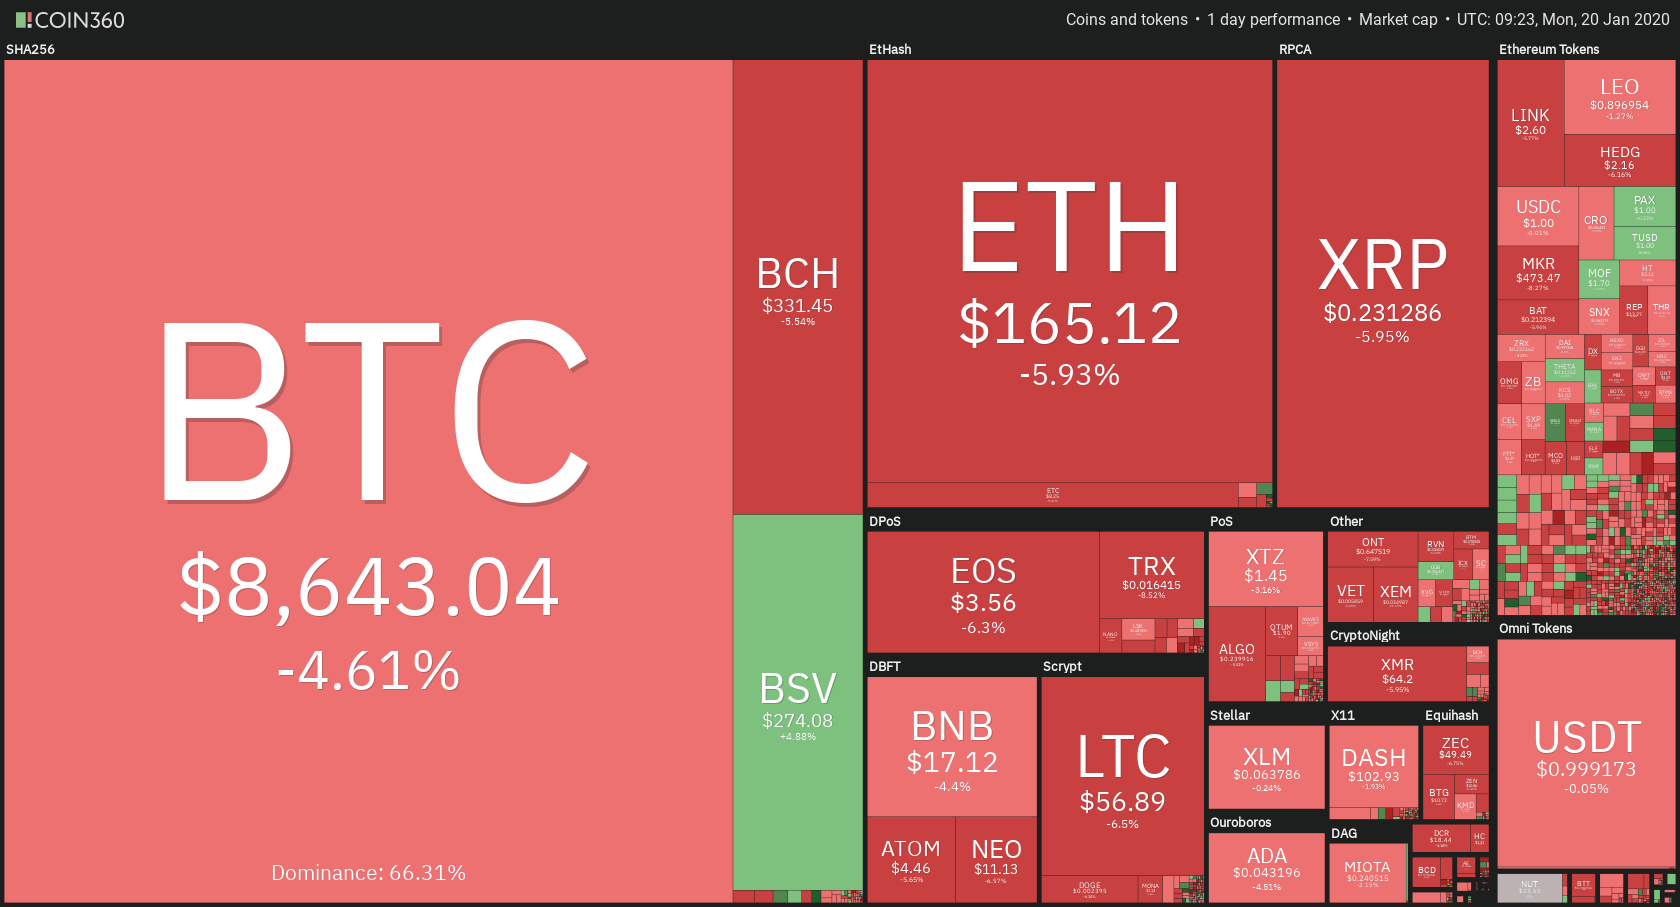
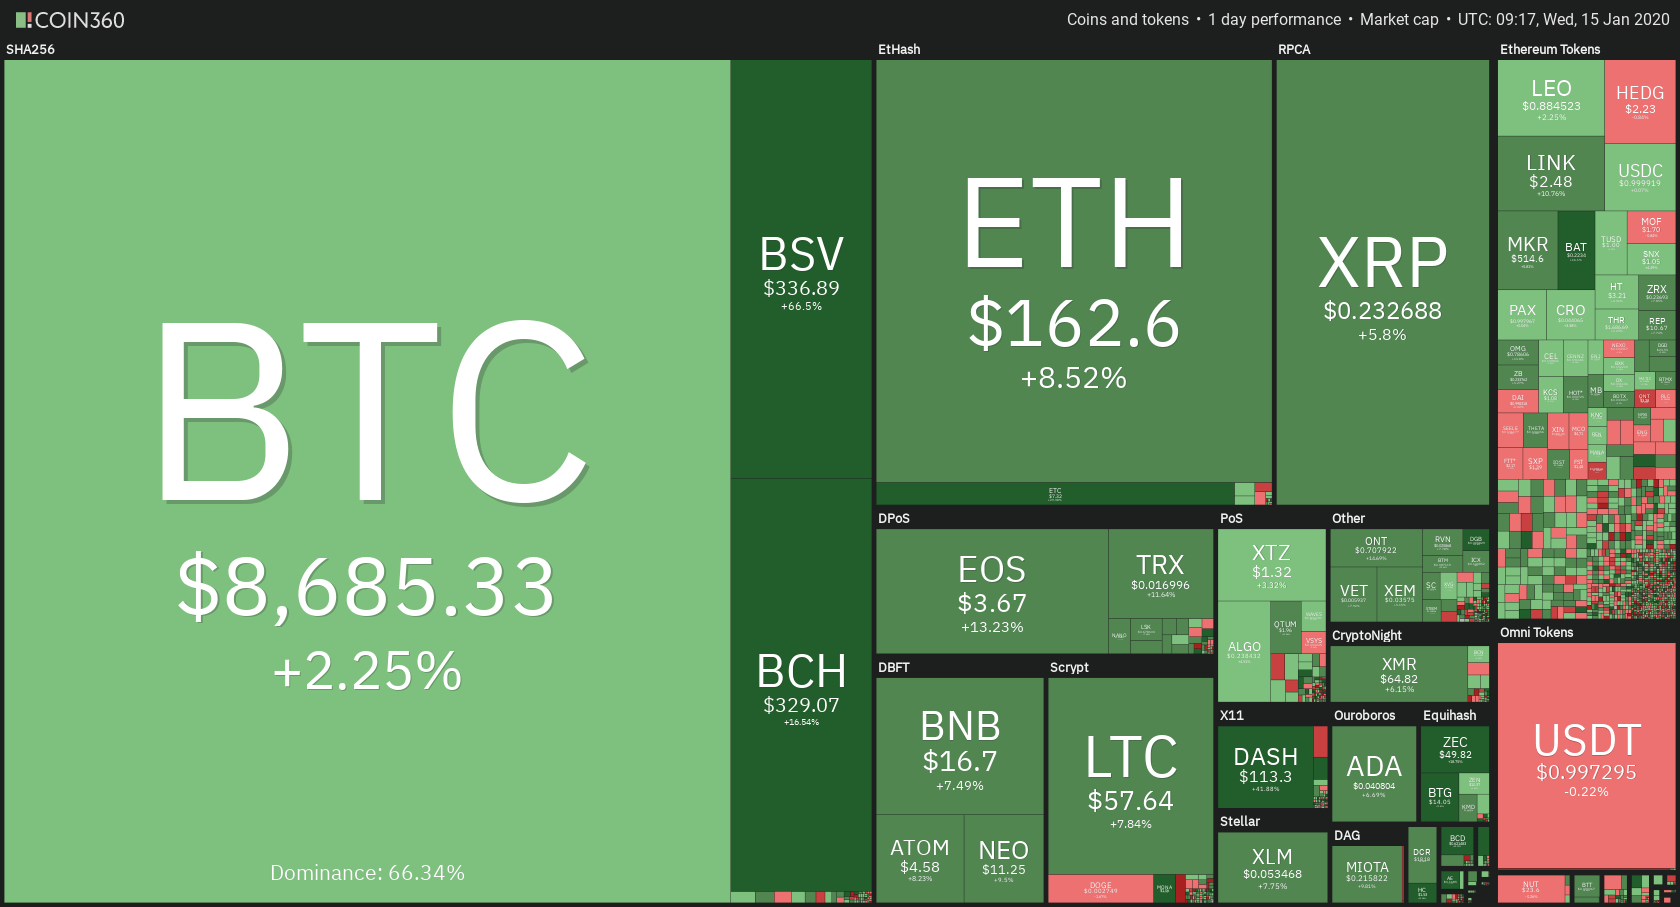
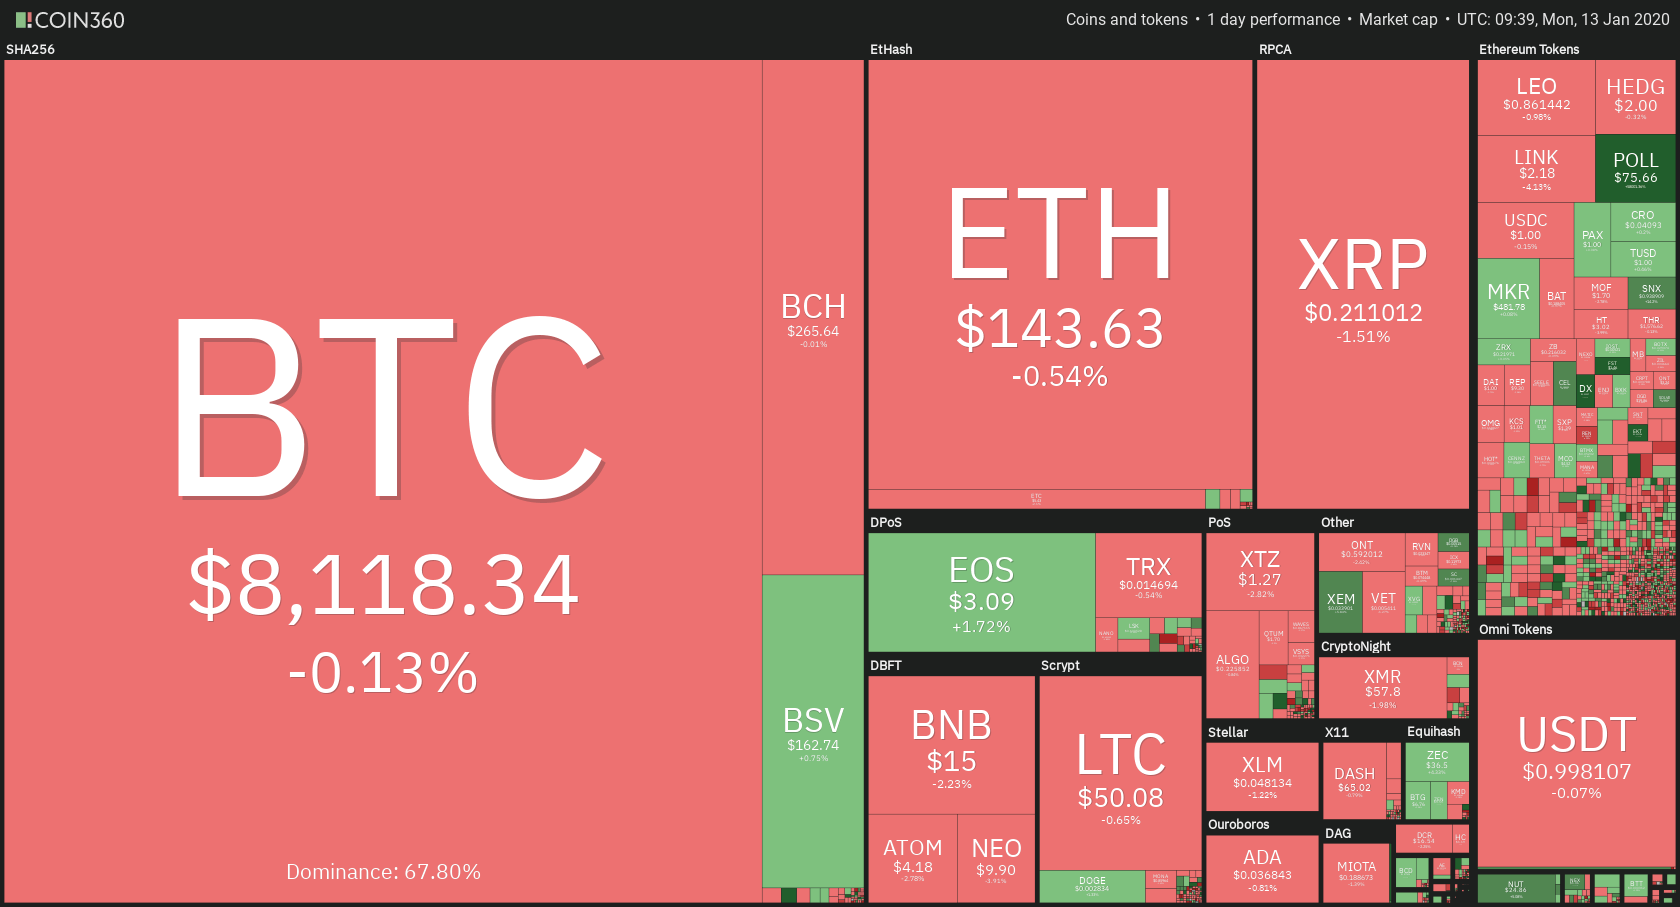
Bitcoin’s dominance increased slightly in the past 24 hours. It is now at 66.13%, which represents an increase of 0.14% when compared to the value it had yesterday.
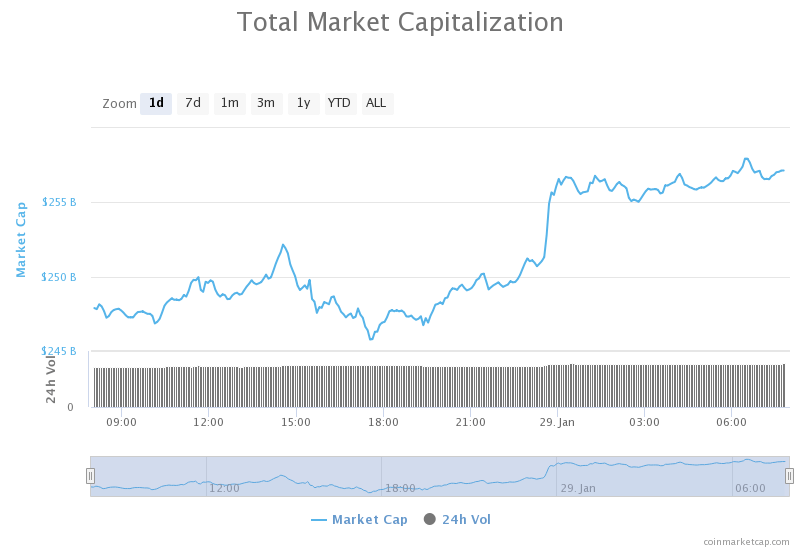
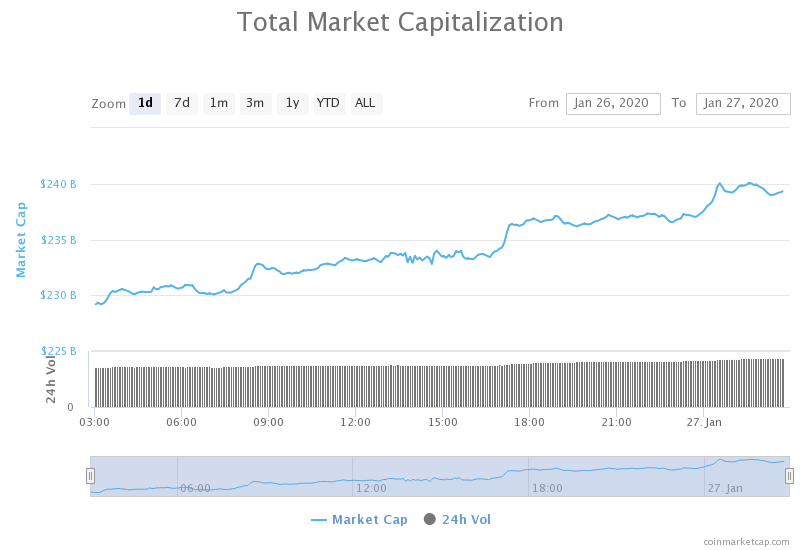
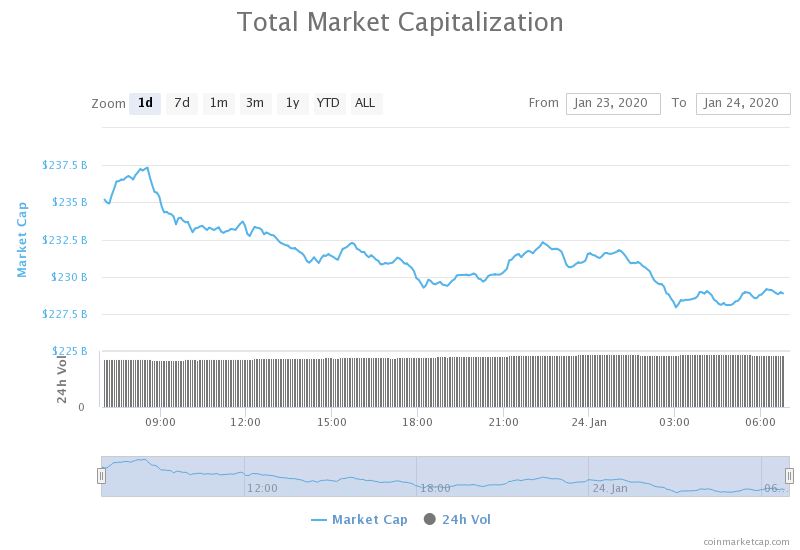
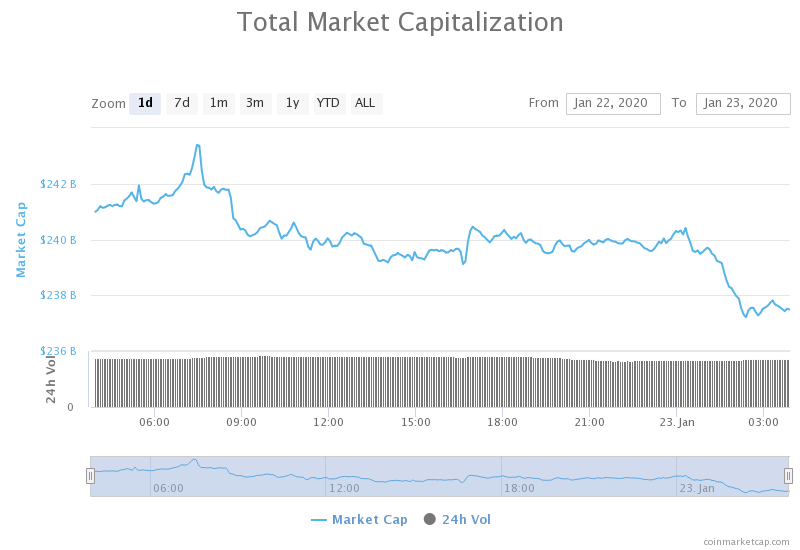
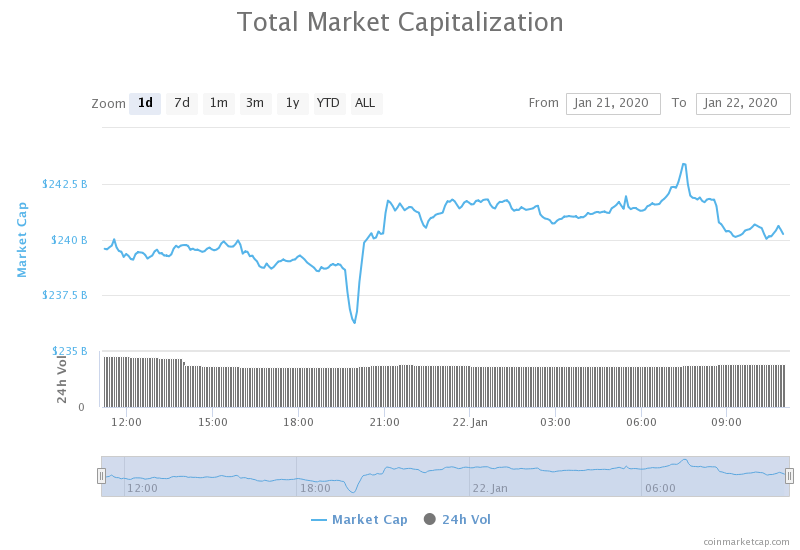
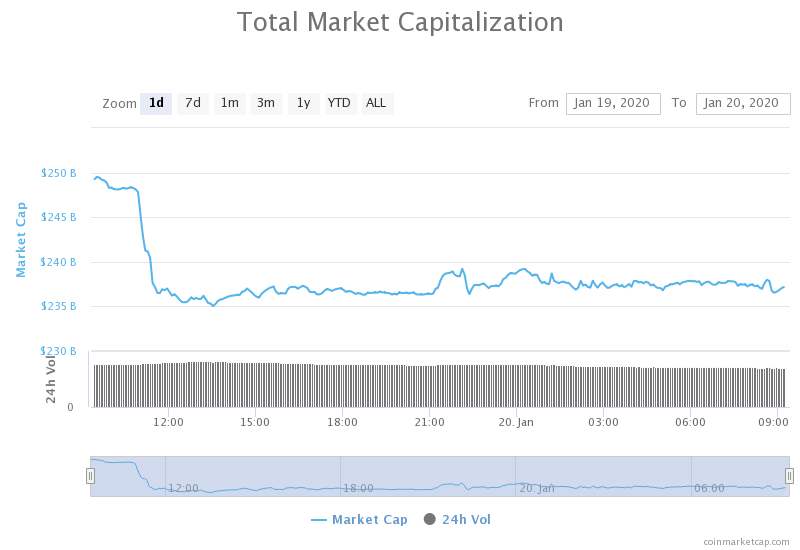
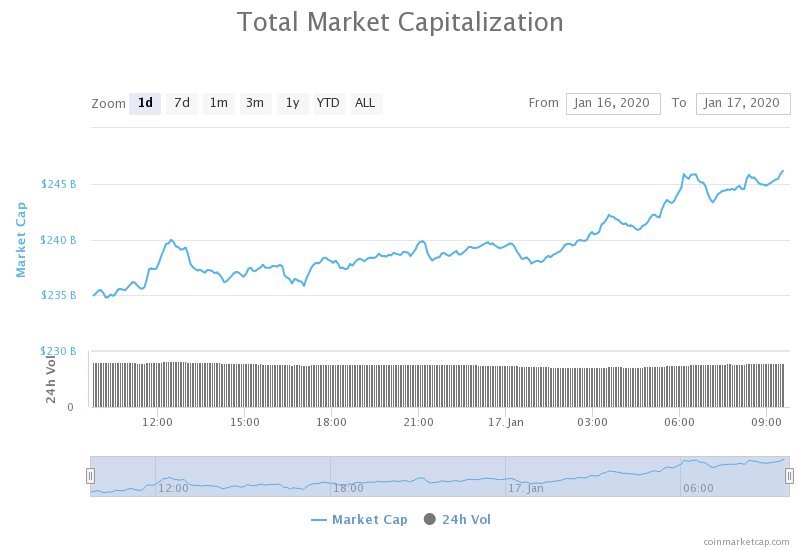
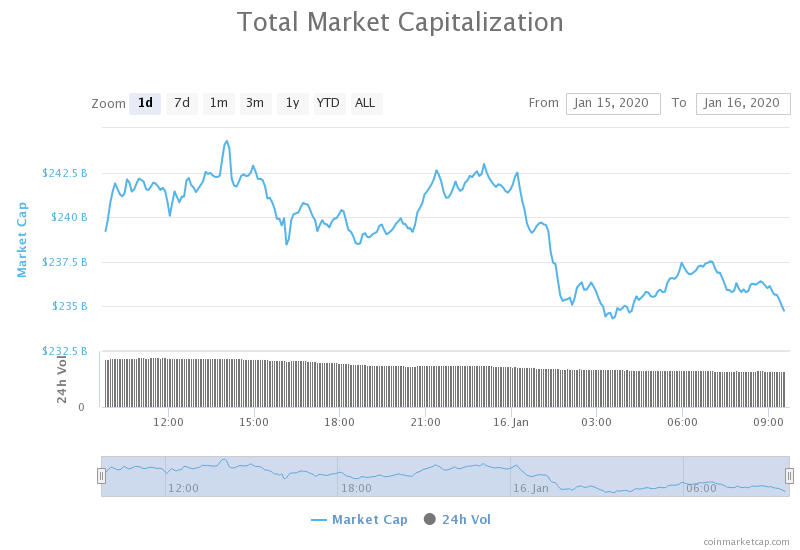
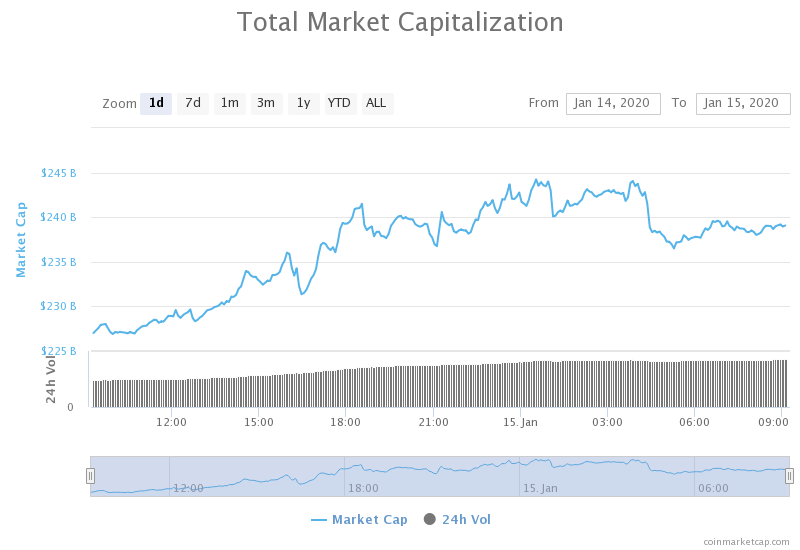
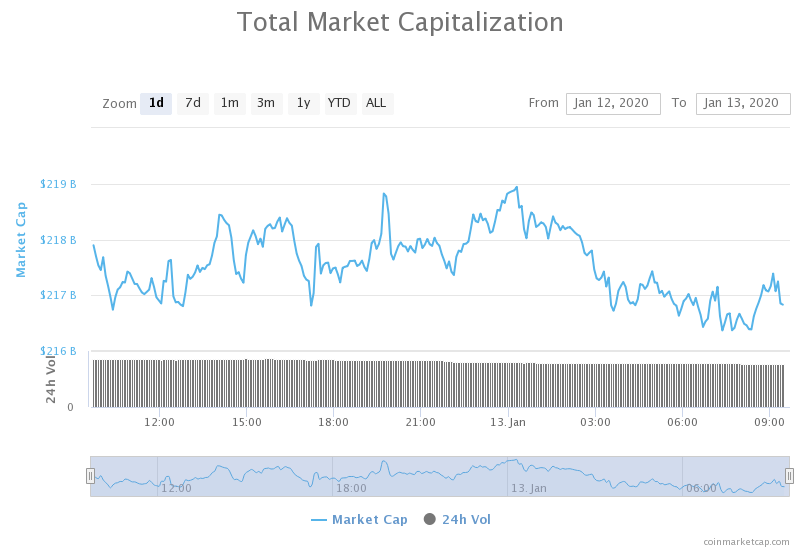
The cryptocurrency market capitalization gained quite a bit of its value in the past 24 hours, as all the bigger cryptocurrencies went up in price. It is currently valued at $257.06 billion, which represents an increase of $8.29 billion when compared to yesterday’s value.
What happened in the past 24 hours
Popular Bitcoin exchange platform LocalBitcoins seems to be stealthily suspending its user accounts from certain countries with little forewarning. Each suspended account got suspended for the “enhanced due diligence process.”
LocalBitcoins, one of the biggest P2P crypto exchanges, has reportedly suspended its user accounts based on their location. The targets were some parts of Africa, the Middle East as well as Asia. This all happened without any warning, with some users even being unable to withdraw their Bitcoin.
Honorable mention
Bitcoin Cash
Bitcoin Cash announced earlier this month that they would impose a 12.5% mining tax on all its miners. This news caused a major backlash as the decentralization that this coin promotes would be gone. According to an announcement, Roger Ver’s Bitcoin.com is officially backing down from this idea due to the negative responses they got from their user-base.
They said that they will not follow through as the negativity regarding the new implementations could cause a chain split. Bitcoin.com also added that they value transparency, flexibility as well as unity.
_______________________________________________________________________
Technical analysis
_______________________________________________________________________
Bitcoin
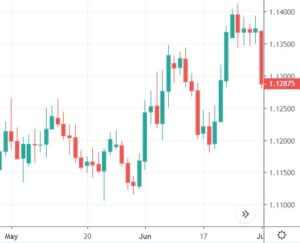
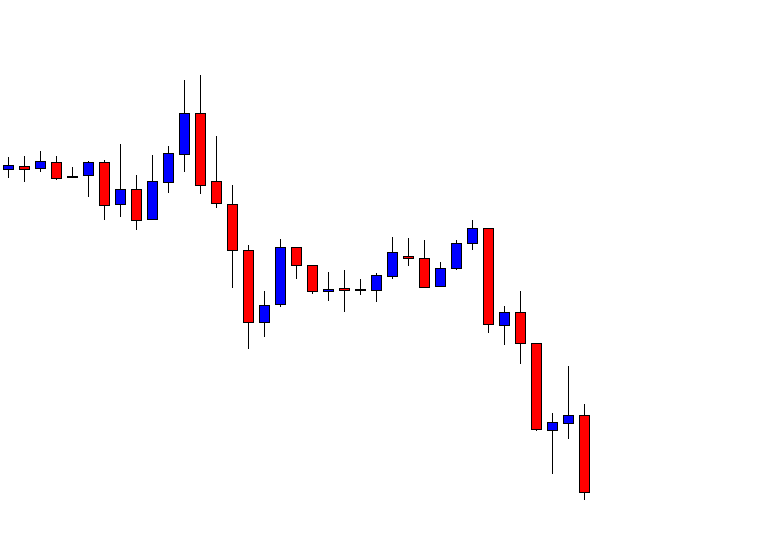
Bitcoin’s chart looks like the bull season is starting. The largest cryptocurrnecy had another great day, leading the cryptocurrency market to new highs. The price established itself above $9,000 and is currently in the consolidation move after it stopped going up. Bitcoin breezed through the $9,120 resistance, making it a support line. Its next support looks like it will be near $9,585, while its support is at $9,251. The price is currently standing above the 200-day moving average (on the 1-day chart), which acts as another form of support.
Bitcoin’s RSI is deep into the overbought territory on the 4-hour chart, while its volume is elevated and on the approximately the same level as all the significant price fluctuations in the past two weeks.
Key levels to the upside Key levels to the downside
1: $9,585 1: $9,251
2: $9,732 2: $9,120
3: $10,000 3: $8,905
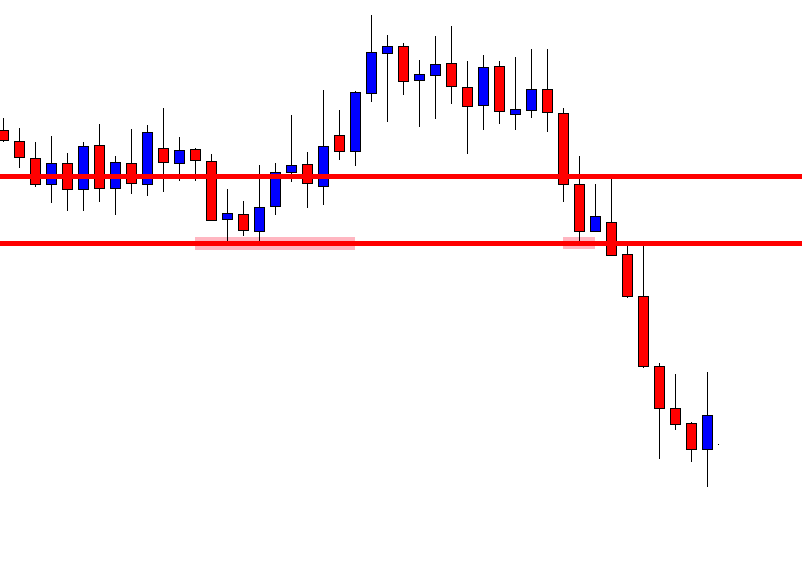
Ethereum
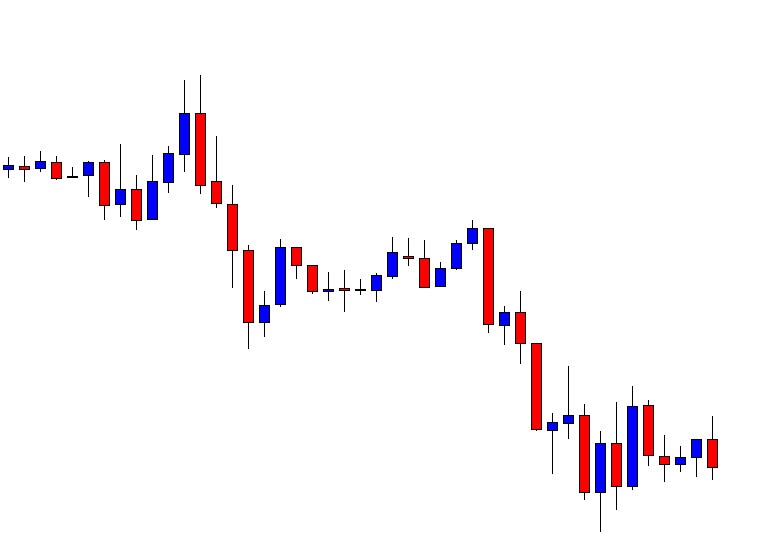
Ethereum also continued to increase in price, racking in another green day. Its price exploded from $171 and reached all the way to $178.5, but could not break the resistance level. Ethereum is now trading just below the immediate resistance. With elevated volume it has now, another small spike might just bring the price above the level. However, as this has not happened yet, Ethereum is still in the middle of the range, with the closest resistance level being $178.5, and the closest support level still being $167.8.
Ethereum’s volume is elevated, while its RSI is currently showing overbought trading. Key levels are remaining the same as Ethereum didn’t break any levels (to the upside or downside).
Key levels to the upside Key levels to the downside
1: $178.5 1: $167.8
2: $185 2: $164
3: $193.6 3: $160
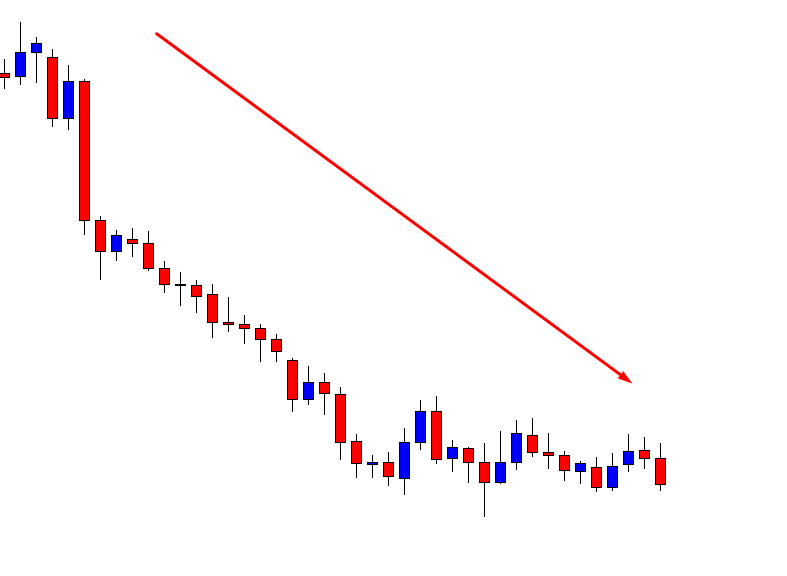
Ripple
Out of the top3 cryptocurrencies, XRP was the one that had the most linear path to the upside. The bullish trend that Started Jan 25 continued, and XRP passed through the resistance level of $0.235. It is currently trading in the middle of the range, bound by $0.235 to the downside and $0.2454 to the upside.
XRP’s volume had one major 4-hour candle, which had elevated volume. However, the rest of the day remained on the same volume levels as the past week. XRP’s RSI level dipped into the overbought territory but is on a downward slope.
Key levels to the upside Key levels to the downside
1: $0.2454 1: $0.235
2: $0.266 2: $0.227
3: $$0.285 3: $0.221