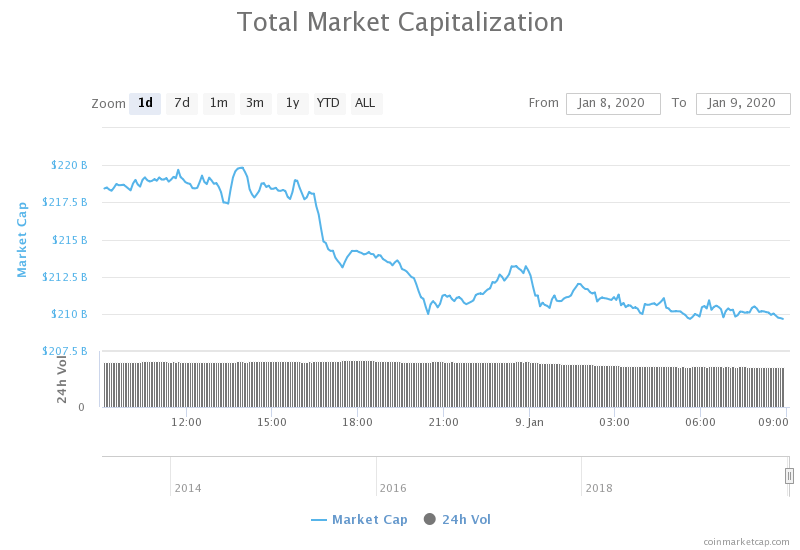
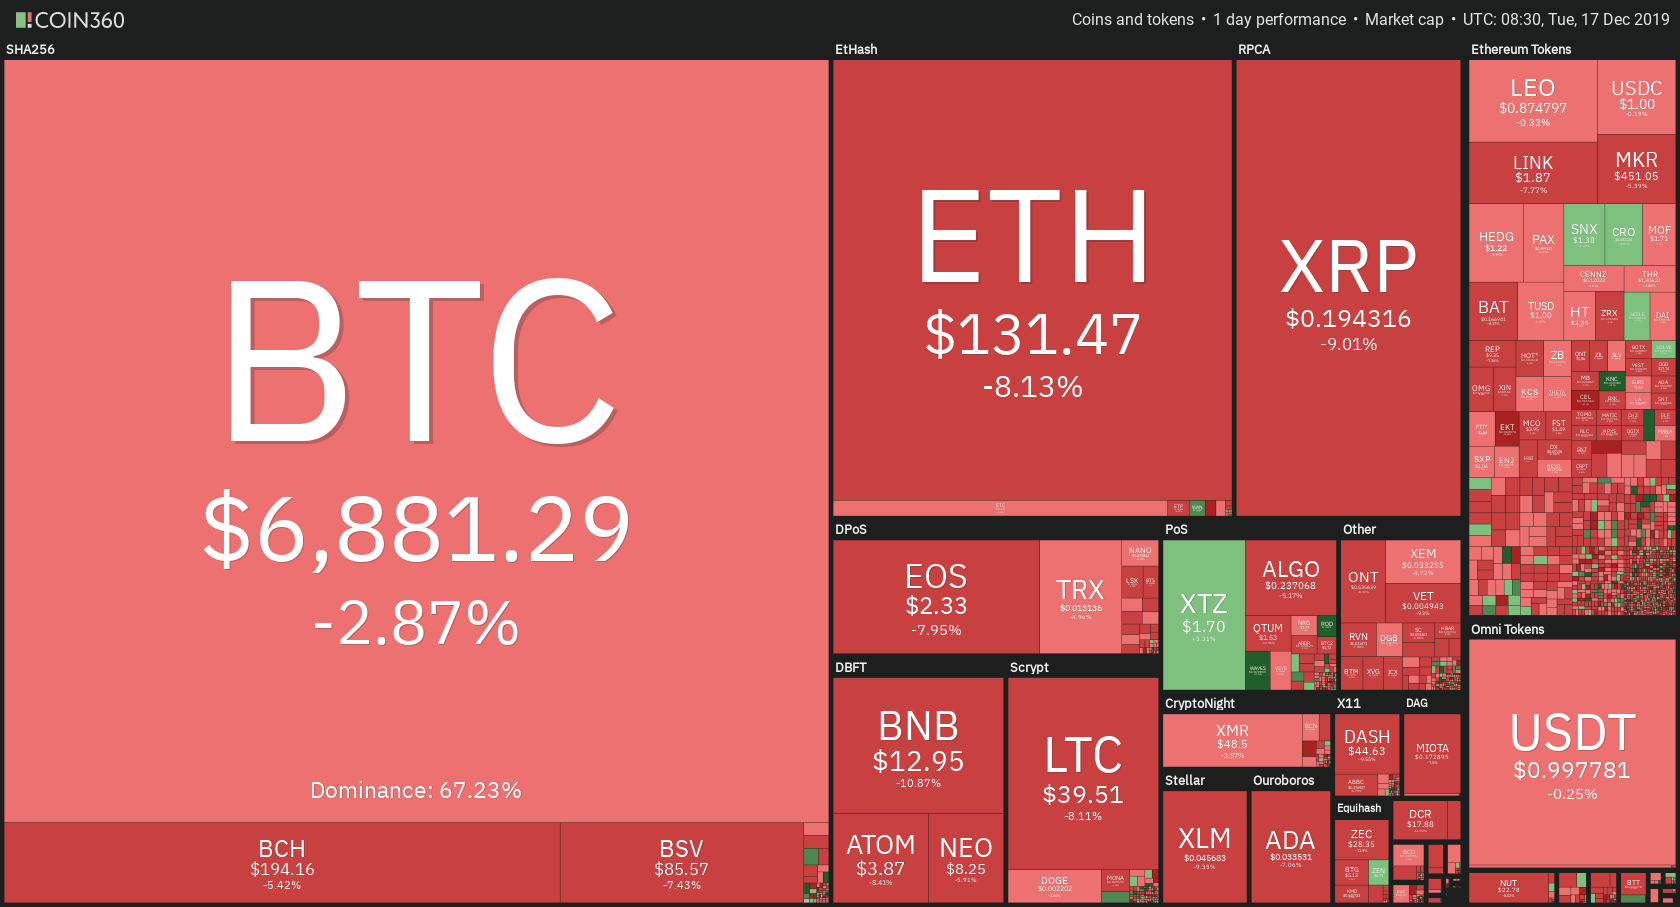
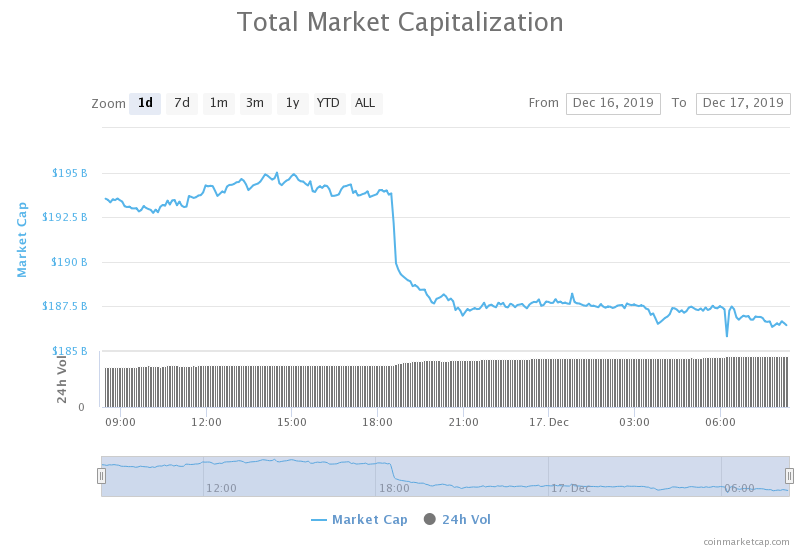
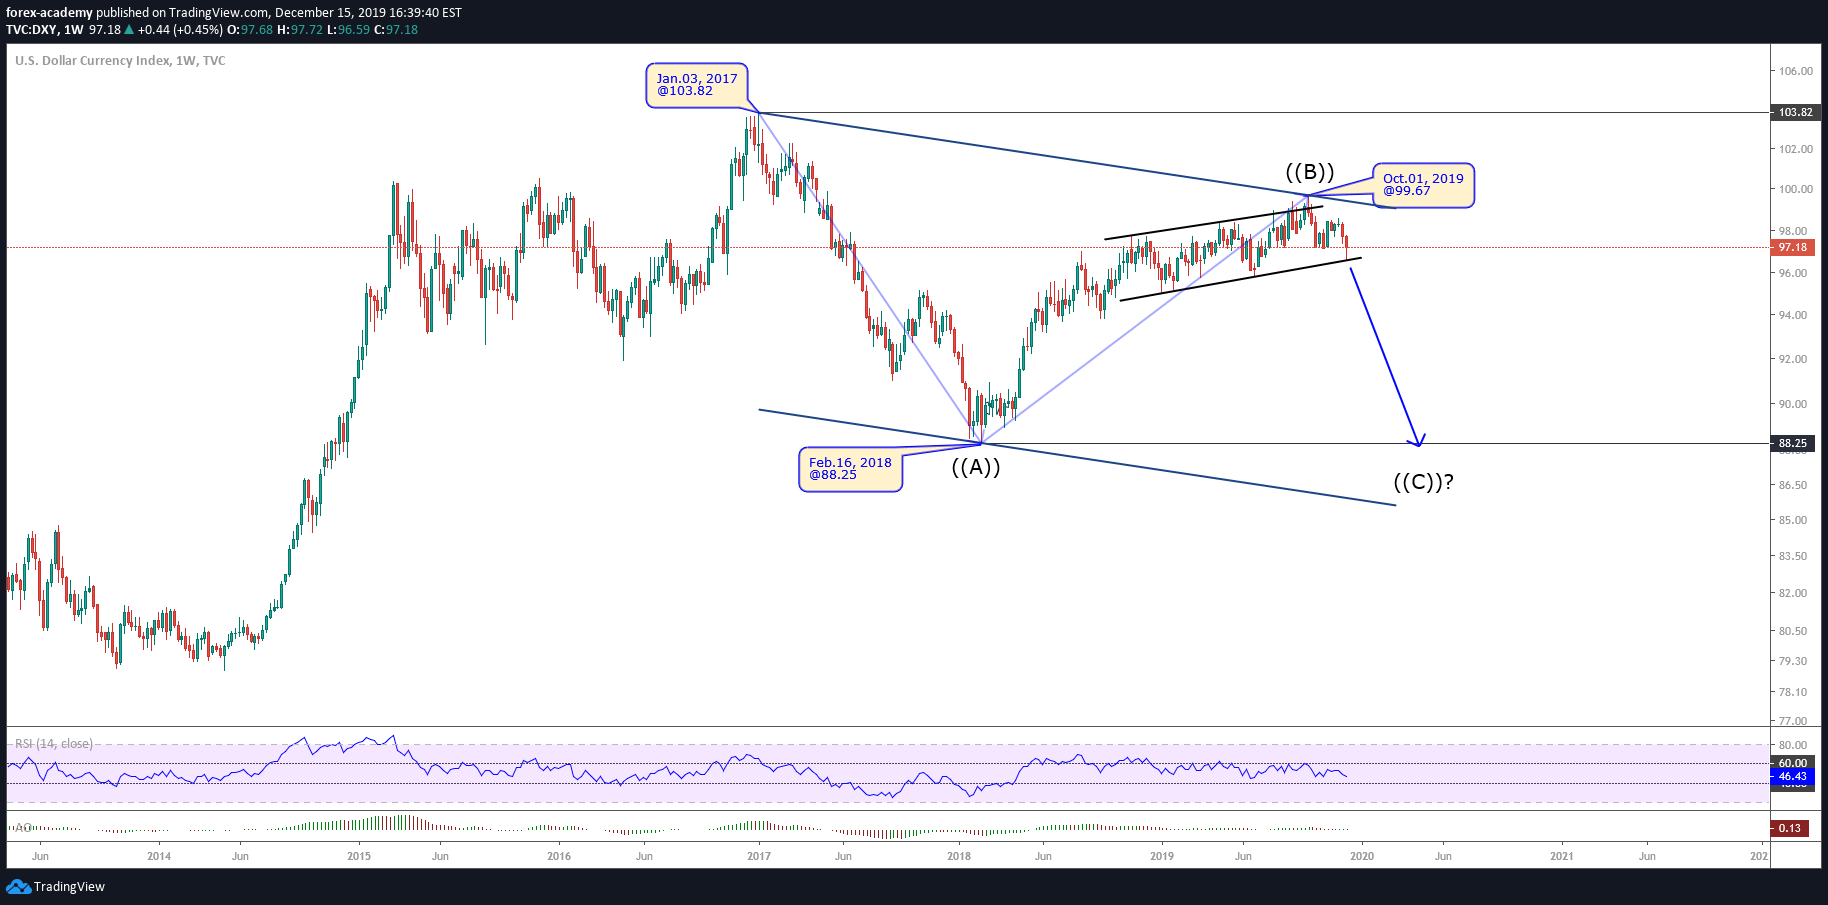
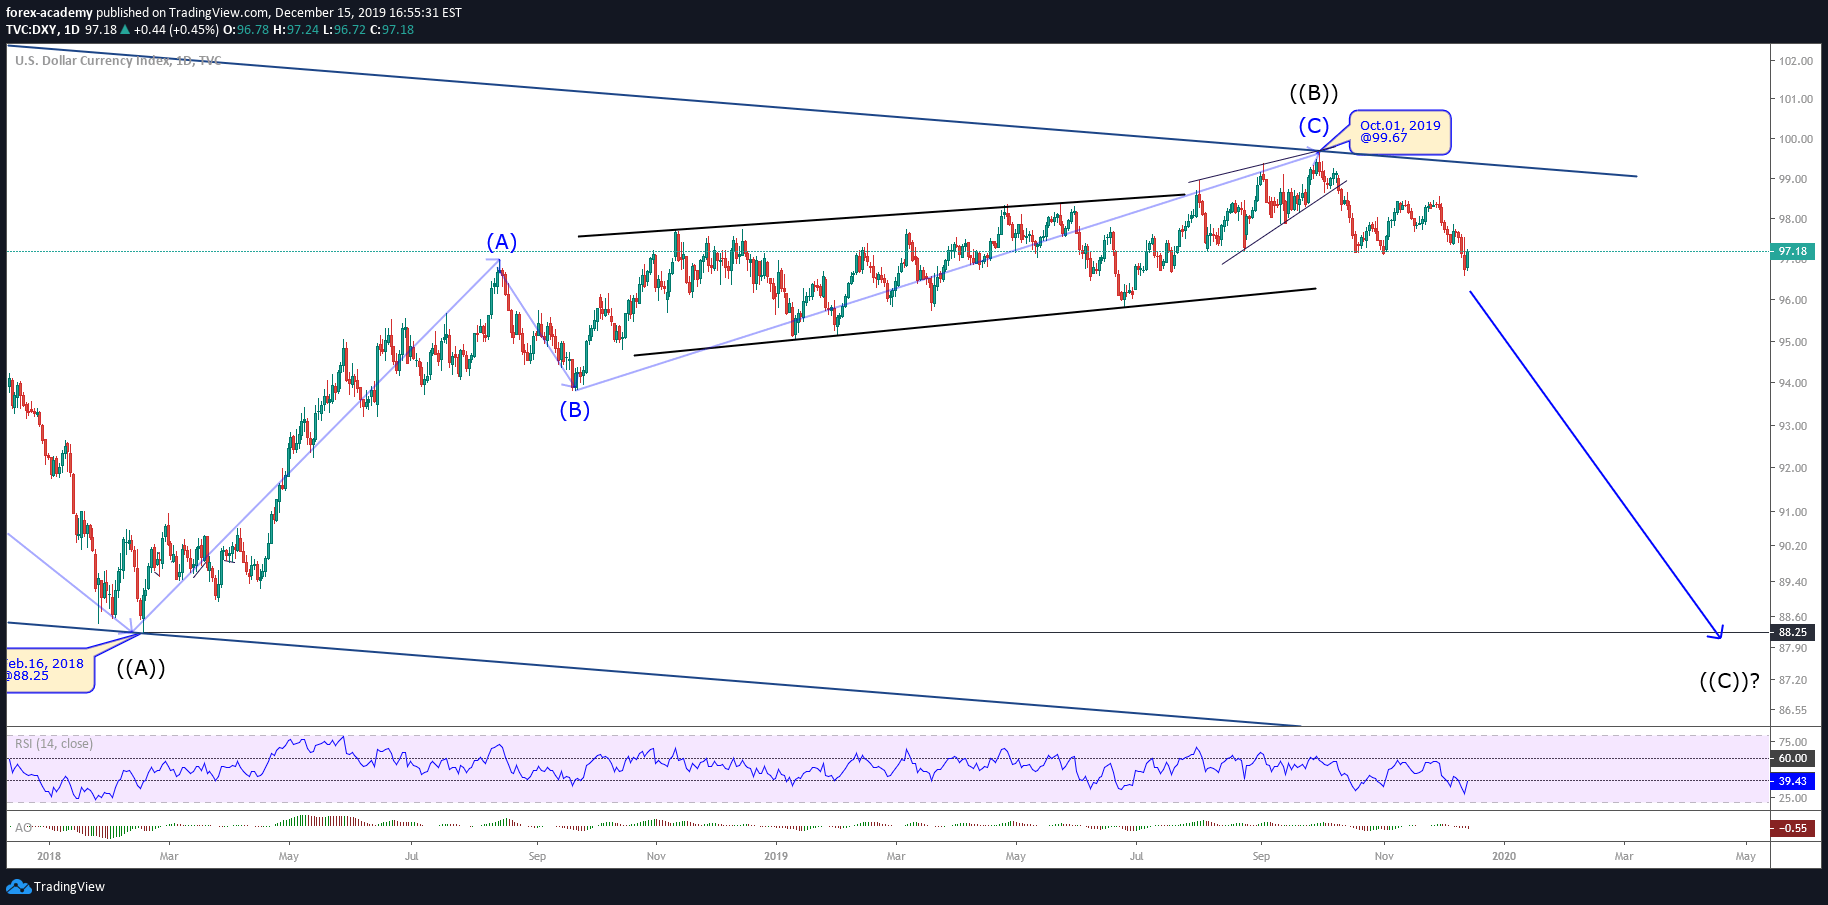
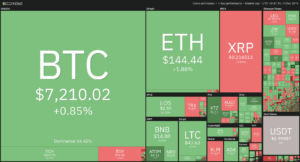
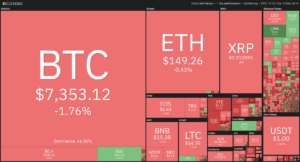
The U.S. dollar declined versus other major currencies as the Fed signaled that interest rates could be stable at current levels through 2020. The ICE U.S. Dollar Index sank to 97.08, the lowest level since August.
The euro rose 0.4% to $1.1133. The European Central Bank is expected to keep its monetary policy unchanged later today.
As expected, the Federal Reserve maintained the rates after cutting them at three earlier meetings. Fed Chairman Jerome Powell stated that monetary policy is well-positioned for the expanding economy, where the jobs market is expected to remain strong and inflation moderate.
Economic Events to Watch Today
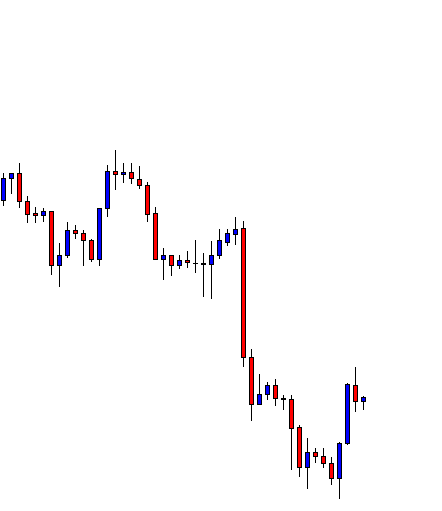
EUR/USD – Daily Analysis
The EUR/USD currency pair slightly recovered in the last hour in the wake of inflation data released from the United States, which made the EUR/USD pair weaker. As of writing, the EUR/USD currency pair is currently trading 1.1094 but virtually unchanged daily near the 1.1090 handles.
The data published by the United States (U.S.) Bureau of Labor Statistics (BLS) on Wednesday showed that the core Consumer Price Index (CPI) in the United States stayed unchanged at 2.3% every year during November. Although these figures came in line with the market expectation, the initial reaction caused the U.S. Dollar Index to drop to a fresh session low below the 97.50 marks.
Despite this, the EUR/USD currency pair may not pick up bid further in the coming hours because traders are unlikely to take large bets before the Federal Reserve Open Market Committee monetary policy announcements. However, investors don’t see the Federal Reserve cutting rate again; the updated economic projections will provide fresh hints regarding the rating outlook in 2020.
After the FOMC event, investors’ eyes will shift to the European Central Bank’s (ECB) meeting and President Lagarde’s first press conference on Thursday.
According to the ECB event, we will not see the steady bullish progress in the EUR currency because policy continuity should be the main takeaway. Lagarde’s style and sound is a wild card. Preventing an early misstep there, the slight declines we see to growth may be offset upgrades to next year’s inflation forecast.
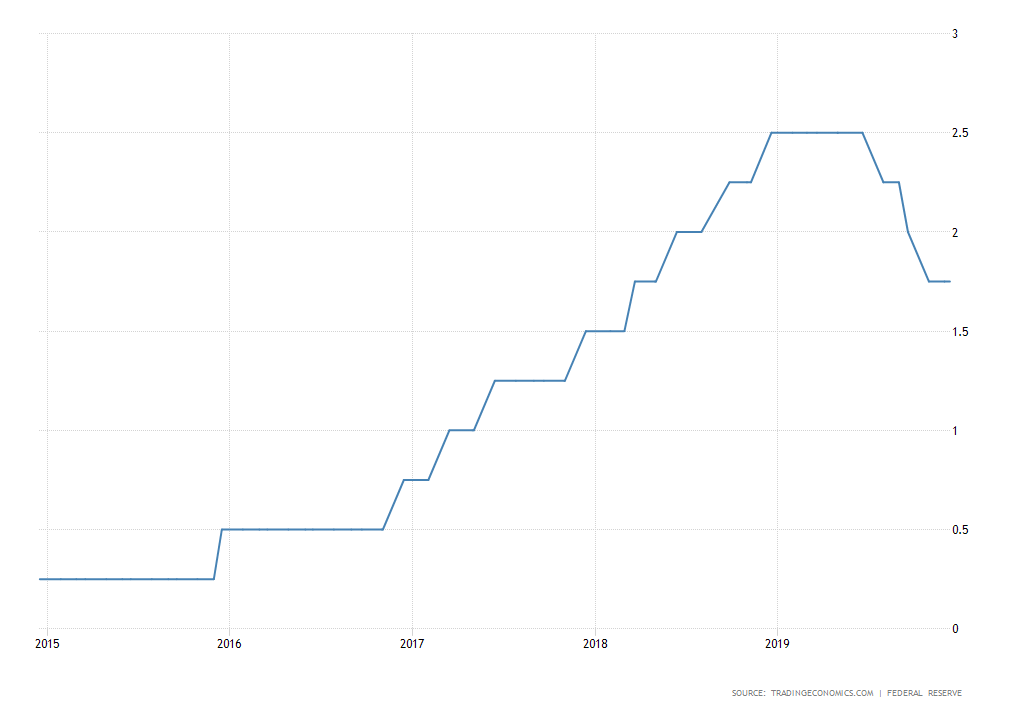
At the Fed front, the Federal Reserve is expected to keep the Fed Funds rate stable at the 1.50 – 1.75% range. After cutting interest rates 3-times in a series, for now, market participants see no change today and also at the January meeting. Most members of the Federal Open Market Committee (FOMC) mentioned they think the current stance of policy appropriate.
Looking forward, the Federal Reserve will announce its decision regarding monetary policy today at 19:00 GMT. Chairman Jerome Powell will read a statement and will hold a press conference at 19:30 GMT.
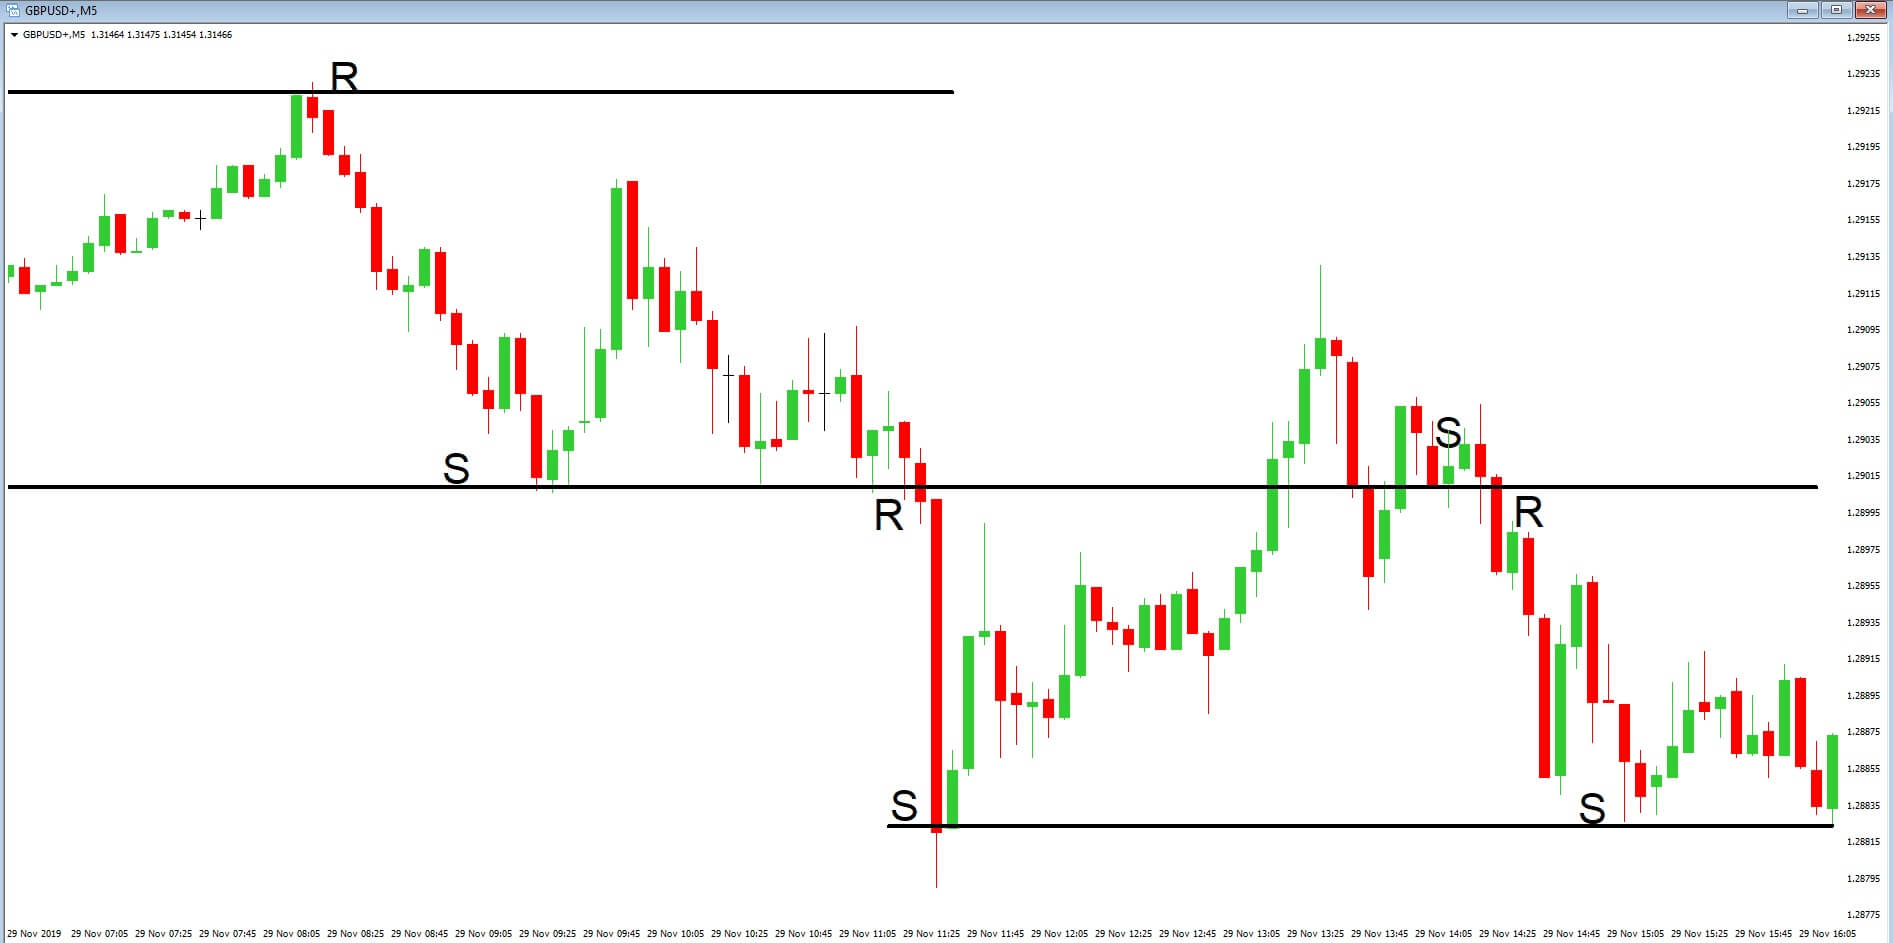
Daily Support and Resistance
- S3 1.102
- S2 1.1043
- S1 1.1054
Pivot Point 1.1066
- R1 1.1076
- R2 1.1089
- R3 1.1111
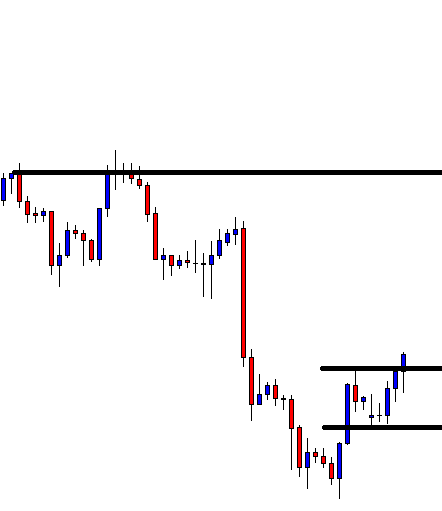
EUR/USD– Trading Tips
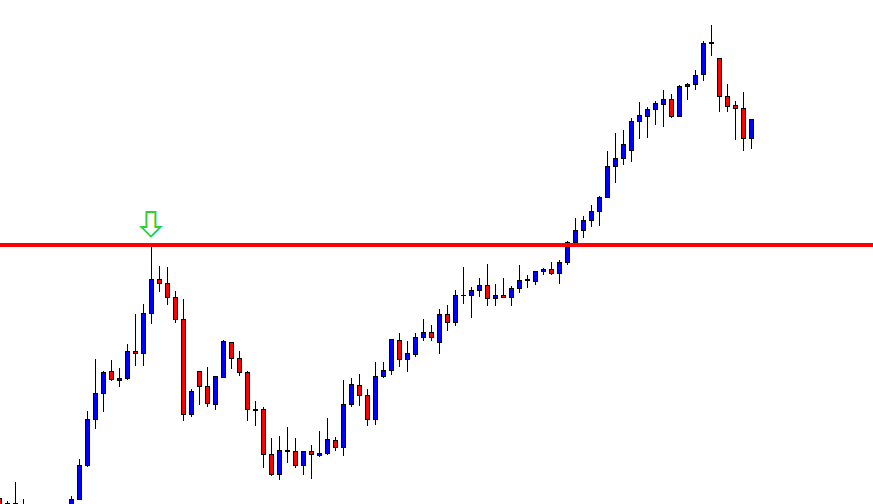
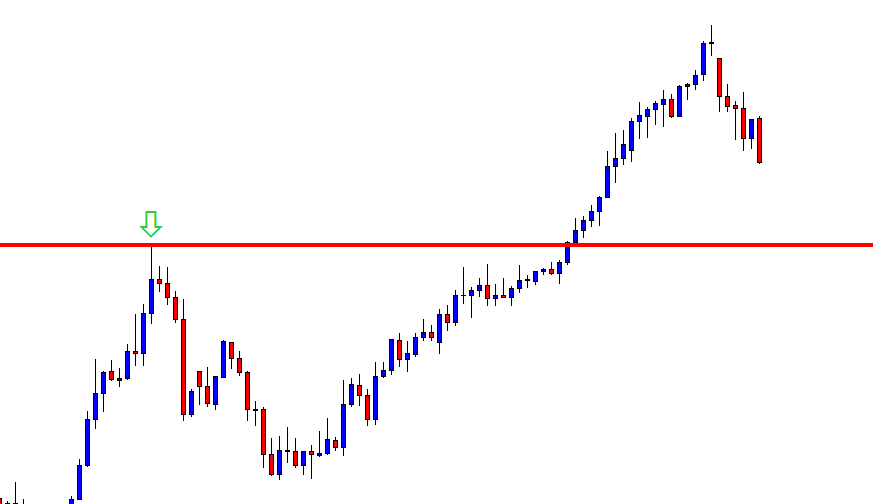
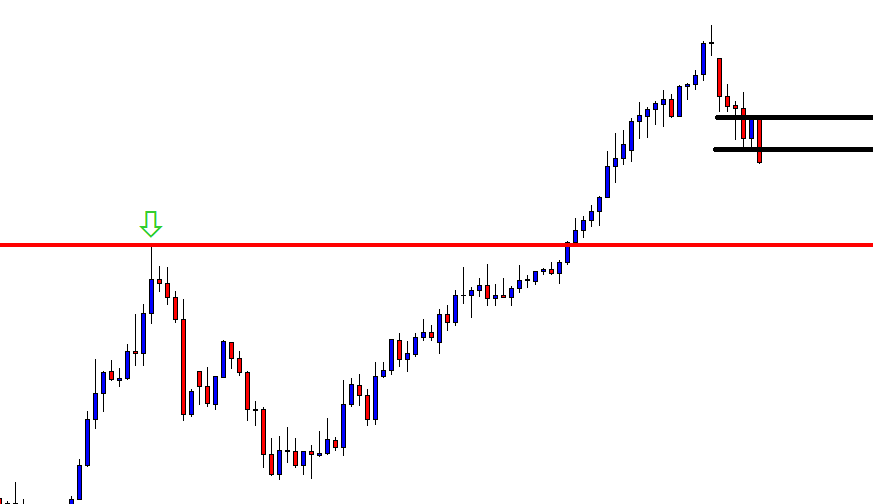
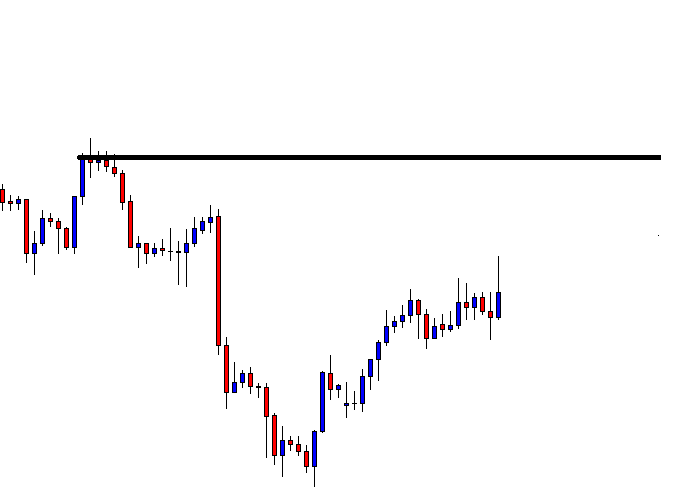
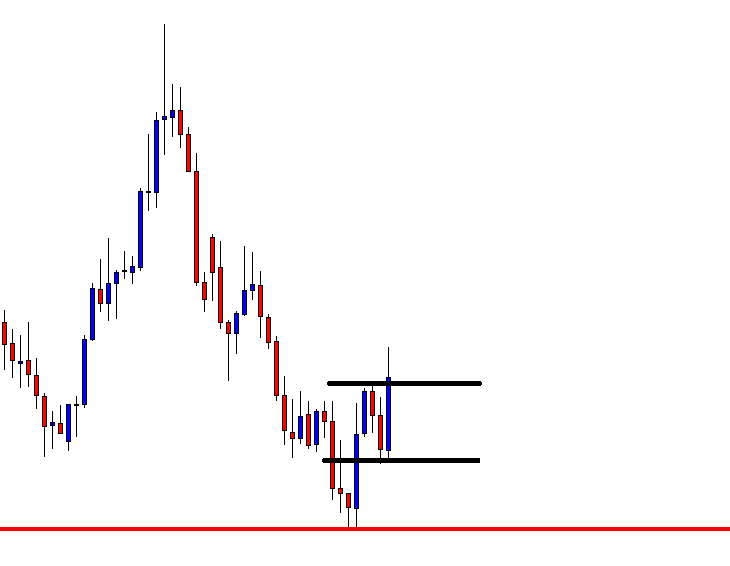
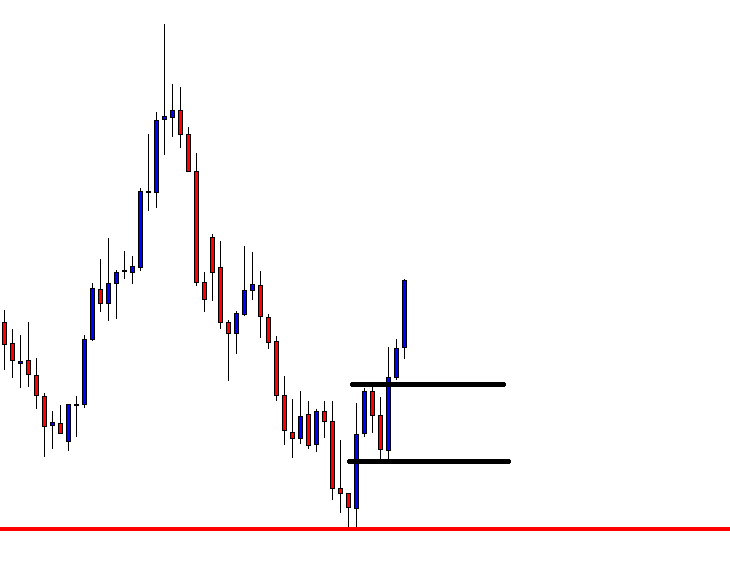
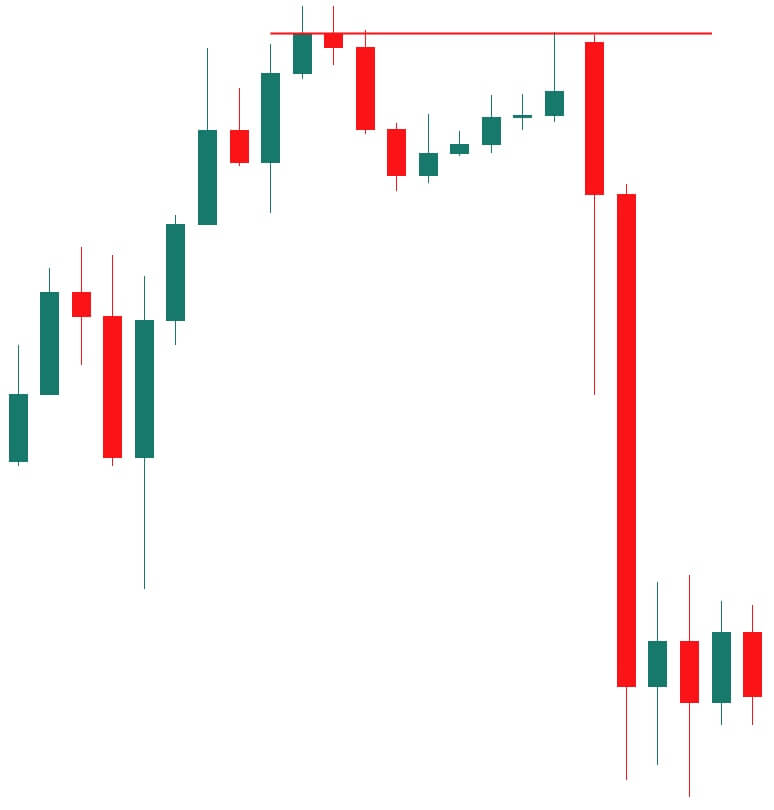
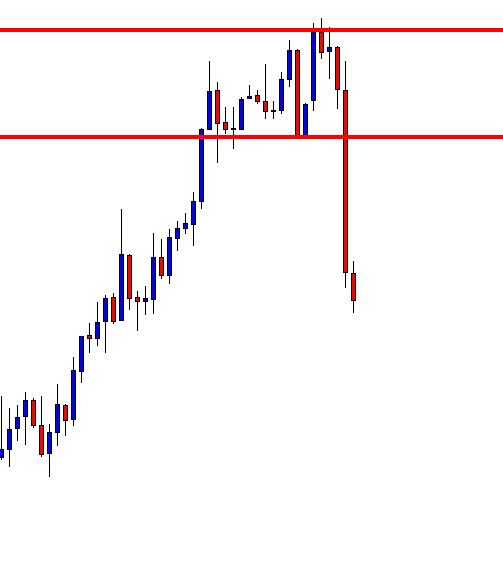
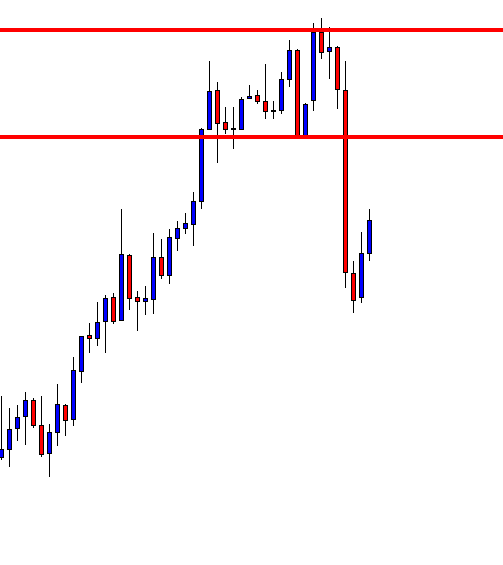
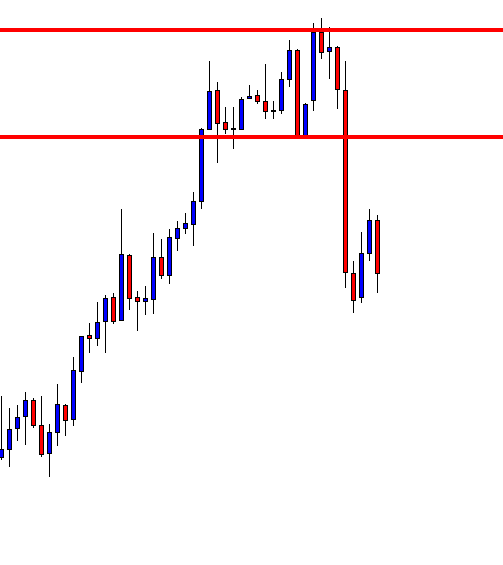
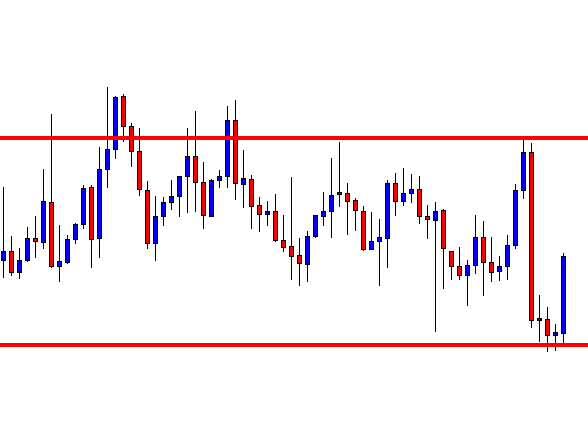
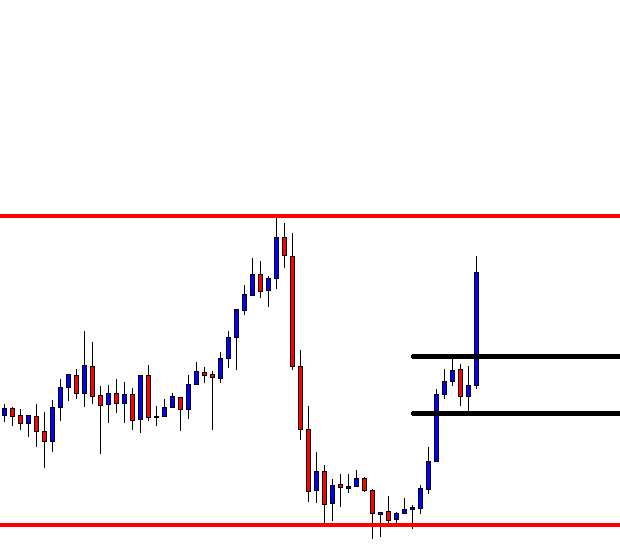
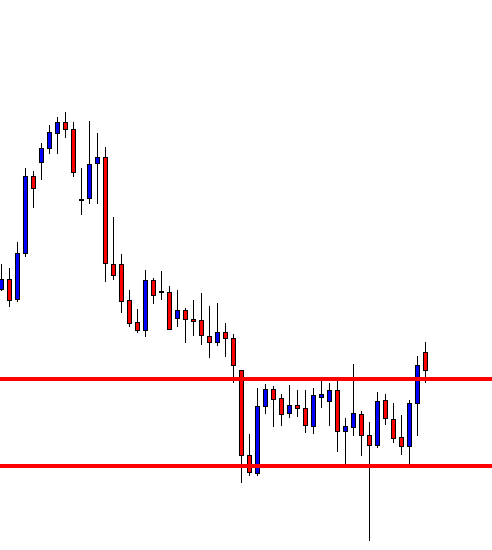
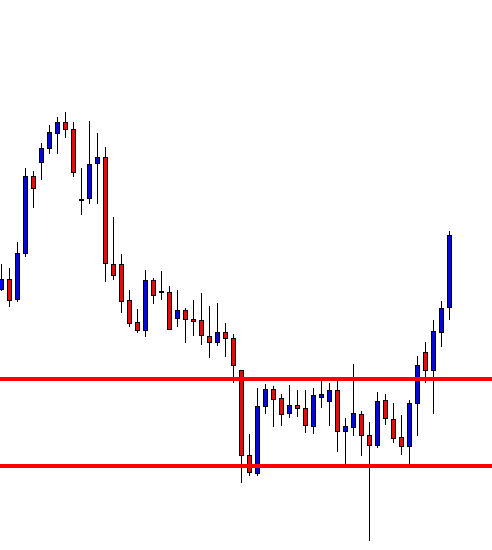
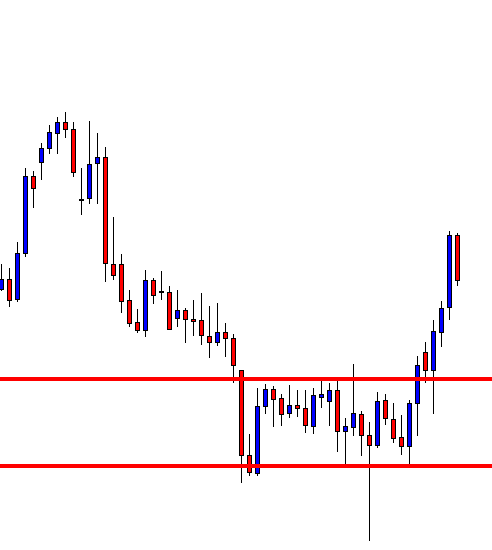
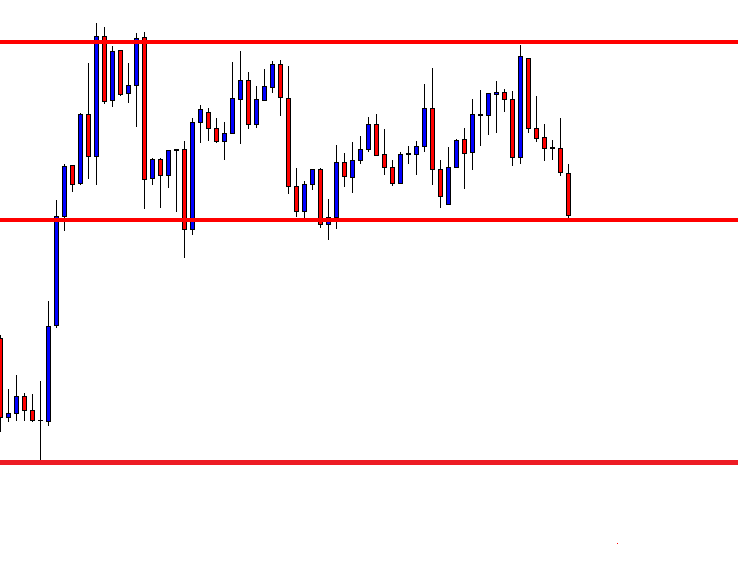
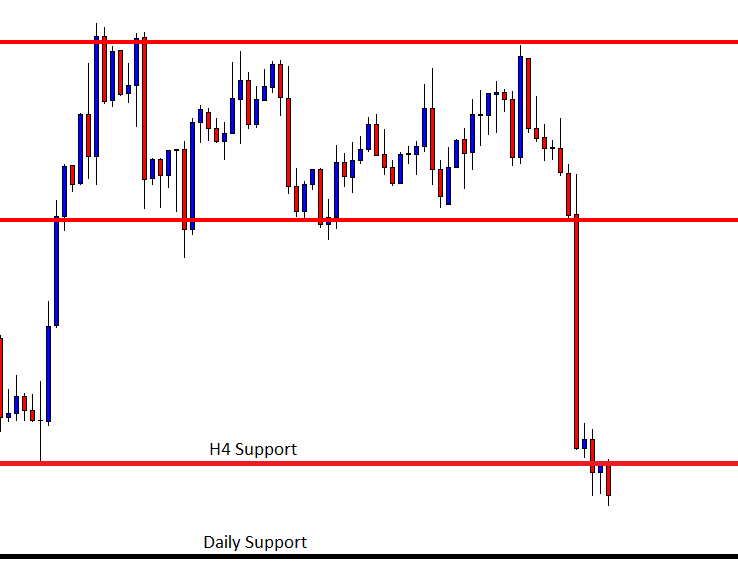
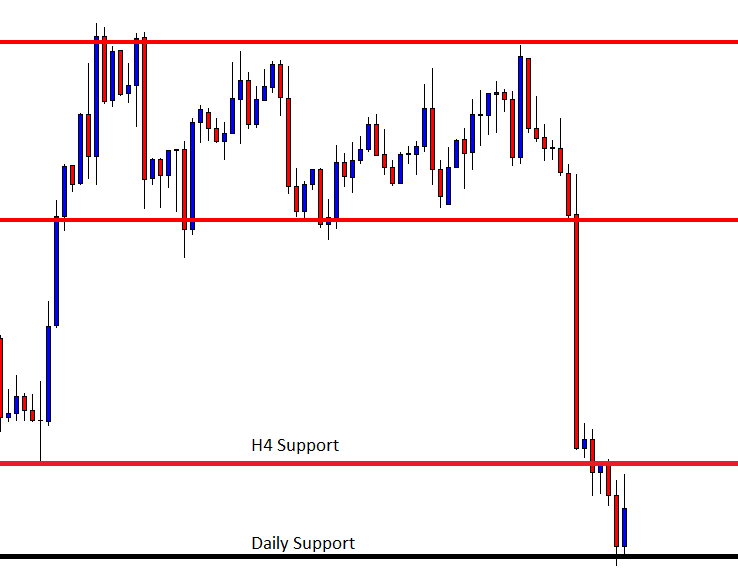
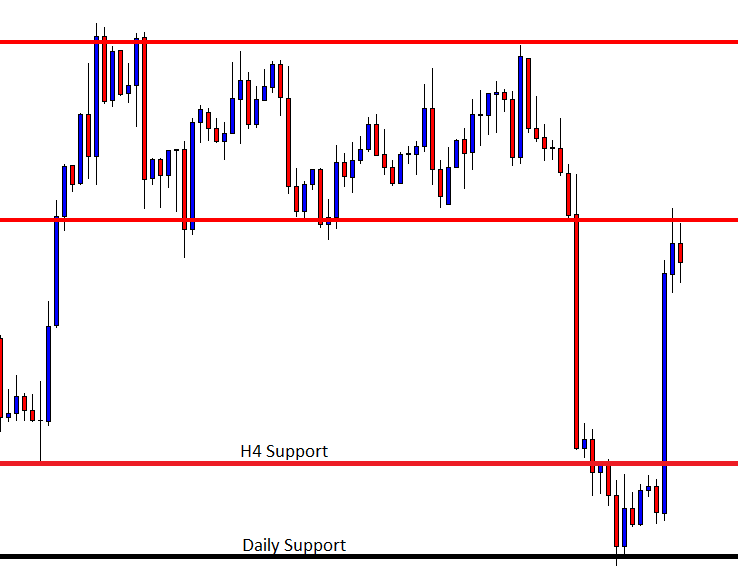
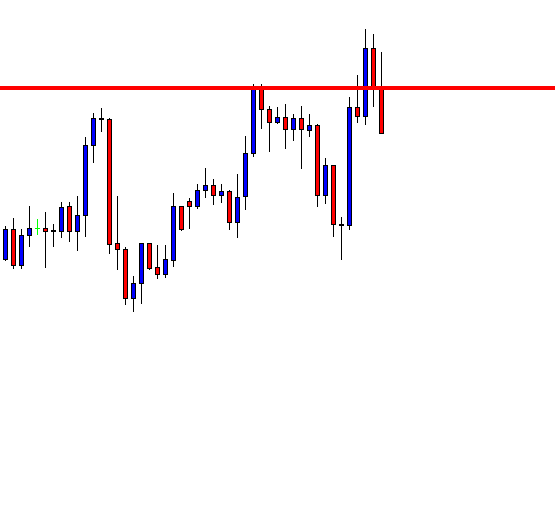
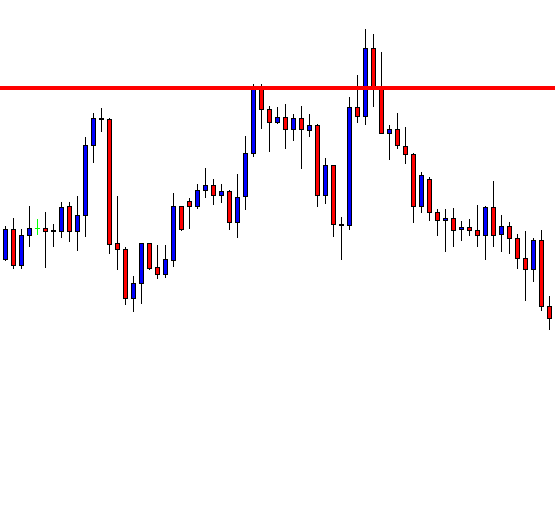
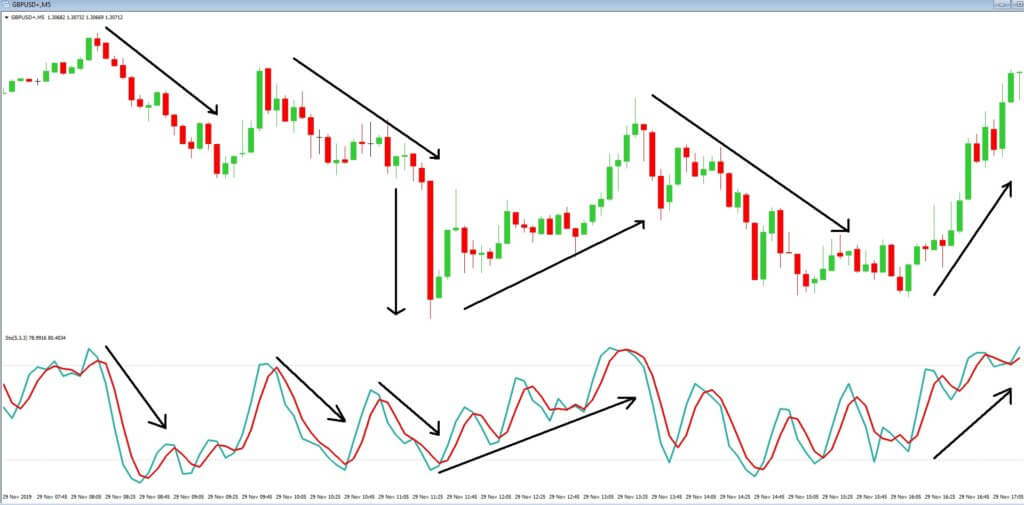
The EUR/USD has crossed over its 5-month downtrend at 1.1113. The EUR/USD is trending higher but has not gained any support until now. The EUR/USD has next support near 61.8% Fibonacci support level of 1.1105.
While the resistance stays around 1.1190, and the 1.1225 horizontal resistance mark strictly follows it. Considering the recent crossover on MACD, the pair may trade bearish below the 1.1100 level today.
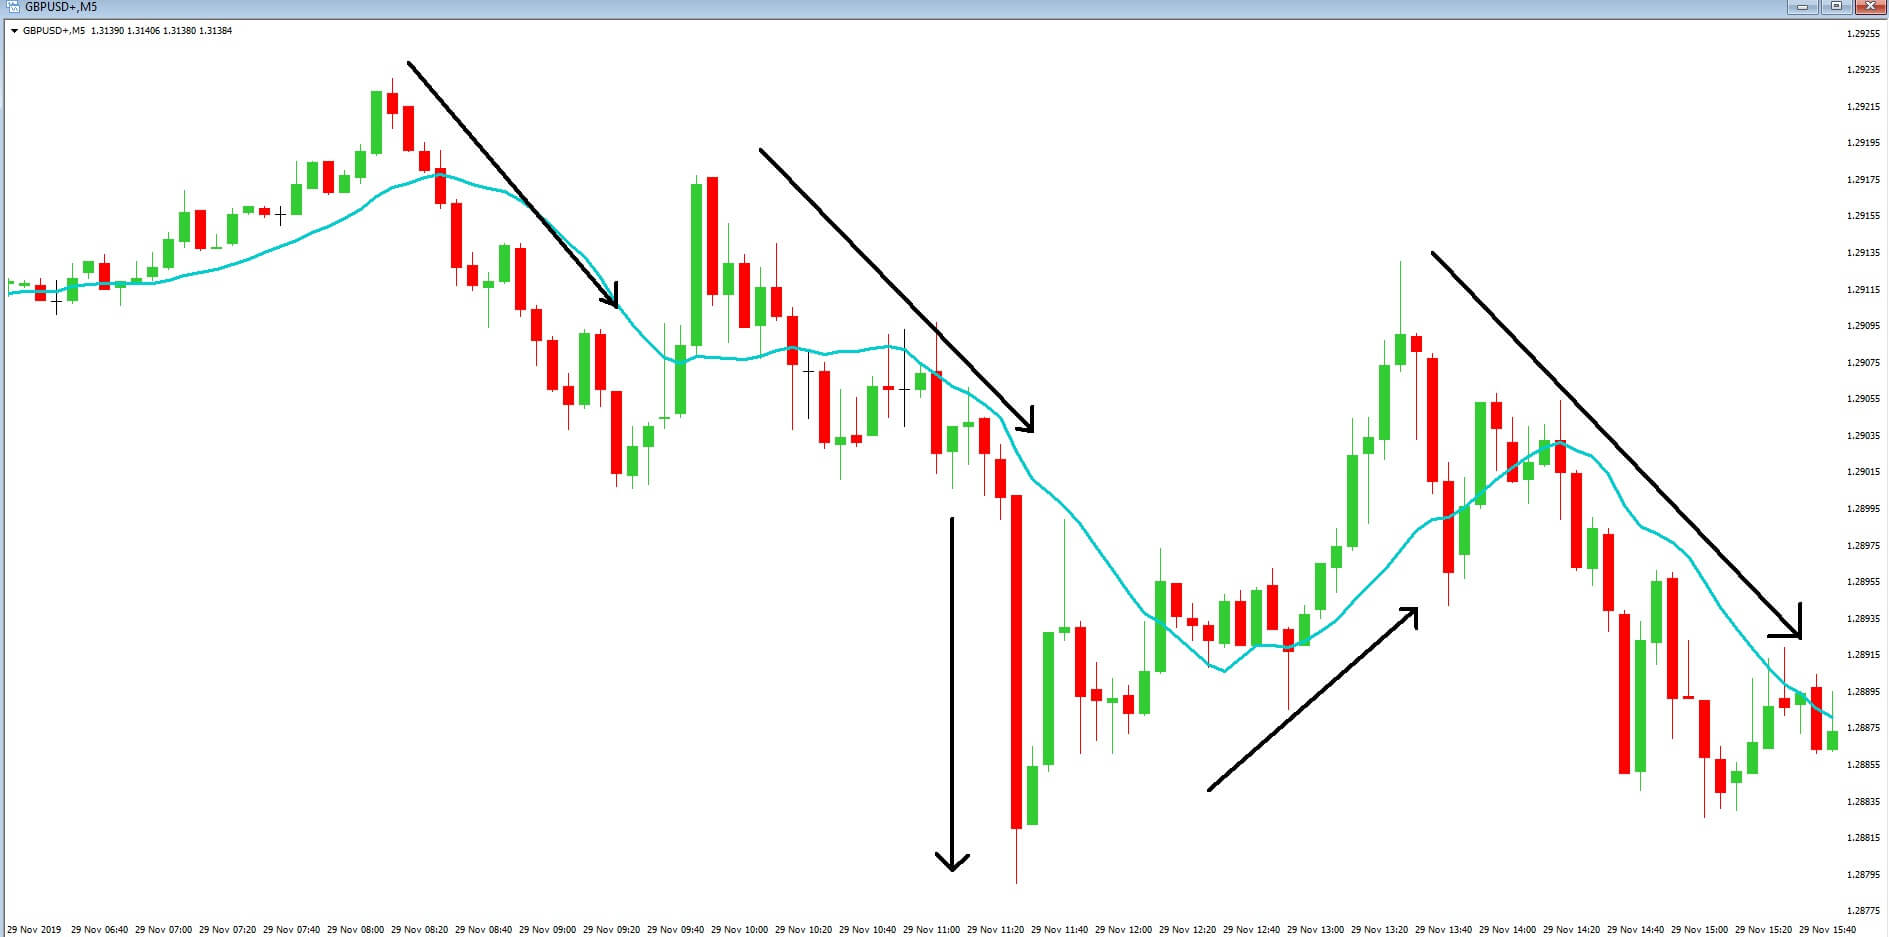
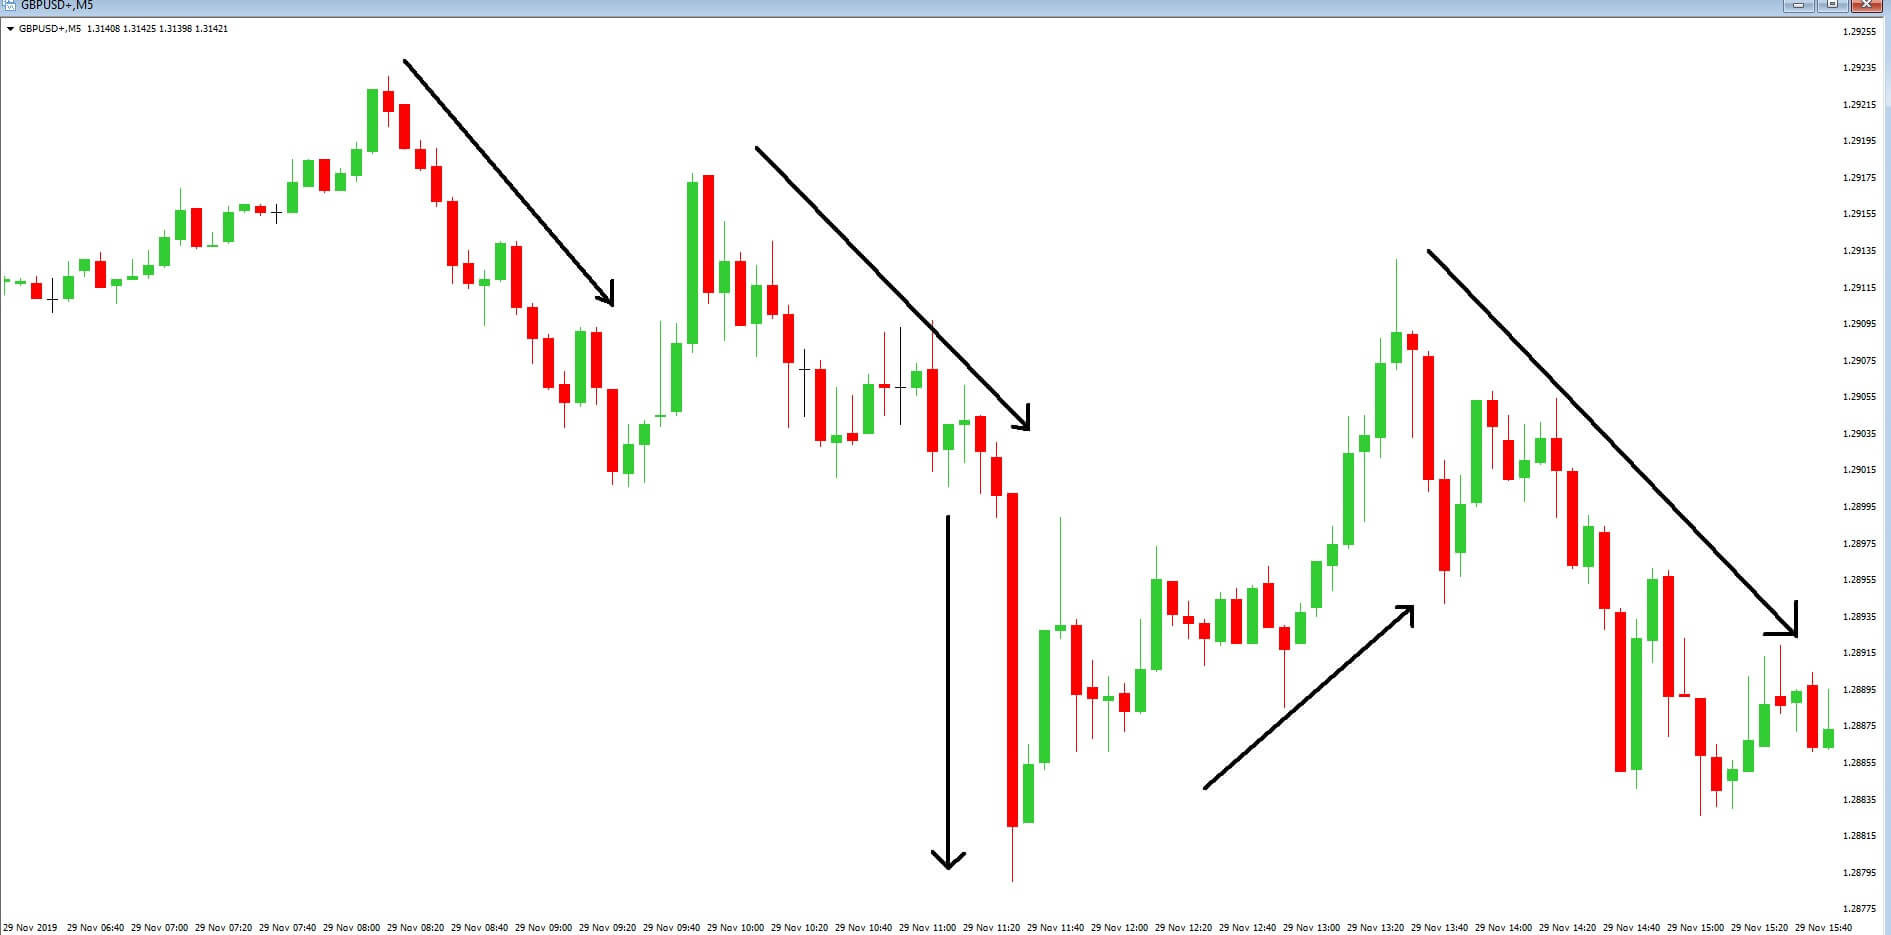
GBP/USD– Daily Analysis
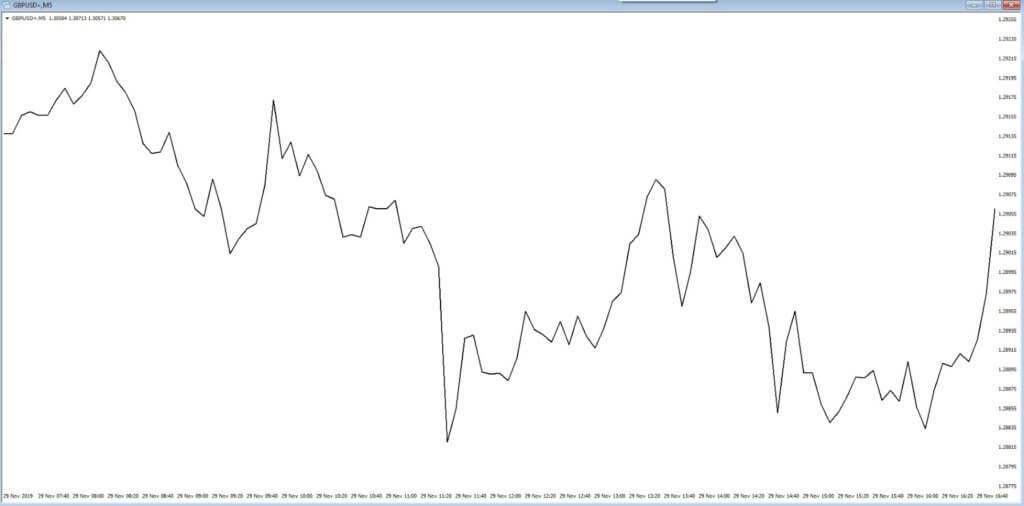
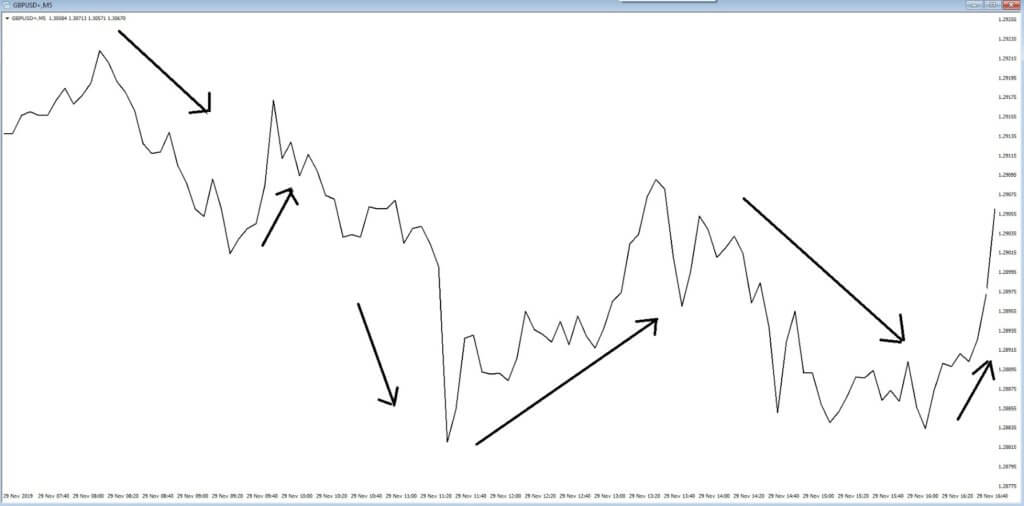
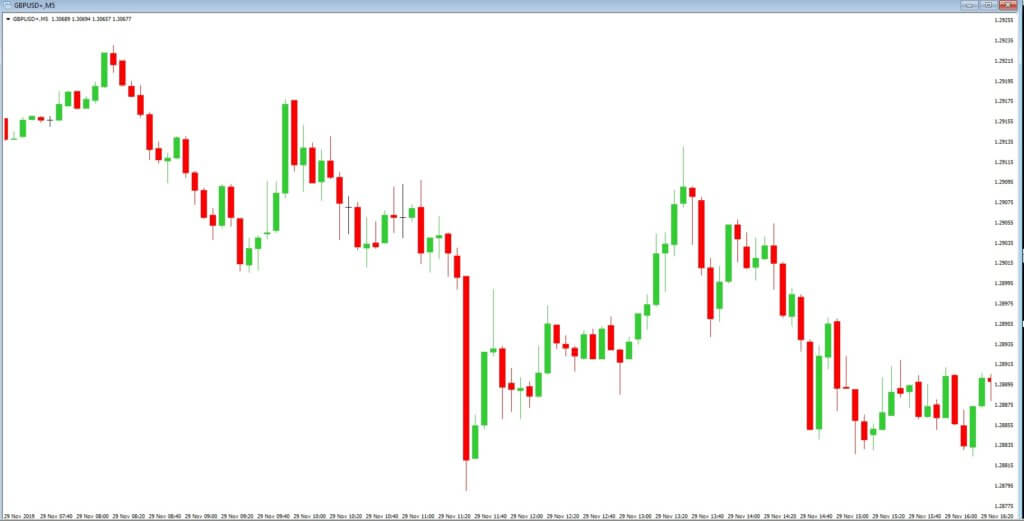
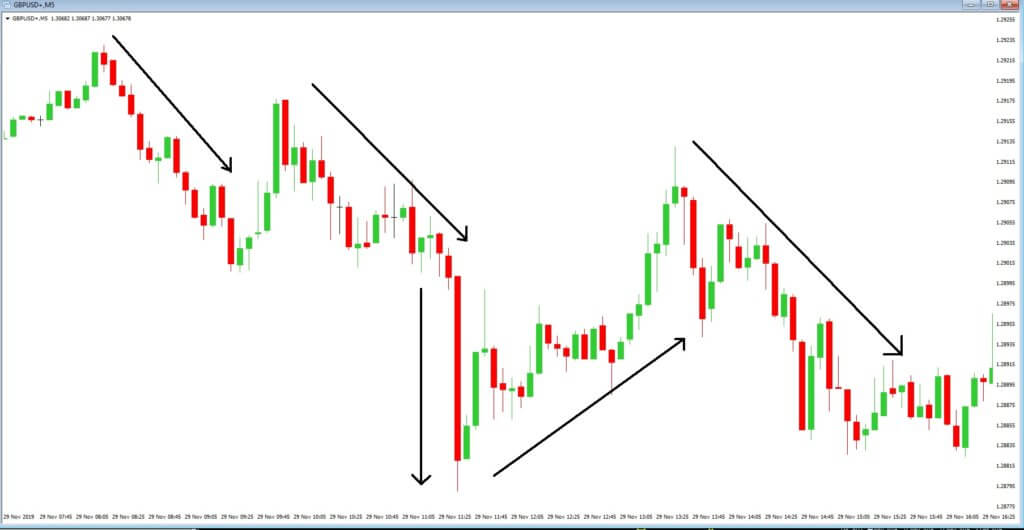
The GBP/USD currency pair dropped but recovered a significant part of its early declines to weekly lows manly in the reaction to the latest election polls results. As of now, the GBP/USD currency pair is currently trading near the 1.3179 and consolidates in the narrow range between 1.3108 – 1.3188 after the Fed holding rates steady yet signaling that there will not be a change in rates in 2020, something quite to the contrary of Fed watchers.
The pair continued the previous session’s late pullback from over eight-month highs and saw some follow-through long-unwinding trade on Wednesday in the wake of the latest U.K. election poll, which tilted towards a hung parliament.
A closely watched YouGov’s poll based on the MRP model showed a narrowing lead for Prime Minister Boris Johnson’s Conservative Party, now expected to win a majority of 28 seats in the parliament, falling sharply from 68 last month.
The slight pick up in the greenback demand, despite the uncertainty of President Trump regarding the phase-one trade deal between the United States and China, further collaborated to the pair’s intraday slide to the 1.3100 neighborhood.
No:1 Key takeaways from FOMC statement and projections
No:2 The market has priced in virtually no chance of rate move through February.
No:3 IOER 1.55% vs 1.55% prior.
No:4 Fed drops language about ‘uncertainties about this outlook remain.’
No:5 The vote was unanimous.
No:6 The Committee will continue to monitor the implications of incoming information for the economic outlook, including global developments and muted inflation pressures, as it assesses the appropriate path of the target range for the federal funds rate.”
No:7 No changes in the economic outlook paragraph*
No:8 Says, “the current stance of monetary policy is appropriate.”
No:9 Leaves forecasts for GDP and inflation unchanged lowers
unemployment.
No:10 The median forecast is for one rate hike in 2021 and one in 2022.
Looking forward, we are now counting down to the U.K. election vote for Thursday, where results are expected to come in from around 0200 GMT onwards. Pound Sterling has been improving because of yesterday’s YouGov outcome that proved the Conservative’s lead was narrowing.
Daily Support and Resistance
- S3 1.3056
- S2 1.3104
- S1 1.3124
Pivot Point 1.3153
- R1 1.3173
- R2 1.3202
- R3 1.325
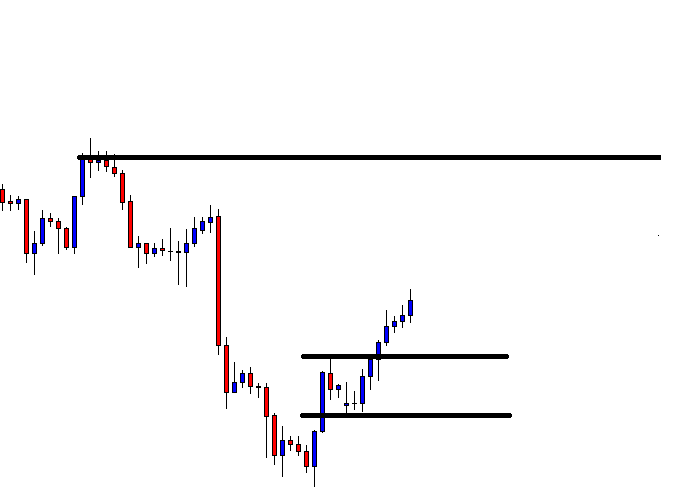
GBP/USD– Trading Tip
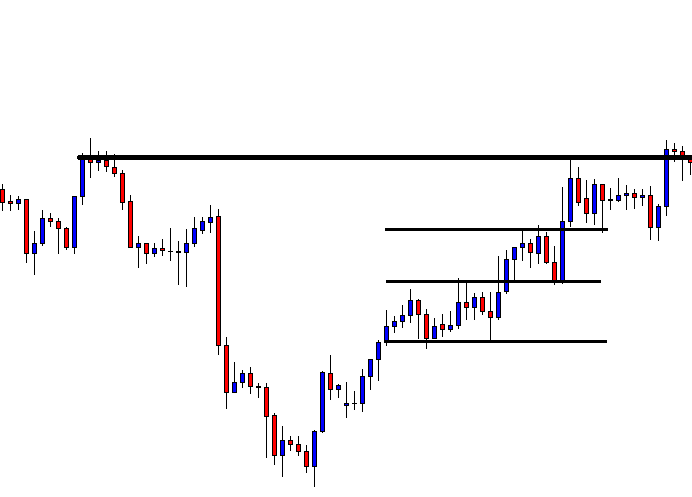
The GBPUSD is displaying a solid bullish bias as traders seem confident about the victory of the Conservative party and assume Boris Johanson to win the election. The GBP/USD may persist massively volatile today, and a day after, as the election result will start reaching out by tomorrow morning. On the higher side, the GBP/USD is expected to find resistance around 1.3265 and 1.3336. While the support can be seen near 1.3185 and 1.3110.
The RSI and MACD are in the bullish zone, signaling chances of a bearish correction, but then the Sterling will be found to do more upward movement.
USD/JPY – Daily Analysis
The USD/JPY currency pair initially hit the bullish track and rose to 108.76 and the reversed falling to 108.57, the new daily bearish level after the decision of the Federal Reserve to keep the rate unchanged. As of writing, the USD/JPY currency pair is currently trading at 108.60, slightly lower as compared to previous before the statement.
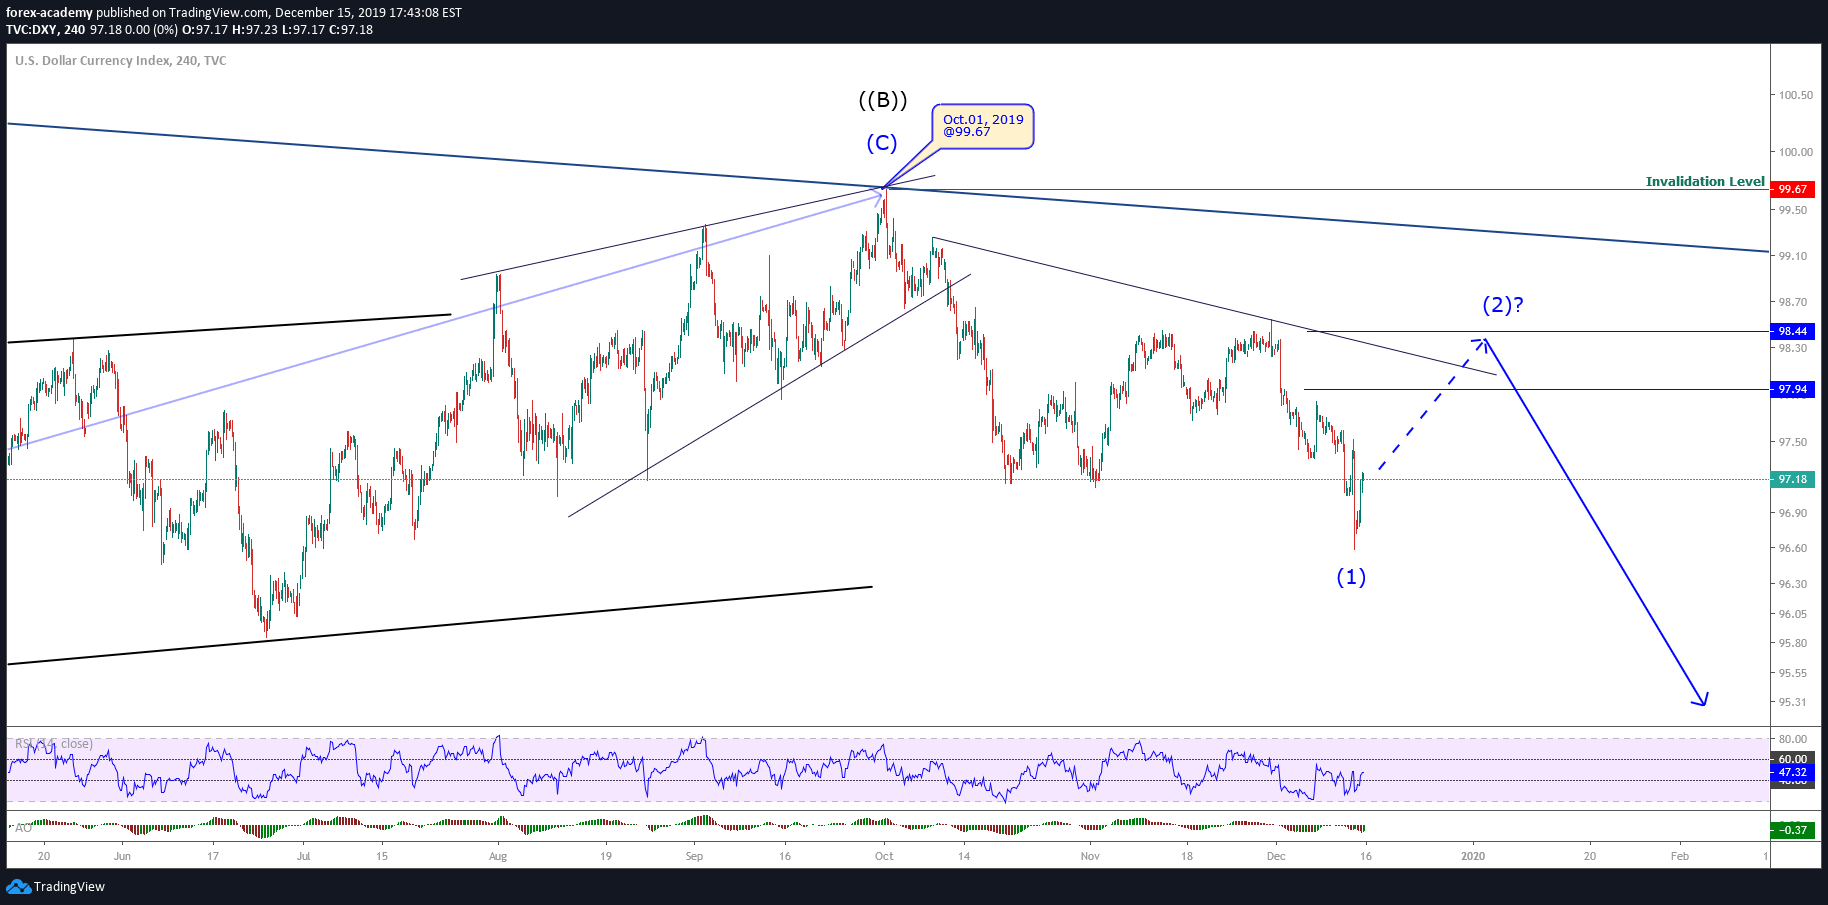
The greenback dropped across the bard and hit the fresh bearish levels. The U.S. Dollar Index dropped under 97.30, the lowest level since November 4. The United States’ yields moved to the downside, and equity prices in Wall Street rose but remain under the highs.
At the Sino-US front, the clock is ticking because we close in on the deadline on the so-called ‘phase- one’ deal and/or tariff delay by December 15. We are awaiting an announcement from U.S. President Donald Trump to come before the weekend’s deadline. Moreover, the news yesterday that tariffs would be delayed caused a short period of risk-on in the markets. Still, the news was unconfirmed, and Trump’s closest advisers tell the decision is finally depend on the president.
Daily Support and Resistance
- S3 108.06
- S2 108.31
- S1 108.43
Pivot Point 108.56
- R1 108.68
- R2 108.8
- R3 109.05
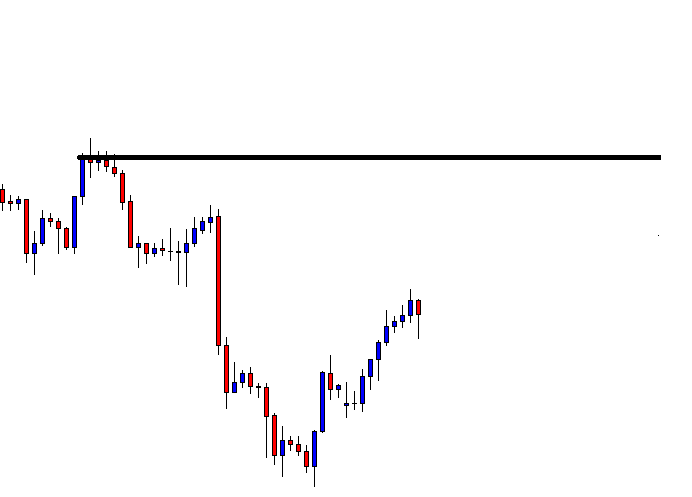
USD/JPY – Trading Tips
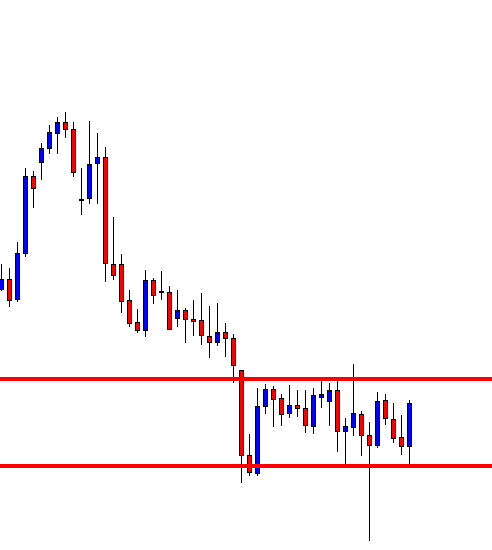
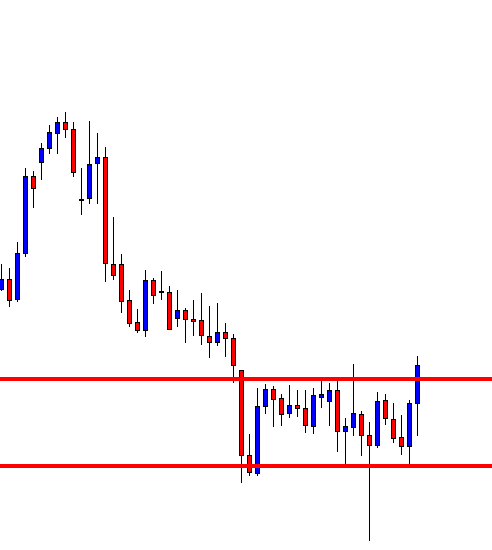
On Thursday, the dovish FOMC and weaker U.S. dollar have driven sharp selling in the USD/JPY currency pair this week. For now, the pair is trading above 108.550, which is working as a double bottom support level.
A bearish breakout of this level can trigger selling until 108.250. The USD/JPY has already completed 81% retracement on three hourly charts, and this level can give some support to USD/JPY. Above this, the pair may find resistance around 108.900. Let’s wait for NFP to determine the further trend of USD/JPY.
All the best!