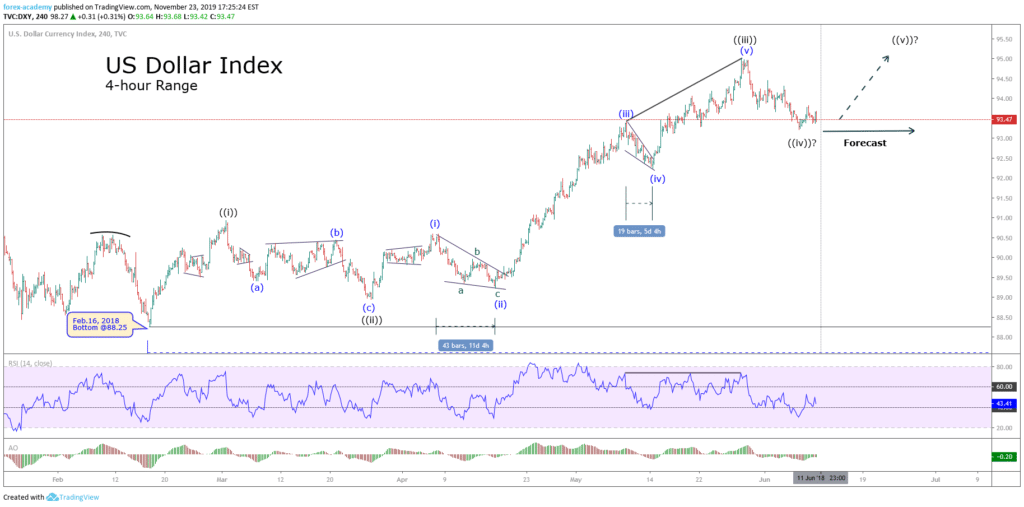
The U.S. Dollar Index rose edged down to 98.27 from 98.33 during the previous week. The euro edged up 0.1% to $1.1015. Official data showed that November consumer prices in the eurozone increased 1.0% on year in November (+0.9% expected), and October jobless rate was at 7.5% (as expected, 7.6% in September).
The U.S. stocks closed lower while ending November with the most significant monthly gain since June. The Dow Jones Industrial Average fell 112 points (-0.4%) to 28051, the S&P 500 lost 12 points (-0.4%) to 3140, and the Nasdaq Composite was down 39 points (-0.5%) to 8665.
Economic Events to Watch Today
Let’s took at these fundamentals.
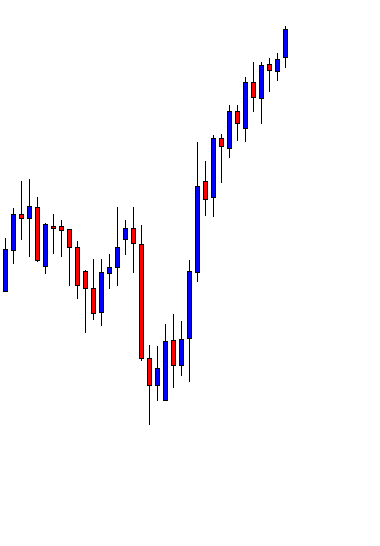
EUR/USD – Daily Analysis
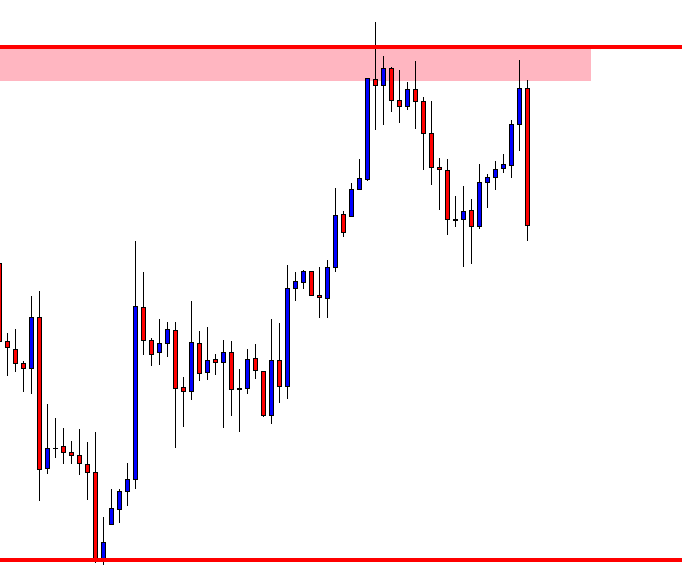
The EUR/USD currency pair hit the bearish track and continue to flashing red despite the positive China manufacturing data. As of writing, the EUR/USD currency pair currently trading near the 1.1018, representing slight declines on the day and consolidates in the range of 1.1015-1.1028.
The Caixin PMI, which surveys the small and medium-sized export-oriented units, increased to 51.8 in November from October’s 51.7 to record the fastest expansion in 3-3-years. While the official PMI released on Saturday also printed well above 50 to mark the first expansion in 13 months.
As in result, the risky assets getting bids due to data. For example, Japan’s Nikkei surged by1% in Asia, and the NZD/USD pair rose to a one-month high. Even so, the EUR currency is struggling.
Looking ahead, the EUR/USD currency pair may take bids if the European Central Bank (ECB) President Christine Lagarde’s pushes European leaders to boost spending, indirectly hinting low chances of more monetary stimulus in the foreseeable future. Notably, the Lagarde’s testimony is scheduled to happen at 14:00 GMT.
The market’s focus will shift to the U.S. data on the North American session. The US ISM Manufacturing PMI (Nov), due at 15:00 GMT, is forecasted to print at 49.4 against 48.3 in October. An above-50 print may put pressure on EUR/USD.
The final German and Eurozone PMI numbers scheduled to release in Europe may not have a big impact, unless they carry a significant upward or downward revisions to the preliminary figures released on November 22.
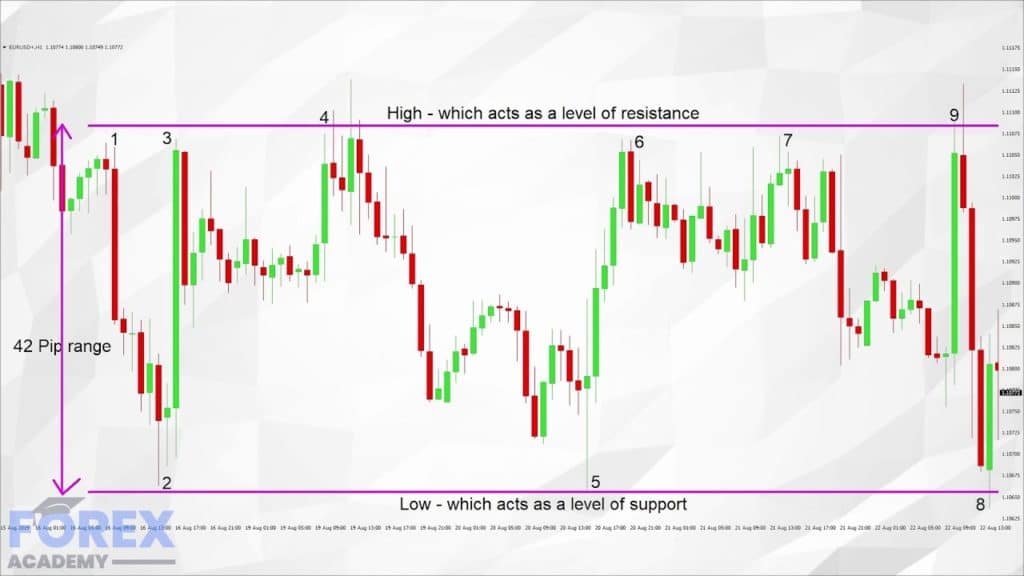
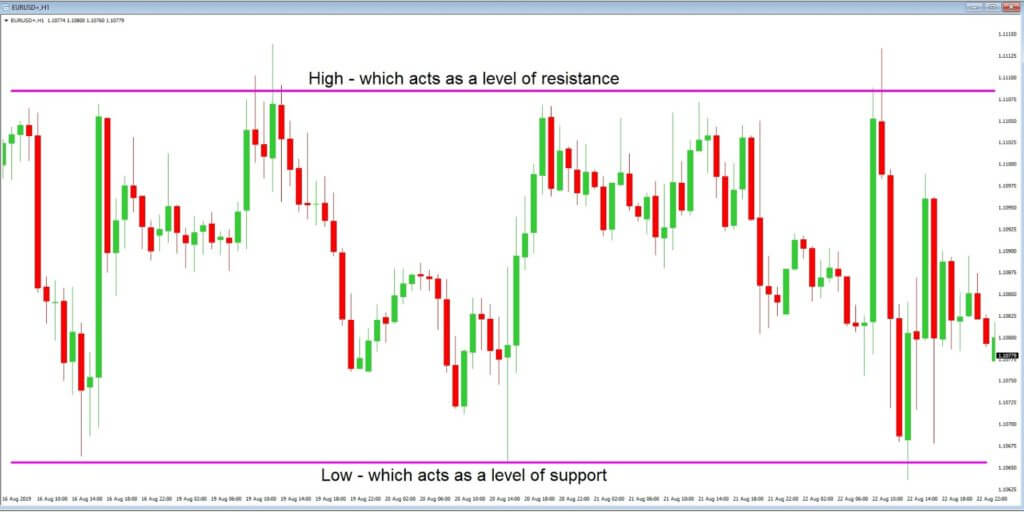
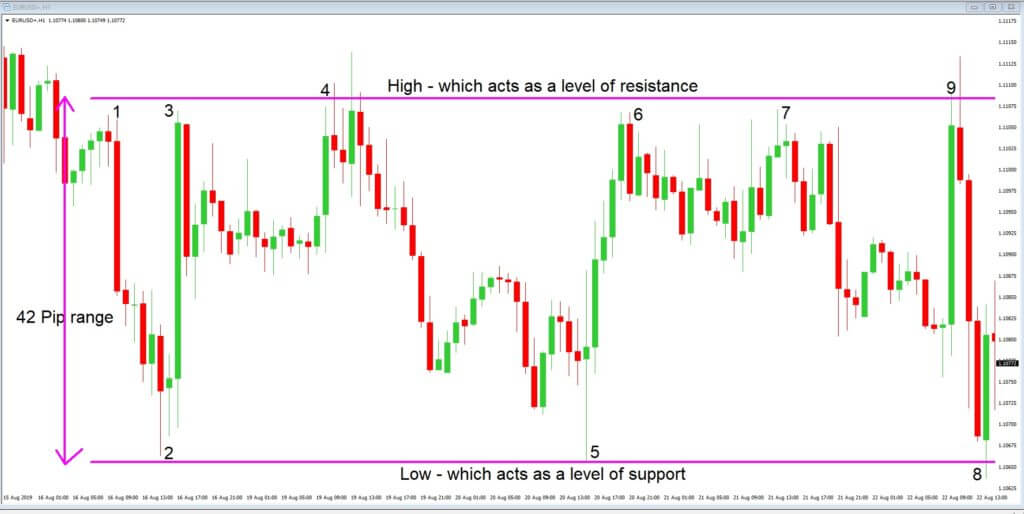
Daily Support and Resistance
- S3 1.0915
- S2 1.0962
- S1 1.099
Pivot Point 1.1009
- R1 1.1037
- R2 1.1056
- R3 1.1103
EUR/USD– Trading Tips
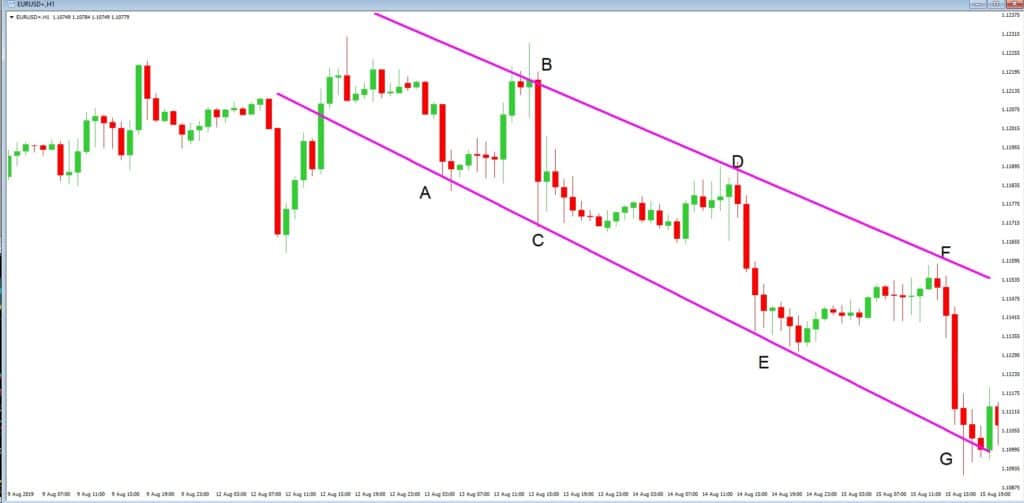
Traders are strengthening the downside bias amid positive NFP forecast, which is due to release later this week. The EUR/USD disrupted the tight trading range of 1.1016 – 1.0992 to trade near the 1.1020 trading level.
At the moment, the EUR/USD’s now consolidating in a narrow trading range of 1.1030 – 1.1015. A bullish breakout of 1.1030 can lead the EUR/USD prices towards 1.1055, and on the lower side, 1.0985 endures the final support.
GBP/USD– Daily Analysis
The GBP/USD currency pair flashing red and representing 0.10% losses. As of writing, the cable pair is currently trading at 1.2915 and consolidates in the narrow range between 1.29107 and 1.2918 at the start of the week, mainly due to series of United Kingdom election polls which doing limited to affect a leading Tory sentiment.
The GBP currency was seen stronger in the recent times in the wake of Brexit Party promising not to stand against the Tories in voters where there is a sitting Tory MP, underpinning the probability of a Tory majority after the quick threat of no-deal Brexit.
The investors are now keeping their eyes on the election outcomes. Still, the market will likely hold the risks of talks between the United Kingdom and the European Union, which may cover any quick bullish move in the GBP on a Tory victory.
At the Sino-US front, doubts over the phase-one deal between the United States (U.S.) and China are weighing on the greenback, whereas recently, actual activity data from China adds strength to the risk sentiment.
Looking forward, the market will keep their eyes on the U.S. main event in the U.S. nonfarm payroll jobs report. We expect employees to increase by 200k in November, after the above-consensus 128k October print.
All traders will keep their eyes on the trade and political headlines November month Purchasing Managers’ Index (PMI) data from the U.S., and the U.K. will likely offer intermediate moves. Including, U.K. Manufacturing PMI, anticipated 48.3, will be the first to observe ahead of the U.S. Markit and ISM activity indices.
Estimates suggest the Markit PMI remain unchanged at 52.2, but ISM Manufacturing PMI may rise to 49.9 from 45.5.
Daily Support and Resistance
- S3 1.2784
- S2 1.285
- S1 1.2889
Pivot Point 1.2917
- R1 1.2955
- R2 1.2984
- R3 1.3051
GBP/USD– Trading Tips
The cable pair is currently trading at 1.2915 and consolidates in the narrow range between 1.29107 and 1.2918 at the origin of the week, mainly due to series of United Kingdom election polls which doing limited to affect a leading Tory sentiment.
On Friday, the GBP/USD continues to above the suggested support level of 1.2880. The pair has formed neutral candles above this level as traders are waiting for a fundamental reason to get in the market.
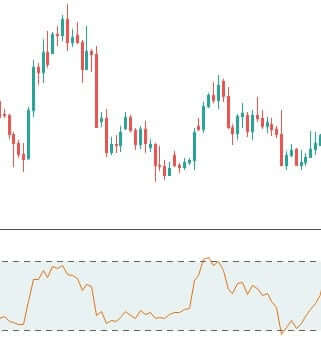
On the 2-hour timeframe, the RSI and MACD are holding near 50 and 0, suggesting neutral bias among investors. Therefore, we may see a slightly bearish trend in the GBP/USD below 1.29400 area until a 38.2% Fibonacci retracement level of 1.2900. Consider staying bullish above 1.2900 today to target 1.2945/65.
USD/JPY – Daily Analysis
The USD/JPY currency pair hit the 6-months high 109.70; this is the highest level since May 30, by the way, the safe-haven currency Japanese Yen came under pressure after the upbeat China manufacturing data and uptick in the United States equity index futures.
As of writing, the USD/JPY currency pair is currently trading at 109.70, the highest level since May 30, and the S&P 500 futures are reporting a 0.30% rise.
As we all well aware that President Donald Trump signed the Hong Kong Democracy Bill. China criticized the move because interference into its internal matters regarding Hong Kong, China warned to take revenge.
However, China did not take any revenge so far, and that may support the risk assets. Moreover, the data released over the weekend showed China’s manufacturing sector unexpectedly increased in November. The purchasing managers’ index (PMI) for China’s manufacturing sector inched up to 50.2 in November from 49.3 in October. A reading above 50 indicates expansion.
At the greenback front, the U.S. dollar stayed little changed on Monday in Asia after the release of reliable economic data in the U.S. the previous week. The U.S. Dollar Index traded marginally higher early in the day, up 0.03% to 98.20 by 8:41 PM ET (01:40 GMT).
Looking forward, the initial indications of a turnaround in the world’s 2nd-largest economy support further upside in the risk assets and the USD/JPY pair. The Caixin China manufacturing PMI, which focuses on the small and medium-sized export-oriented units, printed above the estimate of 51.5 soon before press time.
Meanwhile, the bullish movement will likely weaken if the focus shifts to the negative news regarding the United States and China trade talks because the report came earlier today that the optimism between the United States and China decreased about the phase-one deal.
Daily Support and Resistance
- S3 108.98
- S2 109.25
- S1 109.38
Pivot Point 109.53
- R1 109.65
- R2 109.8
- R3 110.07
USD/JPY – Trading Tips
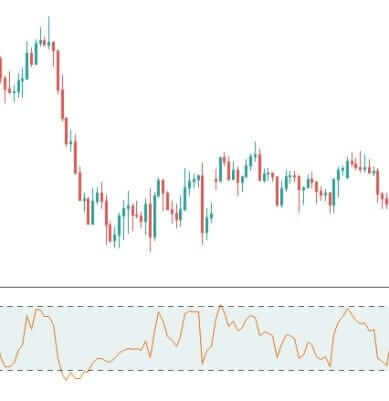
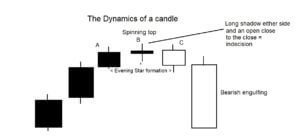
The USD/JPY is consolidating at 109.425, and it has just begun to trade in the overbought zone as the RSI and MACD are stuck in the overbought territory. On the 4 hour graph, the USD/JPY has created a Doji and Spinning top, which typically implies chances neutral bias in the USD/JPY. On the downside, the USD/JPY may drop towards 38.2% Fibonacci retracement until 109.150. Besides Fibonacci, the bullish channel is also supporting the USD/JPY at the same level. So look for taking a sell trade below 109.700 today to target 109.200 and buying above 109.300 to target 109.700.
All the best!


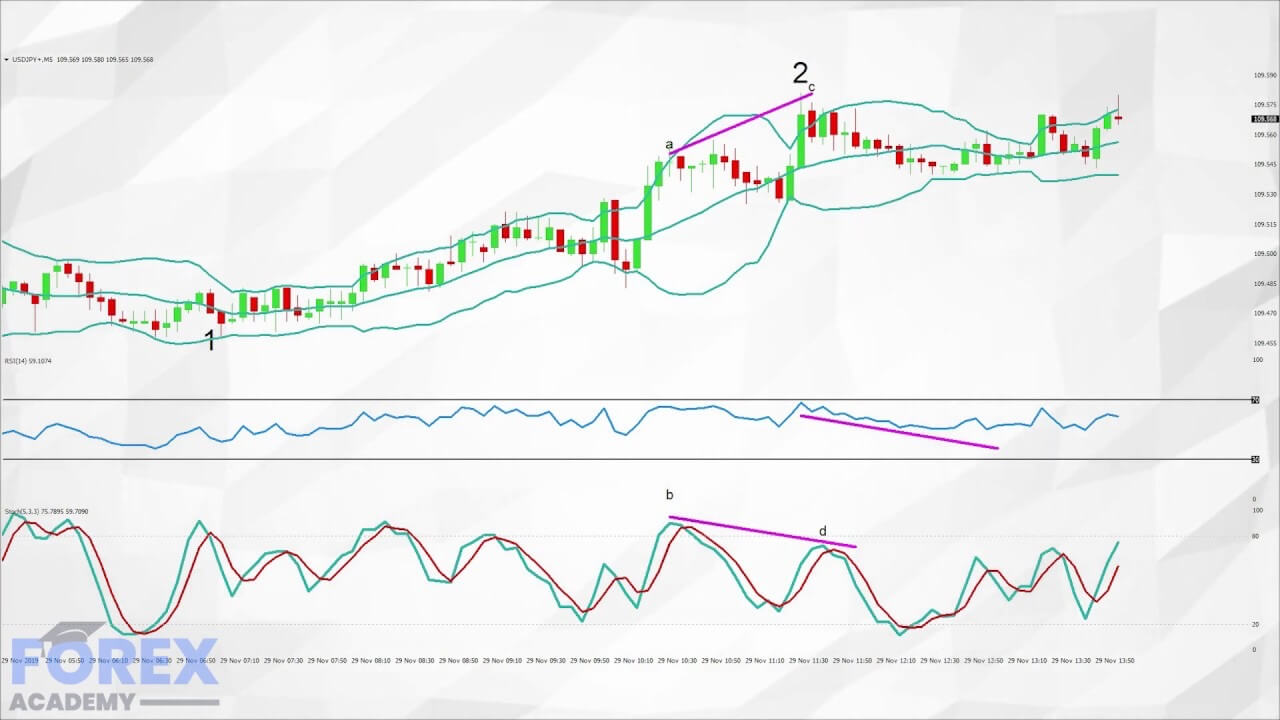
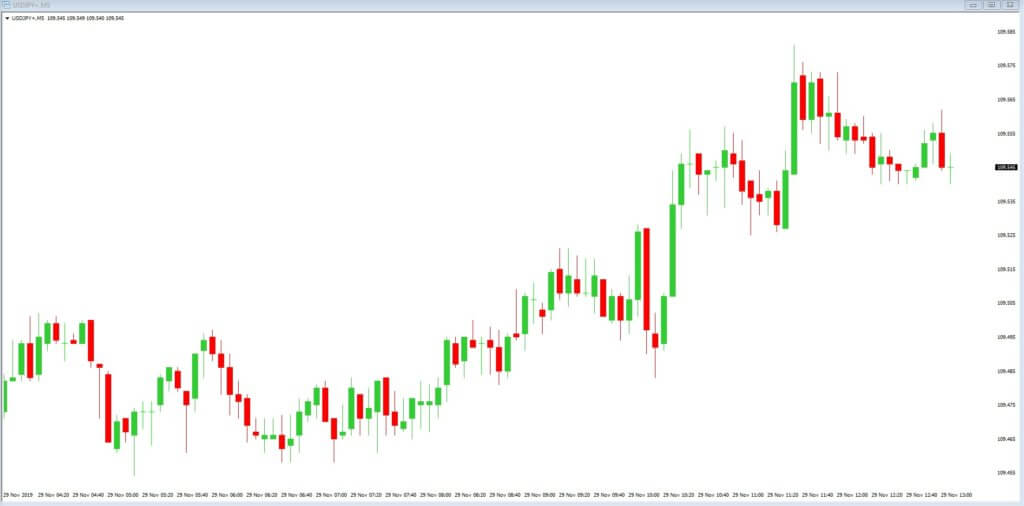
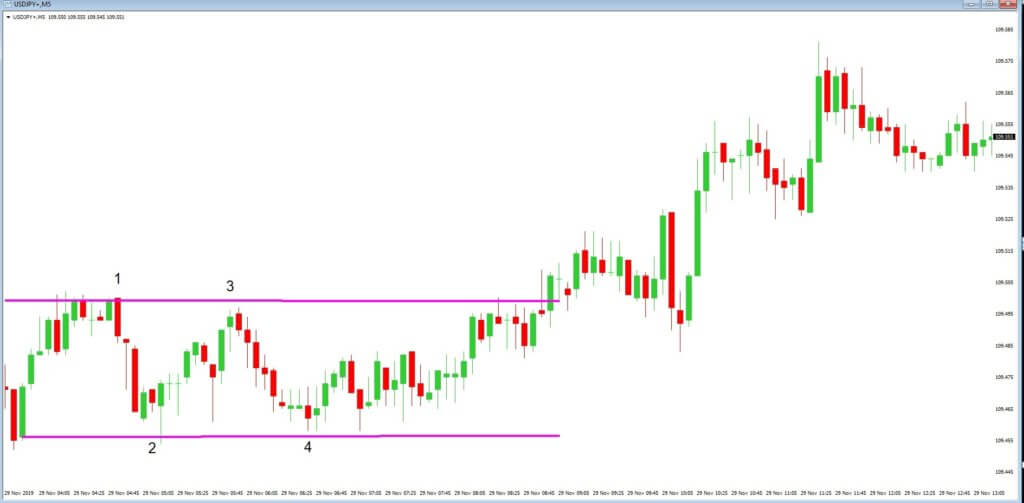
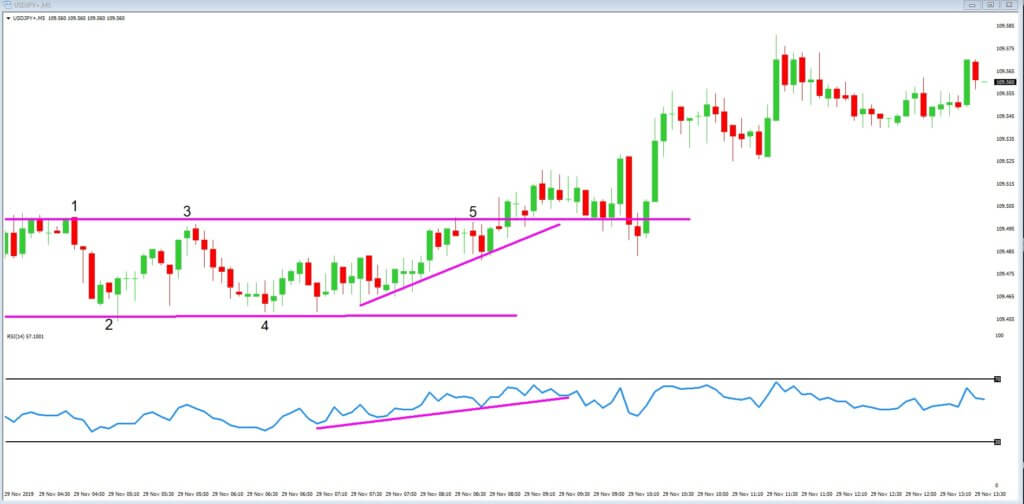
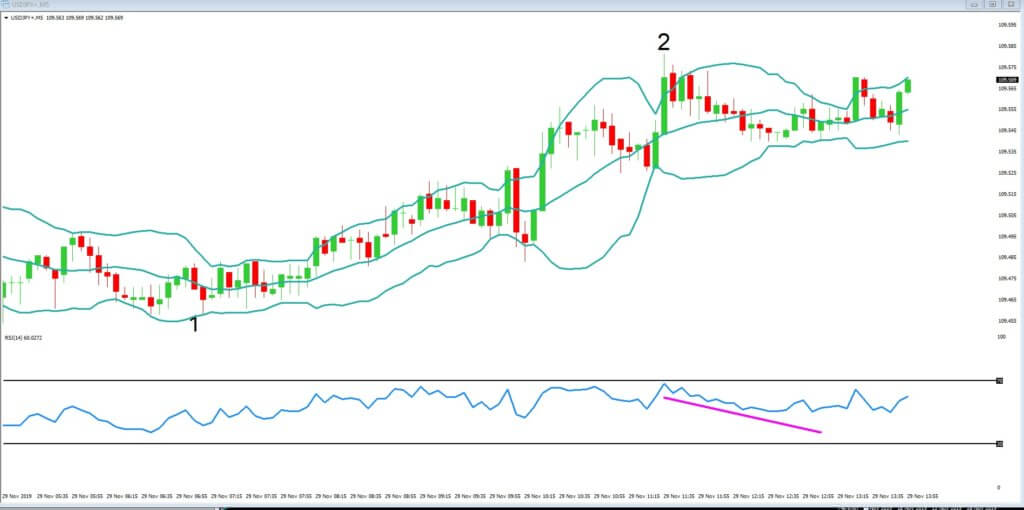
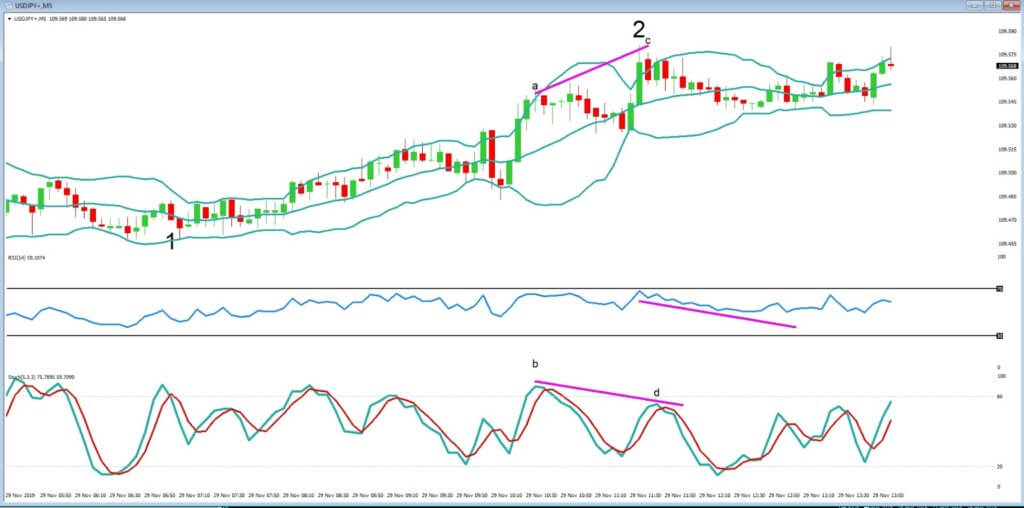


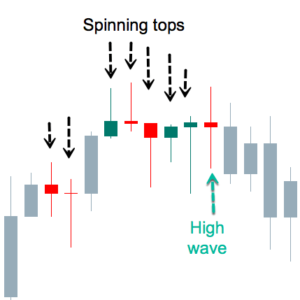


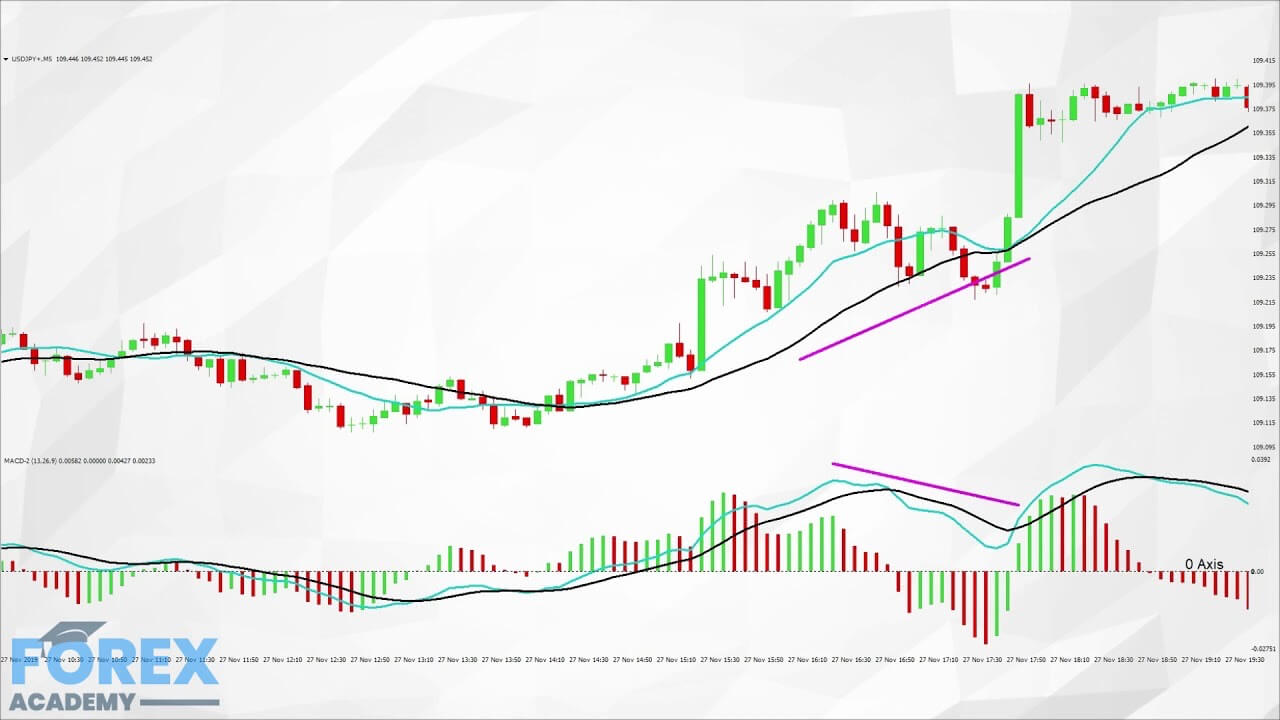
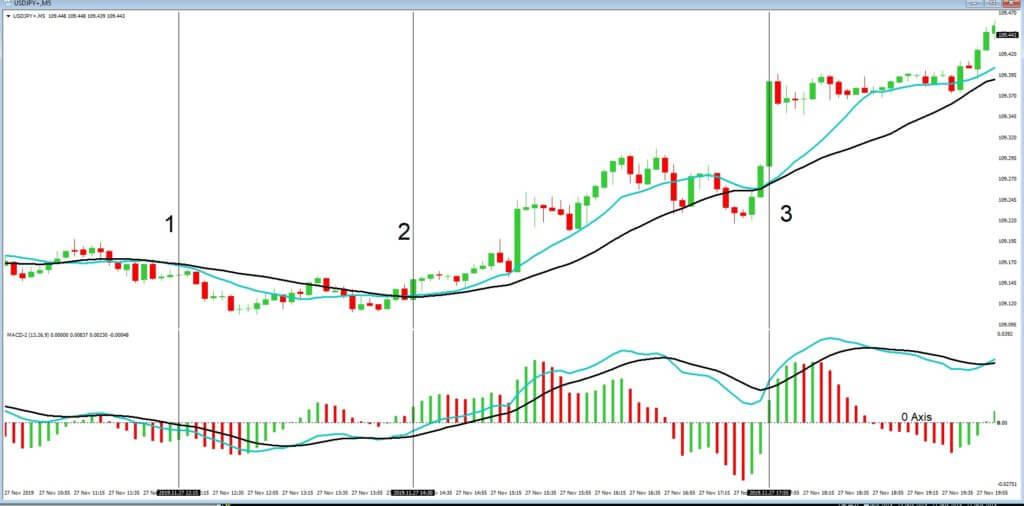
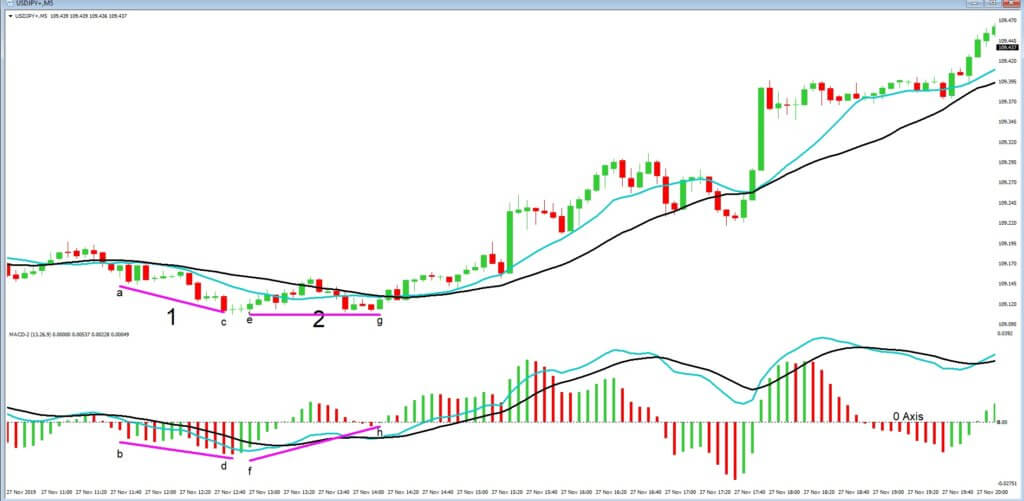
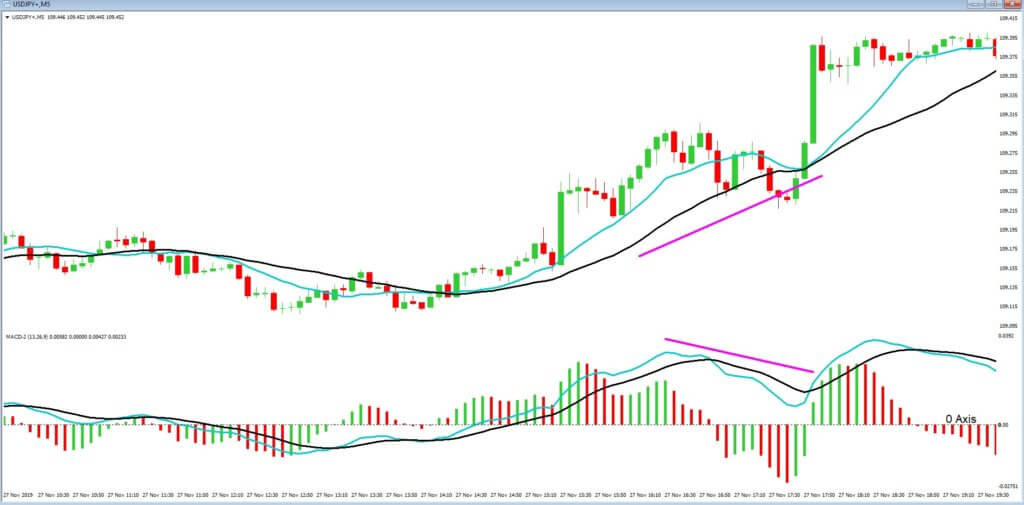
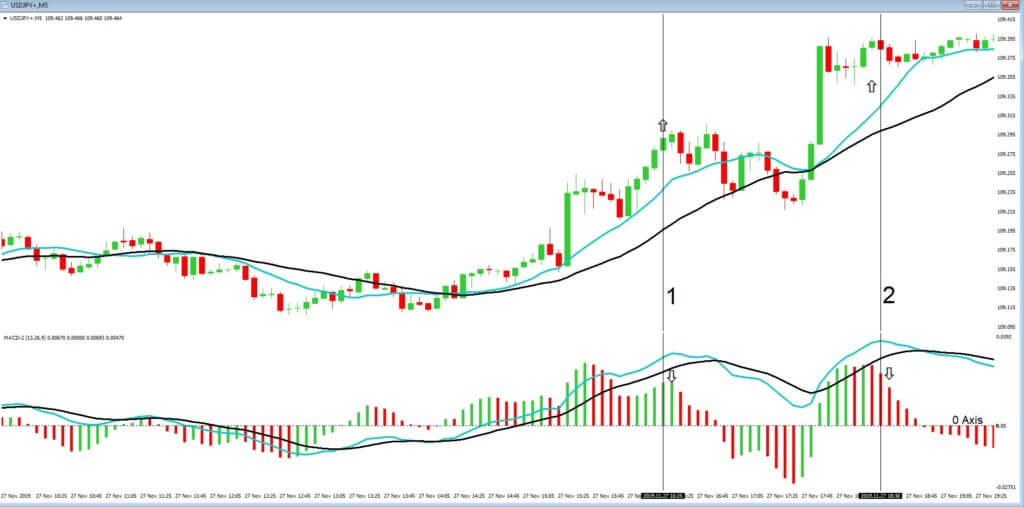
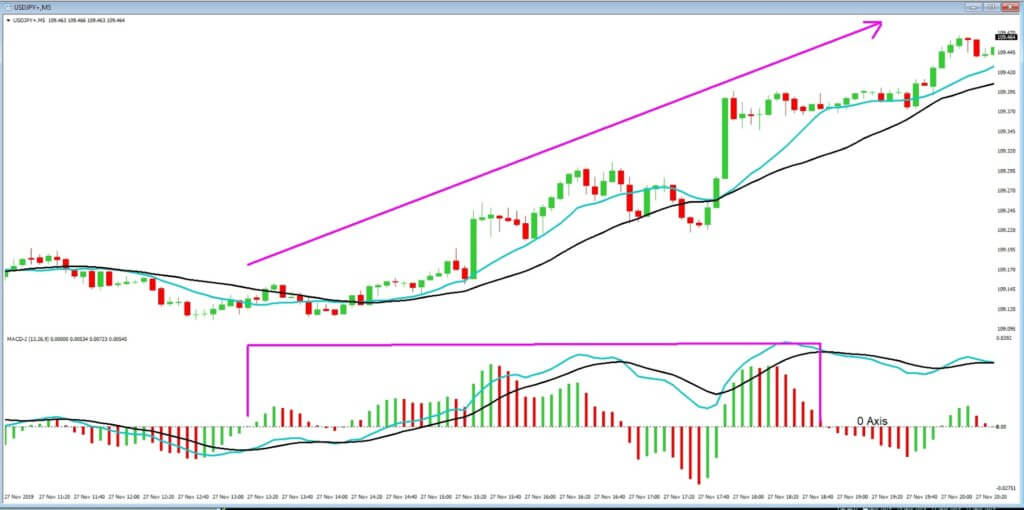
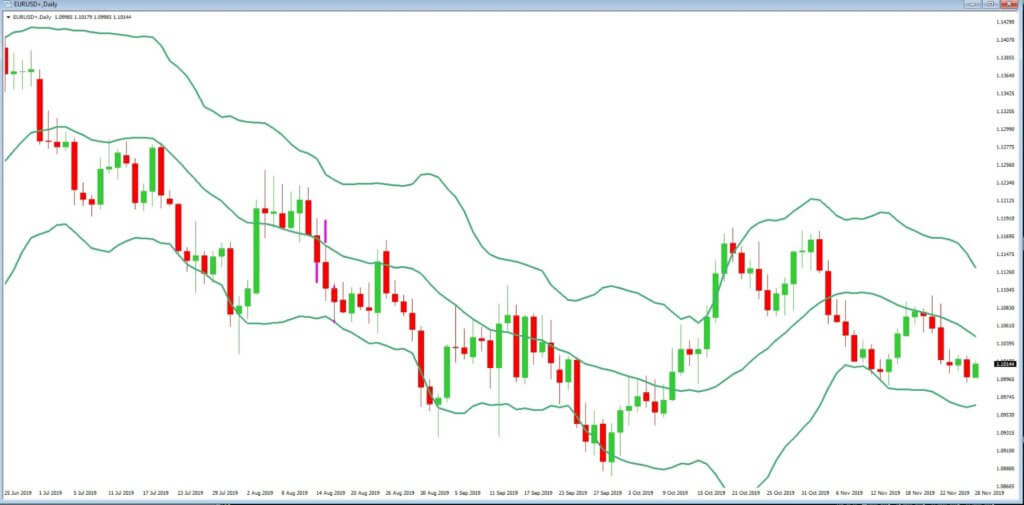

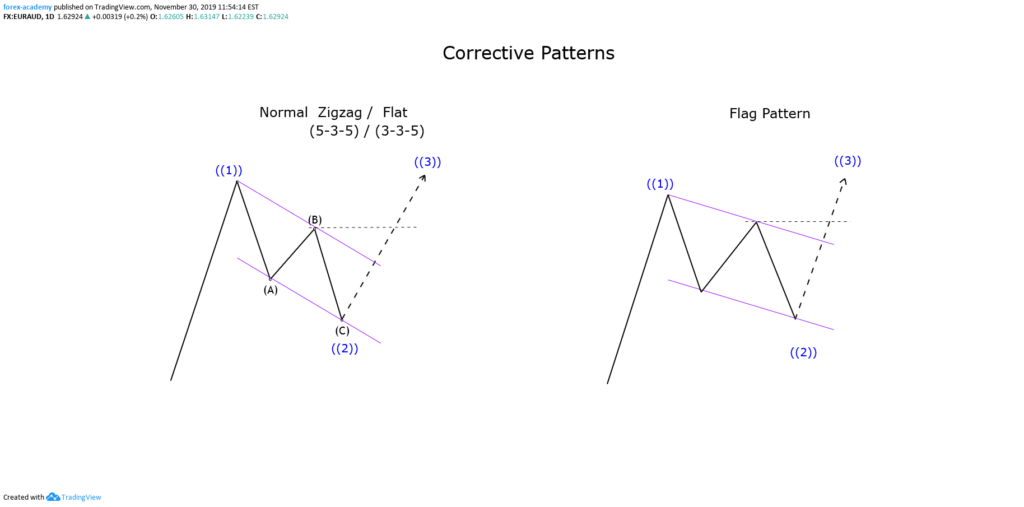
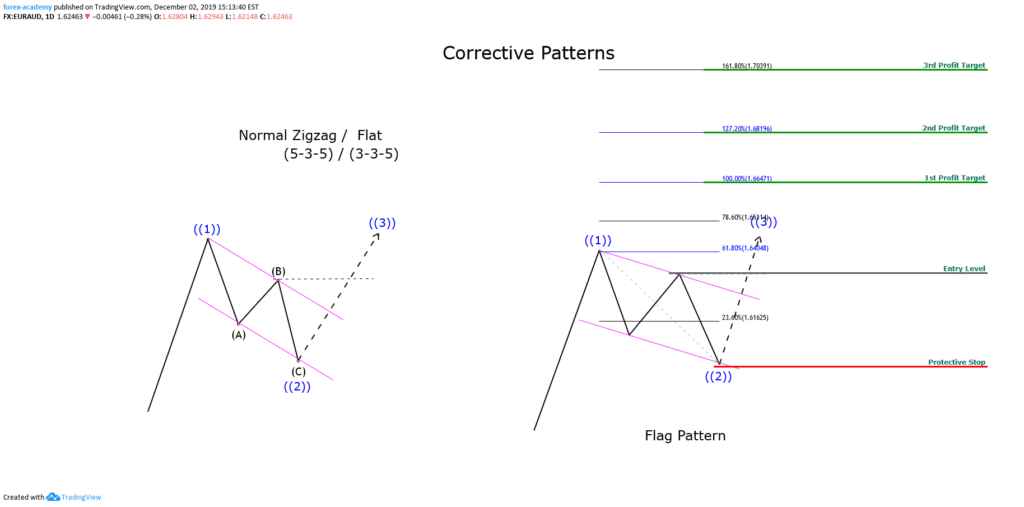


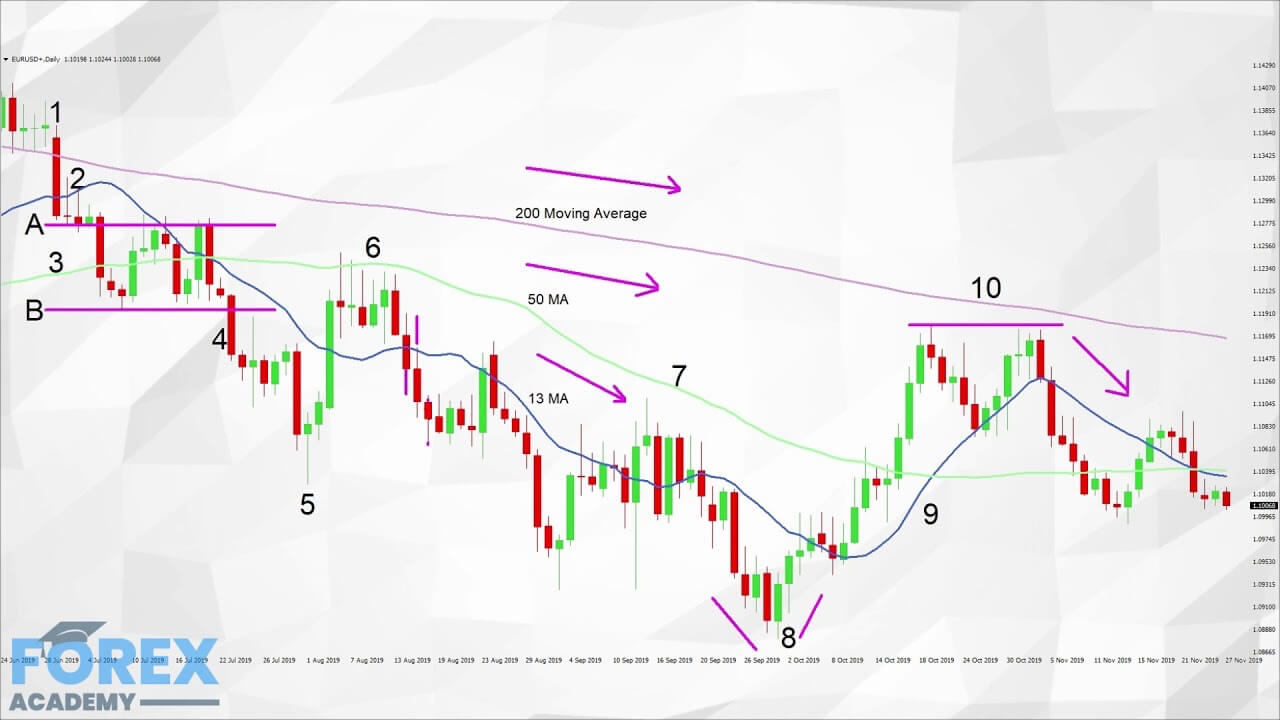
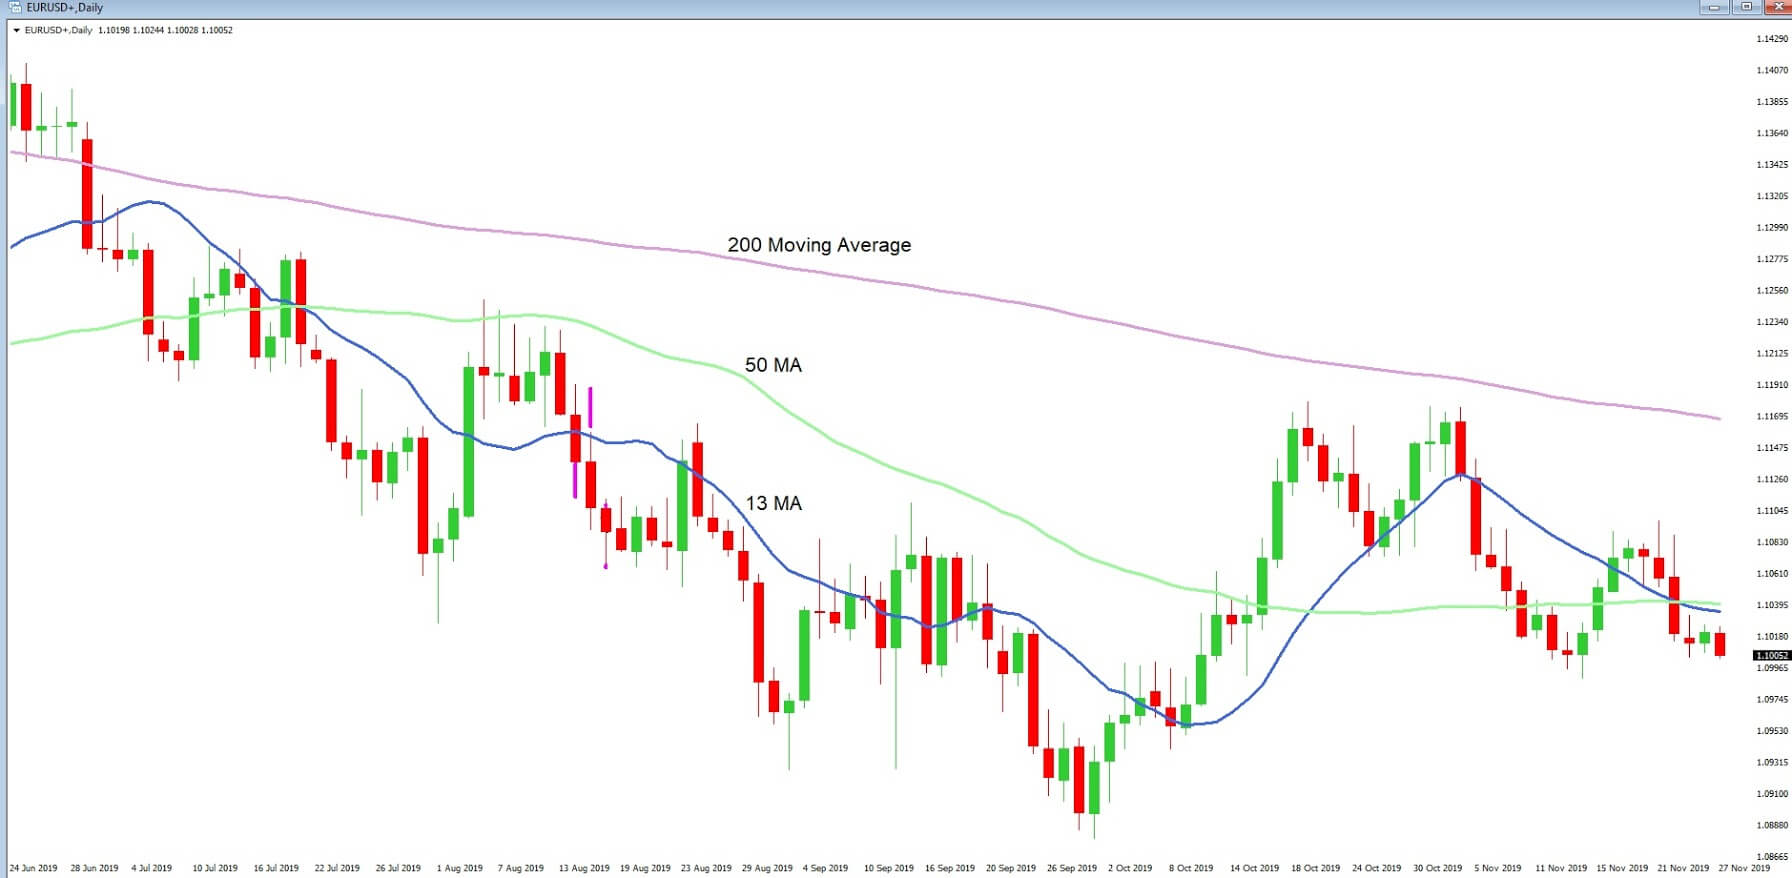
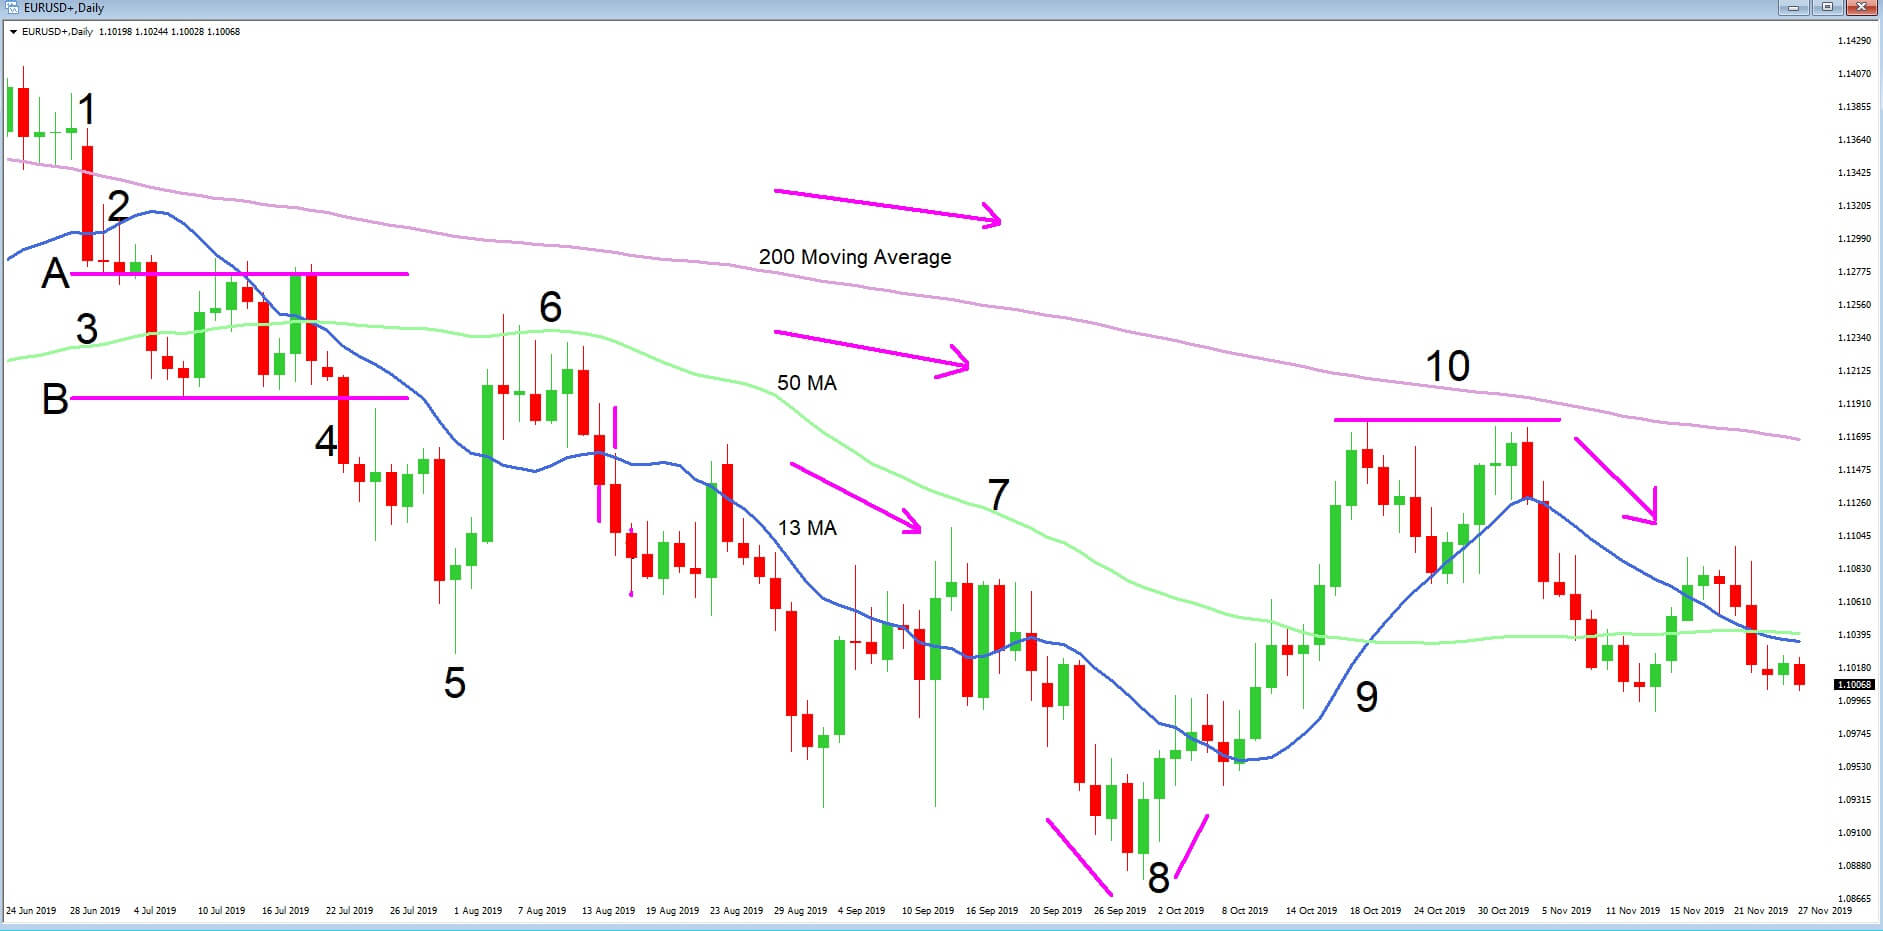
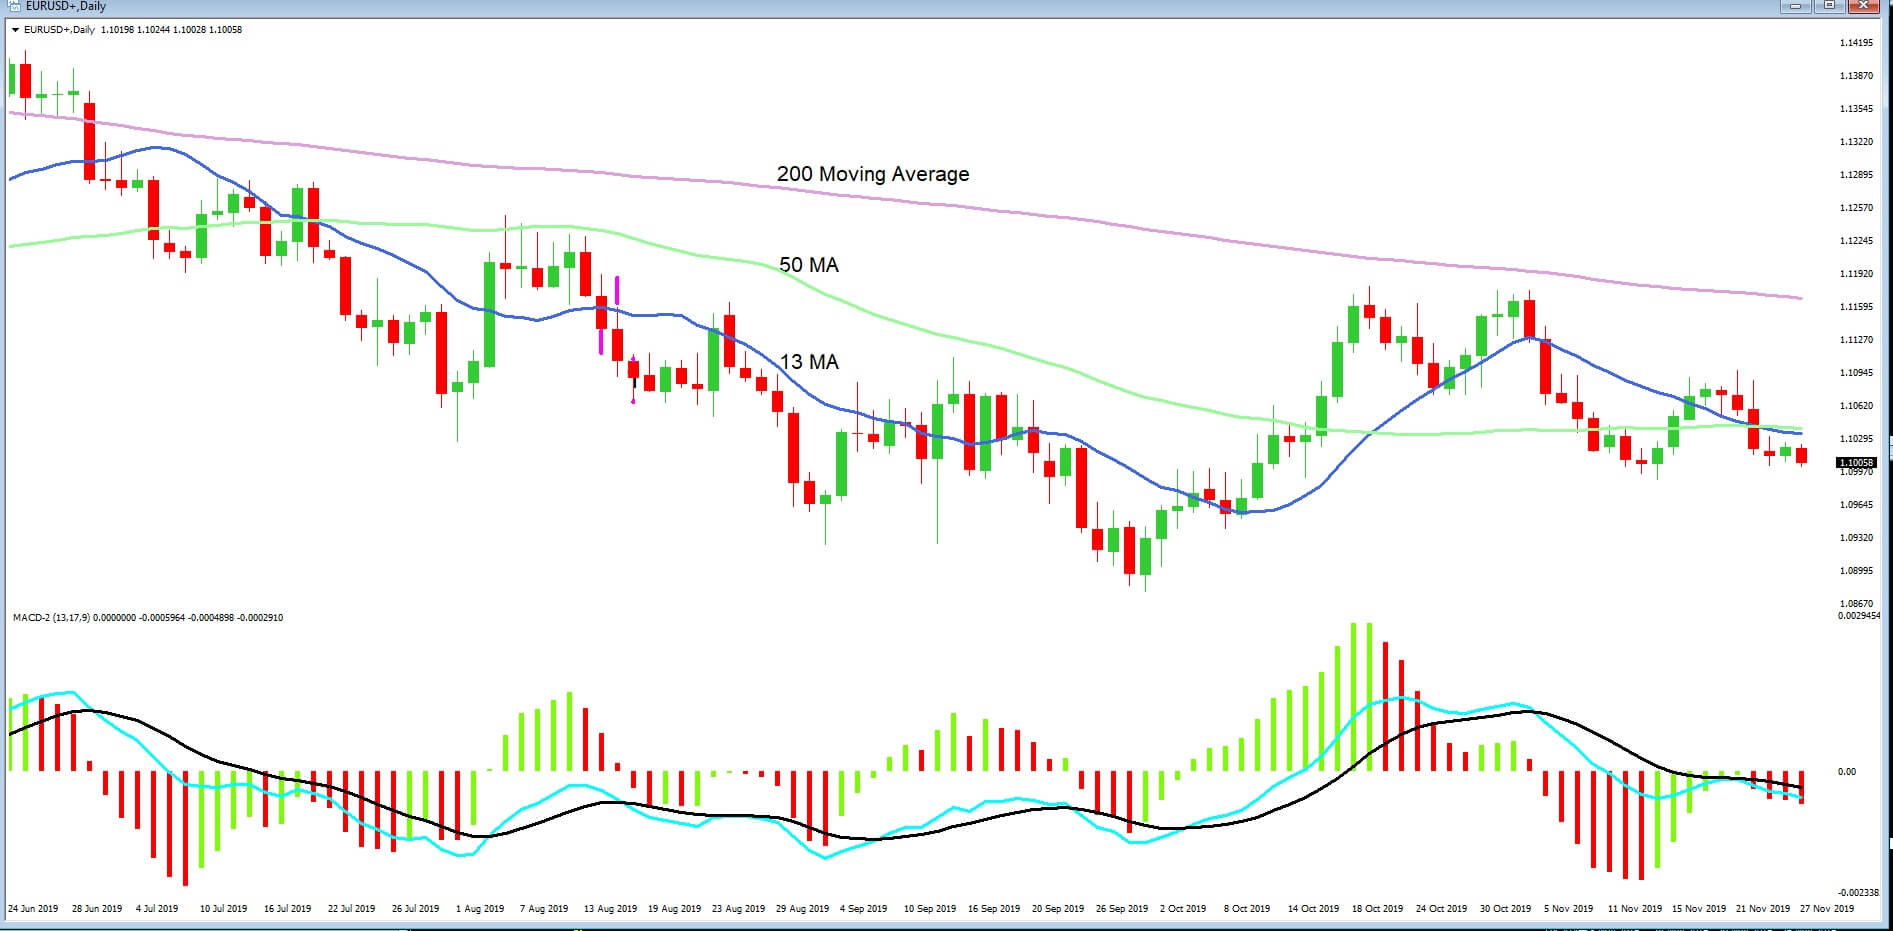
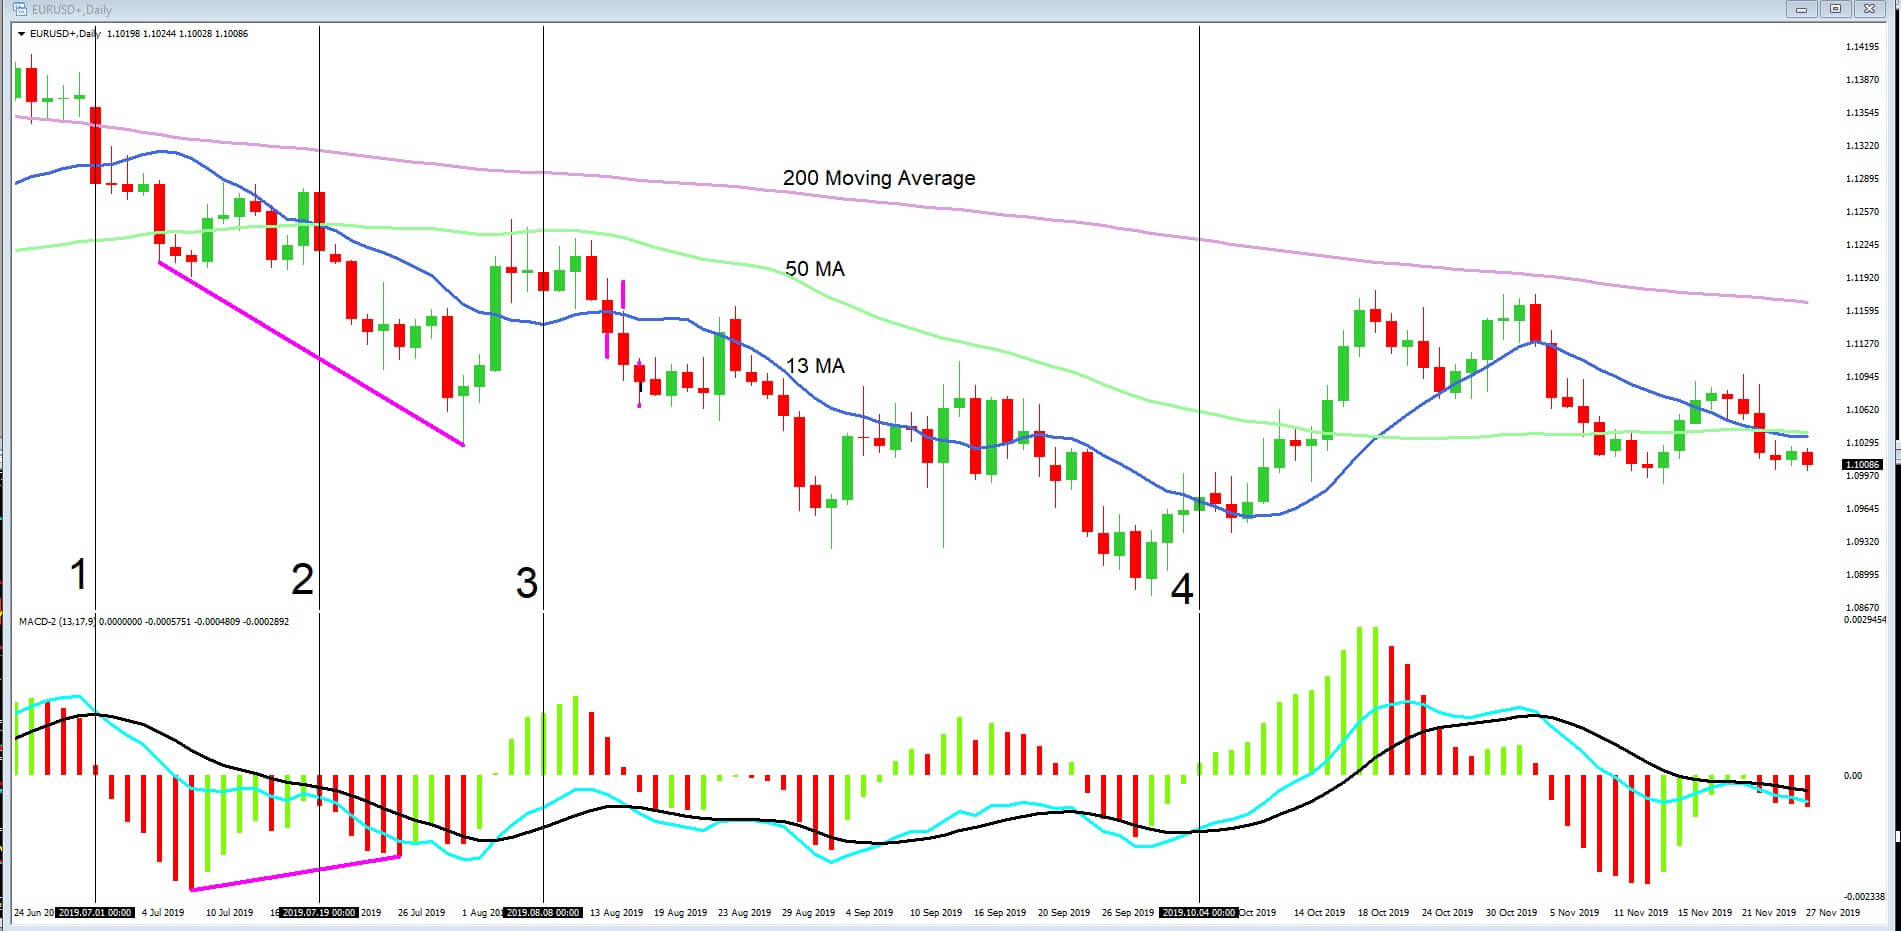
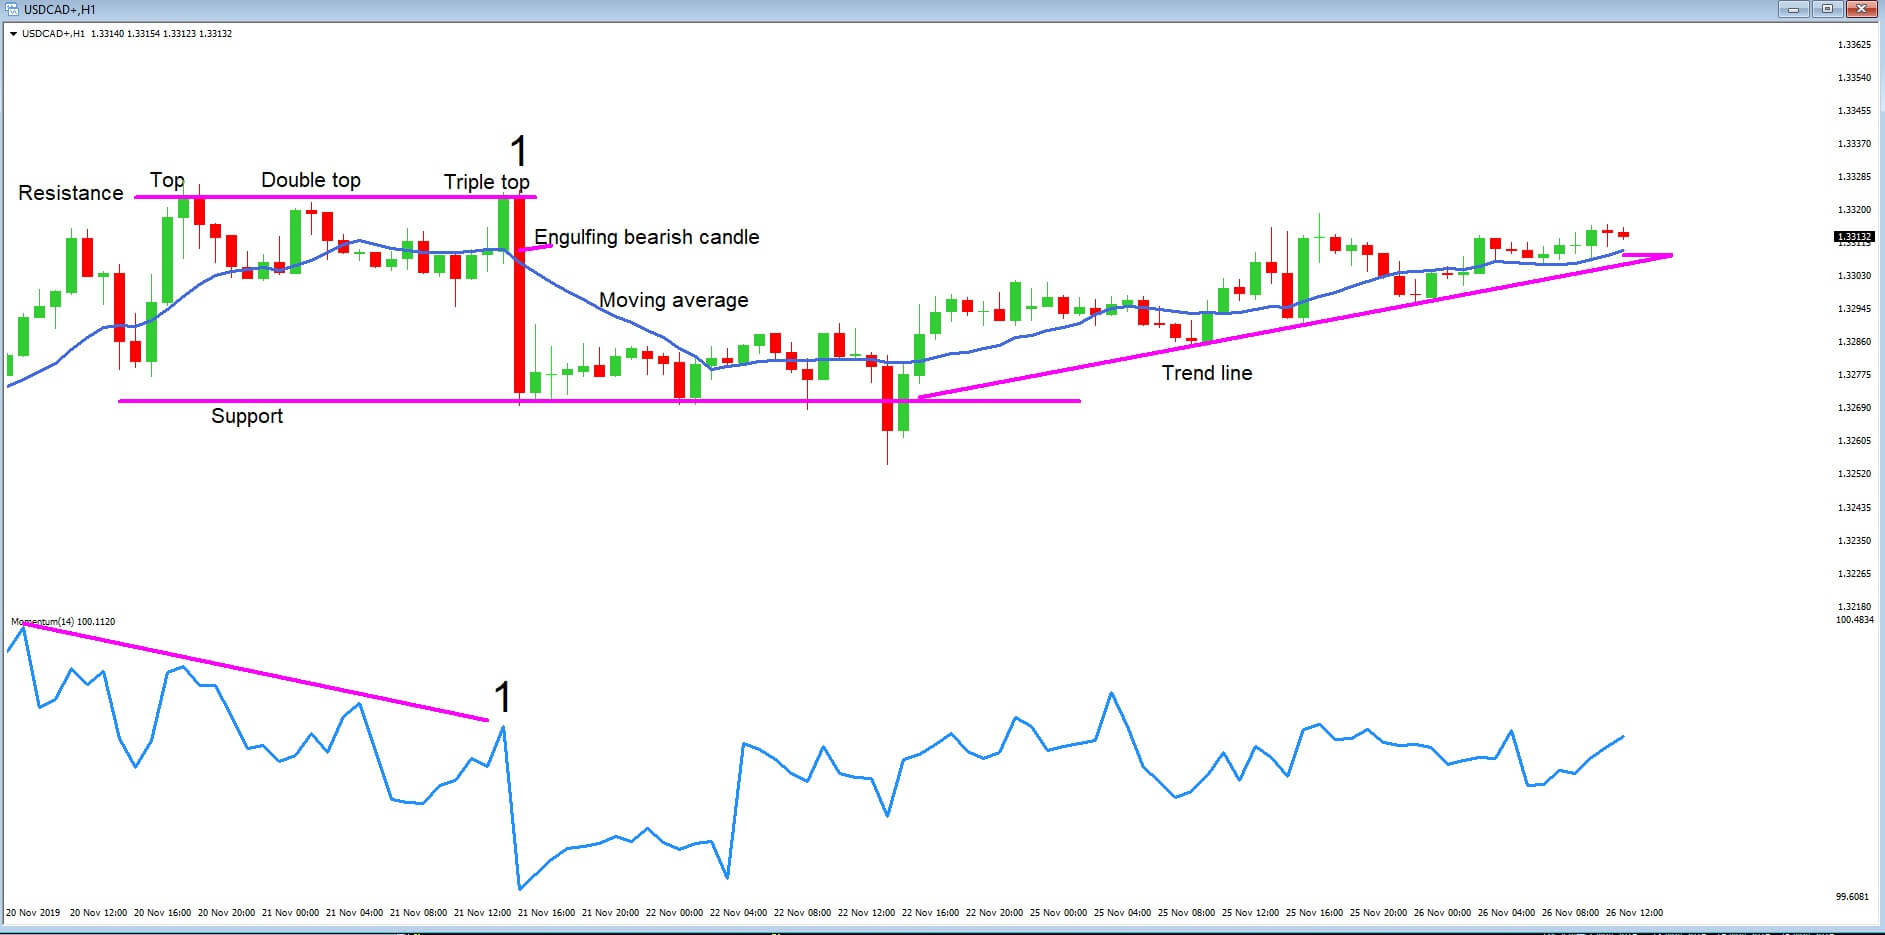
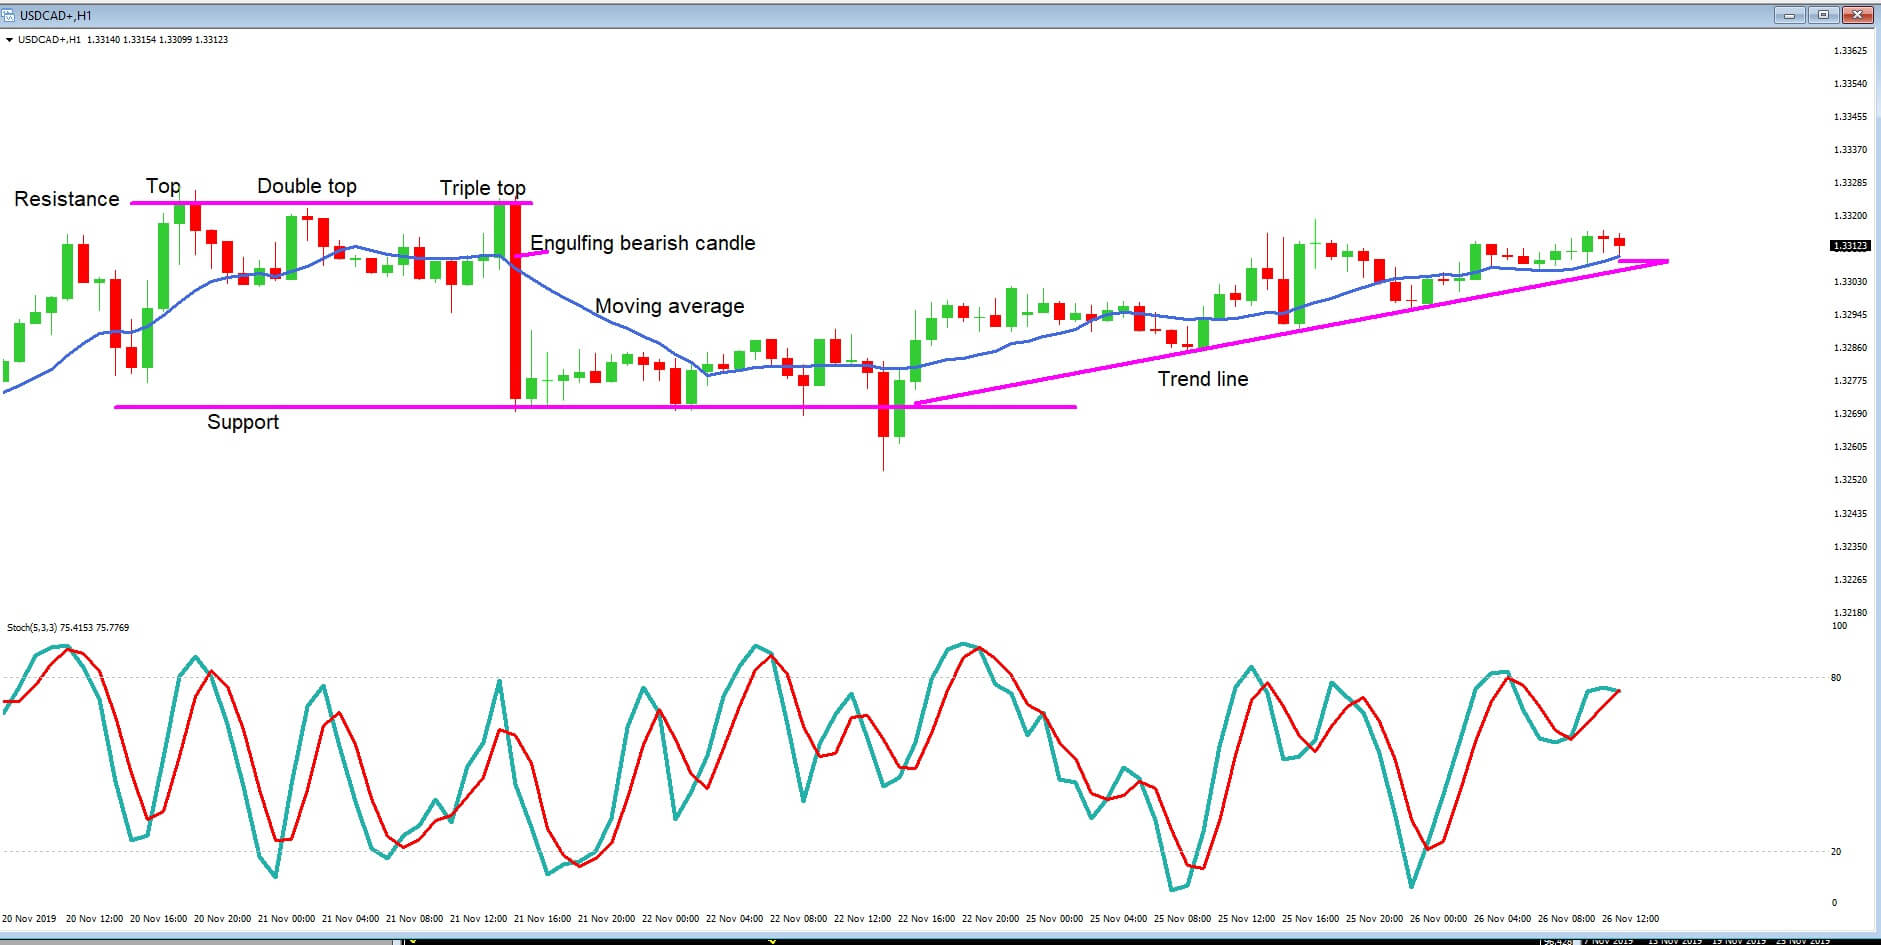


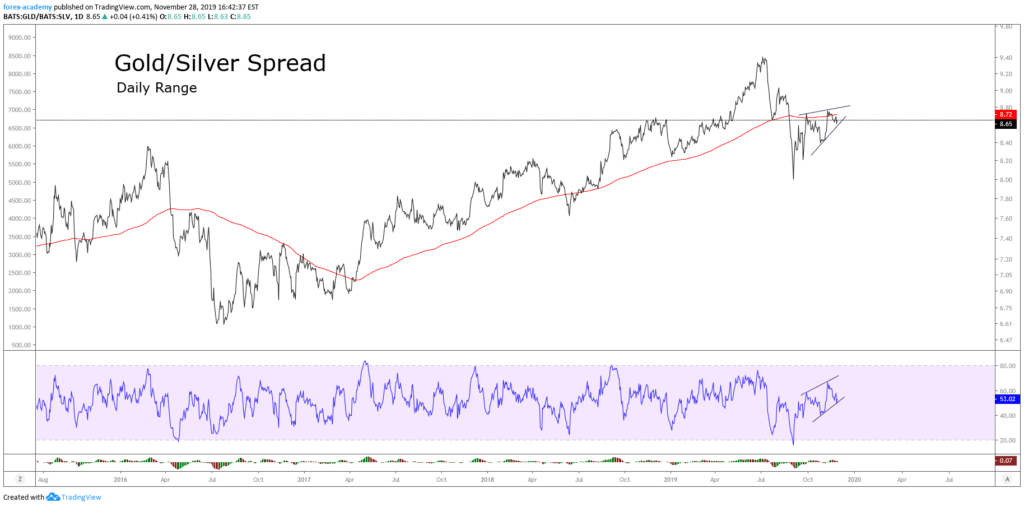
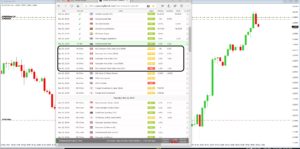
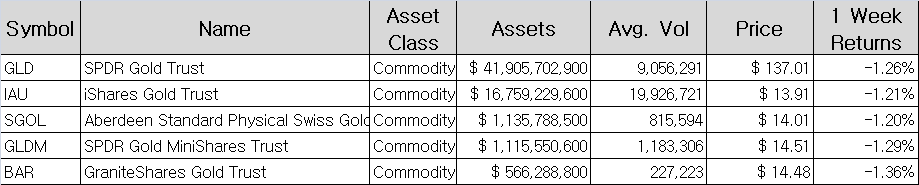 Table 1 – ETFs Based on Gold
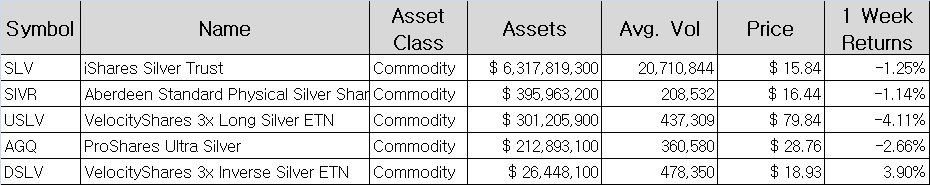 Table 2 – ETFs Based on Silver