
In our previous article, we introduced the concept of “fast market.” Also, we commented about the importance of watching the big-picture to support the market’s general overview. In this educational article, we’ll review the analysis of the fast movement.

Disclosing the Speed
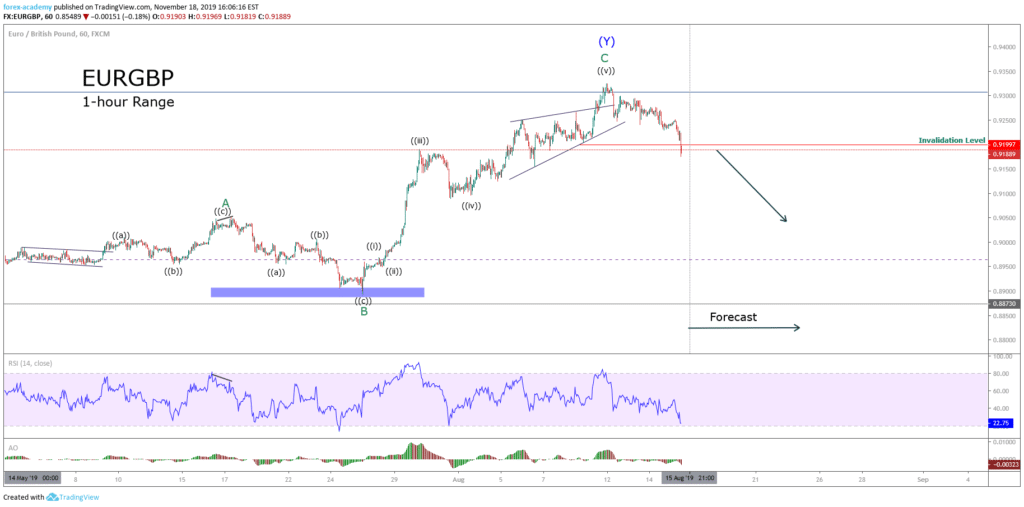
Once the market moved following our forecast, the price action developed its next sequence in a fast way. To aid in building our analysis in the EURGBP cross, we’ll use the RSI indicator to identify each swing.
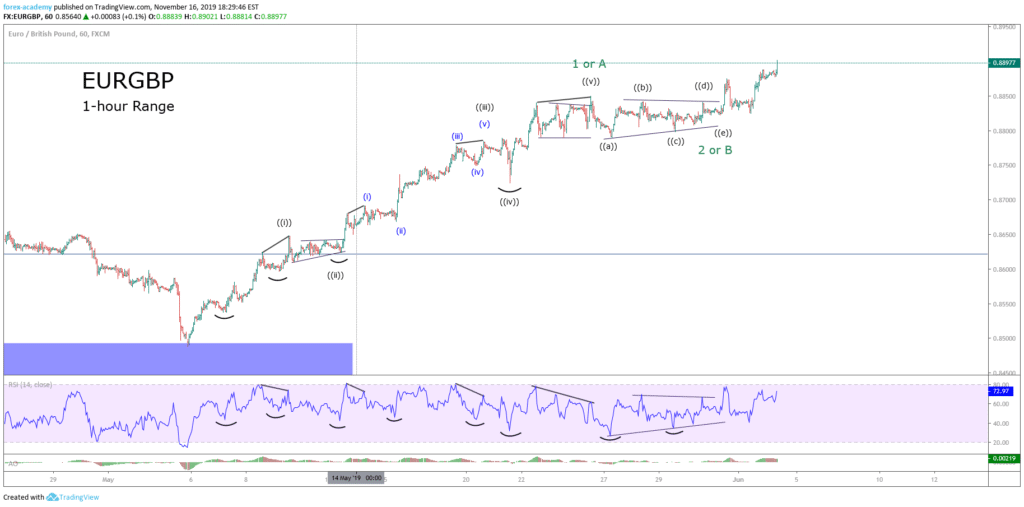
From the EURGBP hourly chart, we observe the bullish sequence started on May 05. The RSI use, allows us to identify each swing of waves 2 and 4, and divergences the end of waves 3 and 5.
Until now, the movement developed by EURGBP corresponds to a 5-3 sequence; thus, the next path should develop in five waves. In consequence, our new hypothesis could be the next move a wave three or be the second leg of a zigzag pattern.
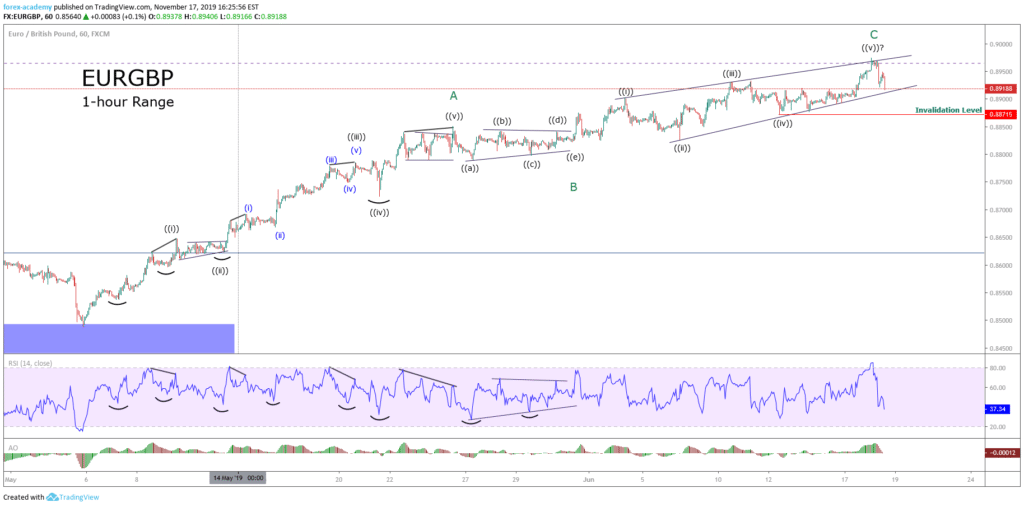
The second EURGBP chart exposes the progress in an ending diagonal pattern. This Elliott wave formation is a motive wave built by five internal legs that overlap each other.
On the other hand, the new big-picture structure observed on the EURGBP cross unveils a 5-3-5 sequence. Thus, according to the Elliott wave principle, this formation corresponds to a zigzag pattern.
Another observation comes from the alternation between the first and second bullish leg. Both segments moved on a different relationship price and time. In other words, while the first leg ascends in a fast step, the second one progress at a slower price/time relation.
Now, from the Elliott wave principle, the next path from the EURGBP should be a corrective move in three waves. If the price breaks below the invalidation level, the correction should be more profound.
On the following chart, we observe an incomplete corrective move developed in two internal waves labeled in black. In consequence, the next movement should be a wave ((c)) in black. The completion should complete a new wave A labeled in green.
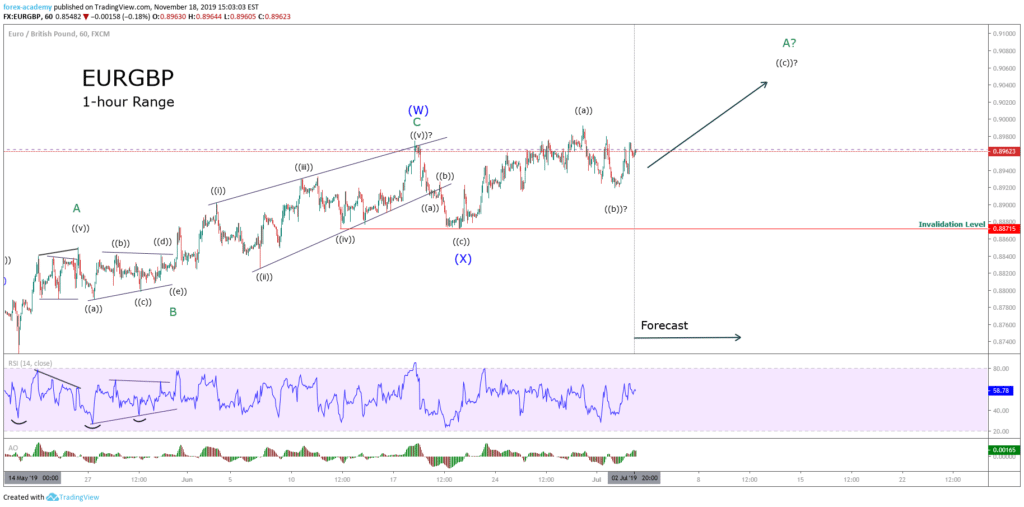
Until this moment, the price action bounced above the invalidation level, which makes us observe two things:
- The EURGBP cross is running in a complex corrective structure, likely a double three pattern. This Elliott wave structure is labeled as WXY, follows a 3-3-3 sequence, and develops seven swings.
- Probably according to the alternation principle, the next corrective structure could be a flat pattern.
The following chart exposes the waves A and B labeled in green completion. As can be noted, wave A holds three internal legs, wave B retraces between 81% and 100% of A. Thus, the Elliott wave structure should correspond to a regular flat pattern.
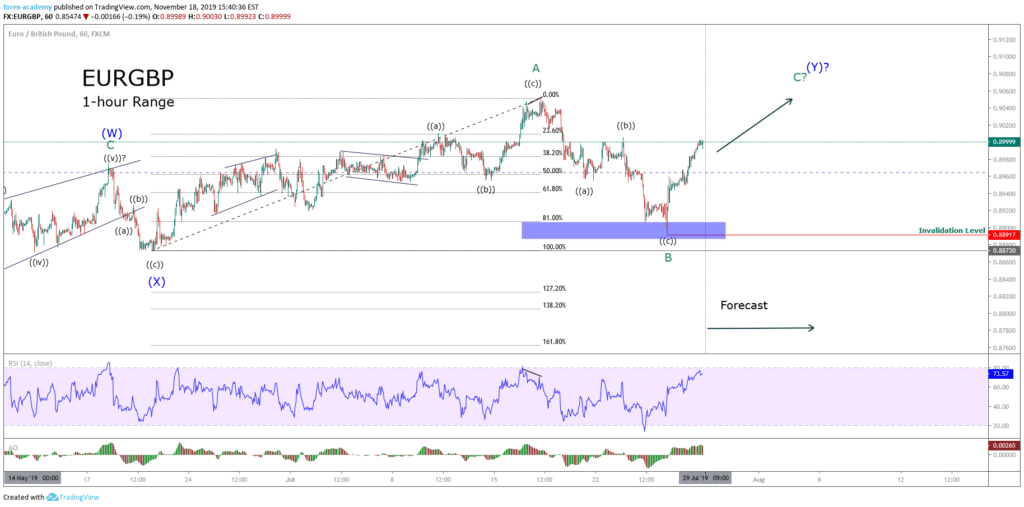
Finally, the next EURGBP chart illustrates the end of the last segment of the wave C from the regular flat pattern, which is part of a complex corrective sequence, in this case, the formation corresponds to a double three structure.
As a learned lesson, the use of the RSI indicator is useful to support the wave identification process. Similarly, to apply the Elliott Wave Principle is essential to know the basic corrective patterns to follow any market. Finally, remember that the market has only two ways to move: it moves in three or five waves.