Introduction
Productivity is an important fundamental indicator that talks about the levels of the industrial output of a country. It is one of the leading indicators in the Forex market, which has a long-term impact on the currency’s value. The industrial output is linked to the theory of demand and supply, which means the availability of raw material and policies set by the monetary policy committee directly affects the overall output. Let us understand this concept in depth by looking at the definition of Productivity first.
What is Productivity?
Productivity is defined as the ratio of total output volume to the total input volume. The ratio is mentioned in the form of an average, which expresses the total output of a category of goods divided by the total input, say raw materials or labor. In simple words, Productivity measures how efficiently the inputs such as labor and capital are being used in a country to produce a given level of output.
Productivity determines economic growth and competitiveness and hence is the basic source of information for many international organizations for measuring and assessing a country’s performance. Analysts use ‘Productivity’ data to also determine capacity utilization, which in turn allows one to assess the position of the economy in the business cycle and to forecast economic growth.
Measuring Productivity
Before we see how Productivity is analyzed, we need to consider various methods of measuring the output and input components of Productivity and the limitation of using each of these estimates.
Output
When we are talking about output, the number of units produced of each category of commodity or service should be counted in successive time periods and aggregated for the company, industry, and the whole economy. This output should be measured in comparison to some other indicator of equal importance, usually cost or price per unit in a period. The changes in the price of the goods produced are observed for two or more periods that are said to influence the aggregate output volumes. Price deflation is usually employed to get the estimation of the real gross product by sector and industry. The obtained estimates will be used as numerators in the productivity ratios.
The limitation of using the above methods is that quantities and prices for many outputs of finance and service industries are deficient.
Input
Labor input is easy to measure, as it only involves counting the heads of persons engaged in production. But in fact, the number of hours worked is preferable to just the number of people. This dimension, too, is related to the compensation received per hour of work, also known as wage. The official estimates, however, do not differentiate among various categories of labor where they measure labor inputs by occupation, industry, and other categories.
The drawback of using this method for estimating the labor input is that it is difficult to find the relation between the number of hours worked and hours paid for during paid holidays and leaves.
Determinants of Productivity
Technology determines the maximum level of output that can be reached and the quality of output that is required. In this age of technological advancement, innovations and automates systems play a major role in carrying out the production activity. Technological changes are happening very fast in some industries while it is gradual in others.
The Skills of the workers matter a lot when determining Productivity on an individual level. For example, if an unskilled worker tries to carry out a task, he might make more mistakes and will not be able to optimize the time to work, whereas a skilled worker will need less time to do the same job.
Some other methods of attaining high Productivity are through adequate levels of earnings, high job security, quality education and training, good and safe working conditions, and an appropriate work-life balance.
The Economic Reports
The economic reports of Productivity are published every month for most of the countries. There is also the collective data that combines the monthly statistics of a country which is published on a yearly basis. The productivity data is maintained and provided by two big OECD (Organisation for Economic Cooperation and Development) databases, which are ISDB (International Sectoral DataBase) and STAN (Structural Analysis DataBase). At these sources, we can find the data from 1970 for countries like the United States, Japan, and other European countries.
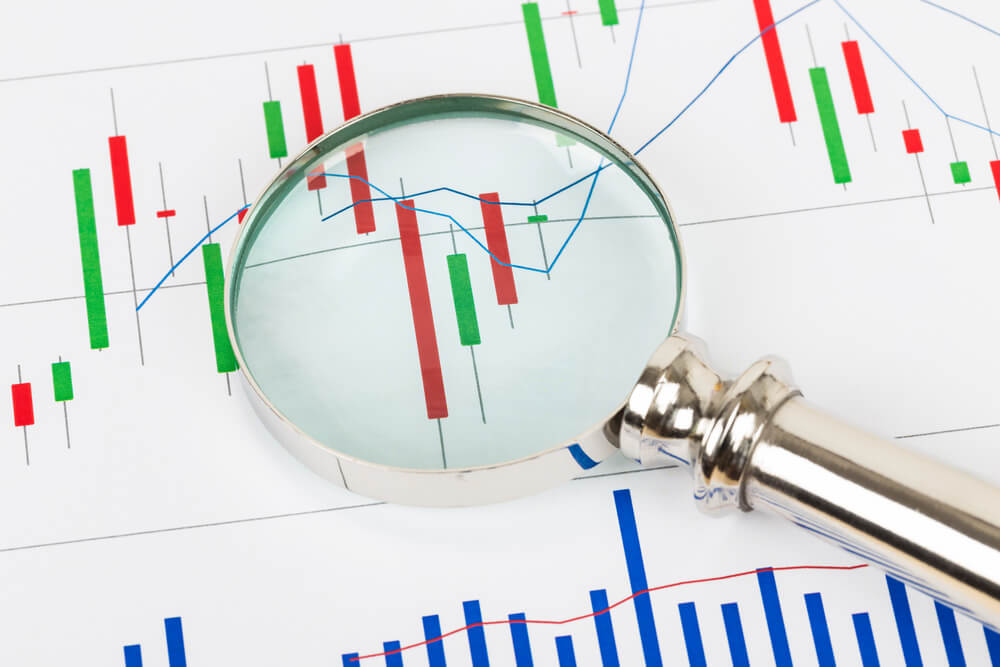
Analyzing The Data
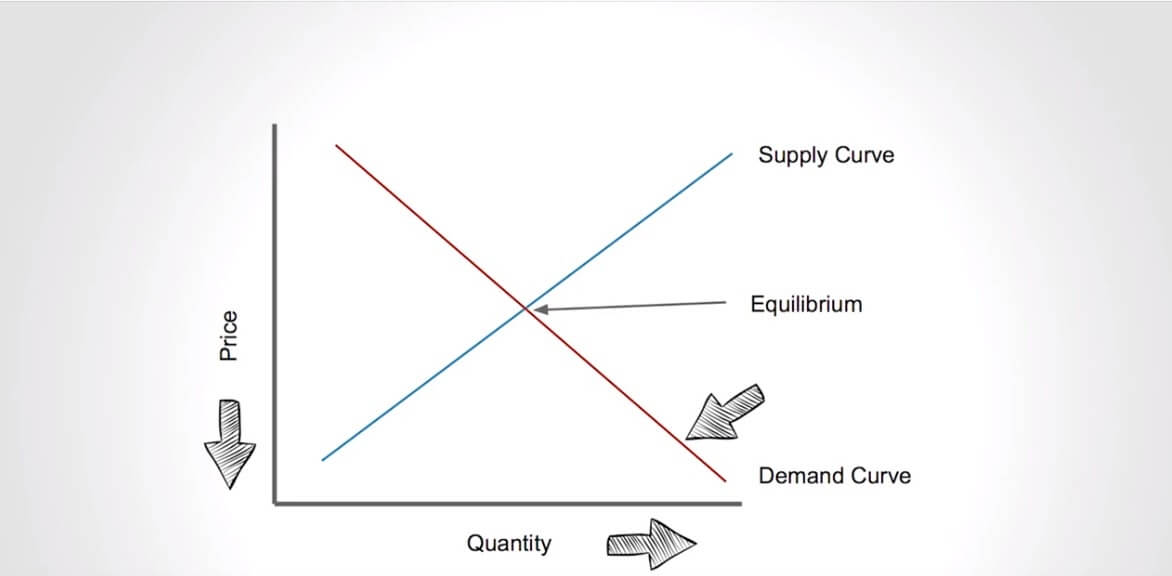
From a trading perspective, Productivity plays a vital role in the fundamental analysis of a currency pair. The productivity data shows the production capacity of a country. Using this data, various agencies decide which goods need to be imported and exported from the country. By comparing the data of two countries, one can determine which economy is stronger and has the potential to grow.
One thing to keep in mind when analyzing the data is to compare similar economies as different countries will have a different level of development. When looking at developed countries, it is fair to expect the productivity ratios to be in triple digits, and for developing economies, it could be in two digits.
Impact on the currency
The impact due to Productivity on the currency is split into two different categories, i.e., the ‘traded’ and the ‘non-traded’ sector of the economy. The ‘traded’ sector is made up of industries that manufacture goods for import to foreign countries and hence have a presence in the foreign exchange market. The ‘non-traded’ sector is comprised of industries that produce goods for the domestic market only.
So, as the prices of goods of the ‘traded’ increase, the currency of that country is set to appreciate and thereby increasing the inflow of funds into the country. In the case of ‘non-traded’ sector goods, an increase in the price of such goods is not good for the economy as this would make the products costlier and people will have to spend more to purchase them. This would negatively impact the currency, and institutions will not be willing to invest in such countries.
Sources of information on Productivity
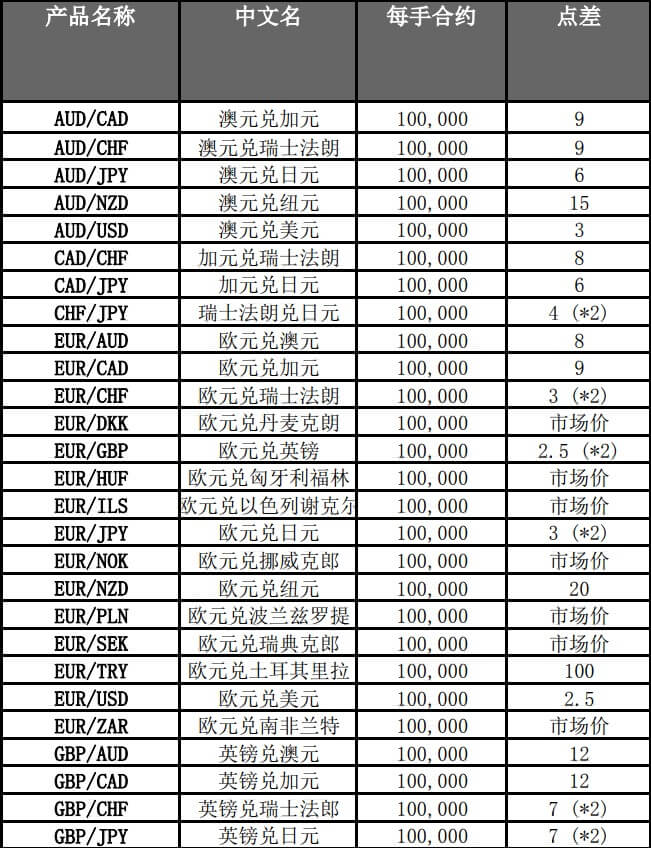
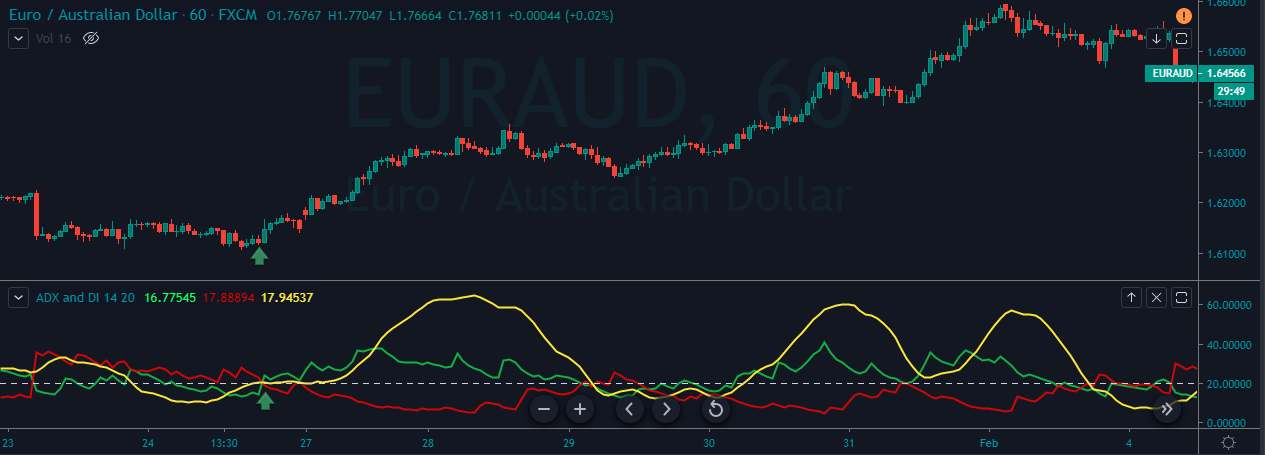
Productivity data is available on the most prominent economic websites that provide a detailed analysis with a comparison chart of previous data. Using this information, a trader can analyze and predict the future data of the economy. Here is a list of major countries of the world with their productivity stats.
GBP | AUD | USD | EUR | CHF | CAD | NZD | JPY
Higher Productivity has an impact on the profit of a company and the wages of the employees. High profits due to high Productivity generate cash flow, increase loan provision from banks, and, most importantly, attract investment from foreign investors. Due to this, companies can afford to pay more wages to their employees without losing market share.
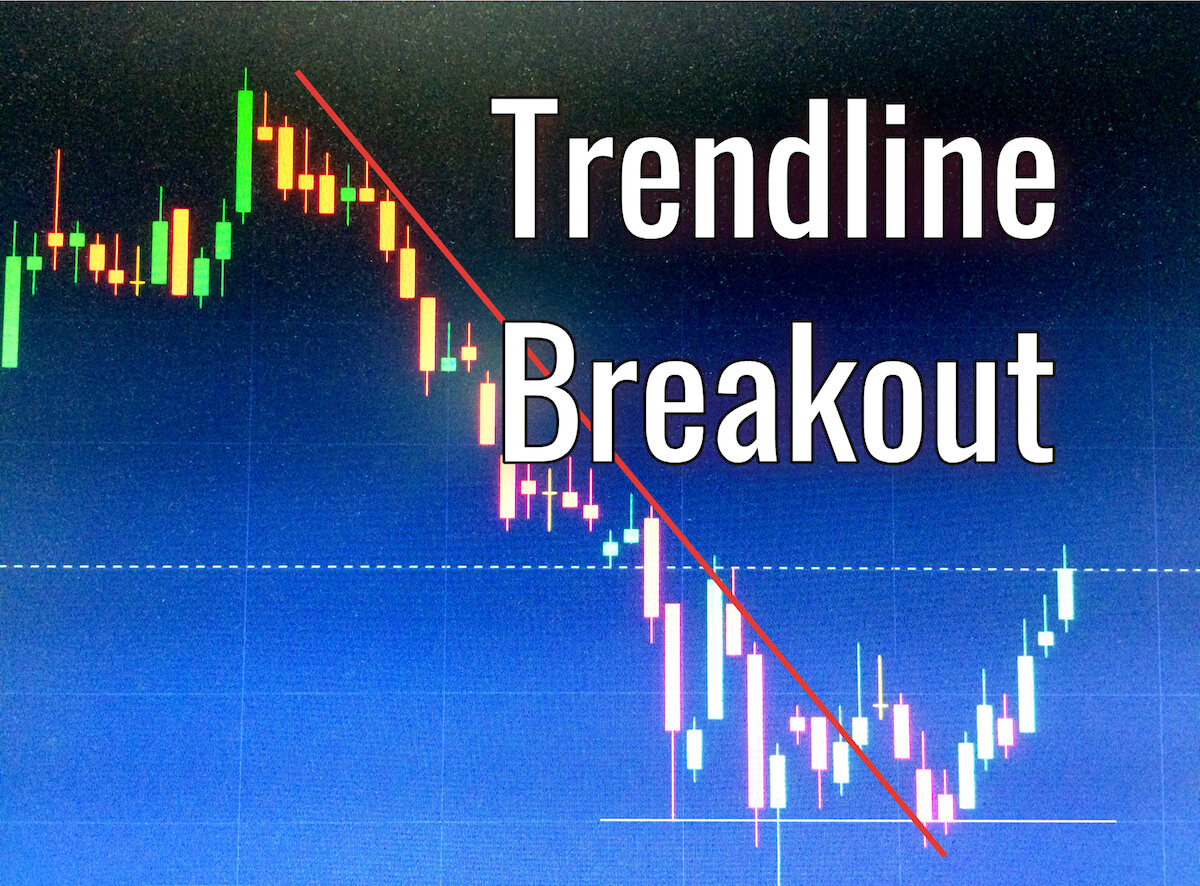
Impact Of Productivity News Release On The Price Charts
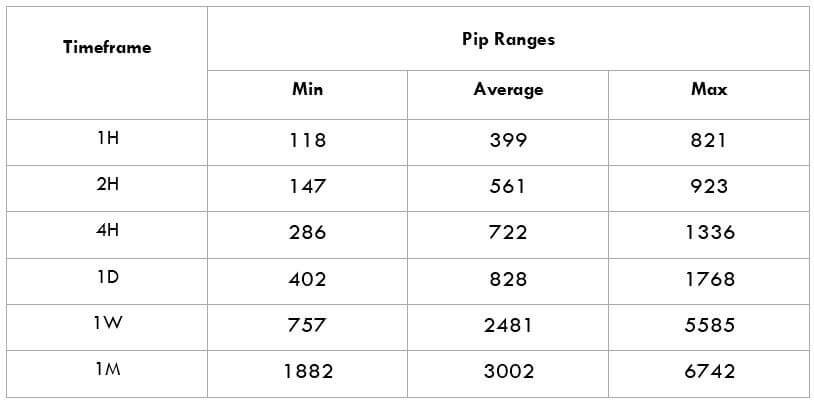
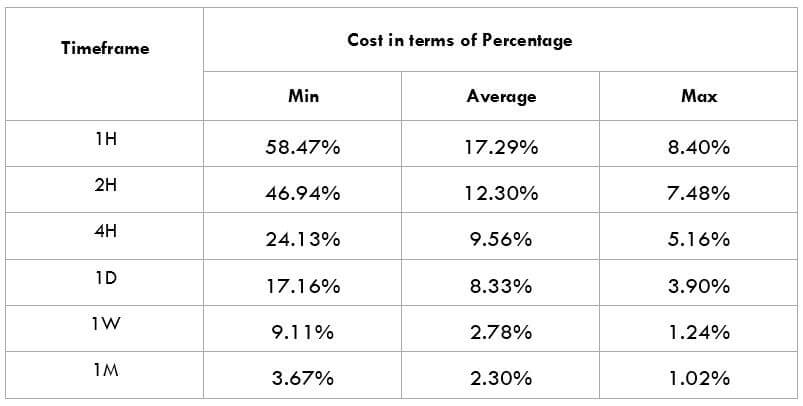
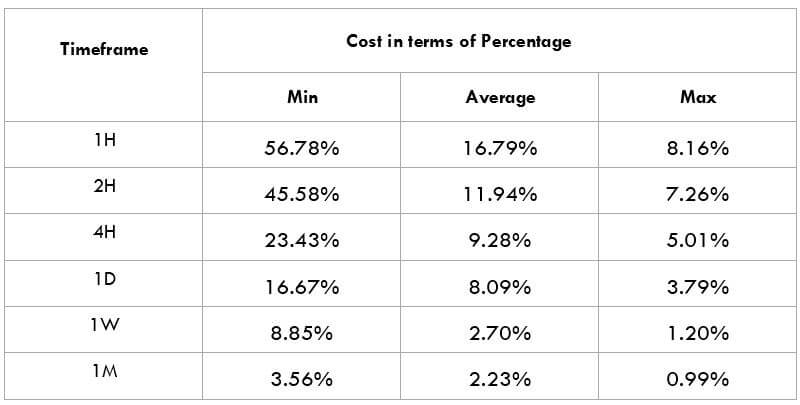
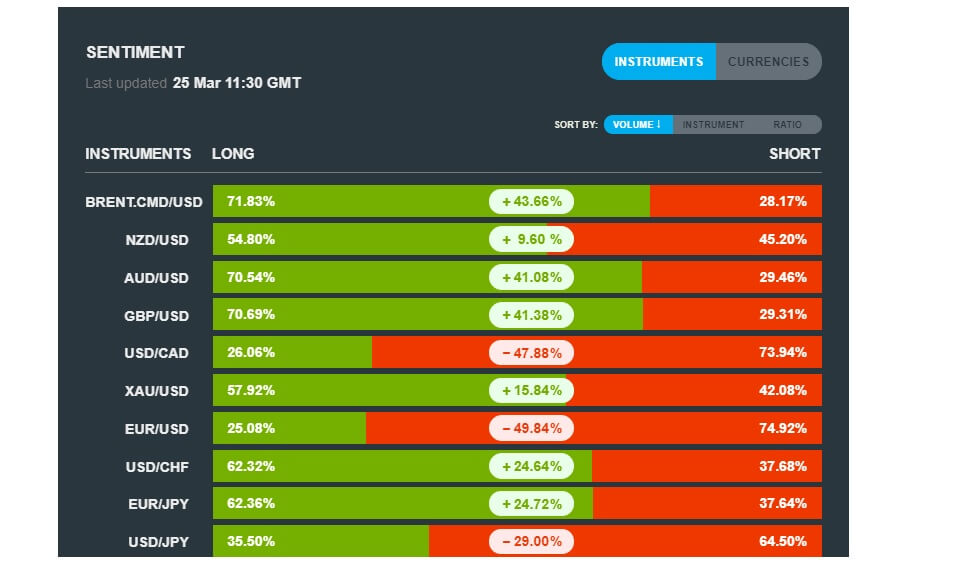
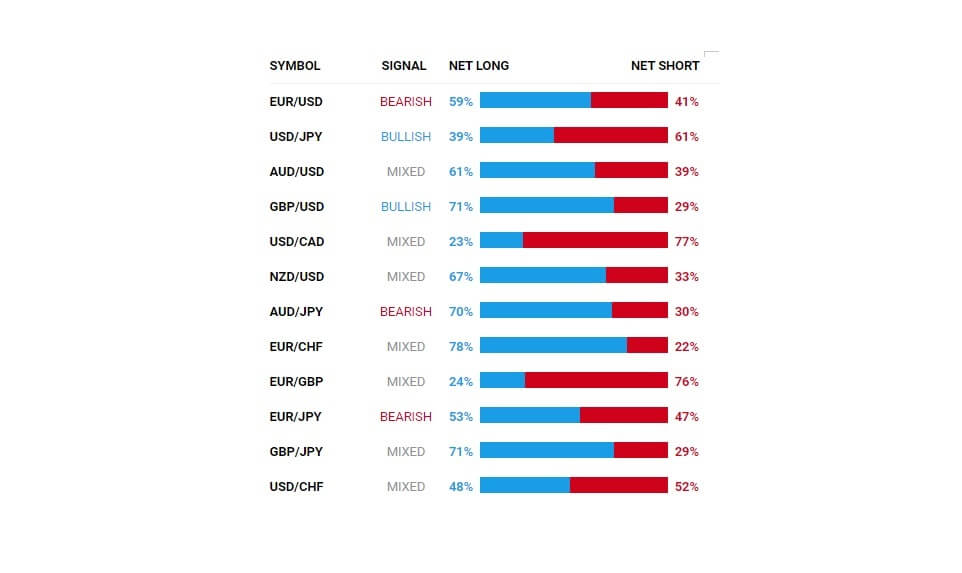
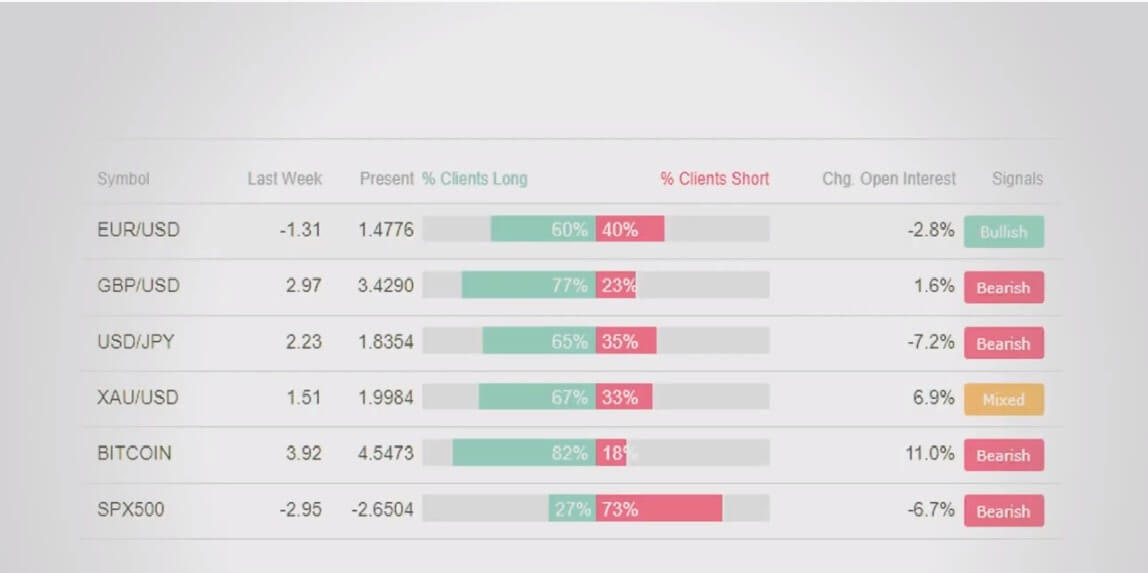
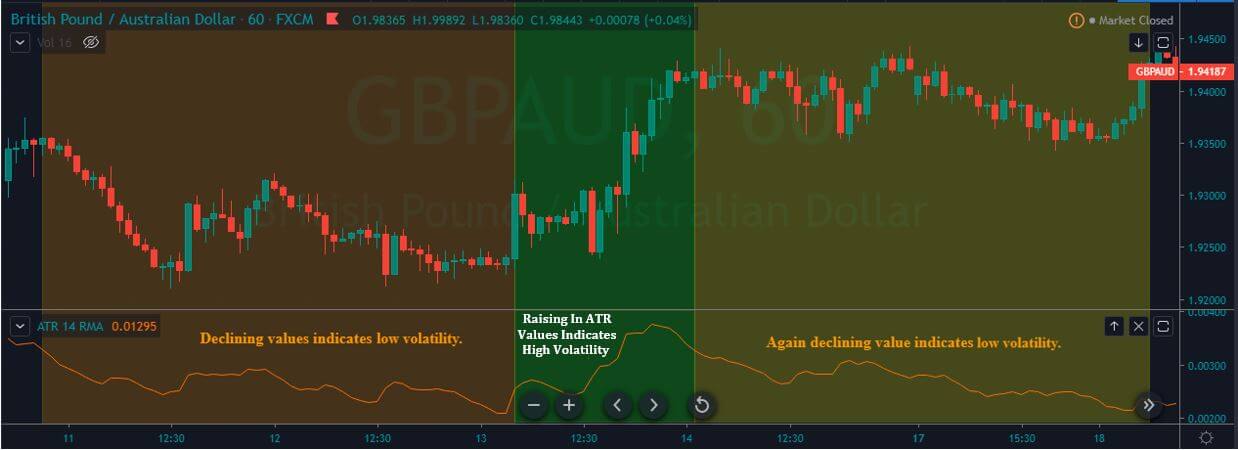
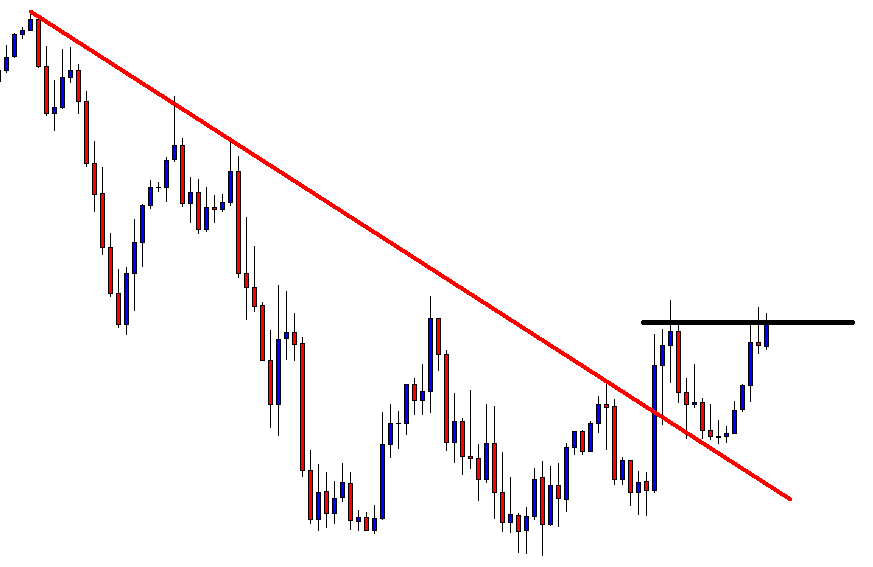
Productivity is one of the most important economic indicators that measure the annualized change in the labor efficiency of the manufacturing sector. As Productivity plays a major role in an economy, it is necessary to analyze the impact of the same on the currency. The below image shows that Productivity is not a crucial factor for forex traders, which means the Productivity data might not have a long-lasting effect on the currency. However, one should not forget the data that affects the manufacturing sector and hence indirectly impacts the GDP. Therefore, we should not underestimate the figures.
![]()
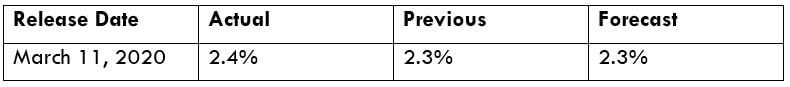
To explain the impact, we have considered the NonFarm Productivity of the US, which is released by the Bureau of Labor Statistics of the US Department of Labor. A ‘higher than expected’ reading should take the currency higher and is said to be positive for the economy, while a lower than expected reading is considered to be negative for the economy and should take the currency lower. The latest figures show that there has been a 1.4% rise in Productivity levels from the previous quarter. Let us find out the impact on the US dollar.

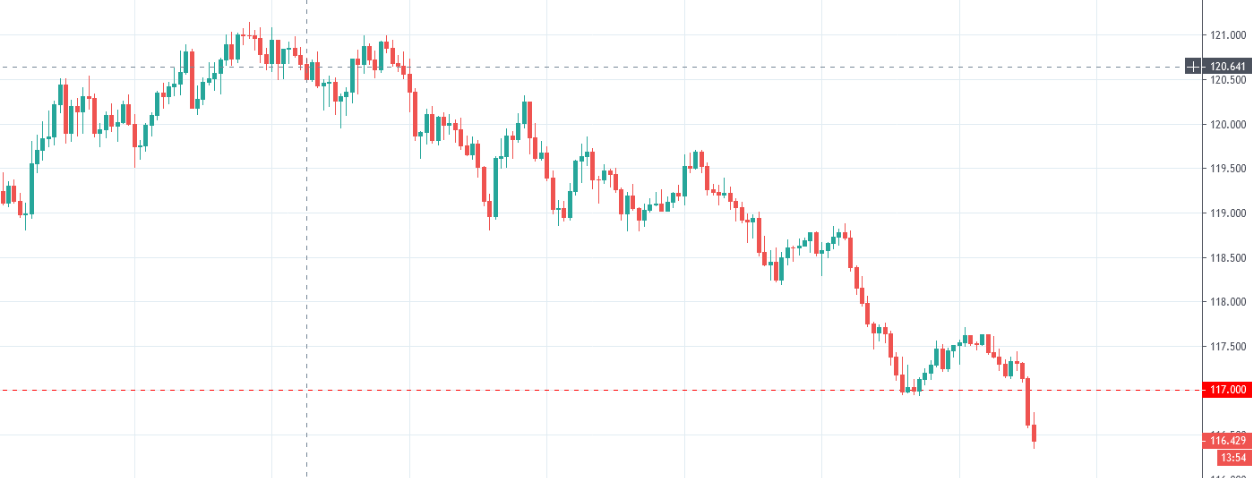
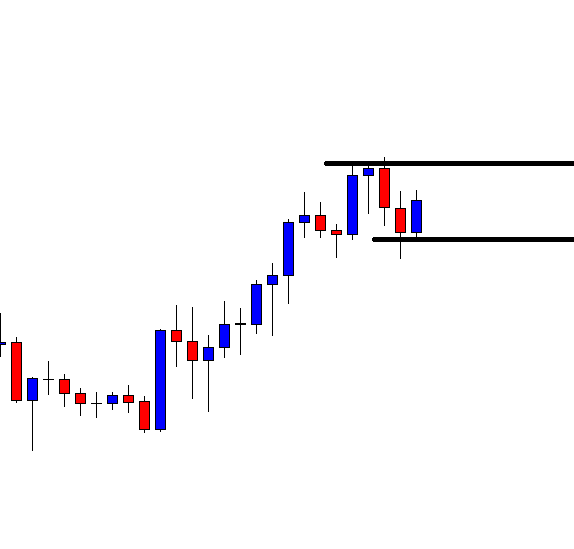
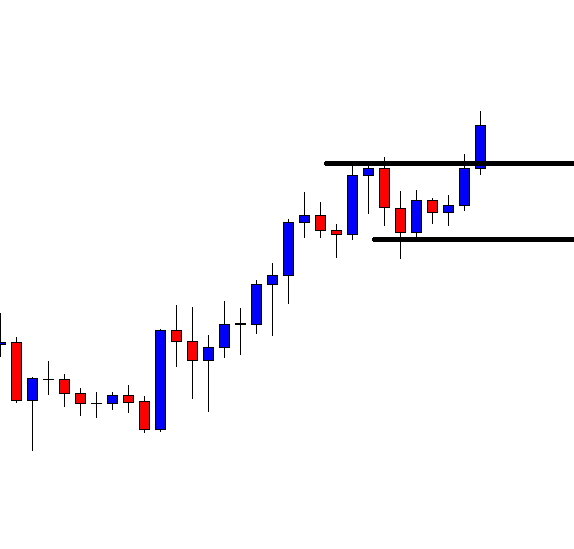
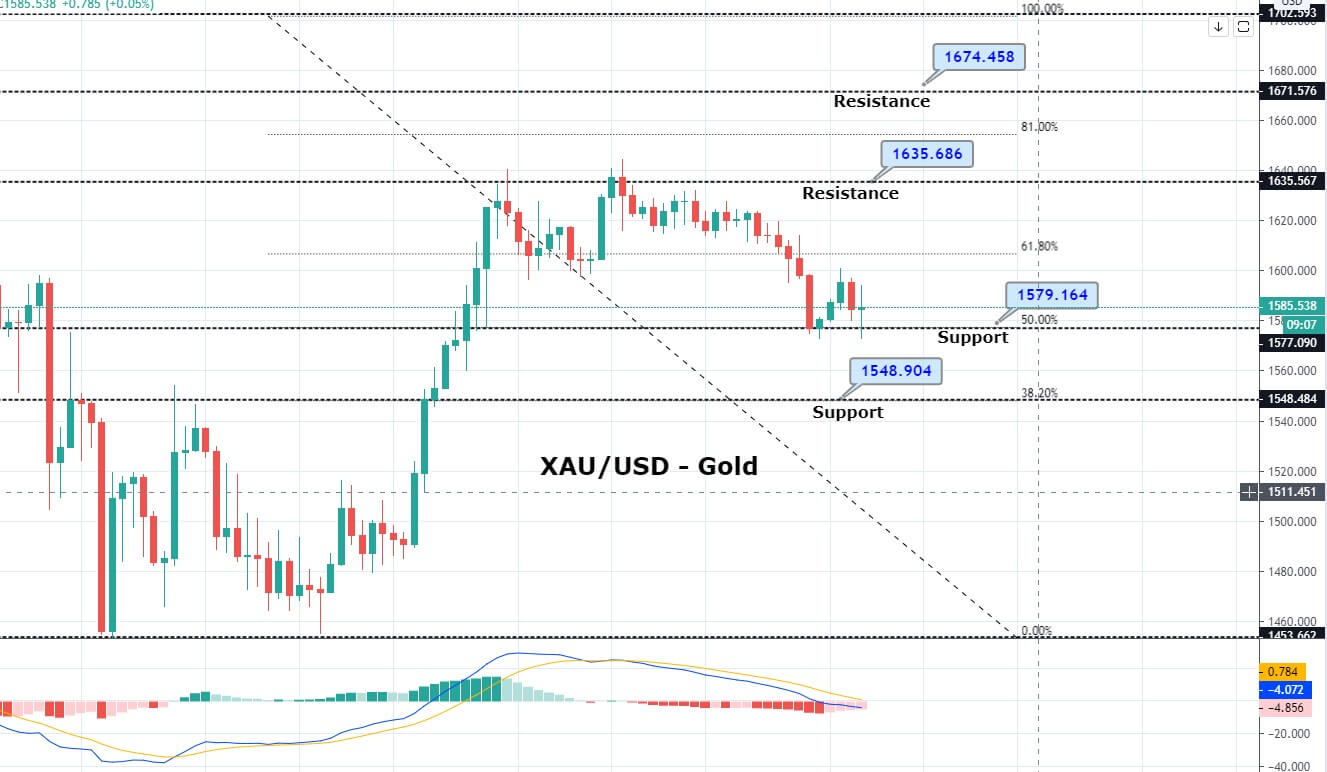
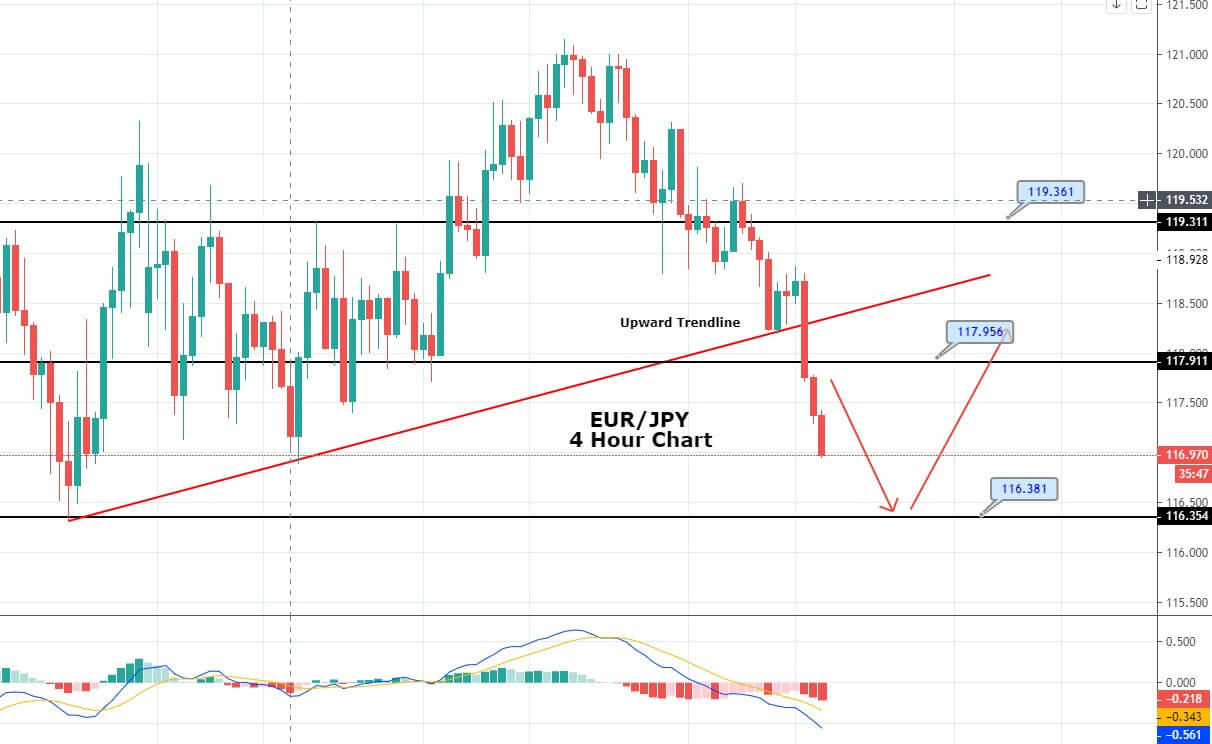
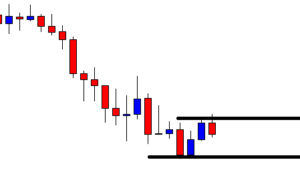
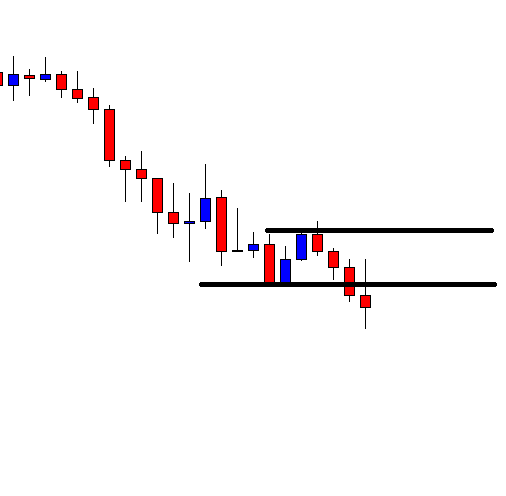
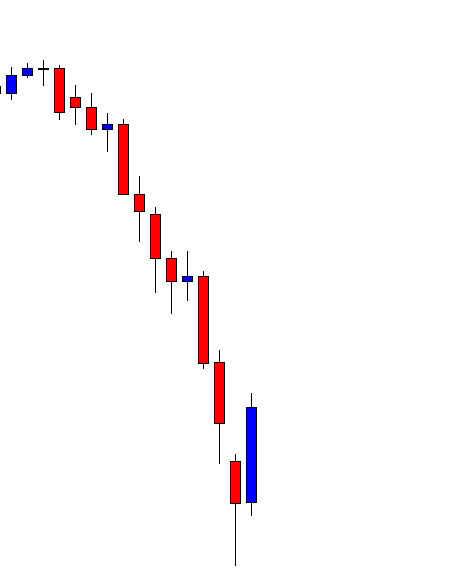
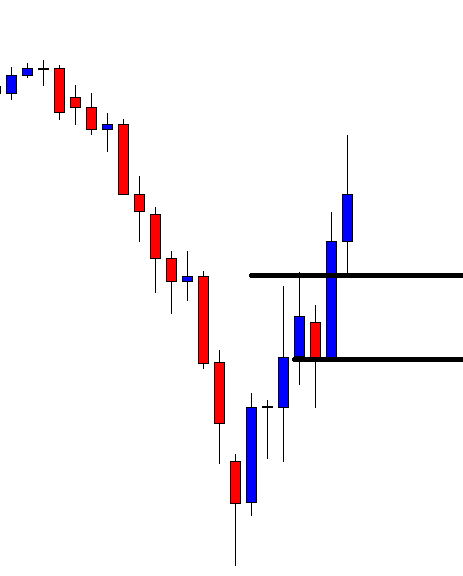
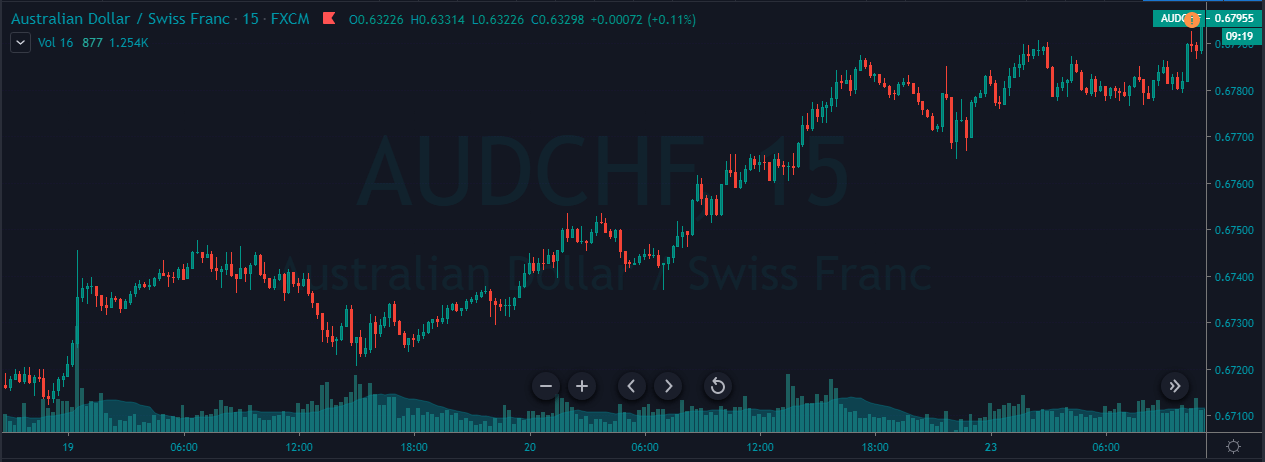
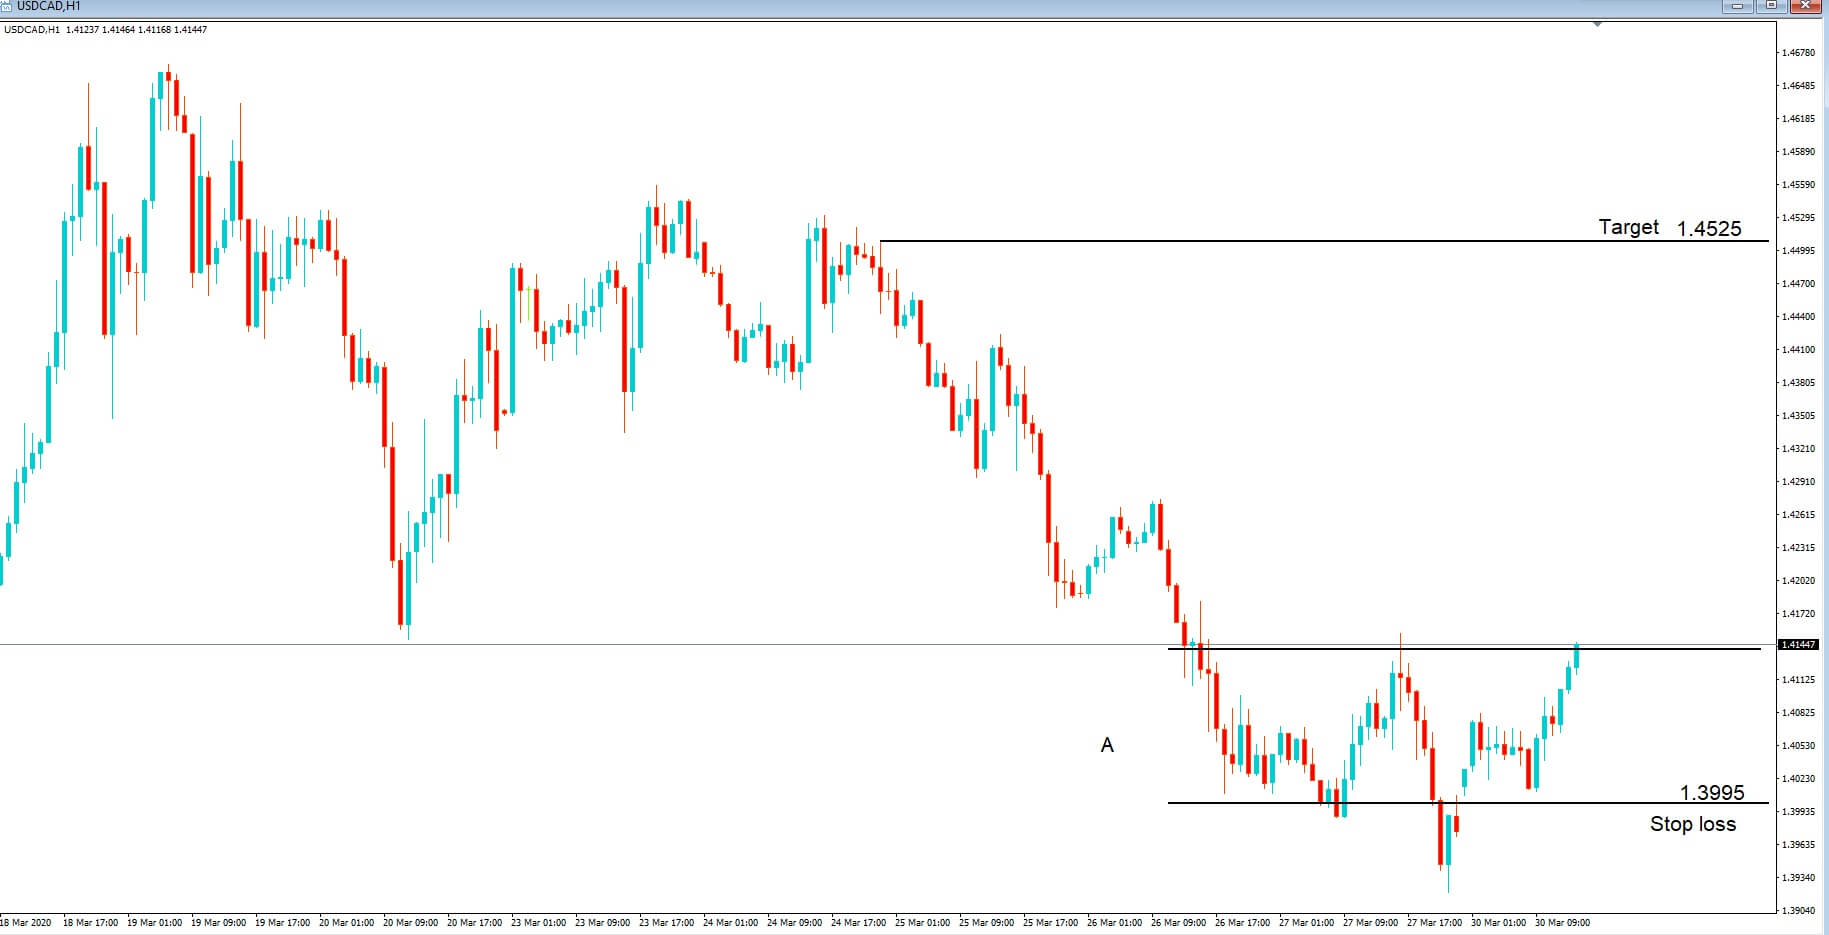
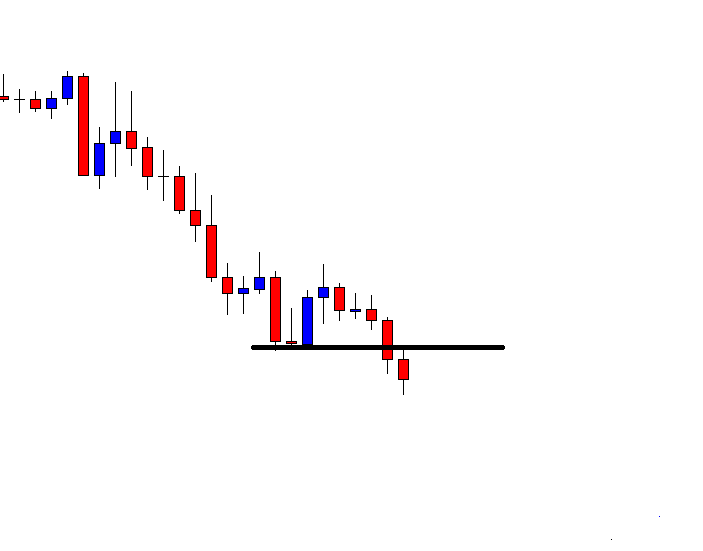
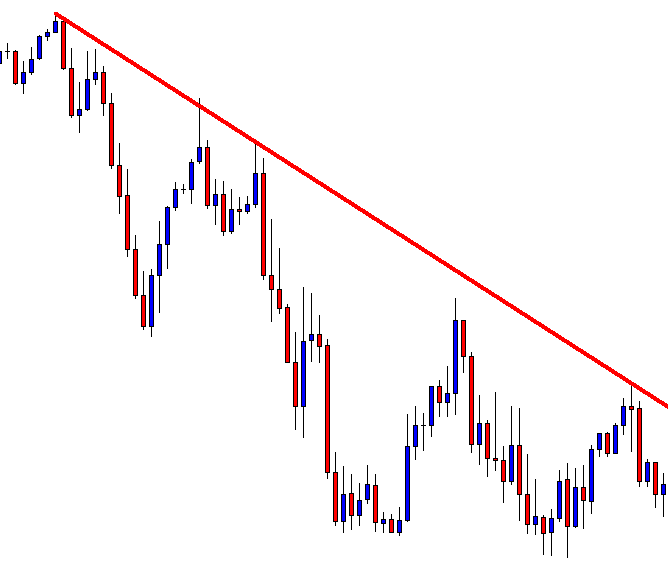
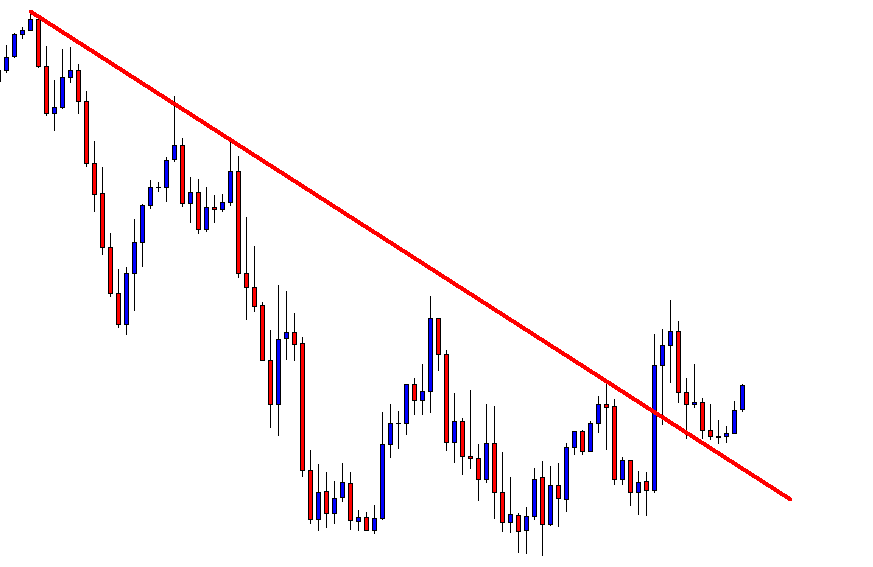
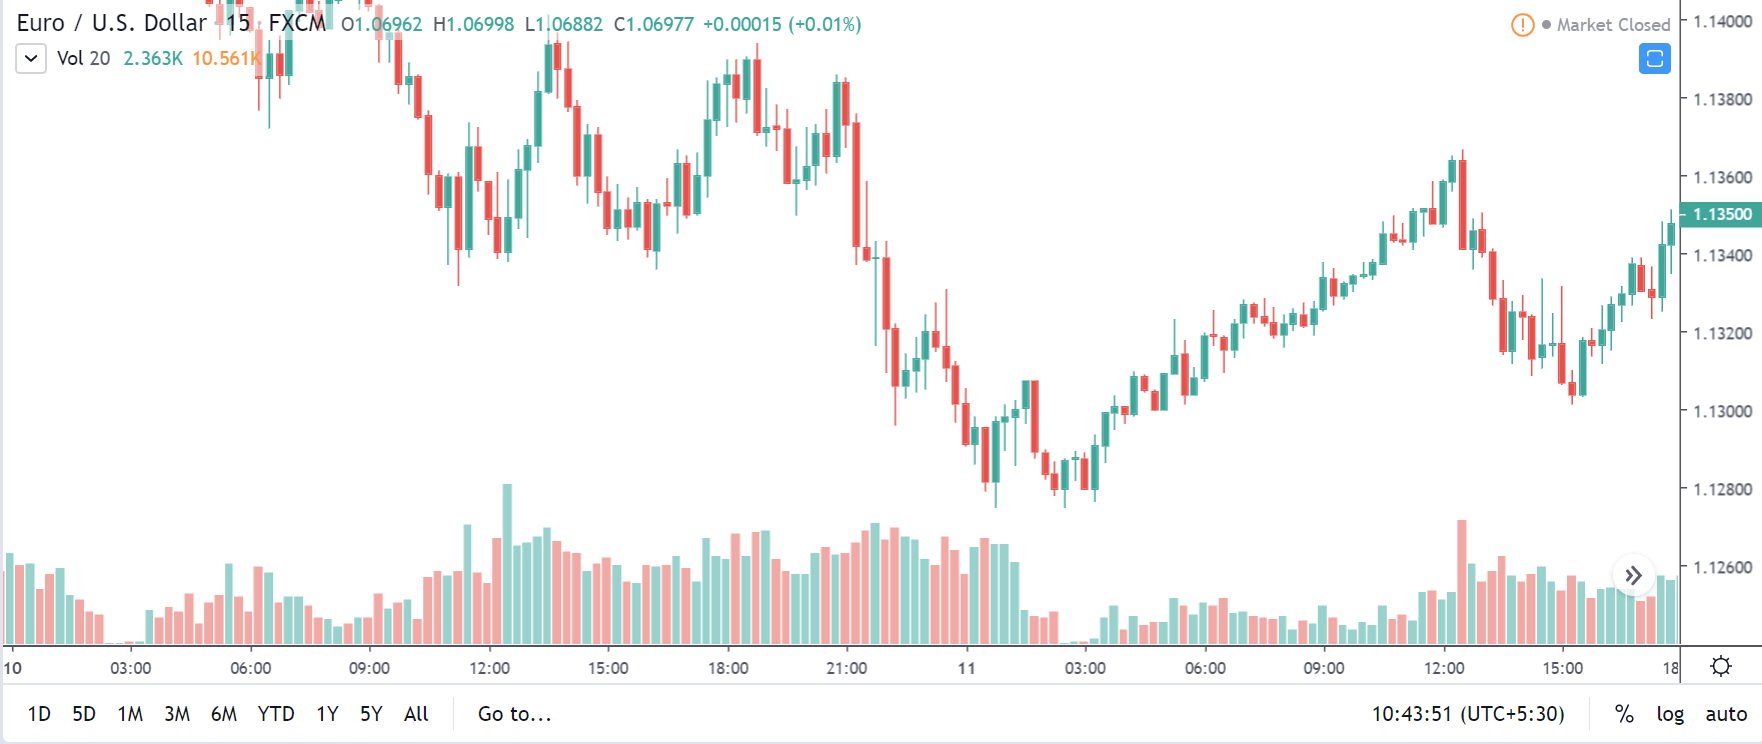
NZD/USD | Before the announcement | 5th March 2020
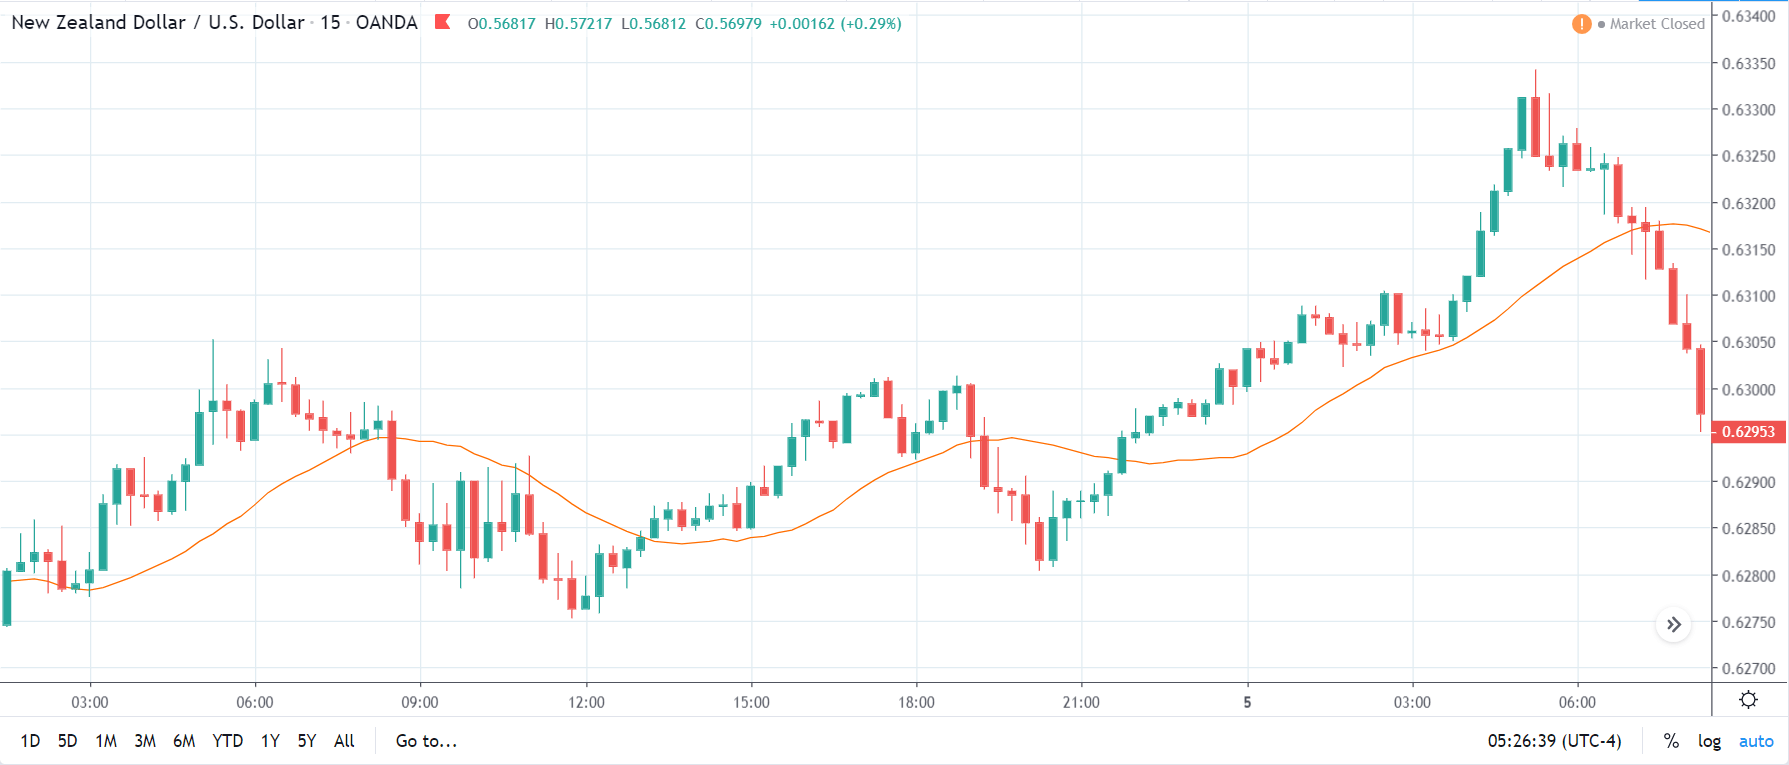
The above chart is of the NZD/USD currency pair before the Productivity numbers are announced. What we essentially see is a strong down move that has resulted in a reversal of the uptrend. The volatility is high even before the news release. The reason behind this move is much greater expectations of Productivity than before, which is making traders buy US dollars. Now, if the Productivity numbers were to be lower than before, we can expect a reversal of the downtrend, but it might not be sustainable as it is not a high impactful event.
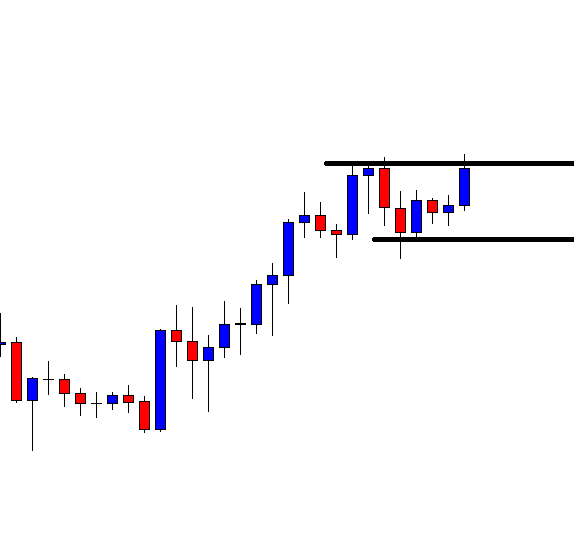
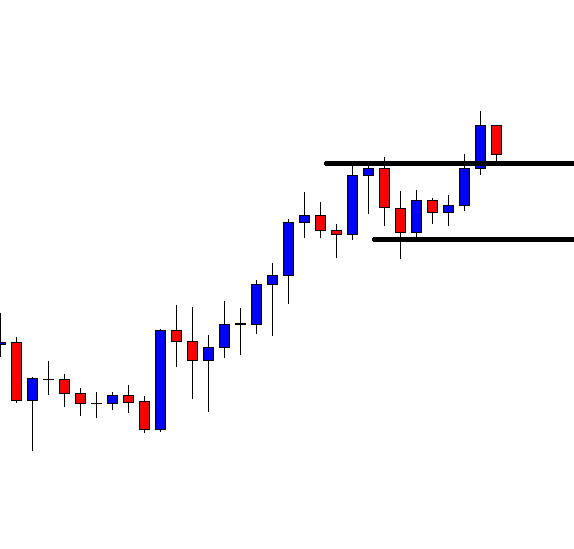
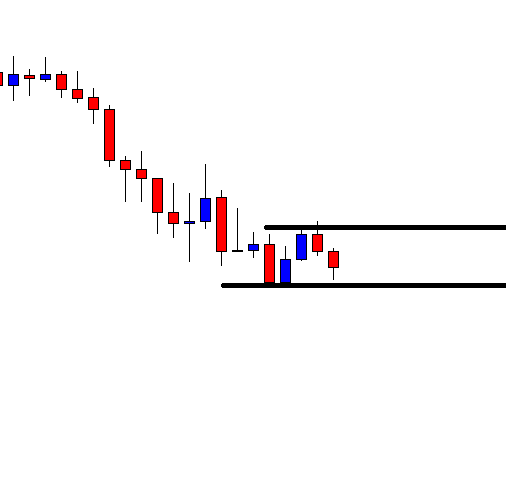
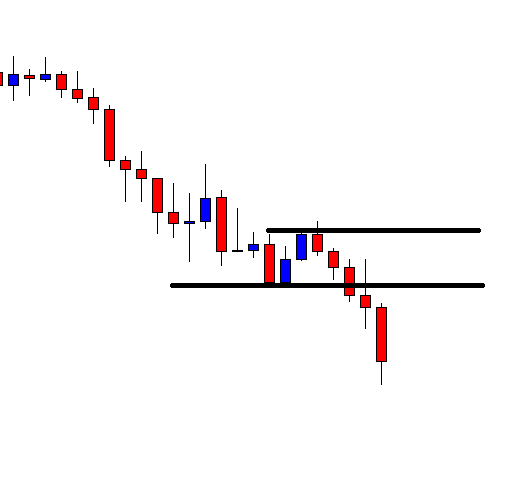
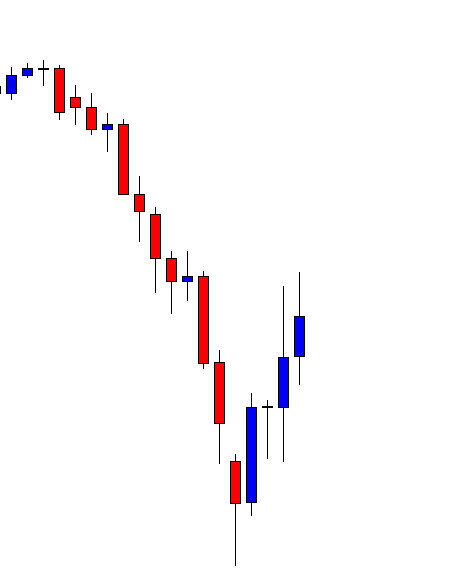
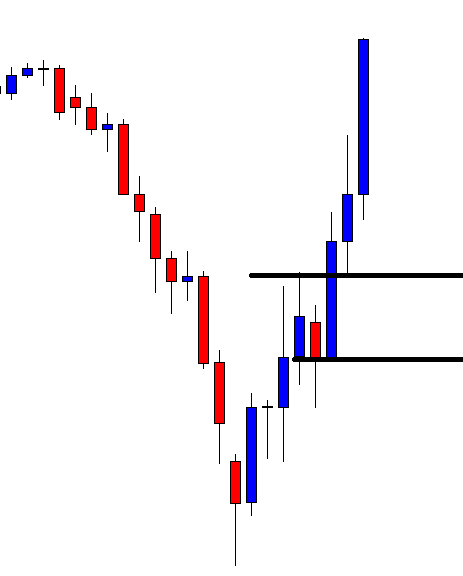
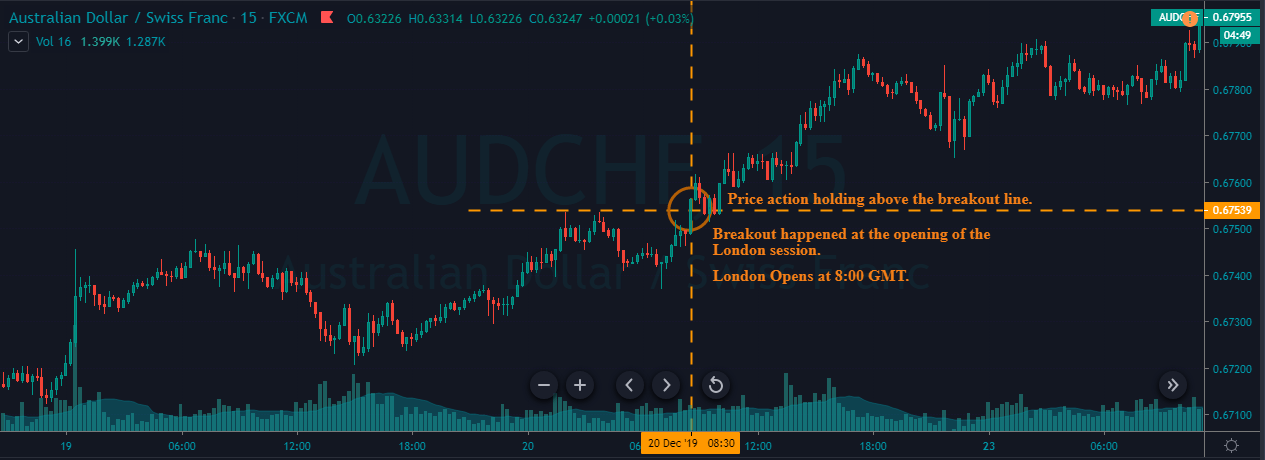
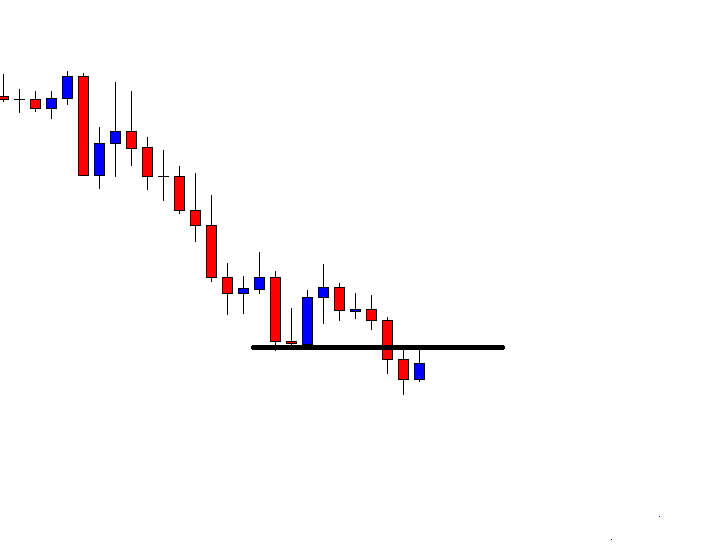
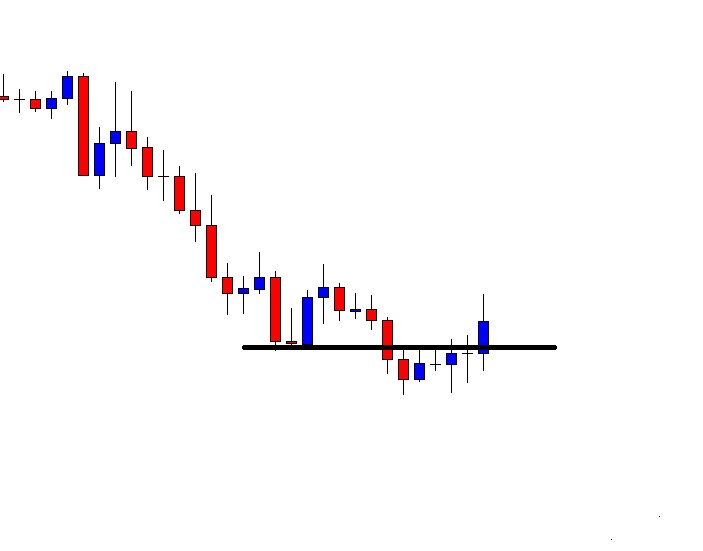
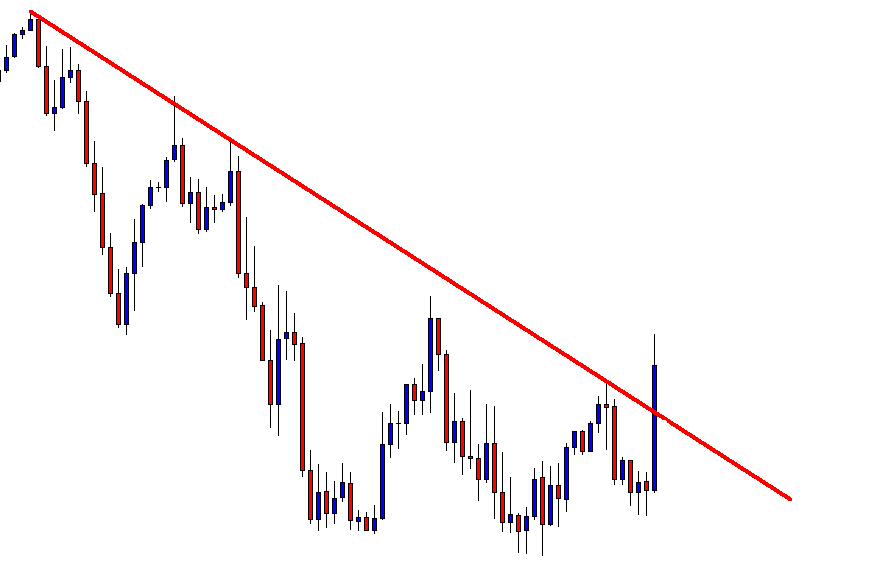
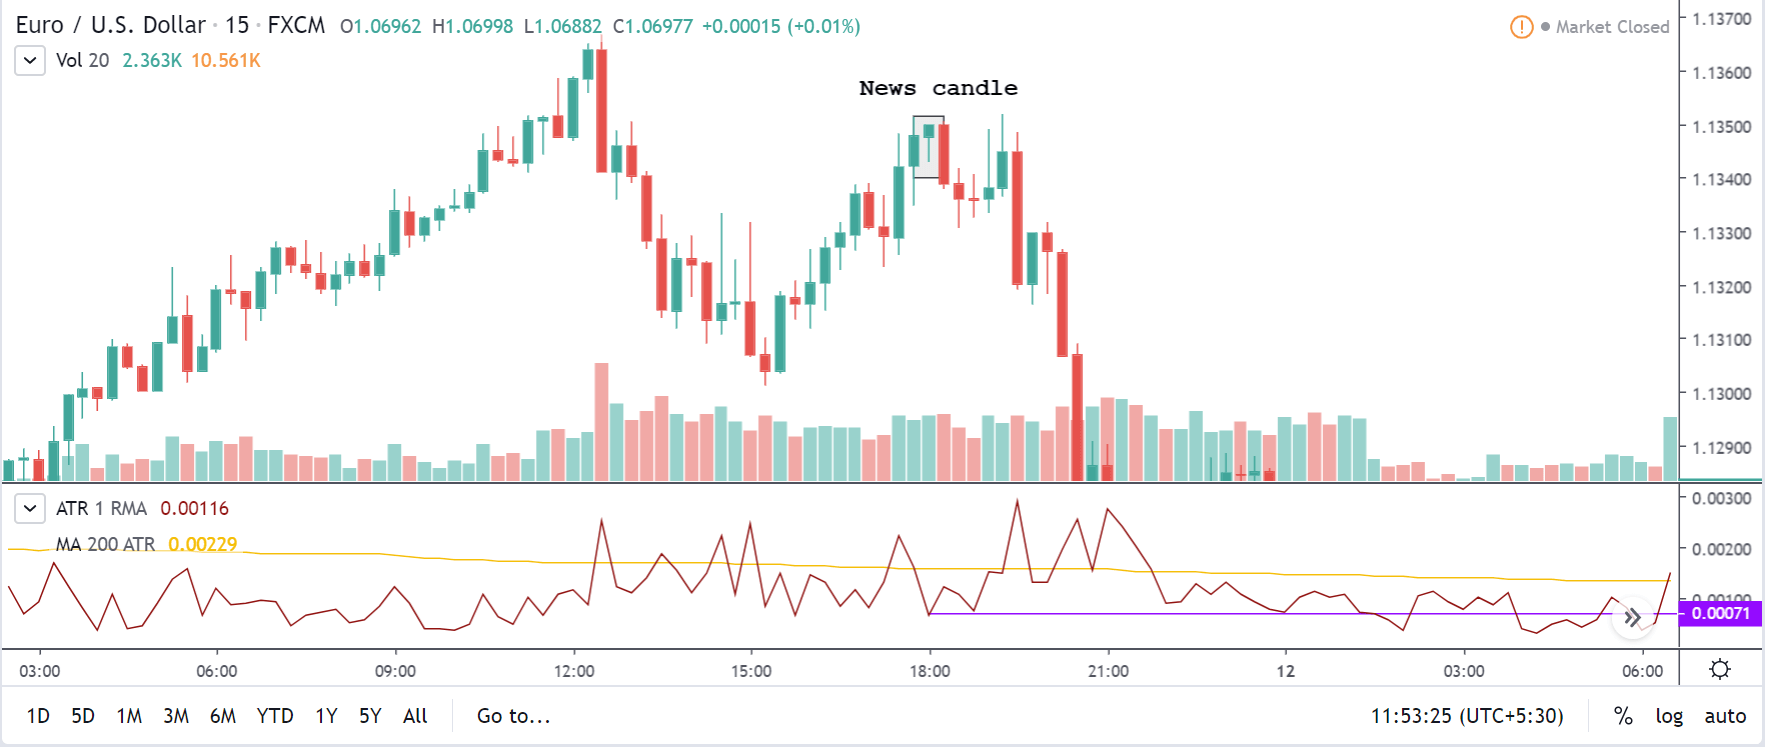
NZD/USD | After the announcement | 5th March 2020
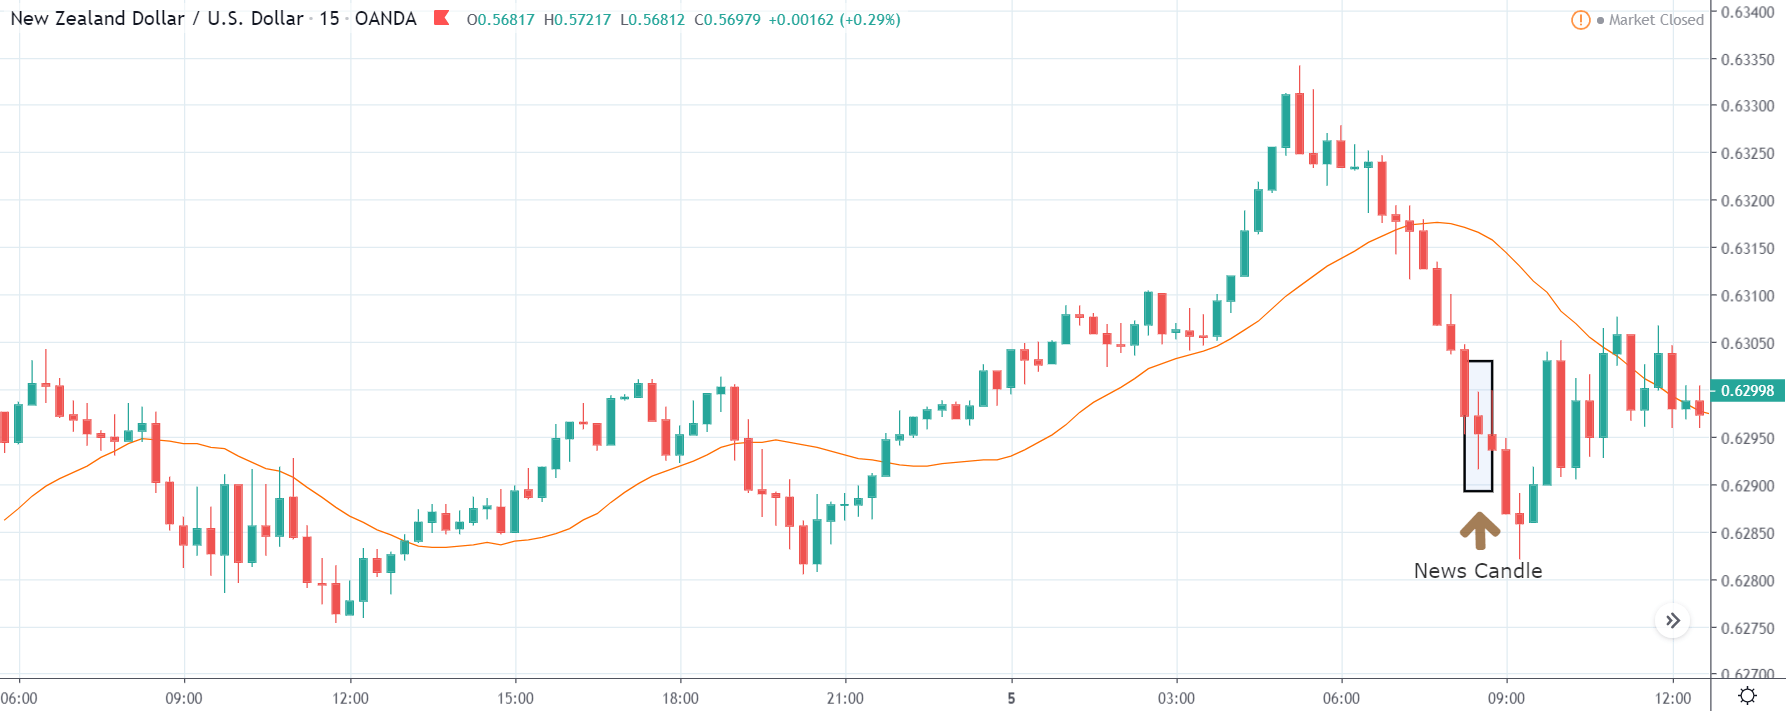
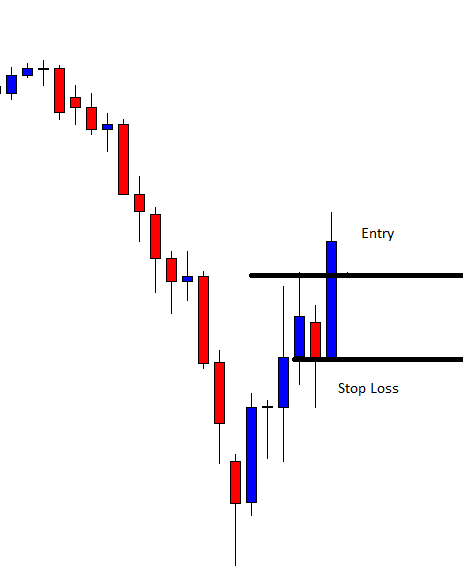
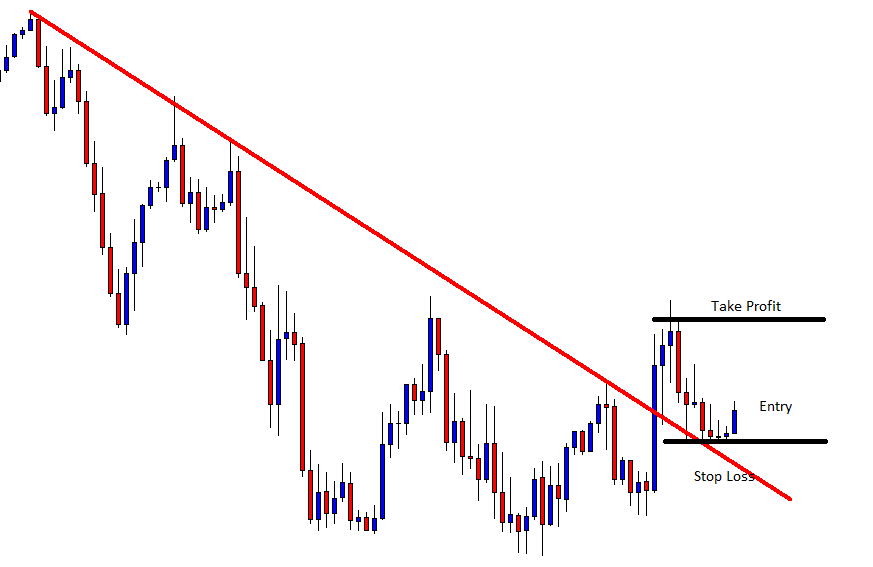
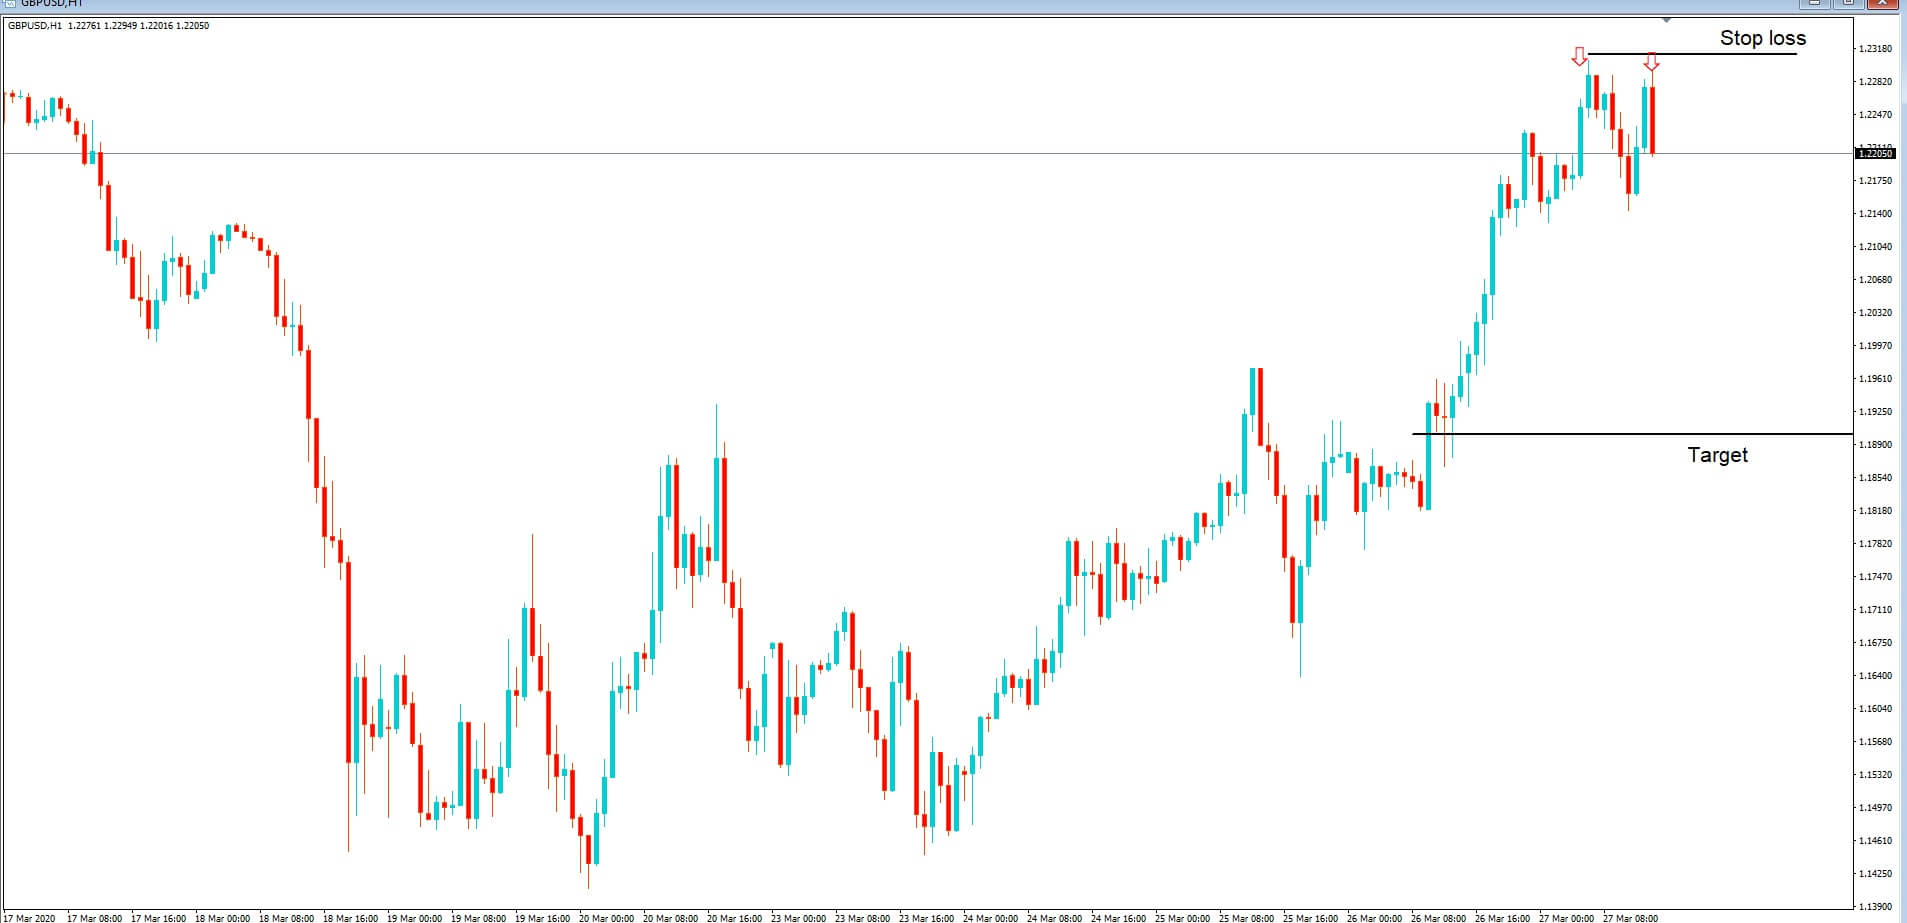
After the Productivity data is announced, volatility further increases on the downside, and the market moves much lower. What we need to observe is that even though the market goes lower, it fails to make a ‘lower low.’ This is because the productivity data is not of much importance to traders, and hence the impact will not last long. Therefore, the market respects the news for just a couple of candles and later takes support at the lowest point and goes higher. From a trading point of view, the only way to trade Productivity news release in this pair is by going ‘short’ after the news outcome and exit at the nearest opposing point.
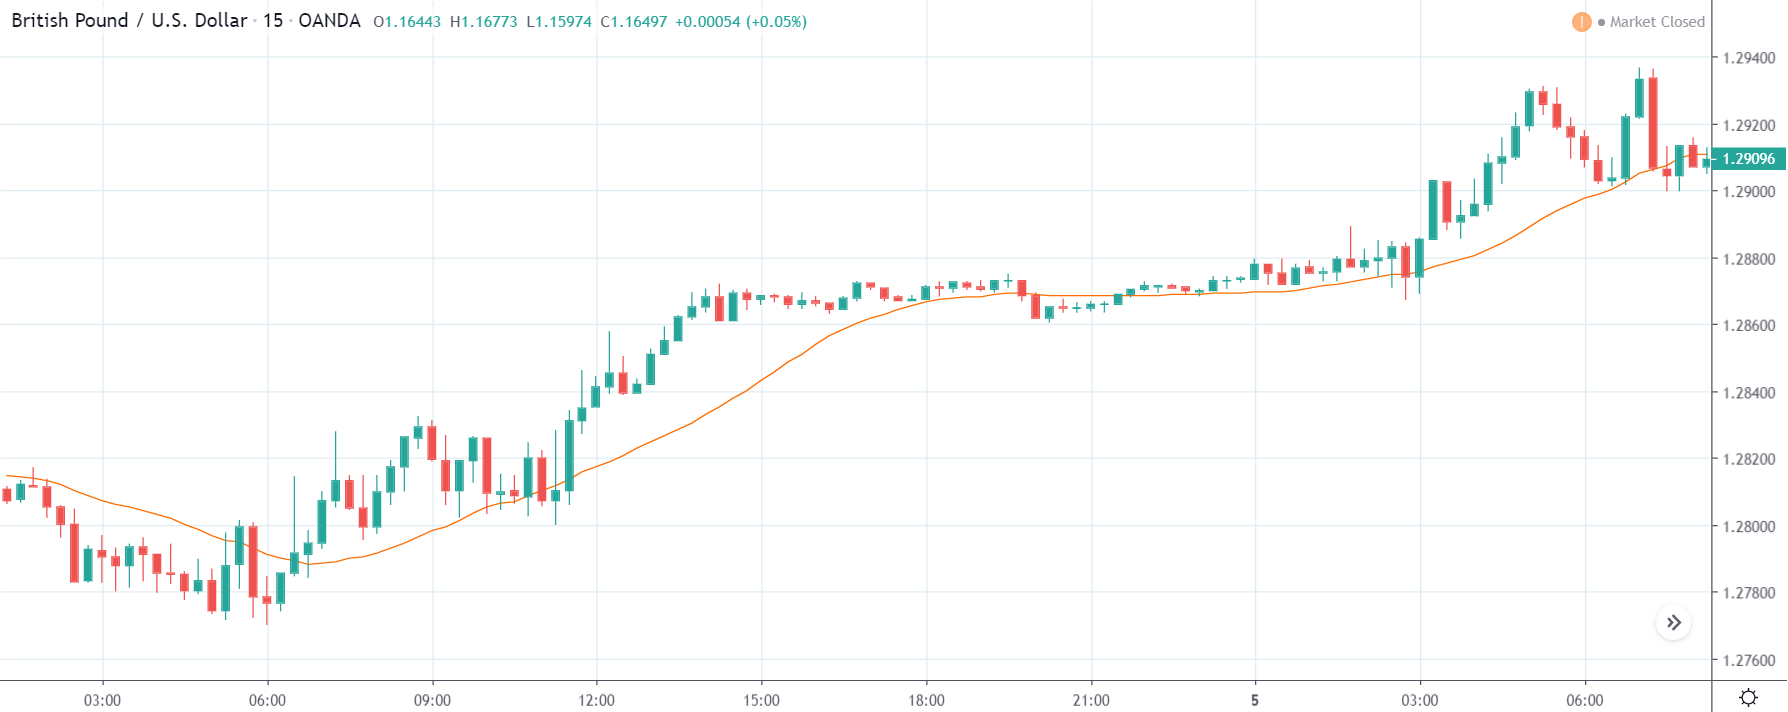
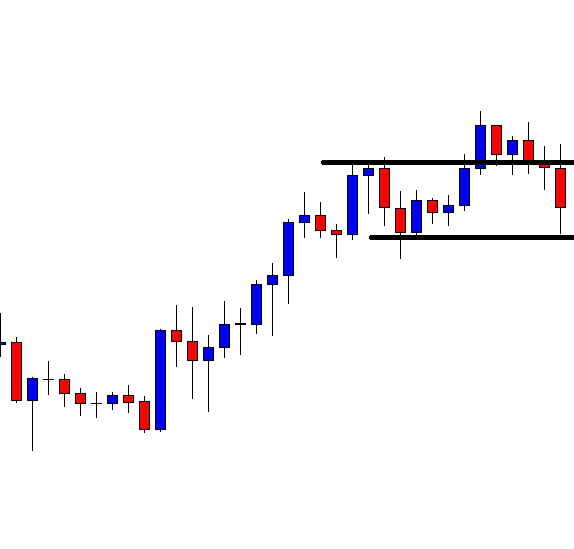
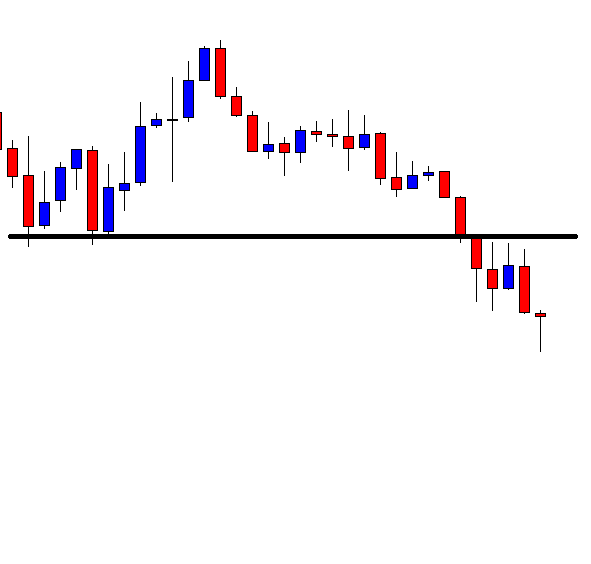
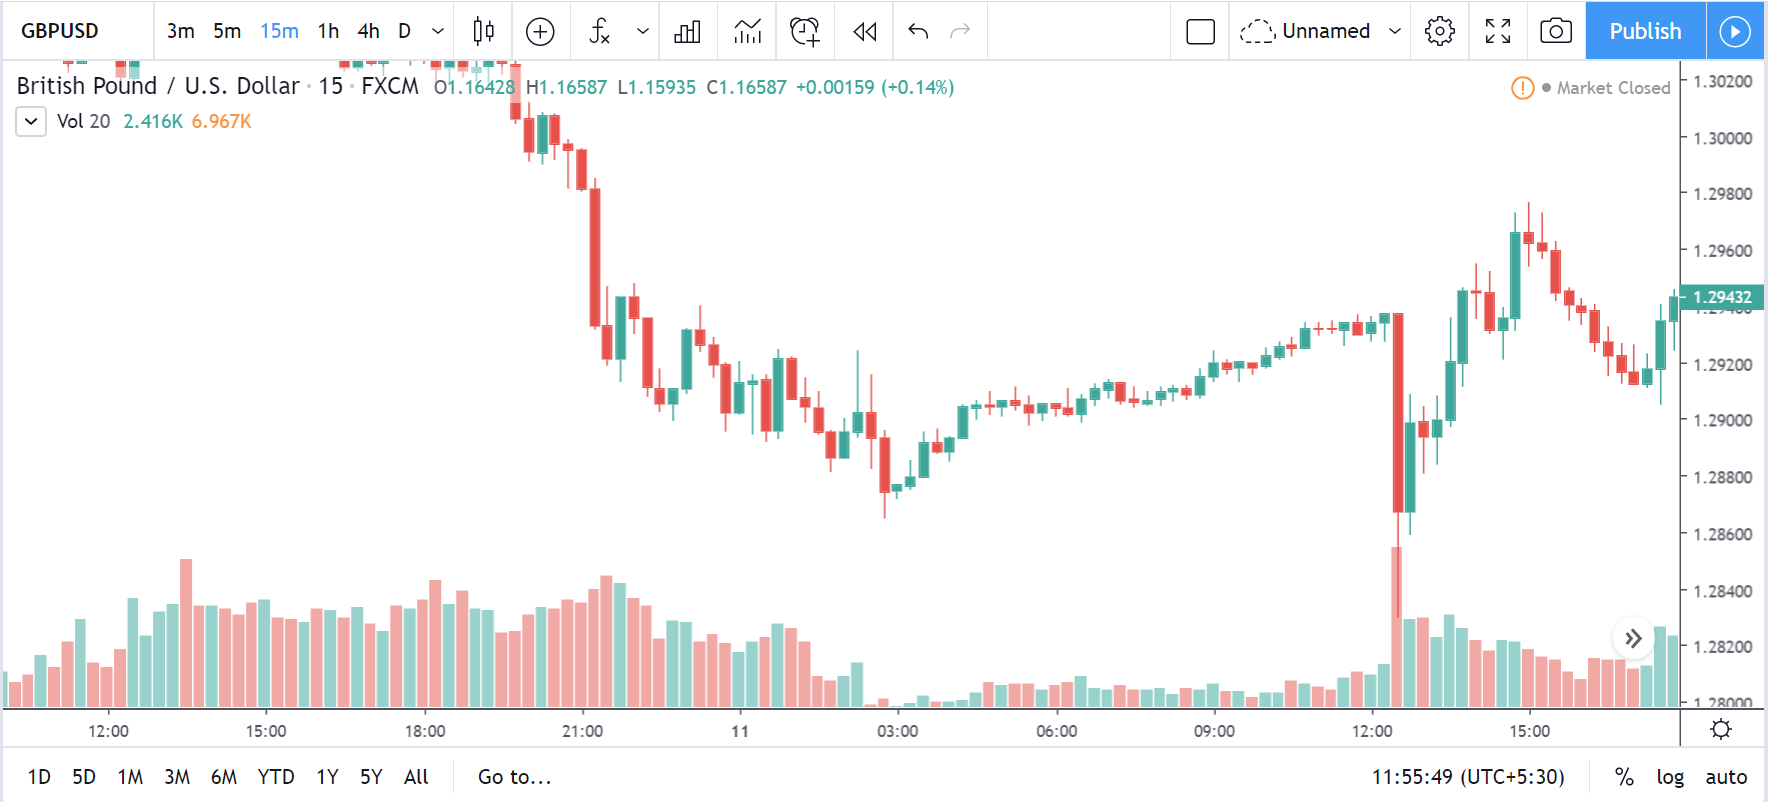
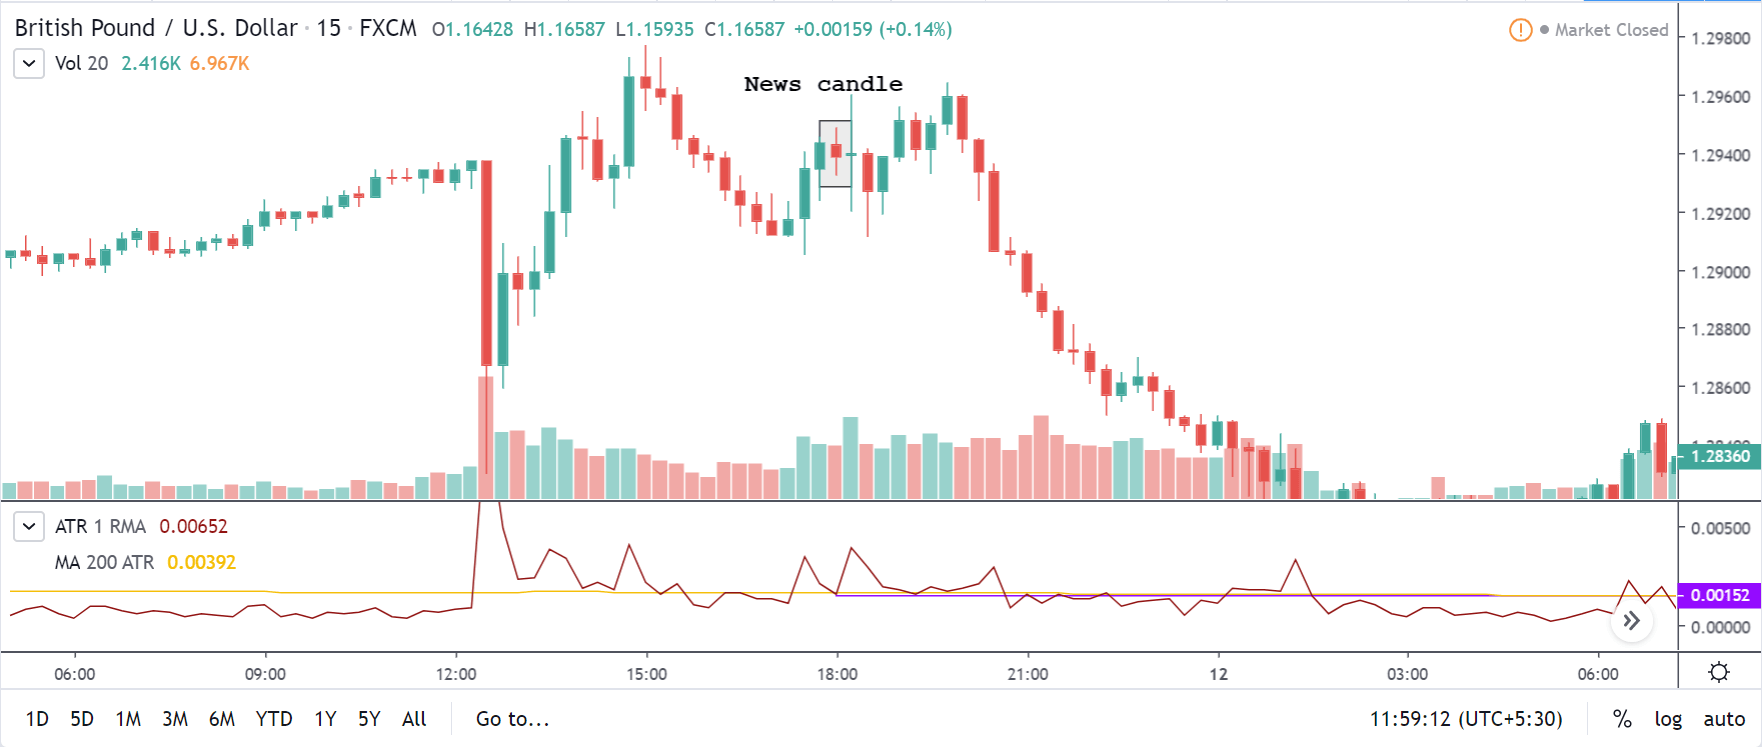
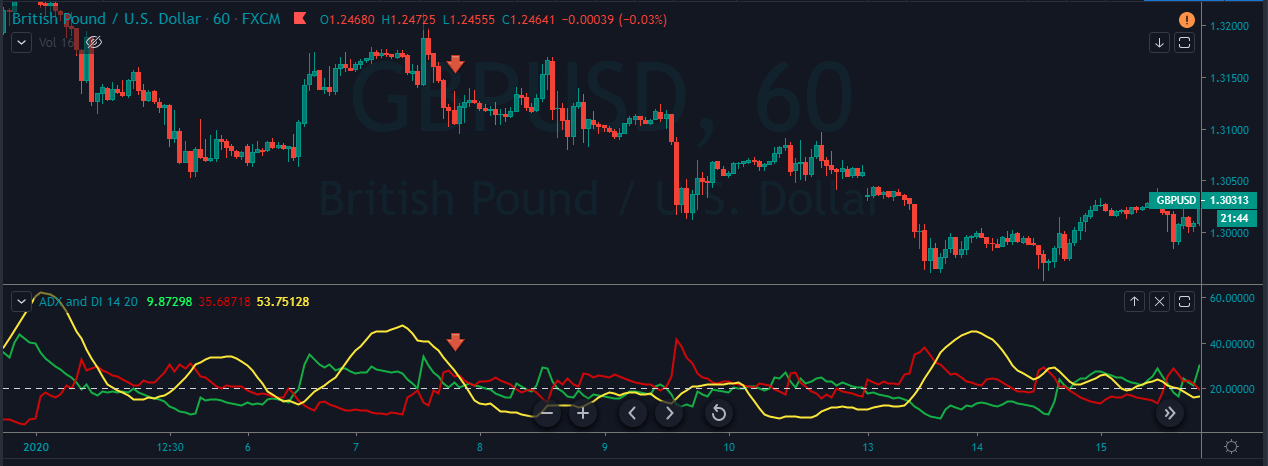
GBP/USD | Before the announcement | 5th March 2020
GBP/USD | After the announcement | 5th March 2020
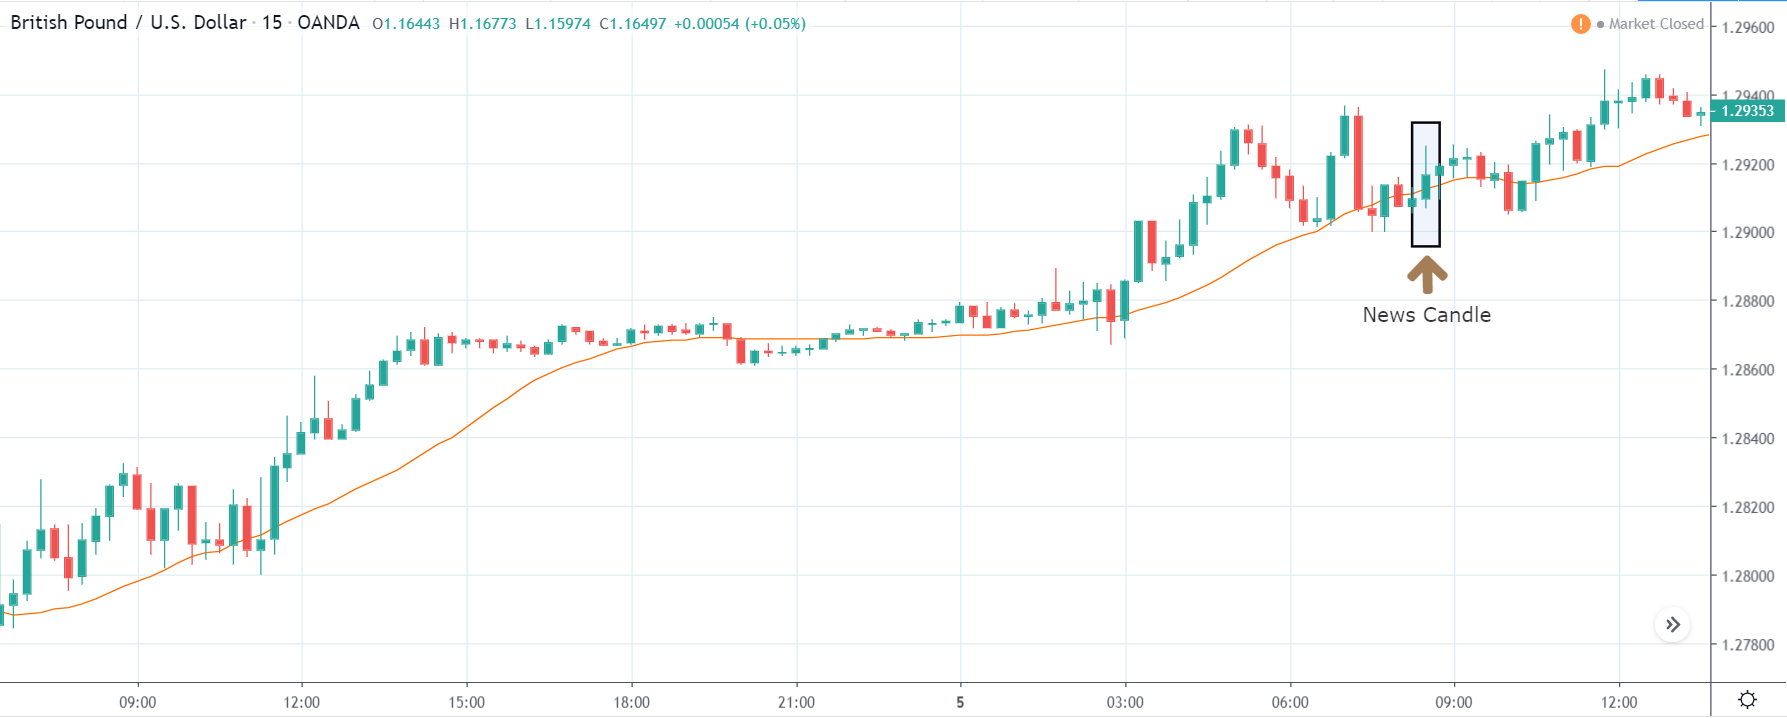
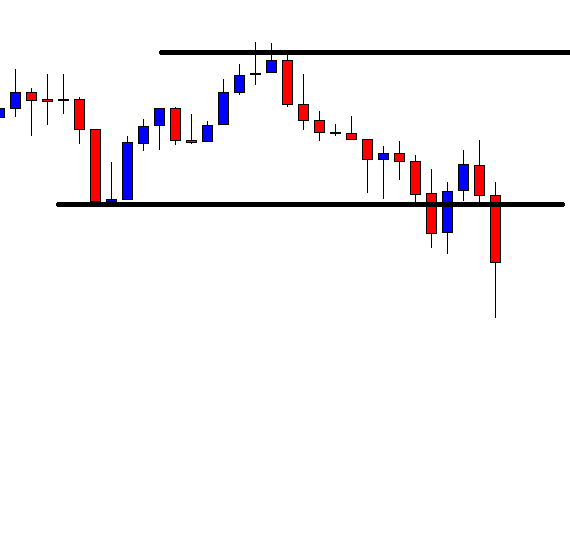
The above images represent the GBP/USD currency pair, where the characteristics of the chart are totally opposite to that of the NZD/USD chart. Here, the uptrend seems to be dominating, which is also confirmed by the moving average indicator. The forecasted productivity data is not having any impact on the pair before the news announcement, which means the data is relatively weak against British Pound. After the announcement is made, we see the market moves up as the data was no better than the forecasted data. The ‘news candle’ leaves a wick on the top since the data was mildly positive for the US dollar but has no significance. Therefore, the volatility increases on the upside with a minor impact, and the market continues its uptrend. In this pair, we don’t really see a point of ‘entry’ as we don’t have technical factors supporting the trade and hence should be avoided.
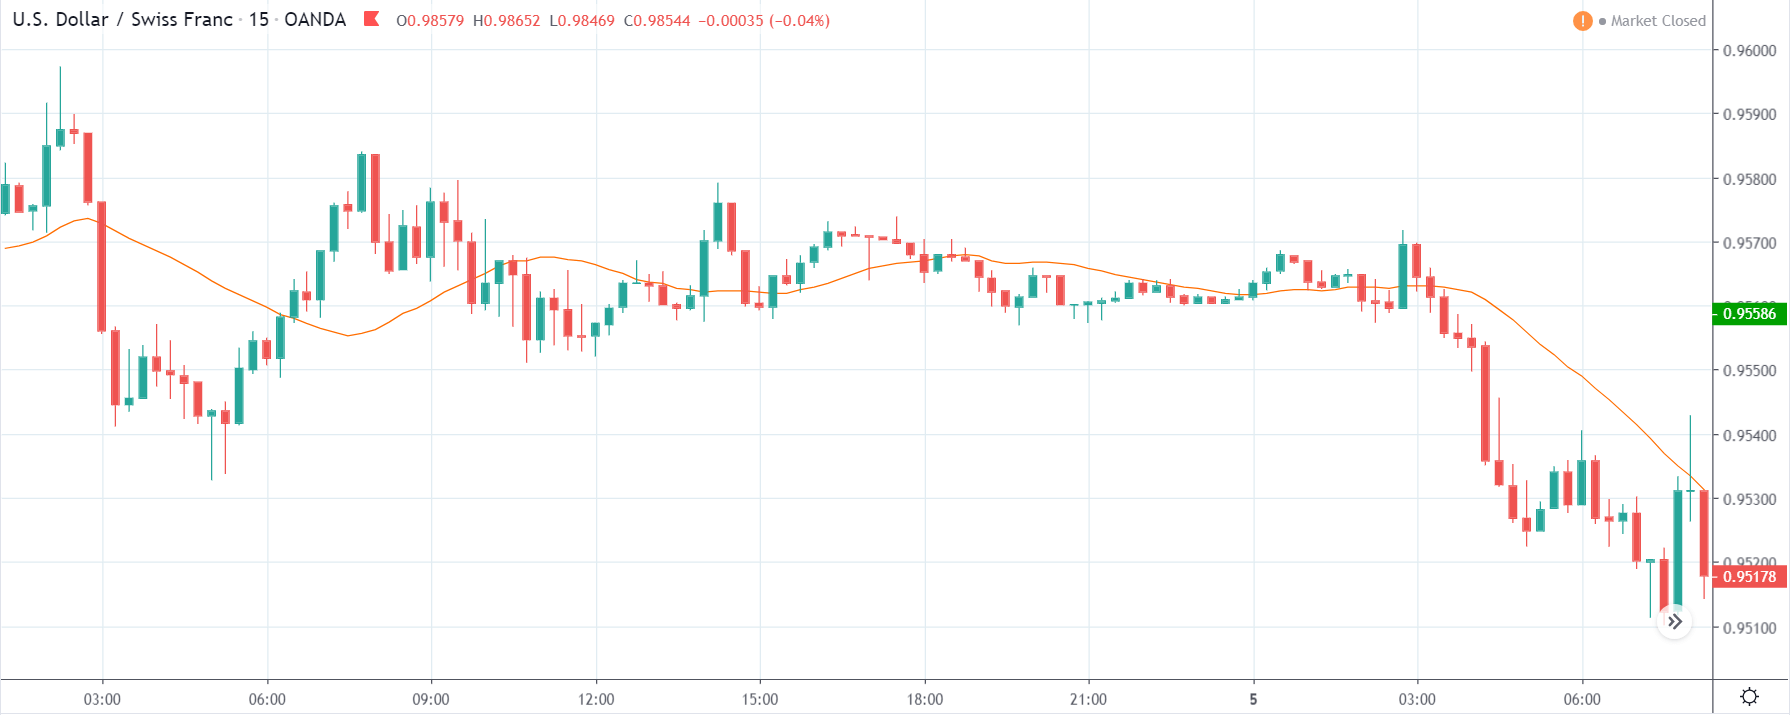
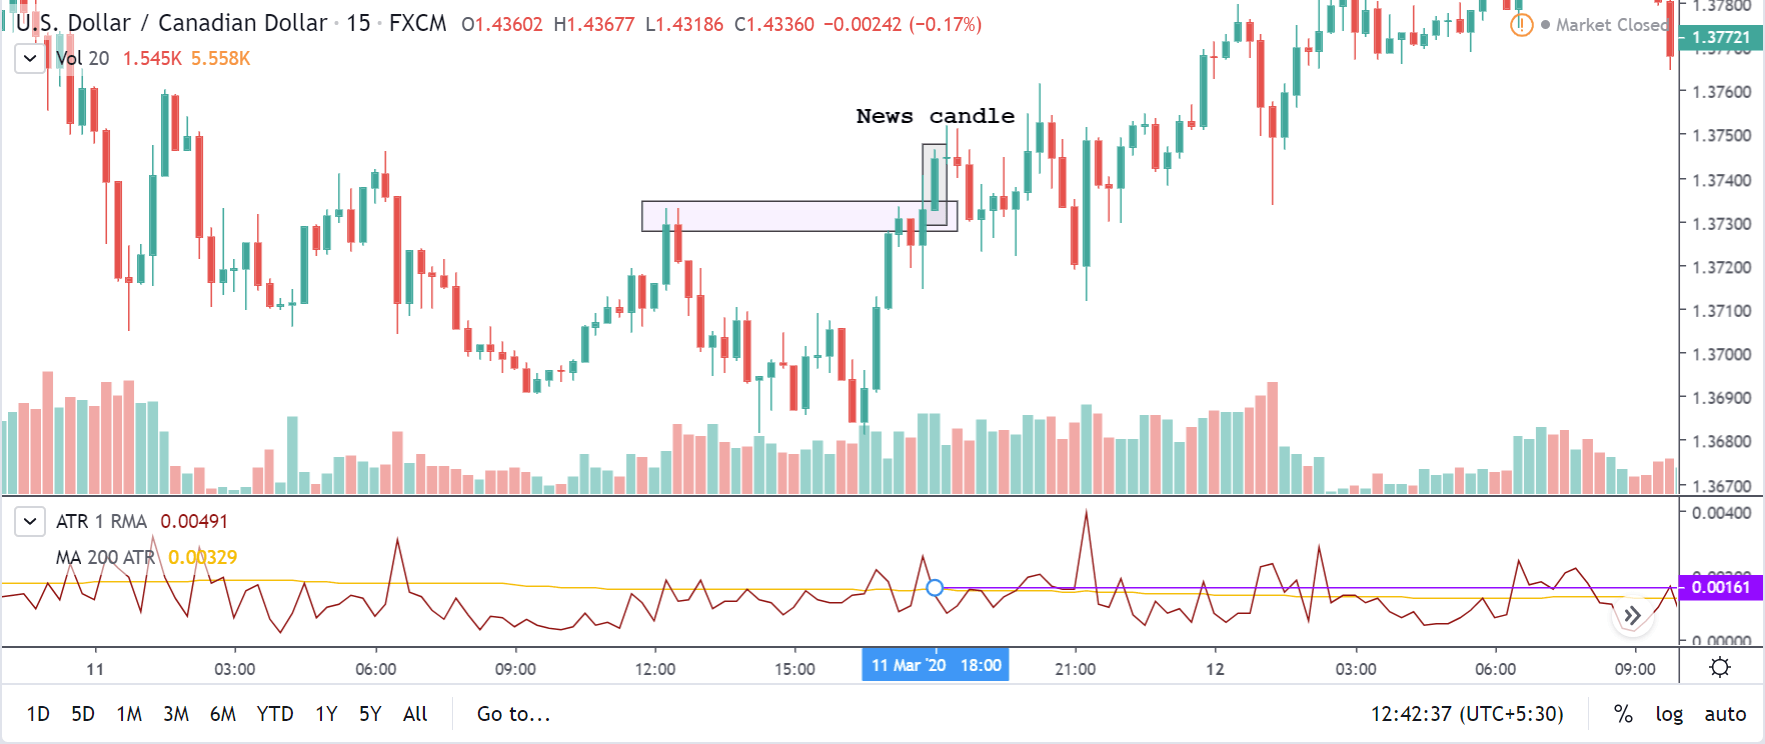
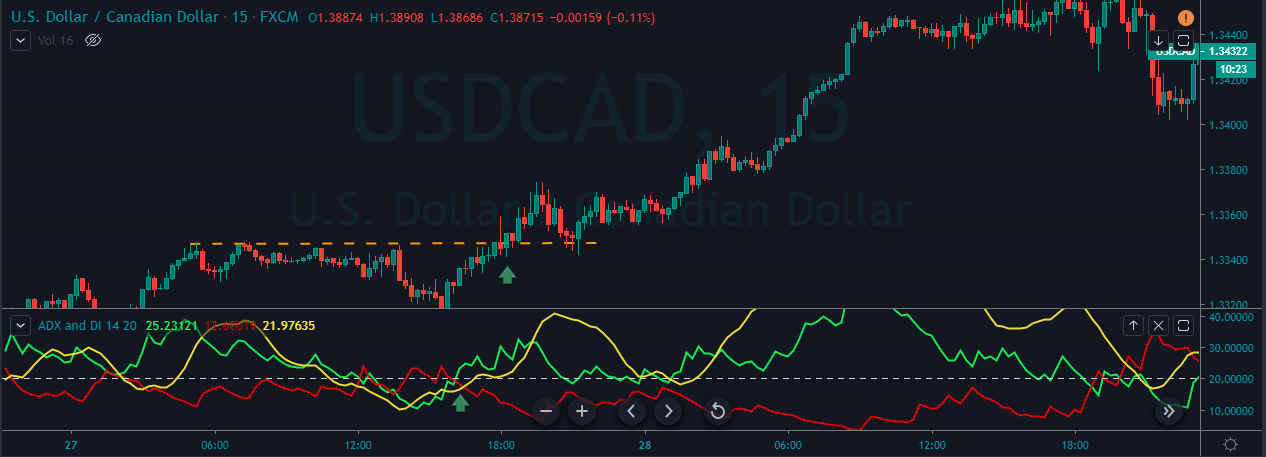
USD/CHF | Before the announcement | 5th March 2020
USD/CHF | After the announcement | 5th March 2020
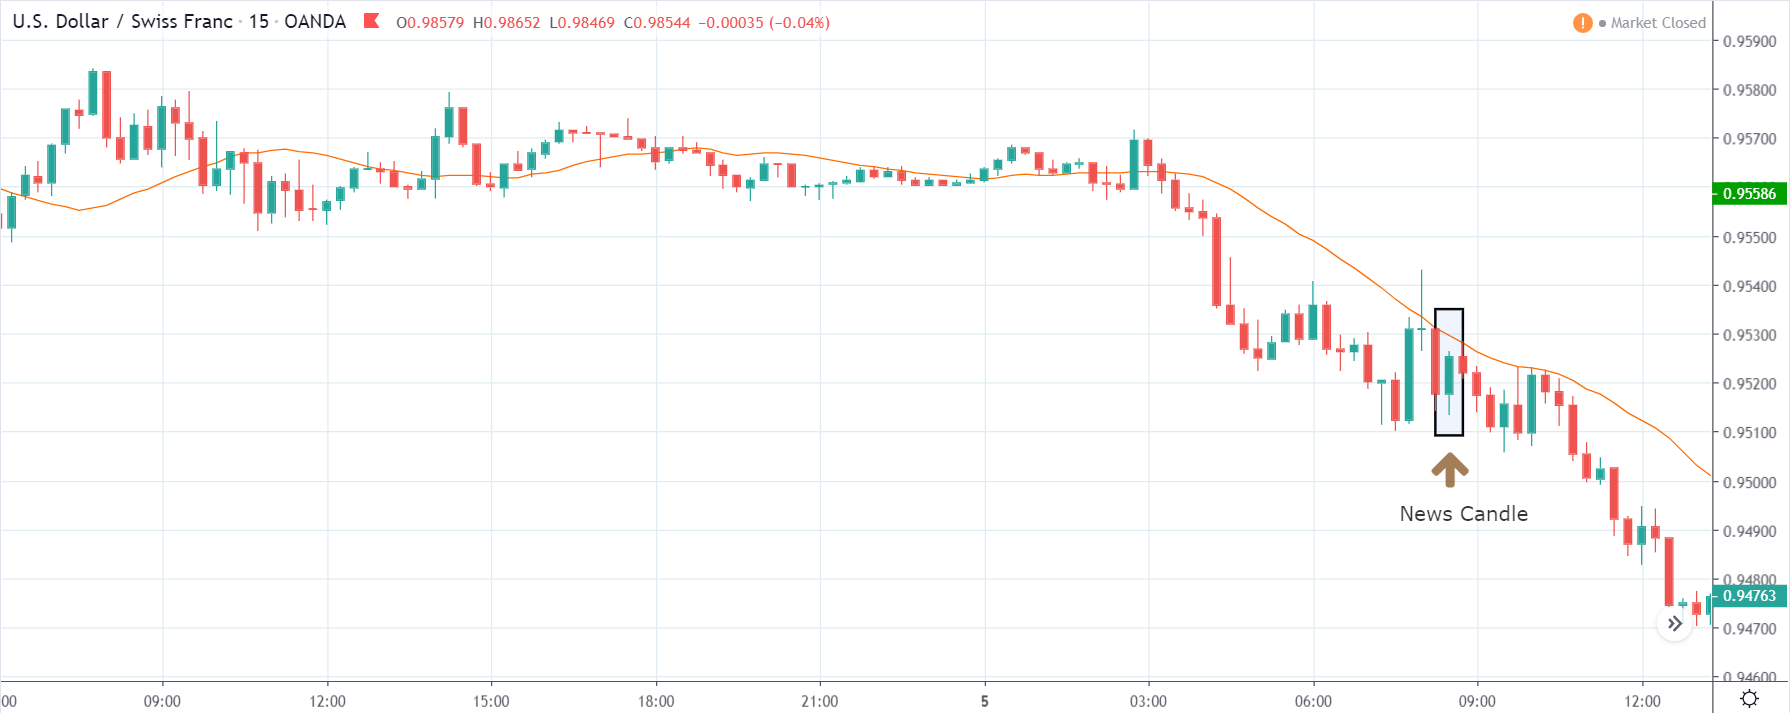
The above chart of USD/CHF is similar to that of GBP/USD pair, but since the US dollar is on the left-hand side, the chart is in a downtrend. Here too, the US dollar is showing a great amount of weakness before the news announcement, which means even a positive Productivity data is less likely to result in a reversal of the trend. After the news announcement, we see that the price suddenly shoots up, and the price closes as a bullish candle. As the impact of Productivity data is less, the sudden rise in volatility shouldn’t last, and hence this could provide an opportunity for joining the trend. When volatility increases on the downside, we can take ‘short’ positions in the market with a stop loss above the ‘news candle.’ This is how we need to analyze such news outcomes.
That’s about Productivity and its impact on the Forex market. If you have any doubts, please let us know in the comments below. Cheers.


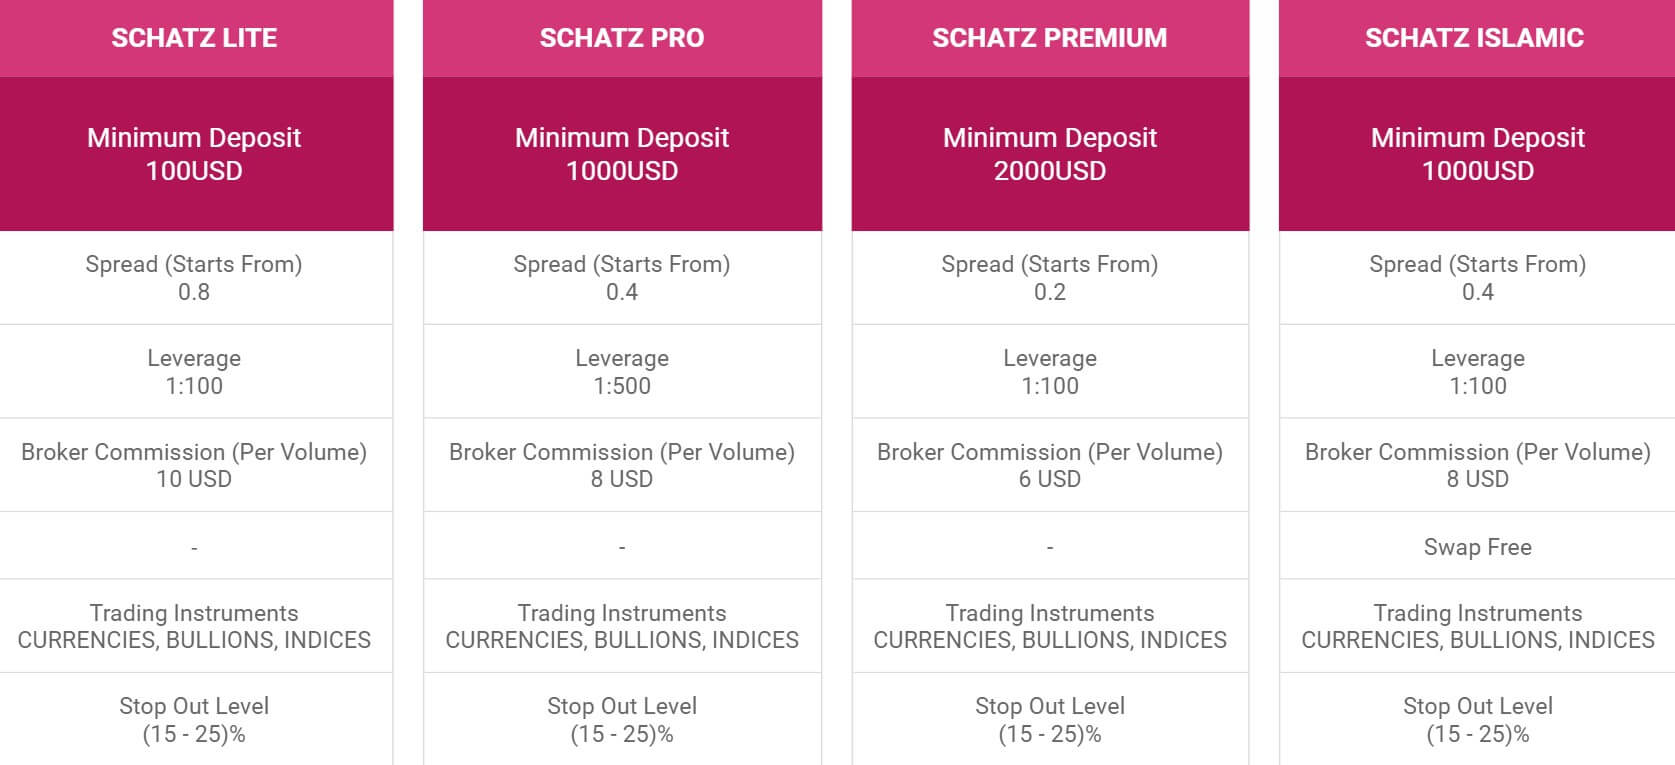
 30:1 for major currency pairs


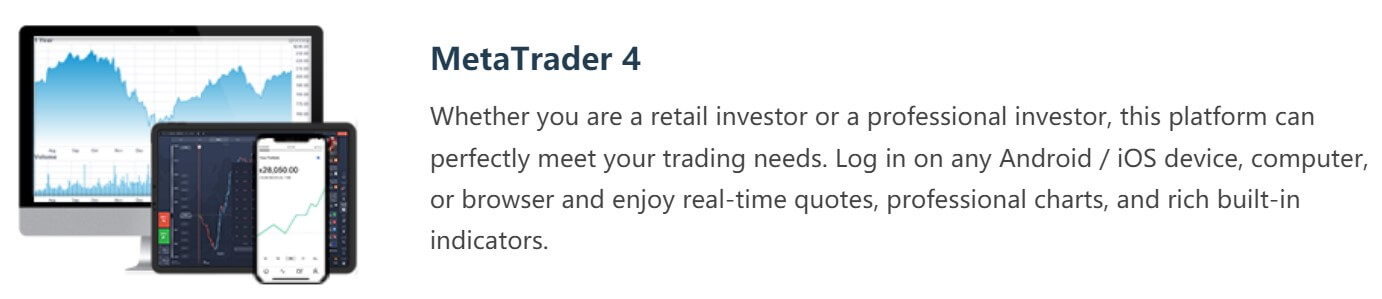
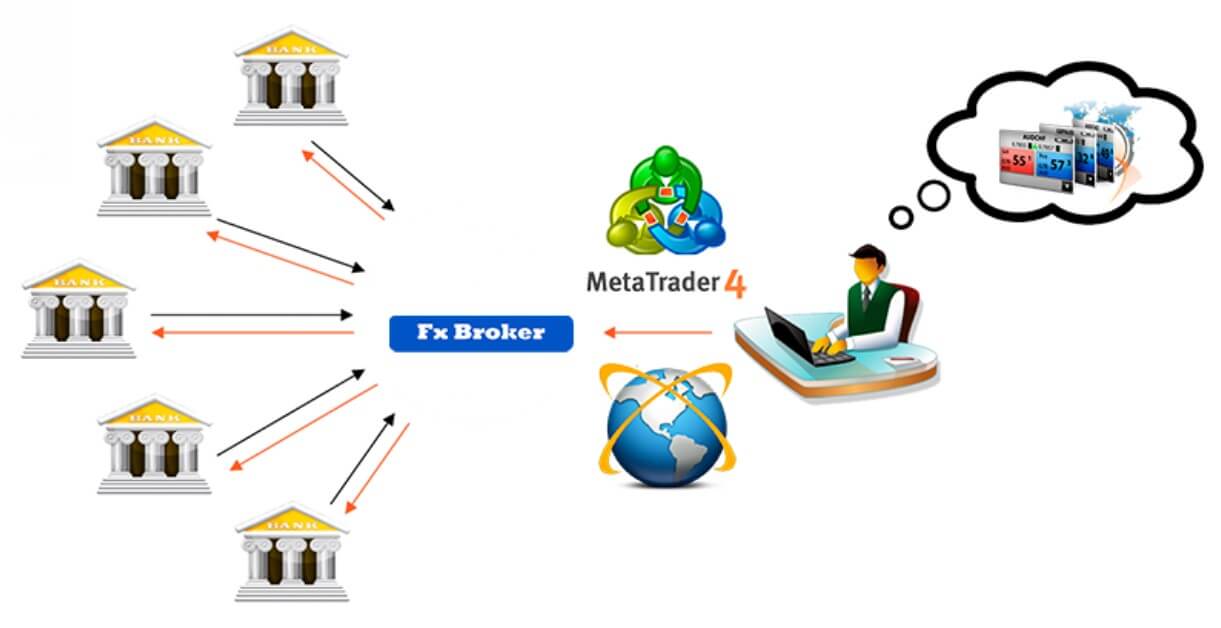
 Just the one main platform available from Circle Markets, MT4 is an all-in-one trading platform with a user-friendly interface and easy to use functionalities allowing traders to analyze the markets, place orders and manage their own risk all with a single click; traders can also manage several trading accounts simultaneously, not to mention its cutting edge technology which includes a web-based solution enabling traders to trade at any time from any device and from anywhere in the world. Thousands of free and paid signals with various profitability and risk levels working on a demo and real accounts are at your fingertips. MetaTrader 4 provides the full-fledged environment for the development, testing and optimizing algorithmic/automated trading programs.
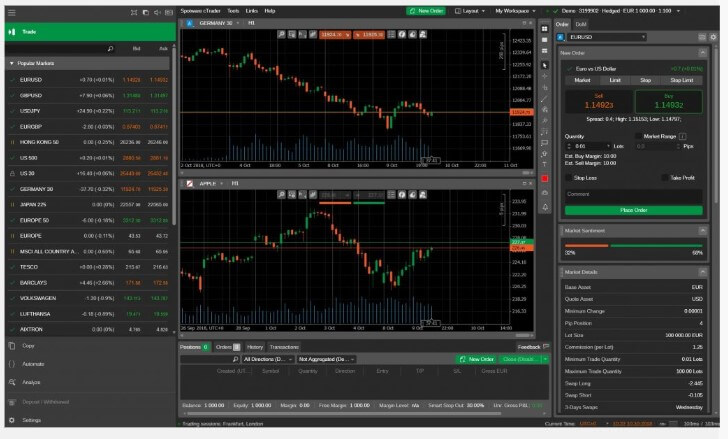

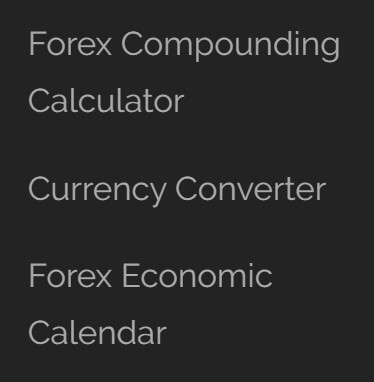 There are a few small aspects available on the site, the first is a forex compounding calculator allowing you to see how the compounding of your account will work, there is also a currency converter available. The next section is an economic calendar, this details different upcoming news events and also indicates any potential effect the news could have on the markets. There is also a guide to CFDs and even a few small guides based on how to use the trading platforms.
 The Circle Markets support team is available 24 hours a day 7 days a week so they are always reachable. You can contact Circle Markets using the available submission form, simply fill it in and you should then get a reply via email. They also provide you with a postal address, email address and a phone number for a choice of contact methods.


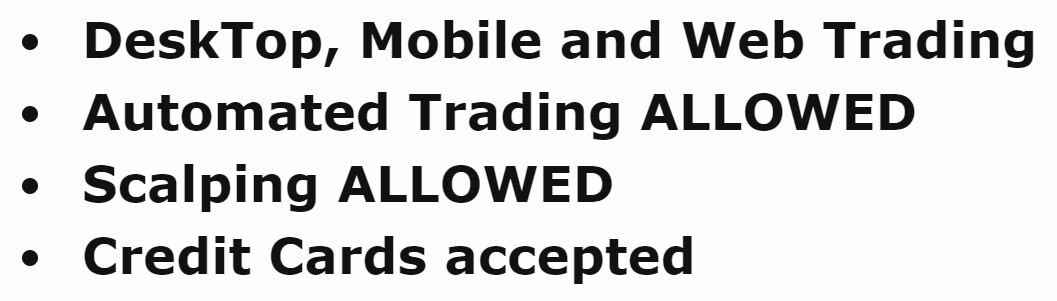
 Leverage on all accounts can go up to 1:100, leverage can be selected when opening up an account, we are not sure if it can be changed once an account has been opened though.

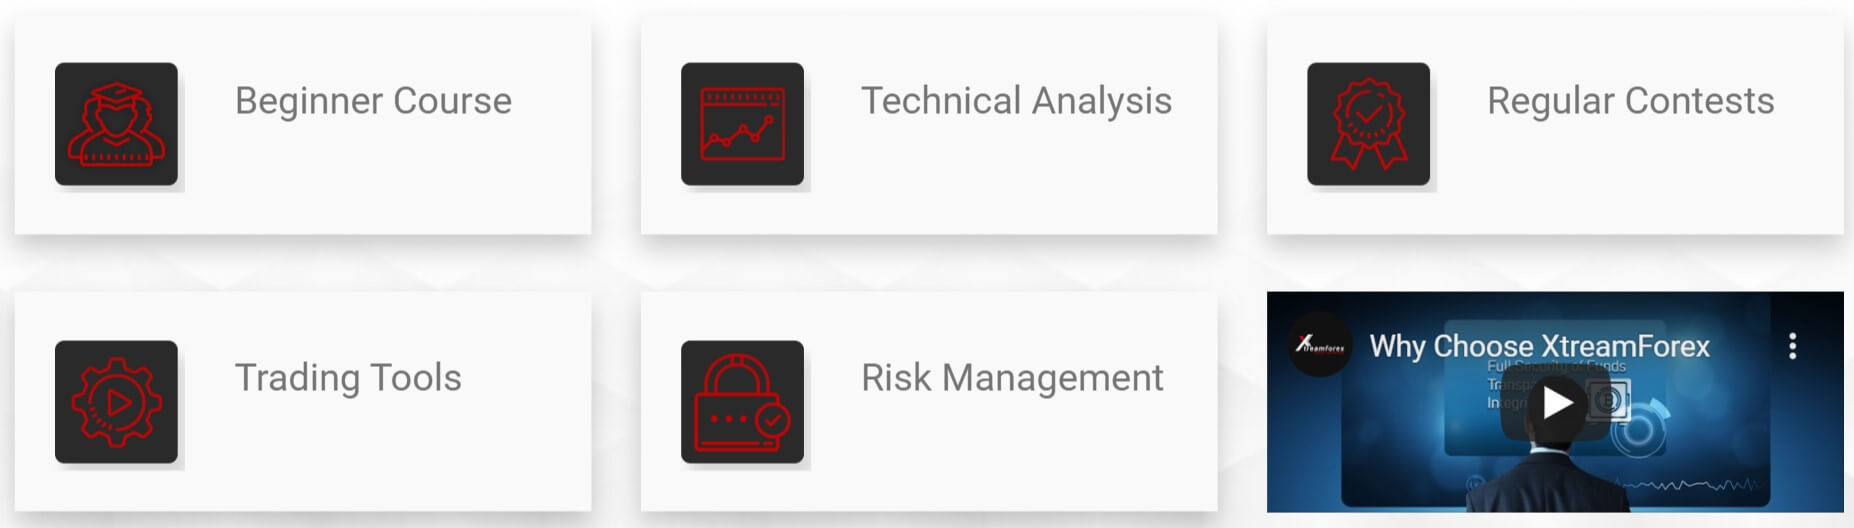
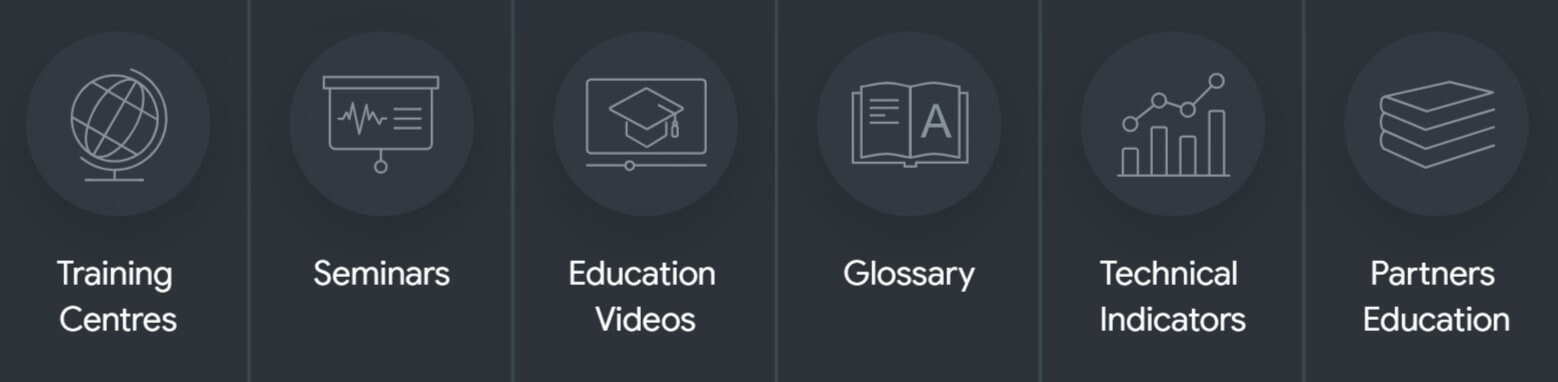
 Educational & Trading Tools
 A lot on BMFX equals 10,000 units instead of the usual 100,000. The minimum
  Forex:

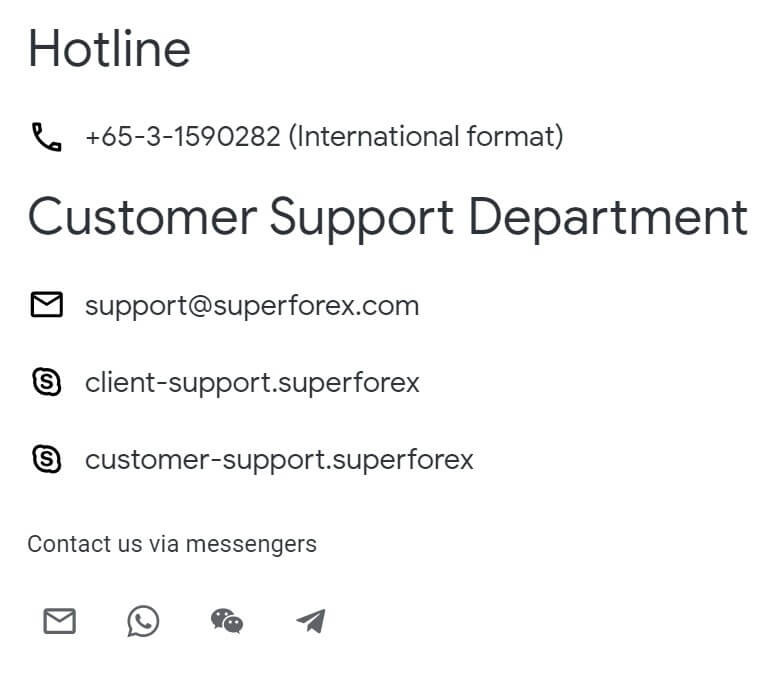
 The customer support team is available 24 hours a day 5 days a week, they close over the weekends just like the markets do. Their contact form is very limiting, it only offers an online form to fill in with your name, email, phone and comment. The front page says that they have locations in 14 countries including Australia, the UK, UAE, Egypt and more, and it also states that the customer service team can speak any language as there are 2,5000 assistants worldwide. However, they don’t really offer a way to contact them.


 1) A possibility to trade with low risk – a safety Forex trading.


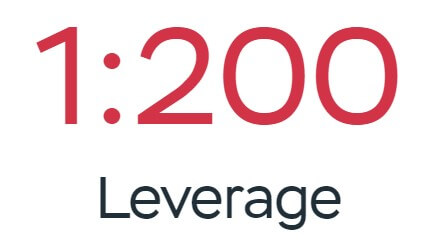 The maximum leverage available is 1:200, it is not clear which accounts this is relevant to but the homepage simply states that the max is 1:200. This can be selected when opening up a new account.
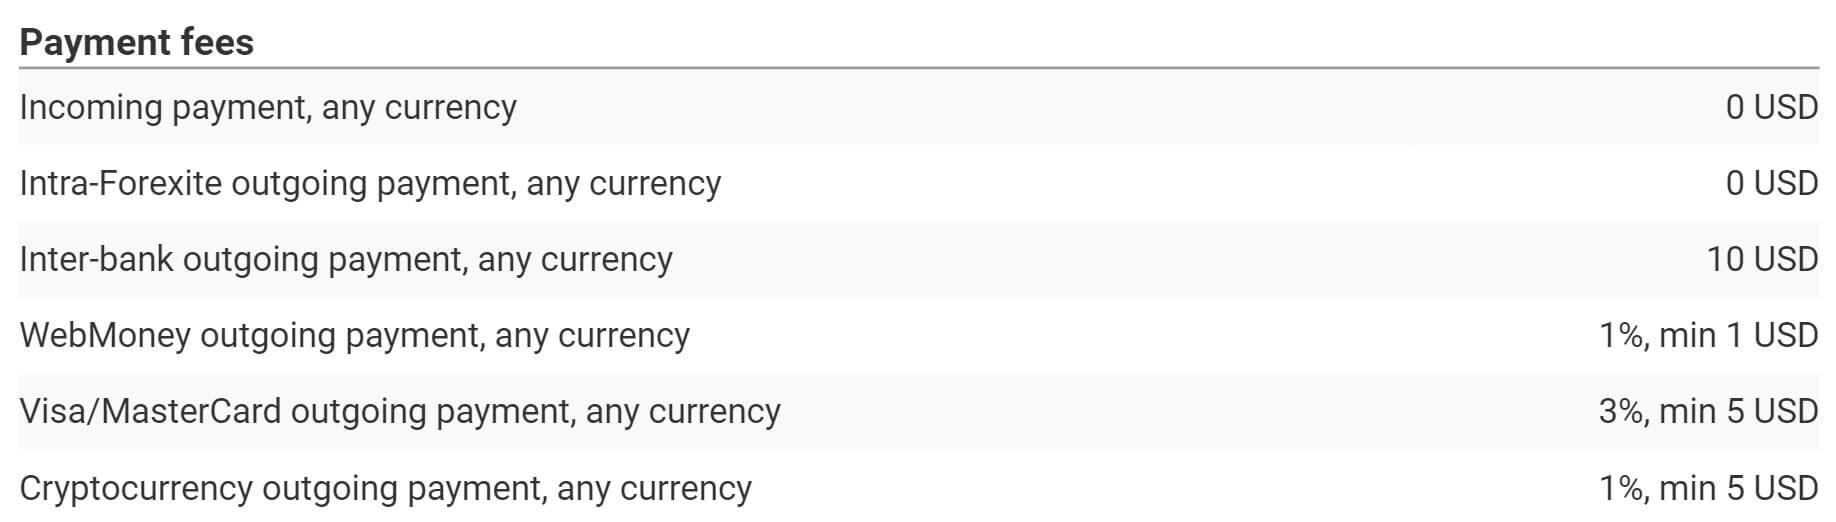
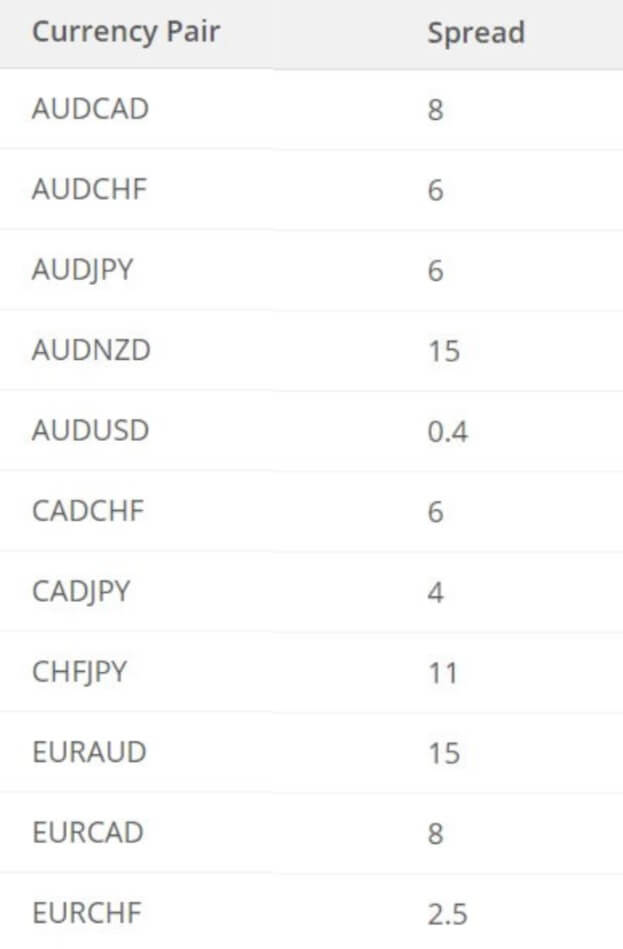
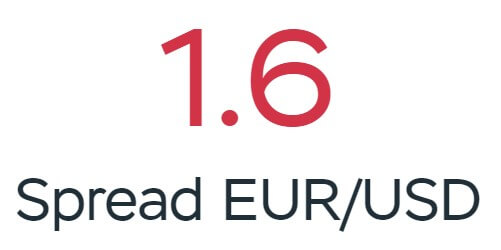 We do not have a full breakdown of the available assets so we also do not have a full breakdown of the available spreads. The only spread mentioned is on the home page which says that the spread on EUR/USD is around 1.6 pips, we would be assuming that this is the starting figure and would be relevant to the top tier account. Lower tier accounts will most likely have higher starting spreads. The spreads are variable though, which means they move with the markets when there is added volatility they will be seen higher and different instruments will have different starting spreads.
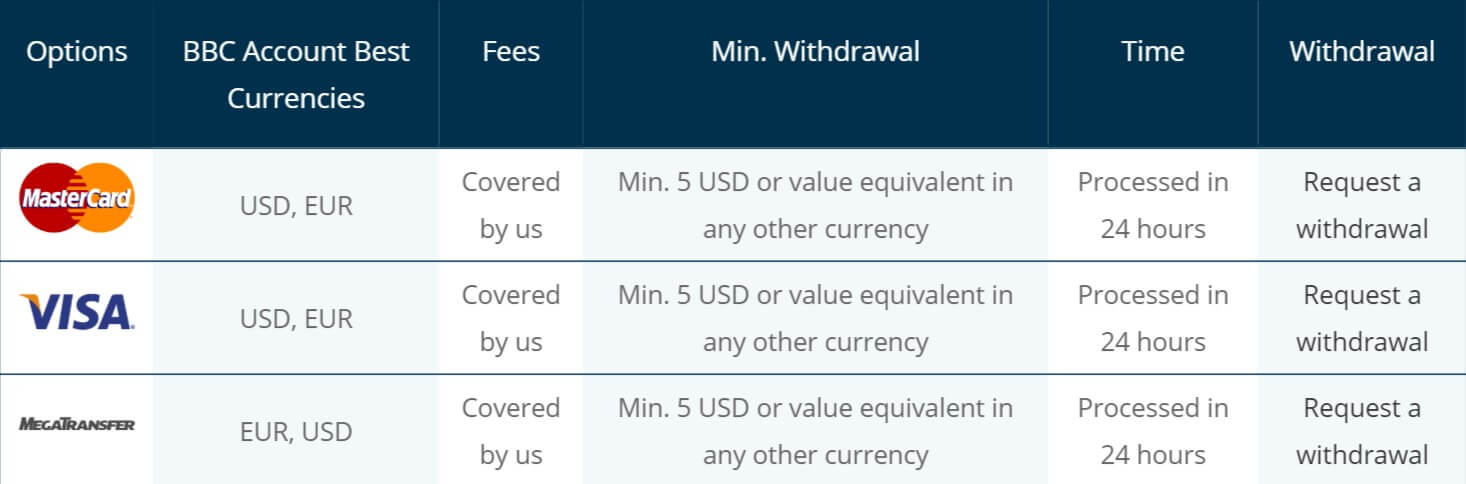
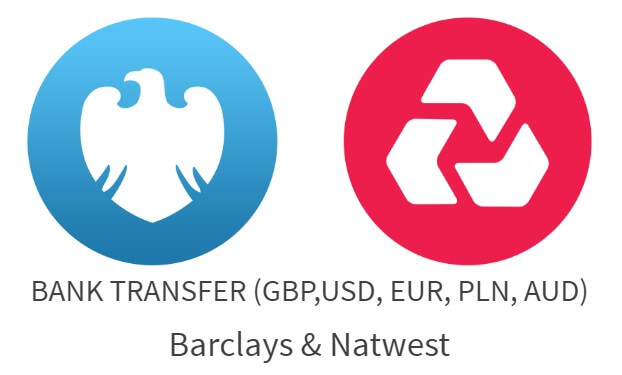
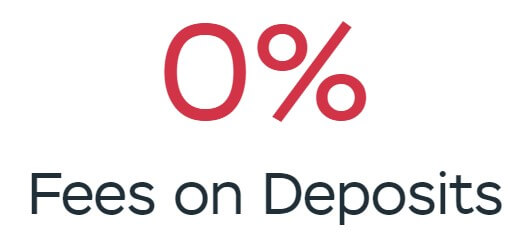 There isn’t a dedicated funding page detailing deposit methods, instead, we can only go with the information provided which is an image of Visa, Maestro, MasterCard, Neteller and AstroPay at the bottom of the site. There are no added fees for depositing and we would always suggest contacting your bank or processor to see if they will add any fees of their own.
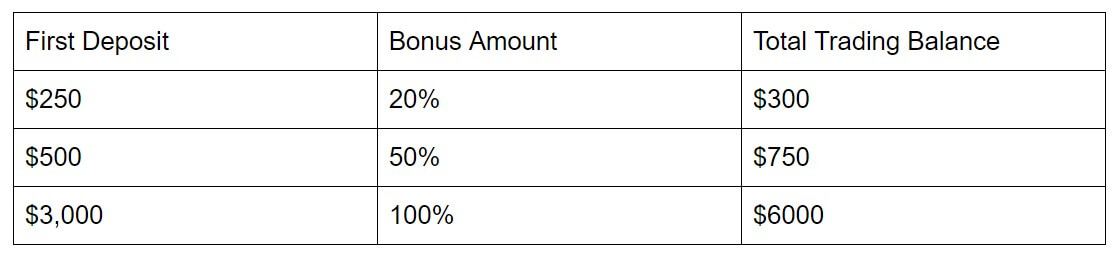
 There is a 30% bonus available, the only details about the promotion are on the account sign up page which states that you can get a 30% bonus on your first deposit. There is no more information surrounding it such as how to convert the bonus into real funds or what the maximum bonus available is.


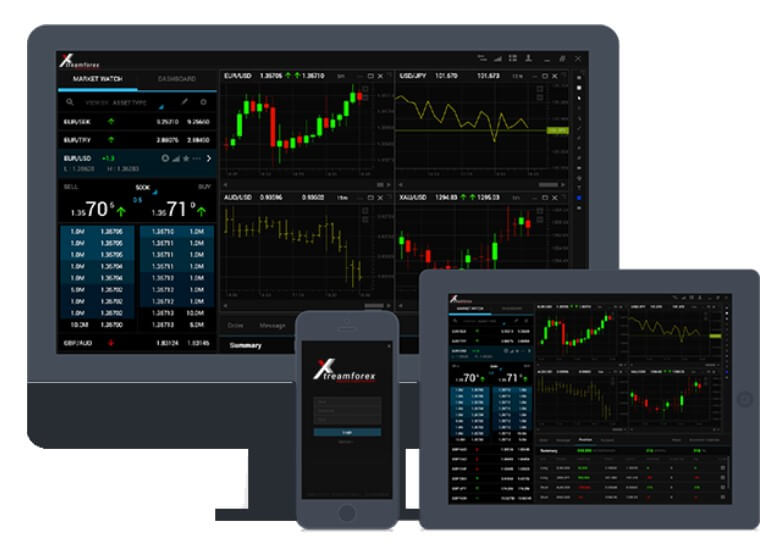
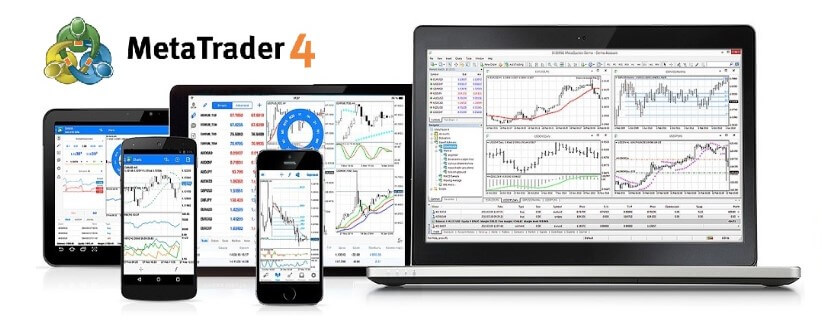
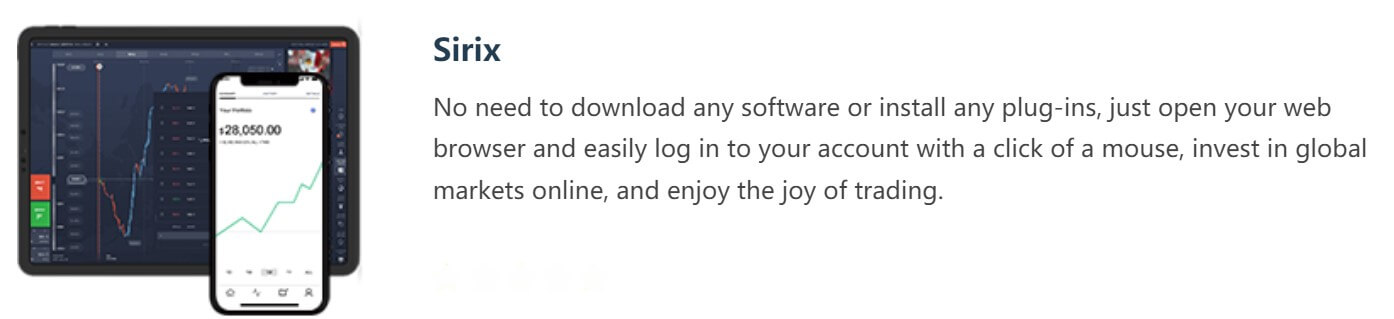
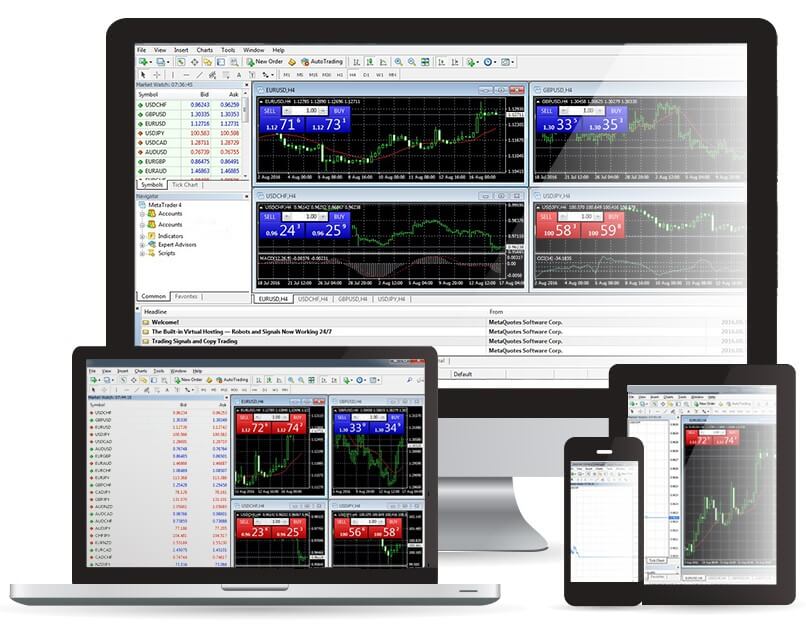
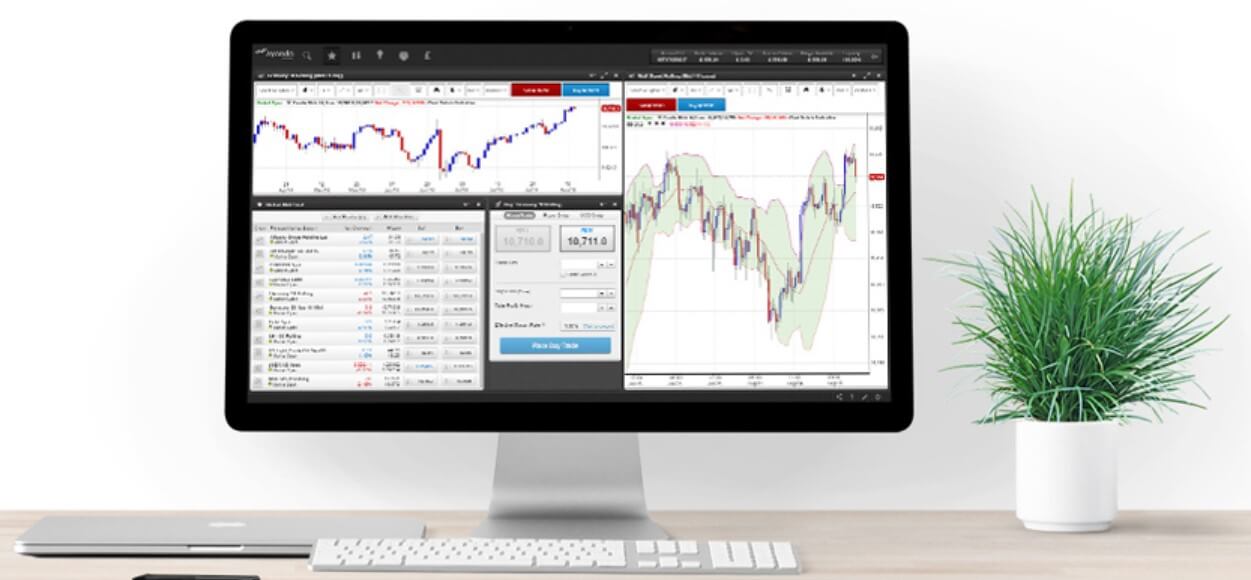
 MetaTrader 4: MT4 has quickly become the world’s most used trading platform hosting millions of traders. Accessible as a mobile application, desktop download or web trader, it is accessible from anywhere in the world. It’s compatible with hundreds and thousands of expert advisors and indicators to help with your trading needs.
 BNFX xStation: BNFX X Station was designed for advanced currency traders who prefer more control, flexibility, customizations, and speed than traditional retail trading software packages. It provides true one-click trading on Level 2 market depth/order book views, built-in trading calculator, in-platform economic calendar, customizable layouts saved in the cloud, and a direct connection to the BNFX liquidity infrastructure. It was designed from the ground up as an ECN/STP platform
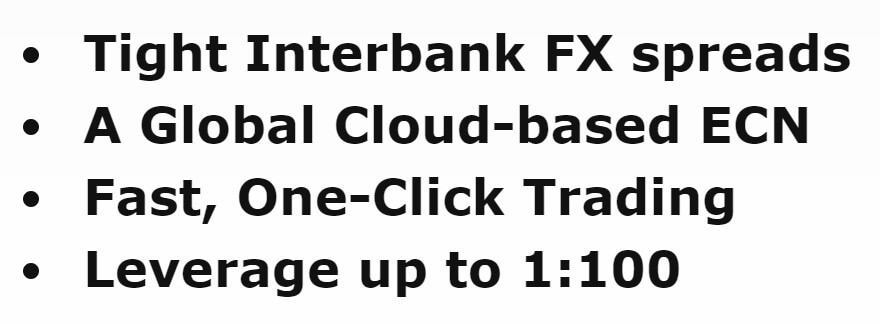
 Sadly there isn’t any information on the site regarding deposit methods or anything to do with them except for two little images of Visa and MasterCard, so we will be confident to say that they will be available, but we cannot say about any other methods. We also cannot comment on whether there are any added fees for depositing by BNFX.

 Bonuses & Promotions


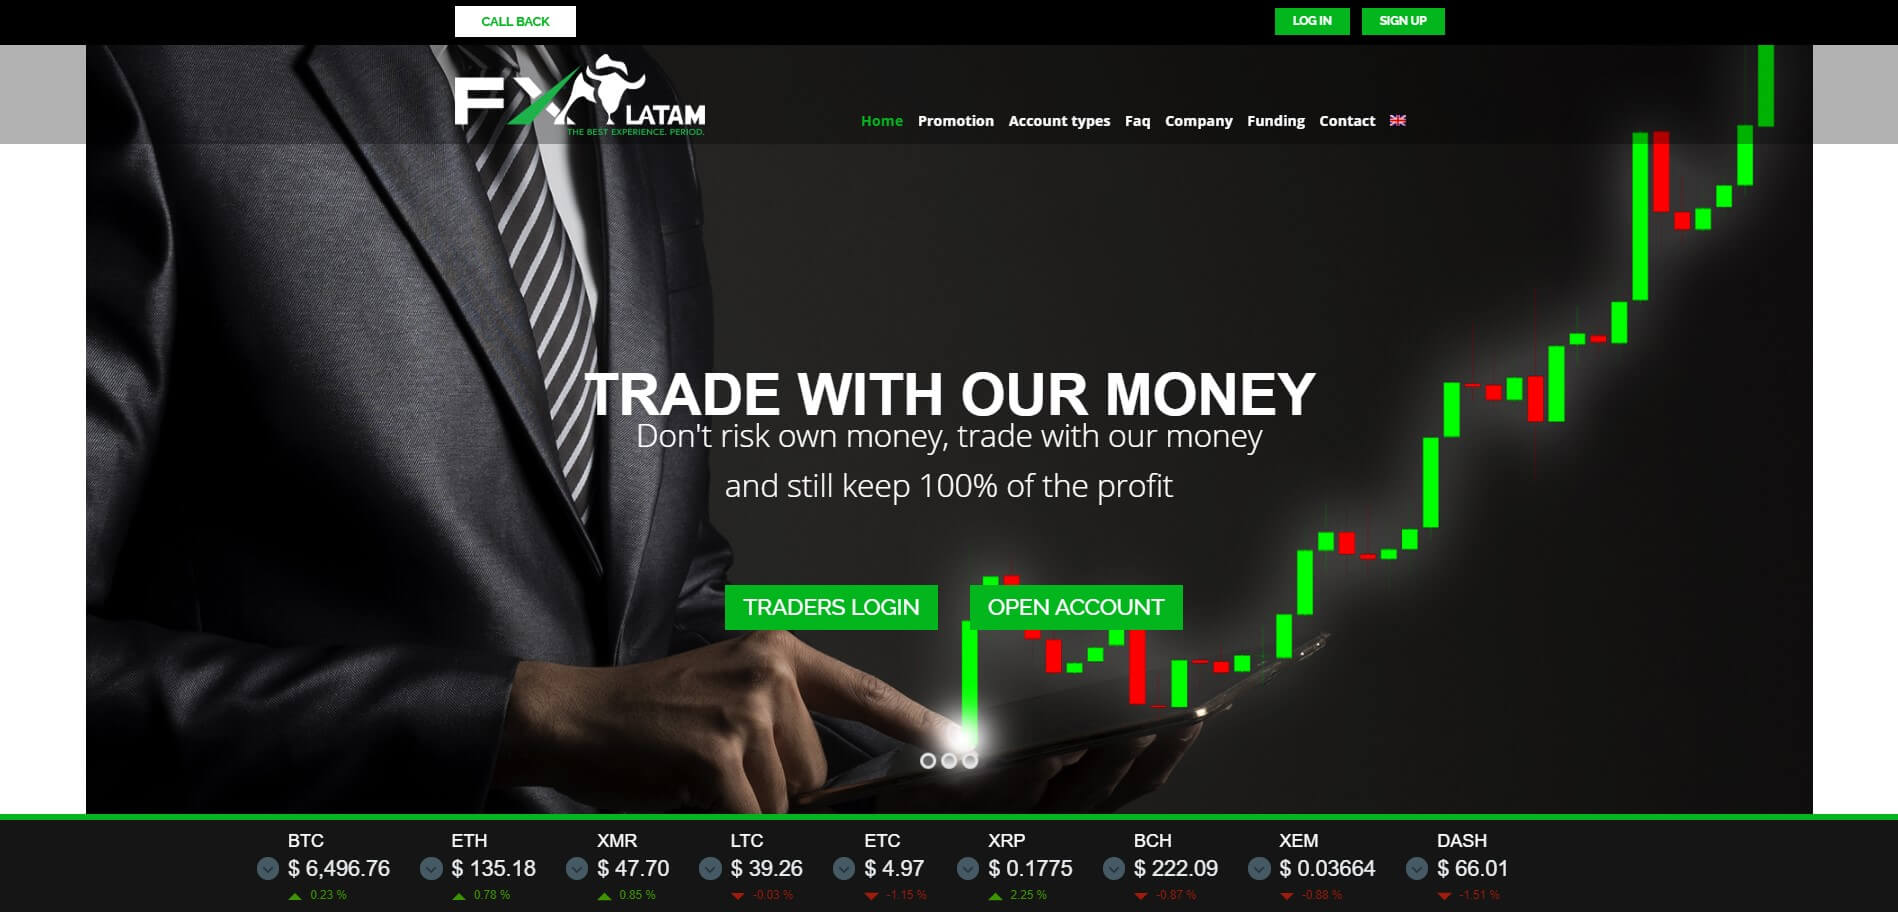

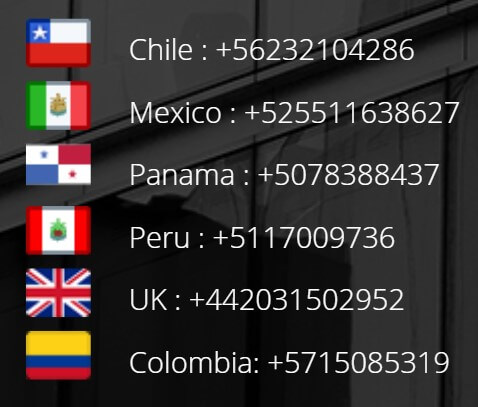 FXLatam is offering a number of different ways to get in contact with them, they do not state what their opening times are though. You are able to use the online submission form, fill it in and you should then get a reply via email, you can also use one of the many phone numbers which are available in countries such as Chile, Mexico, Panama, Peru, UK, and Colombia. There is also a postal address available and an email address, so plenty of ways to contact them.
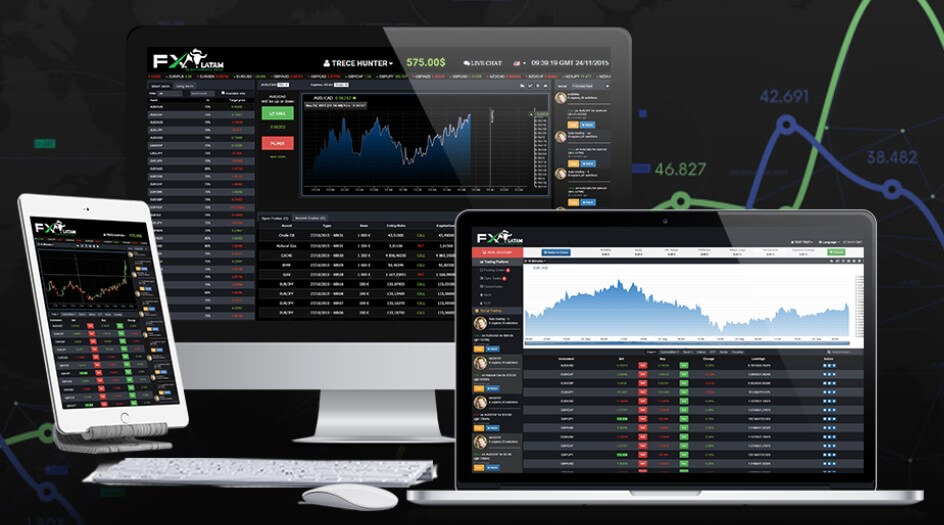
 Platforms


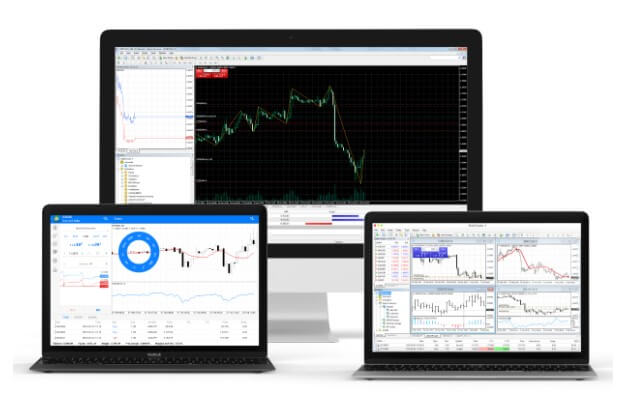 Blue Bull Capital has chosen MetaTrader 4 as their only trading platform, so let’s see what it offers. MetaTrader 4 is compatible with hundreds and thousands of different indicators, expert advisors,
 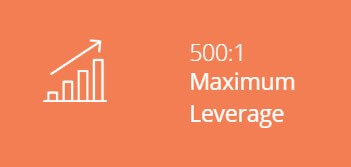 The maximum leverage for both account types is 1:500 which is what a lot of brokers are now aiming for. The leverage can be selected when opening up an account and should you wish to change it on an already open account, you should get in contact with the customer service team with this request.
 The assets available from Blue Bull Capital have been broken down into 6 different categories, we will briefly look at each to see some examples of what is available to trade.
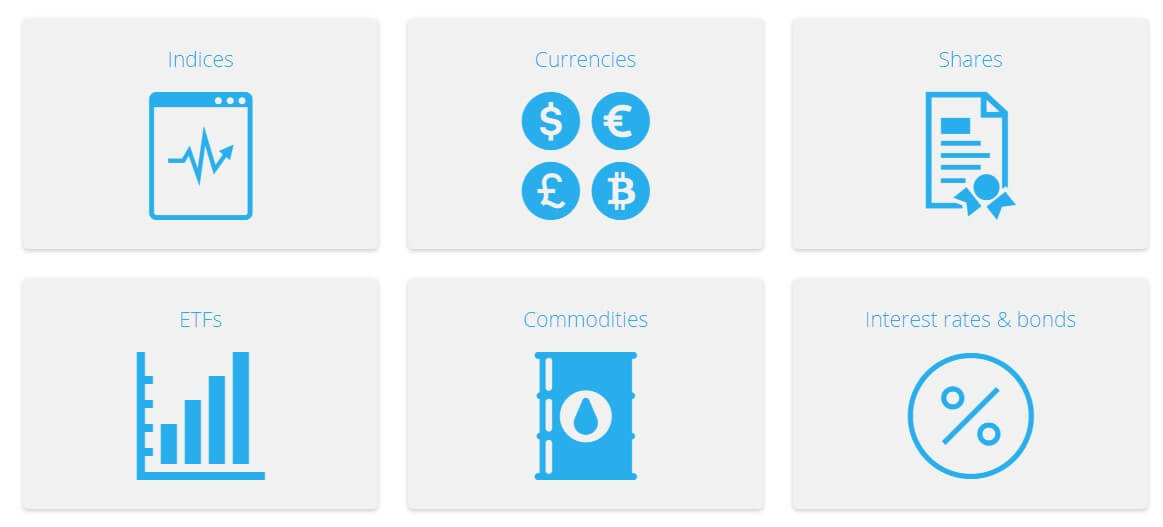
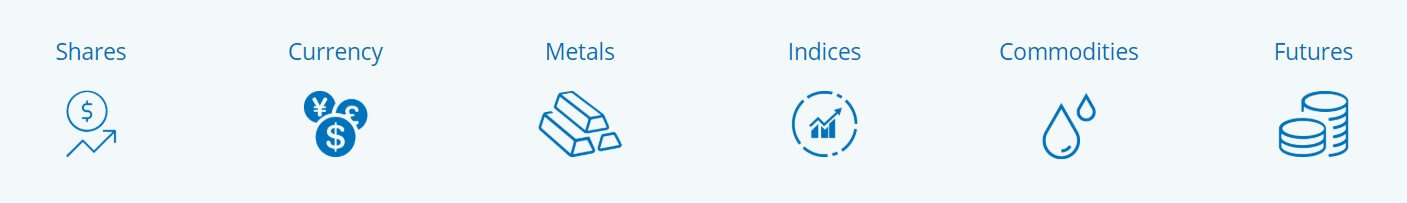
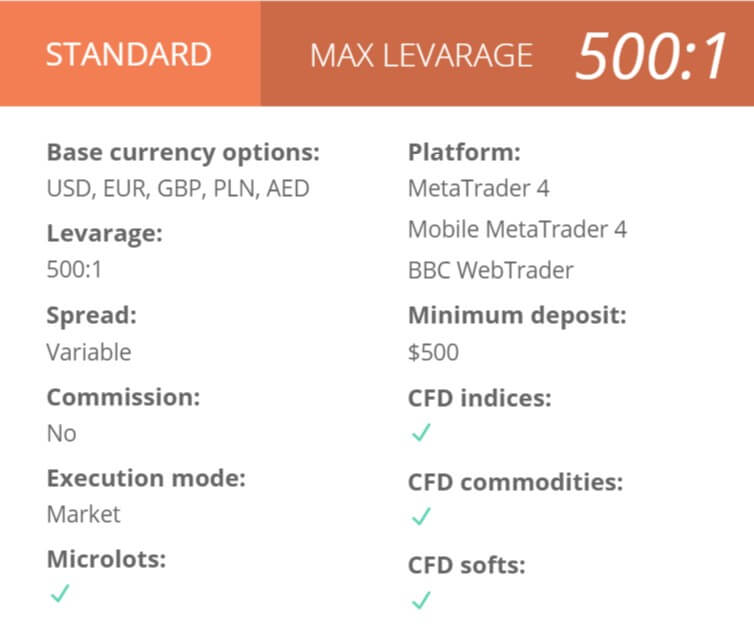
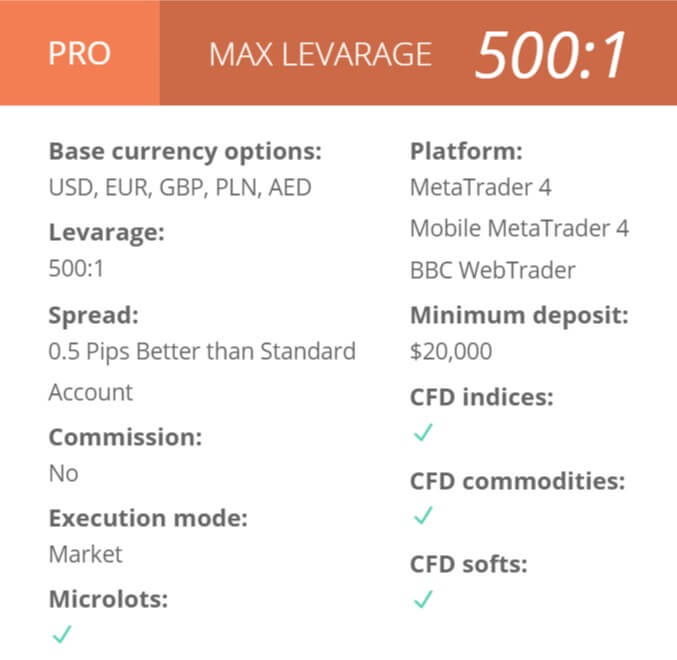
 The minimum amount required to open an account is $500 which gets you the Standard account, if you want the Pro account you will need to deposit $20,000. Once an account is open, further top-ups are as low as $5 depending on the method used.


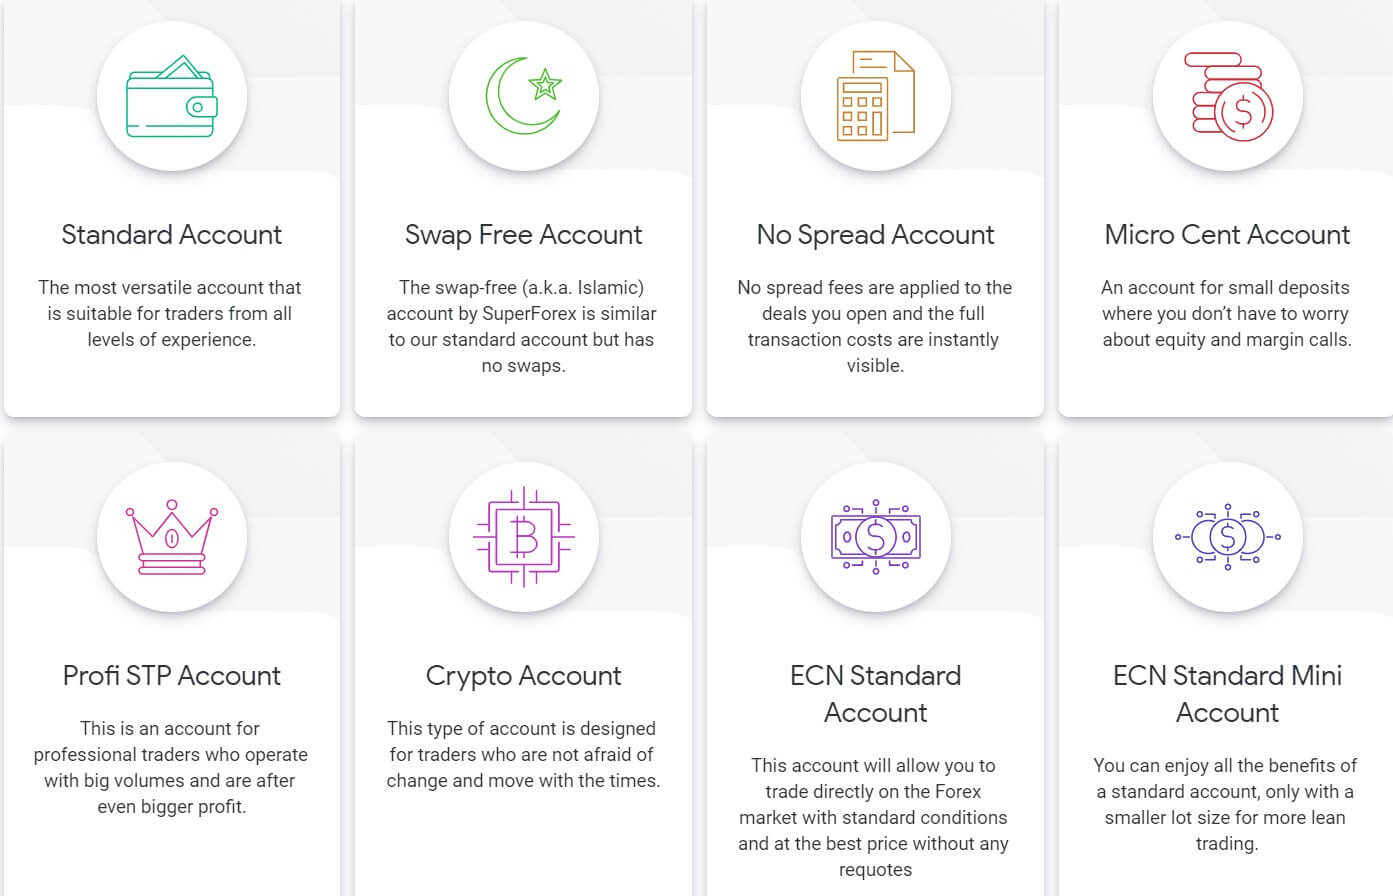
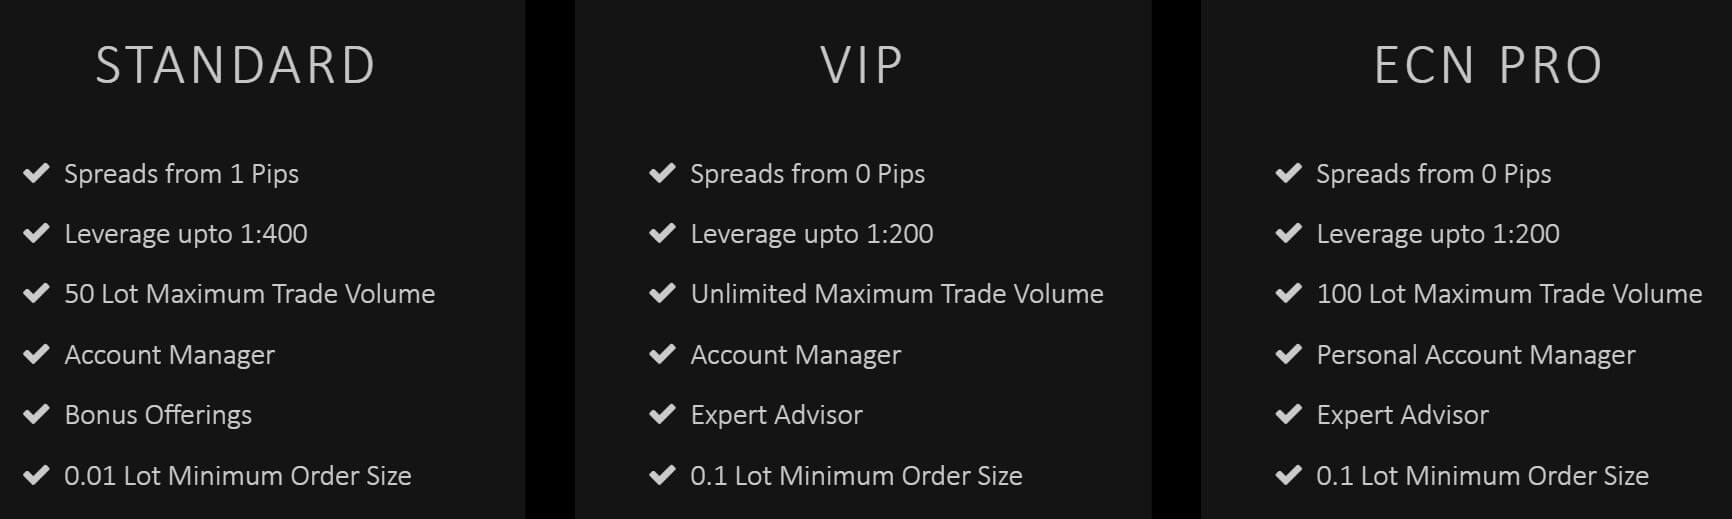
 1:1000: STP Standard, STP Swap Free, STP No Spread, STP Micro Cent, ECN Standard, ECN Standard Mini, ECN Swap Free, ECN Swap-Free Mini
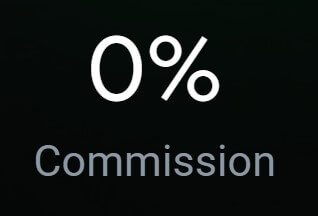 The majority of accounts do not have any added trading commissions, the STP No Spread account has an added commission of 0.038 and 0.062 depending on the instrument. The rest of the accounts do not seem to have any according to the product specifications.
 Forex:
 There are plenty of ways to deposit, the good news is that there are no added fees, however, you should contact your own bank or processor to see if they will add any fees of their own. Bank Wire Transfer, Visa/MasterCard, China UnionPay, Skrill, Sticpay, Neteller, PayCo, Triv, FasaPay, Perfect Money, Payeer, OnlineNaira, iPay, FlutterWave, Cryptocurrencies, and local payments are all available to use.


 Educational & Trading Tools

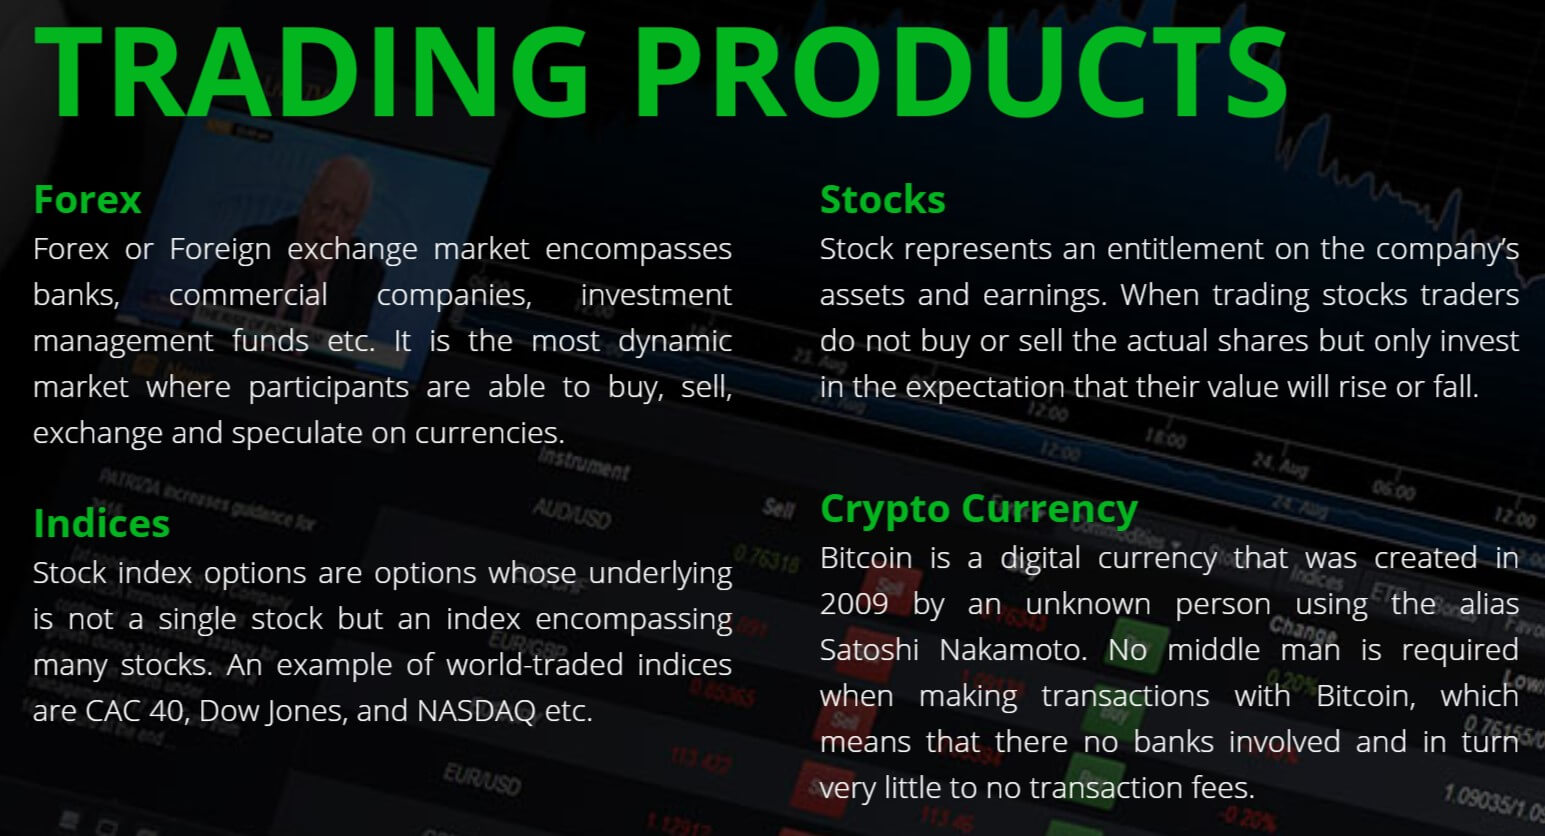
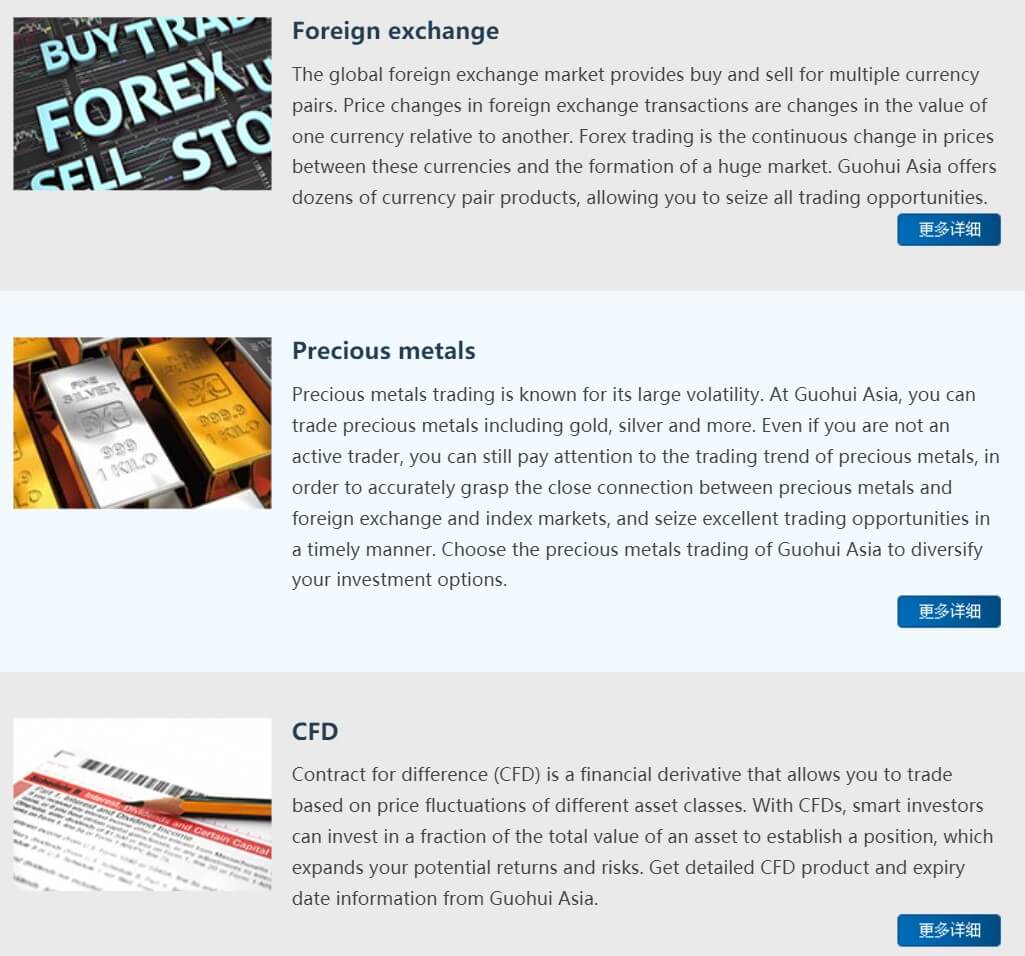
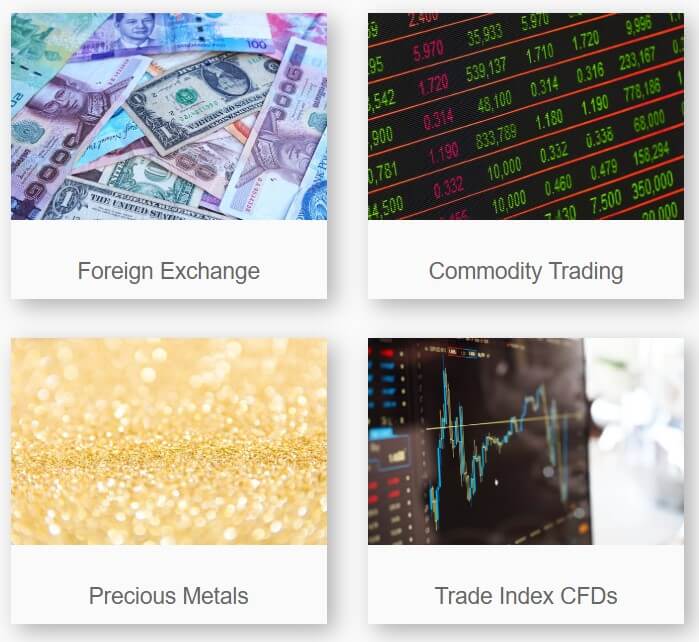
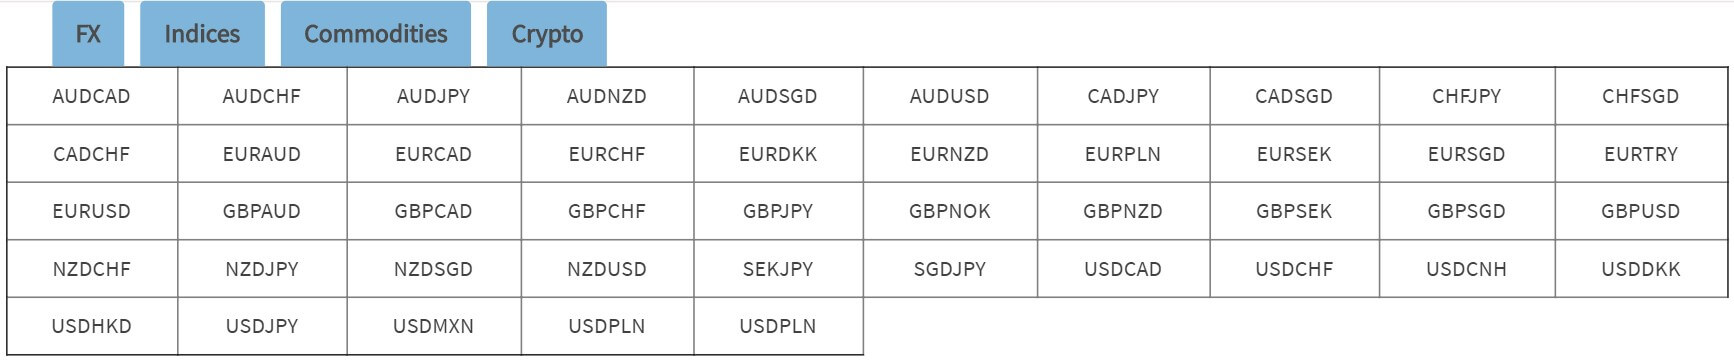
 Assets


 MetaTrader 4 is the available trading platform, released by MetaQuotes in 2005, MT4
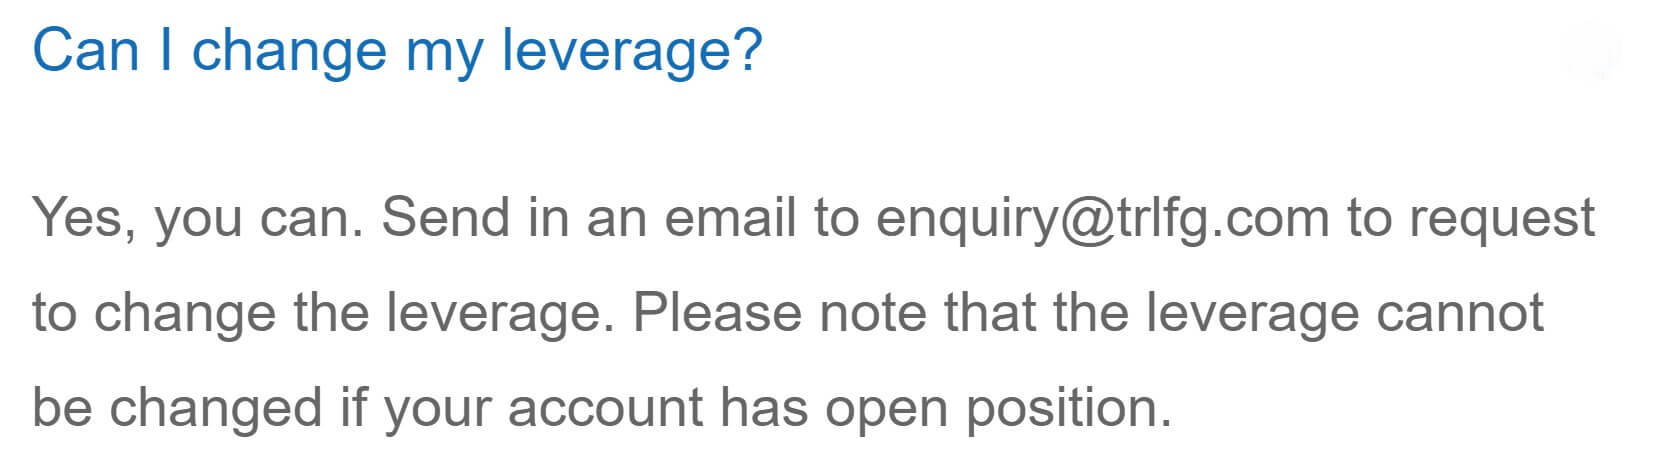


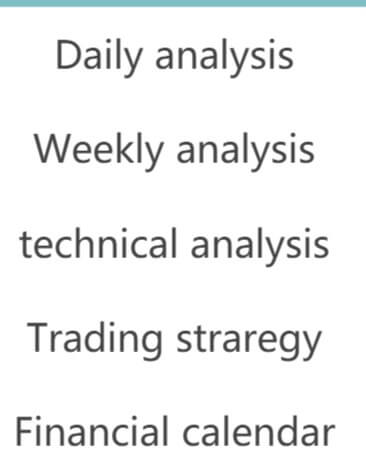
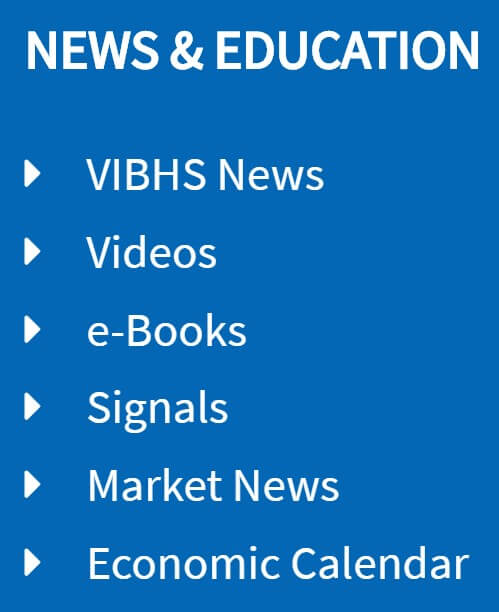 The news and education side of the site is a little sparse, there is just the one page which is for news events, unfortunately, it does not look like the page has been updated since February 2019, so we do not a thin kit is still being actively used.


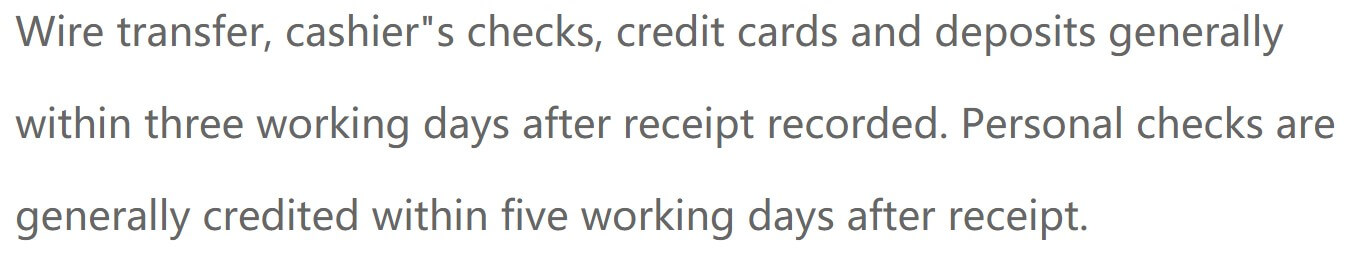
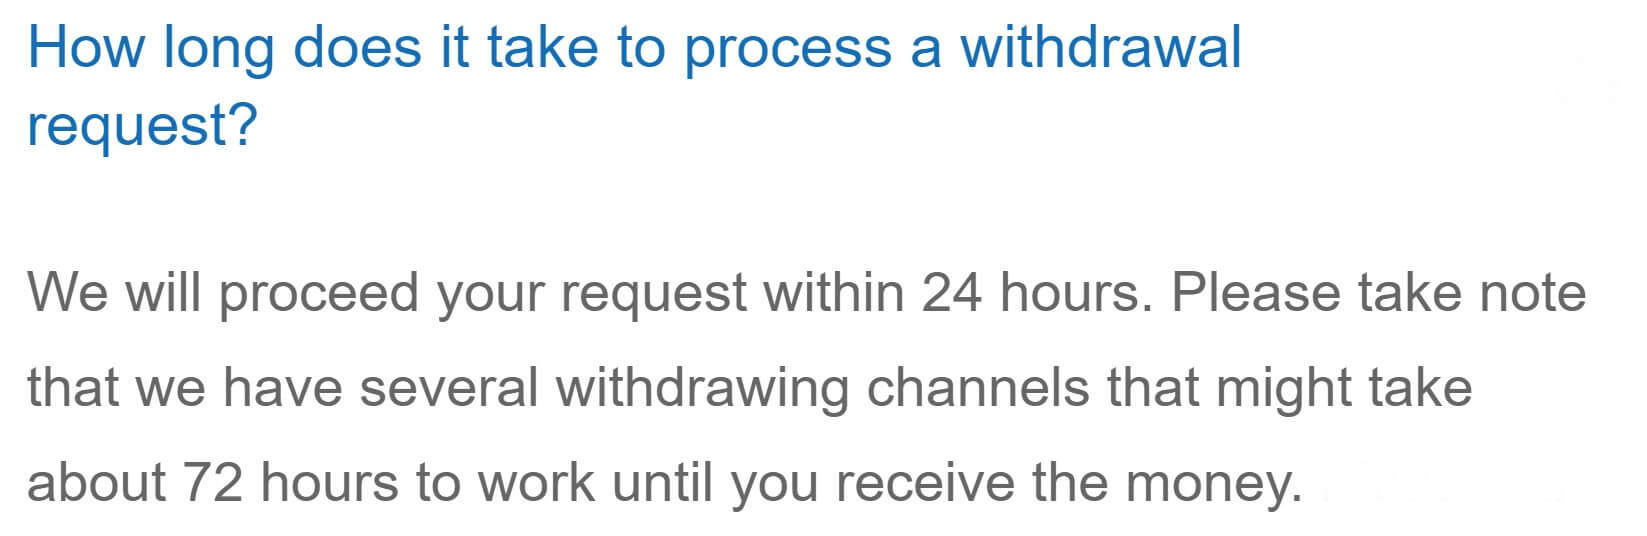
 Withdrawal Processing & Wait Time