.Speculative Sentiment Index Index (SSI)
In this presentation, we will be looking at the speculative sentiment index and its significance in the forex market. If you have been researching some of the technical indicators that Traders use, such as the stochastic oscillator or perhaps the Bollinger bands or MACD, you will realize that the majority of them are lagging indicators. That is to say that the data they imprint on our computer screens are based on the previous or historical data, which it uses to plot the various graphs, moving averages and plot lines onto our charts.
Although this information, when carefully analyzed, helps us to determine to a great degree the potential future movements of price action, the very nature of such lagging indicators does not necessarily tell us what is happening at this very moment in time. Whereas price action, which is itself one of the only few leading indicators of price direction, does.
Although this does limit our trading ability to a certain extent, professional traders learn to marry the two together in order to tip the scales in their favor when it comes to pulling the trigger on trades.
Of course, the absolute perfect solution would be if we all traded the same way at the same time. This would be a perfect solution, but of course, it does not happen like this, because of the many different time frames being traded and the many different types of traders, from scalpers to intraday and swing to long term traders. But what if we could take a snapshot of what other traders are doing at any given time, and if we knew what they were doing, and if we could see statistically whether they were more long or more short on a particular pair, this would give us an added advantage, would it not?
This is exactly where the speculative sentiment index comes into play. It should be considered as a leading indicator, along with price action, and incorporated with your other technical tools to help you decide when to trade. So let’s take a look at how it works.

Example A, The speculative sentiment index or SSI is the accumulative trading positions data, which is captured in real-time by various brokers, as there is no central exchange.
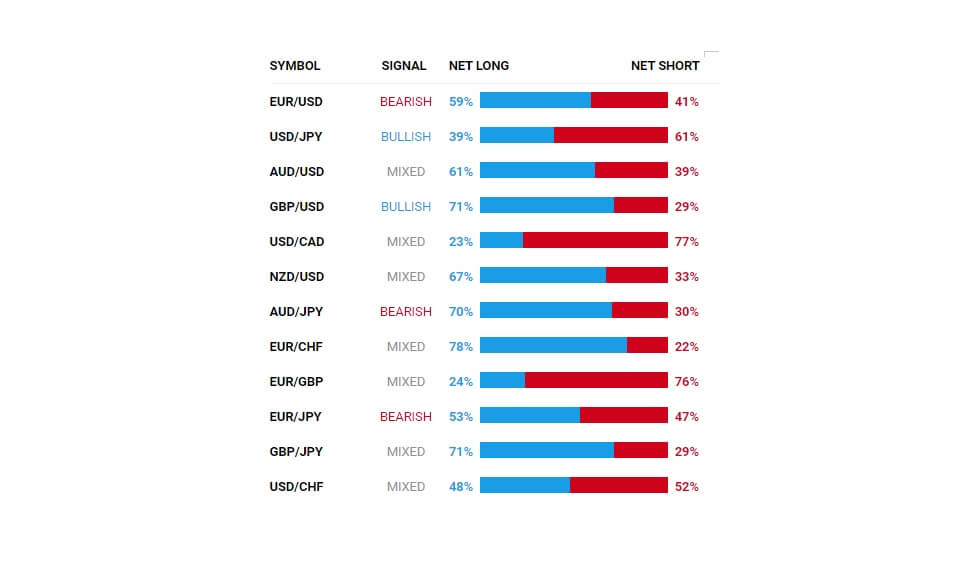
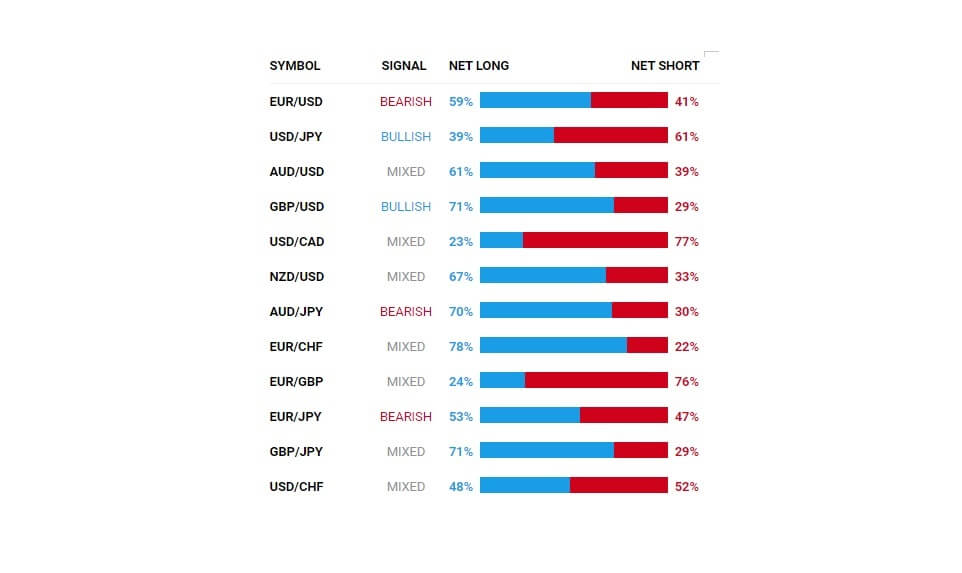
Example B, The broker will then filter the information and offer it in graph format where each pair tells traders whether there are more buyers than sellers or vice versa. The information is provided as a ratio between the two groups.
Example C, If we know that there are more buyers or sellers on a particular currency pair that we are interested in trading, it can help to influence us either to take the trade or maybe even to wait on the sidelines. But one of the problems with the SSI is that the information will very likely differ from broker to broker, and from time frame to time frame, in which case it might be advisable for you to check two or three SSi’s on various brokers to help give you a clearer overall picture of which way price action is leaning.
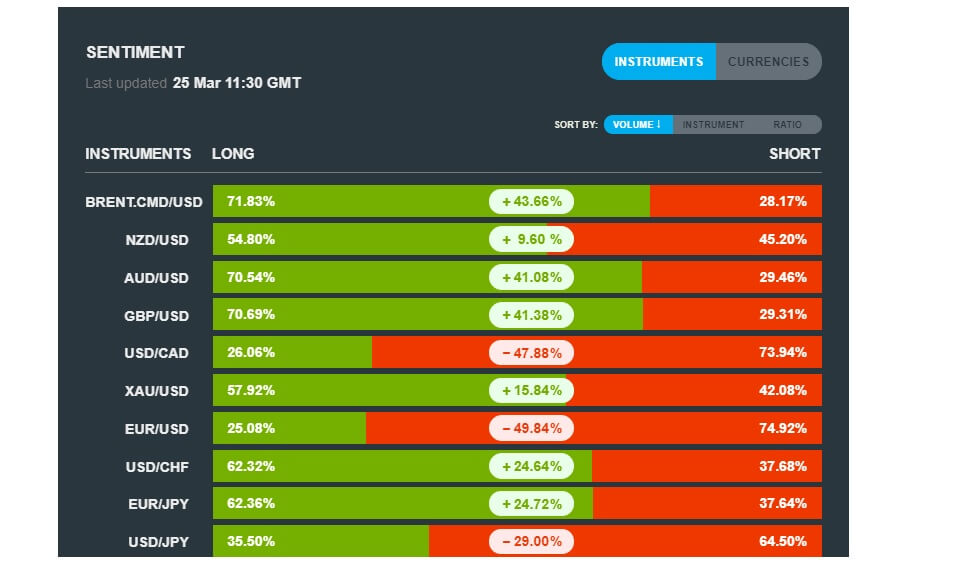
Example D, Some SSiI’s provide more information than others. For example, you might expect to see the positioning, including the ratio of long to short.
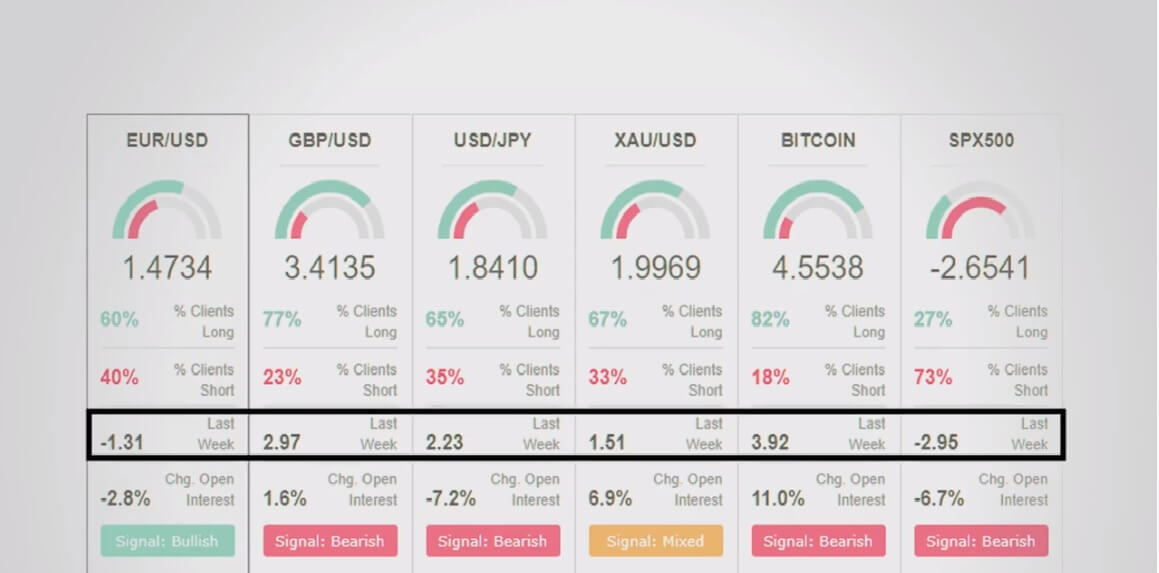
Example E, The open interest
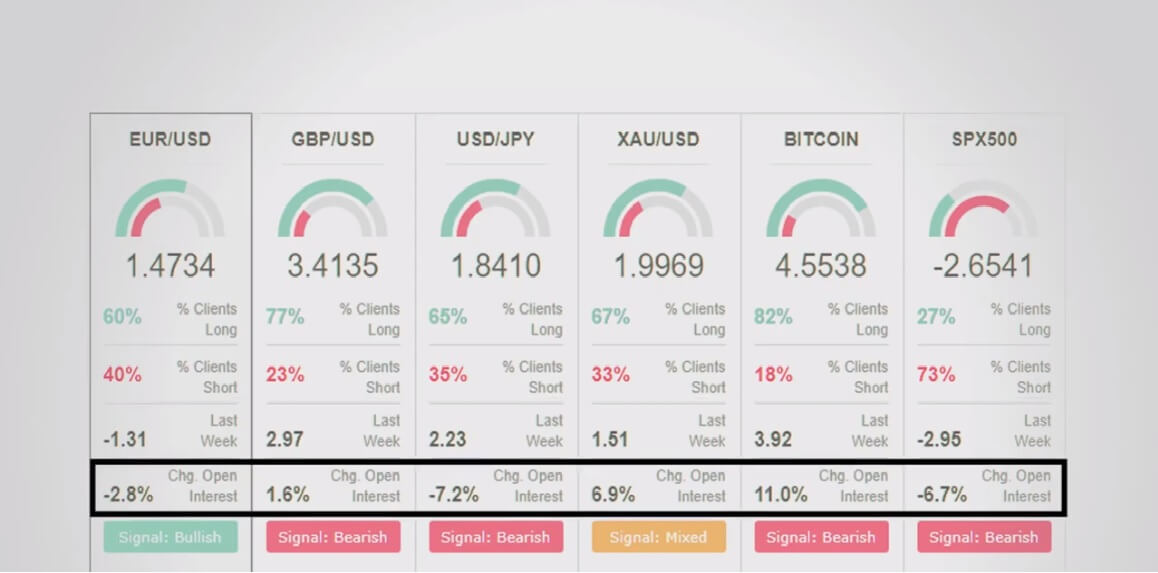
Example F, And the change between long and short positions
The more information, the better your decision-making processes will be.

Example G, Next we are going to look at how to use the SSI.
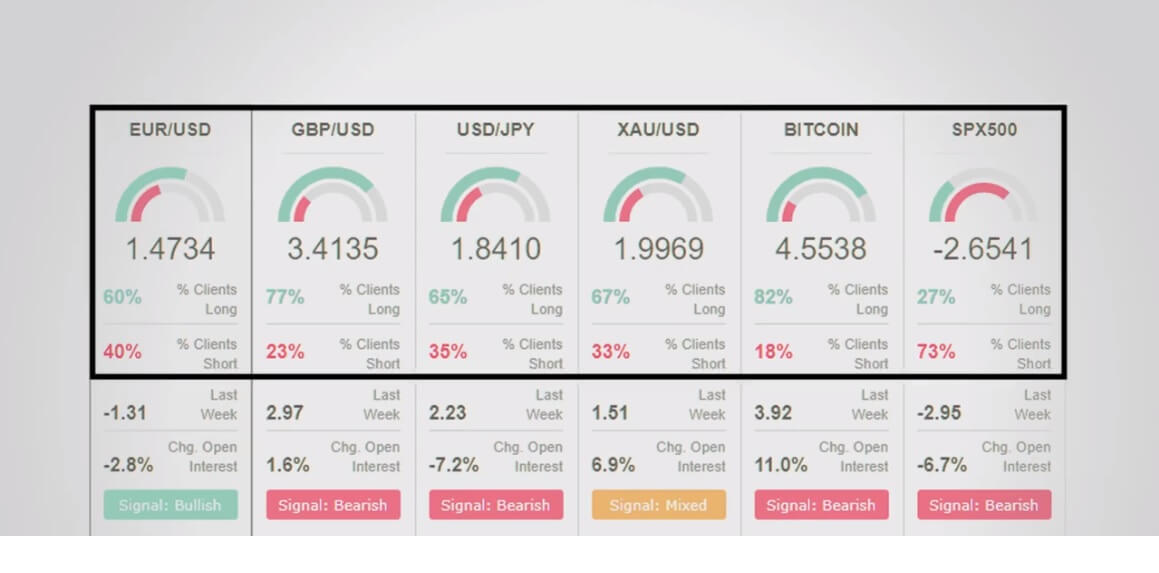
Example H, The positioning statement is one of the most utilized aspects of the SSI report.
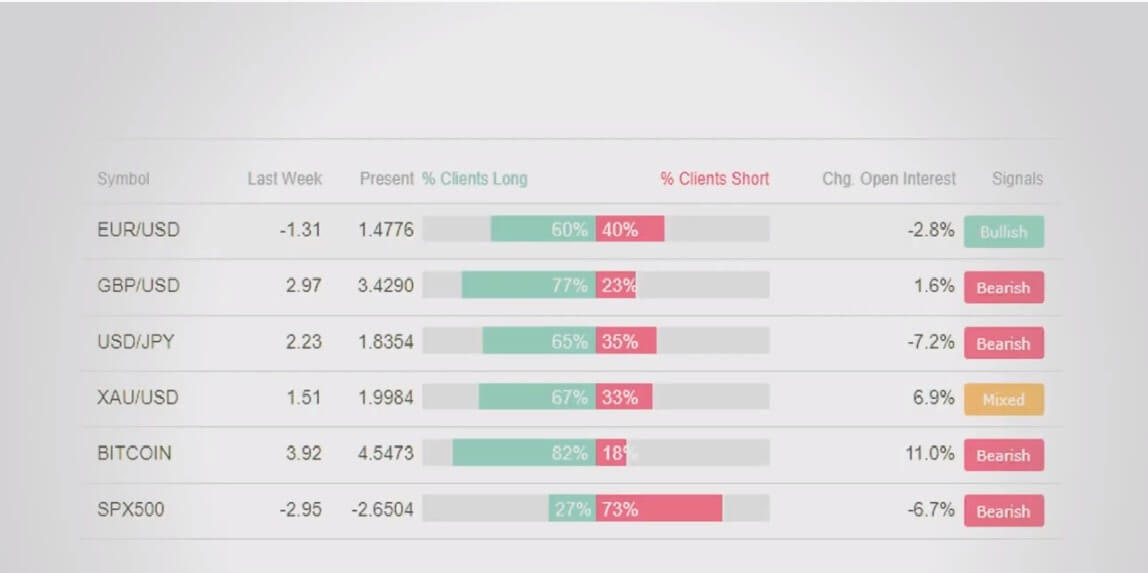
Example I, Here we can see the numbers of traders who are long or short on a pair, and in this example, we can see that this broker offers the change in open interest, which is currently – 2.8% for the EURUSD pair. So for every one trader that is holding a long trade in this pair, there are 2.81 traders who are holding short positions. Any position that shows a minus in front of the number represents the number of short positions, while readings that are above zero represent the number of traders who are net long in the pair.
Although the SSI is a leading indicator, it is considered to be contrarian, that is to say, that the information that is supplied by the broker should be used to trade against the retail traders with currently open positions.
Example I, The rationale behind the contrarian aspect of this indicator using the 2.8% of EURUSD traders as an example who are short, means that eventually, the sellers will need to close those positions – by buying the pair to exit and because we know there is only one buyer for every 2.8 sellers, this position will eventually turn as the sellers close out their traders and leave a buying void behind them. And the opposite would apply if there were more buyers than sellers. To maximize the reversal potential of this indicator, it is advised to use it when there is a high ratio of change between the buyers and sellers.
Please remember to check SSI’s on a regular basis because some of them will be updated by the broker on a daily time frame basis, whereas some will update them once an hour or even every 20 minutes. It is important that if you decide to use this information to trade that it is as up-to-date as possible. Only then will it help you to determine whether a particular currency pair is bullish or bearish.