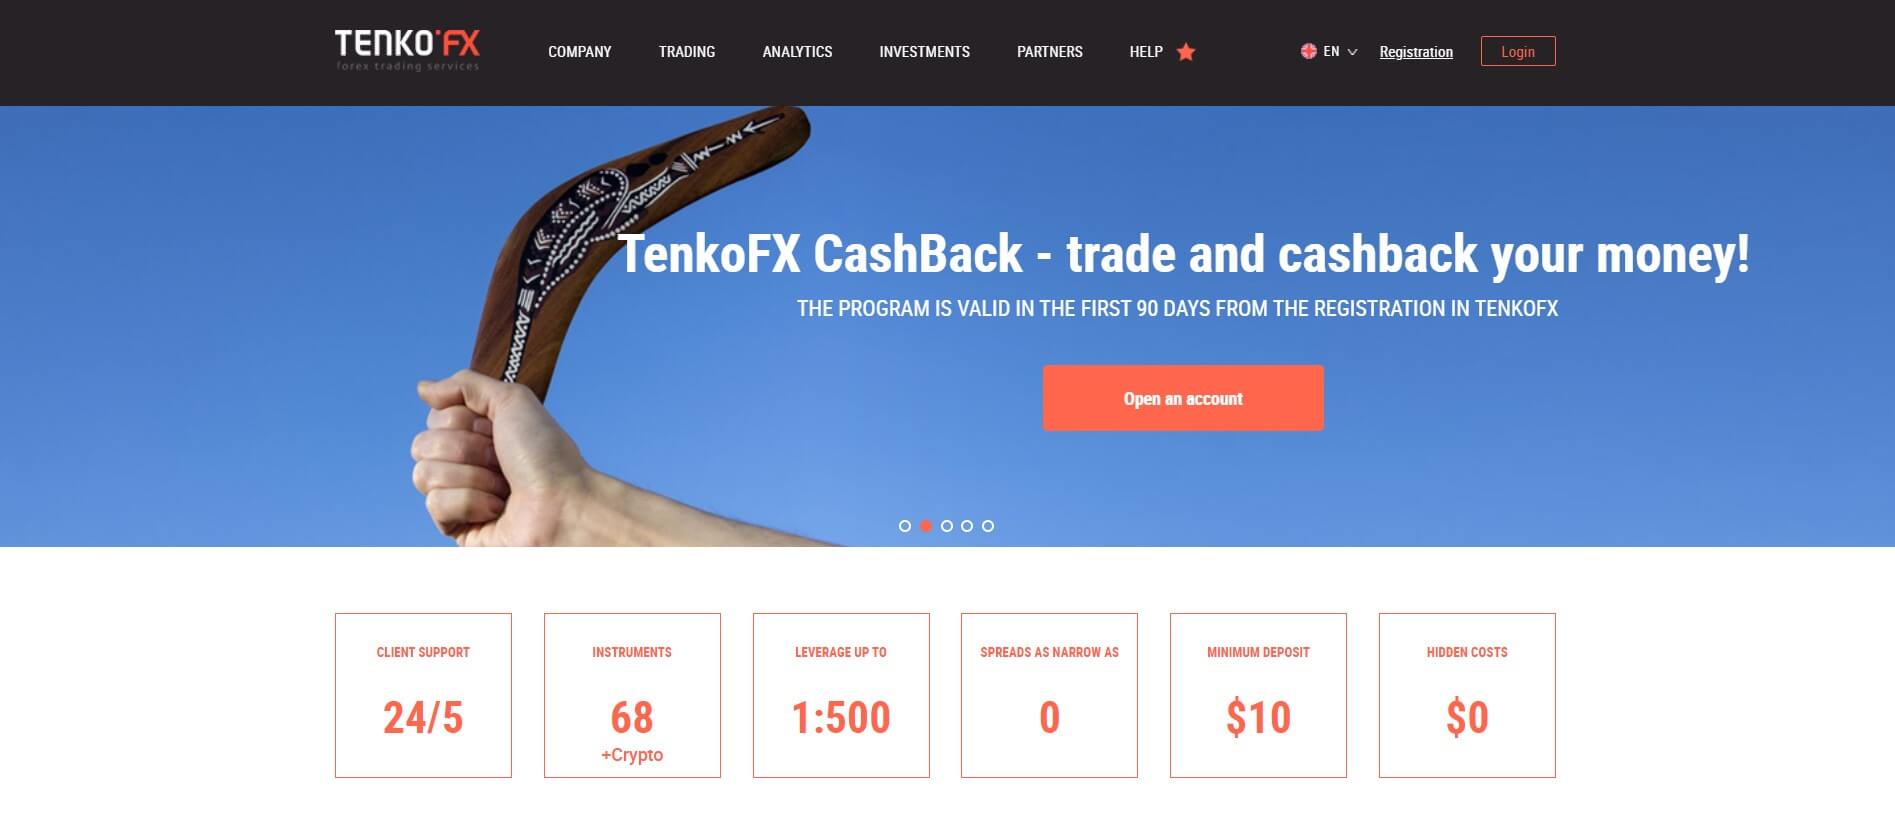
TenkoFX (Tenko Systems Limited) is an online forex exchange broker that describes themselves as being clear, transparent, and strictly regulated. Since 2012, the company has been offering leveraged trading as high as 1:500 on FX, CFDs, and cryptocurrency pairs, all while under the regulatory oversight of the International Financial Services Commission of Belize.
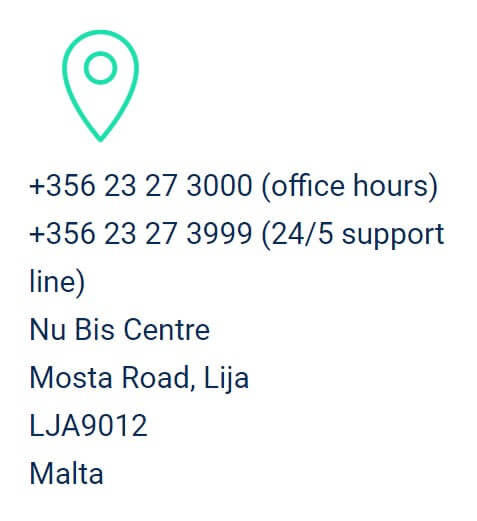
The company appears to be located in Nevis, although a UK-based phone number is provided. From three separate live account types, TenkoFX offers separate conditions, including one’s access to certain instruments, leverage options, and commission-rates. If you’re interested in opening an account, stay with us to find out more about the STP, ECN, and Crypto accounts, along with other need-to-know facts.
Account Types
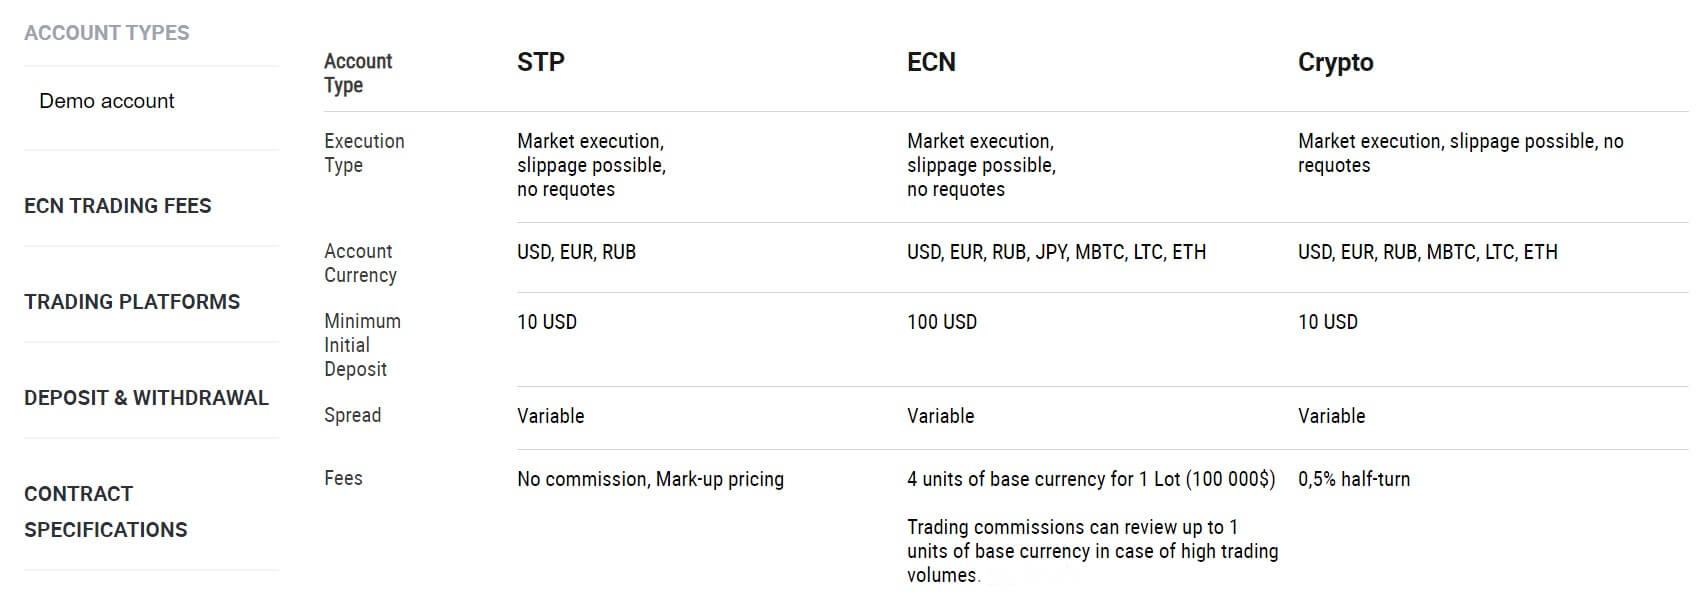
TenkoFX offers three live accounts; STP, ECN, and Crypto. Swap-free Islamic accounts are available in STP and ECN versions. It costs between $10 and $100 USD to open an account, so traders should not be limited based on affordability. One of the biggest differences between accounts would be the tradable instruments that are available.
STP & ECN accounts offer access to currency pairs with additional CFDs on the ECN account. The Crypto account features 29 crypto pairs. Leverage options and stop out levels are also dependent upon the account type, STP account holders will have access to the highest leverage cap of 1:500. The website doesn’t advertise spreads clearly, but options seem to be tight, according to our research.
Commissions also play a factor that will affect the cost of trading. The ECN account offers lower commission charges to those with high equity and trading volume, with higher charges for those that cannot maintain the more significant requirements, so we would only recommend the account to those that can keep the better conditions. The remaining accounts offer reasonable commission rates, although the broker isn’t completely transparent about the STP account’s fees on the website. Account details have been provided below.
STP Account (Islamic accounts available)
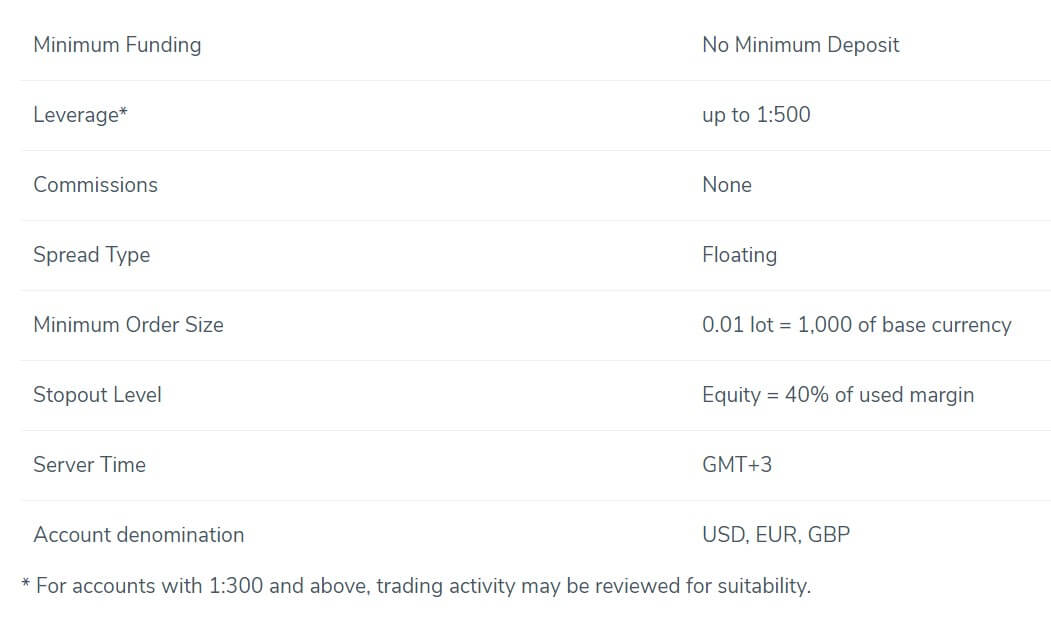
Minimum Deposit: $10 USD
Leverage: Up to 1:500
Spread: Variable (See “Spreads”)
Commission: $2 per 1 lot traded
Assets: Currencies & metals
ECN Account (Islamic accounts available)
Minimum Deposit: $100 USD
Leverage: Up to 1:200
Spread: Variable (See “Spreads”)
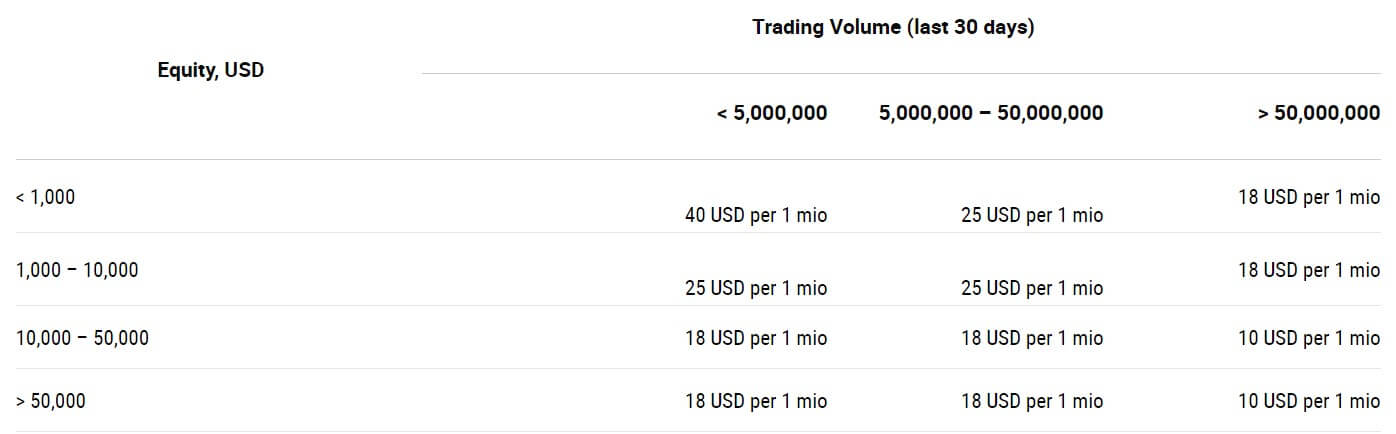
Commission: $10 – $40 USD per 1 mio (depending on equity & trading volume every 30-day period)
Assets: Currencies, Metals, CFDs
Crypto Account
Minimum Deposit: $10 USD
Leverage: 1:3
Spread: Variable (See “Spreads”)
Commission: 0.5% half-turn
Assets: 29 cryptocurrency pairs
Platform
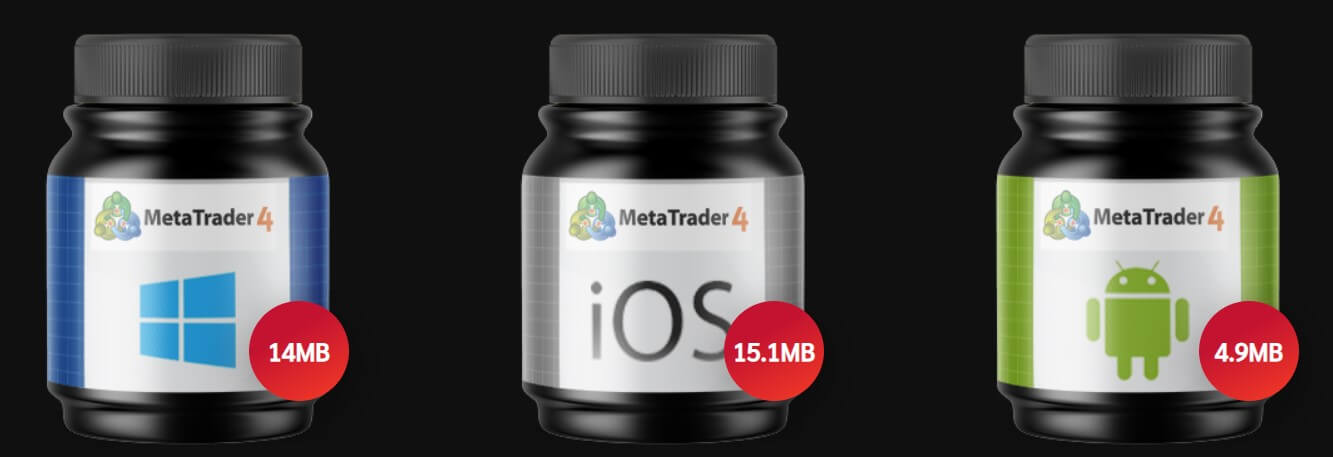
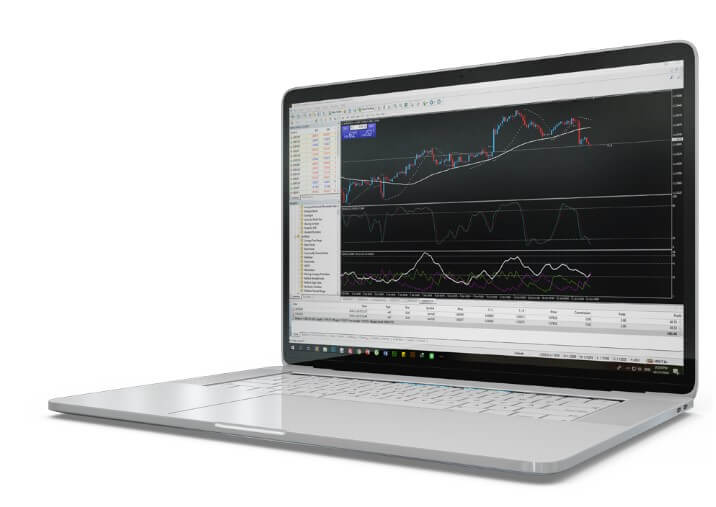
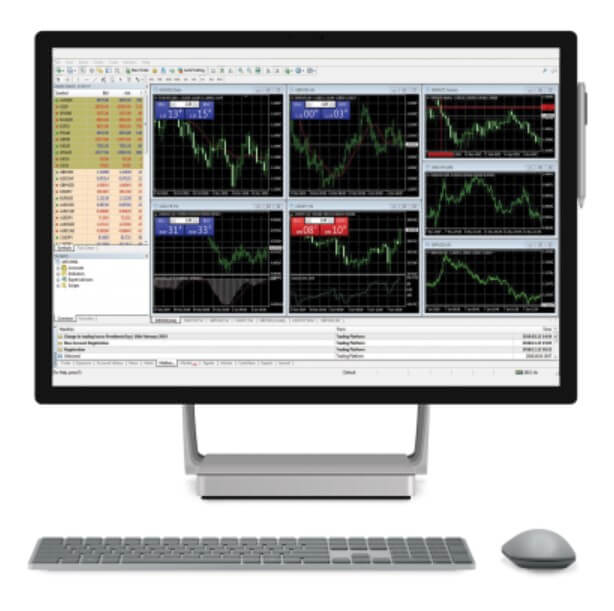
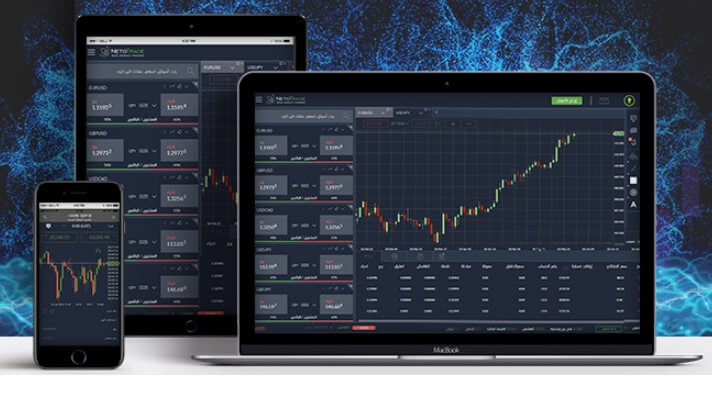
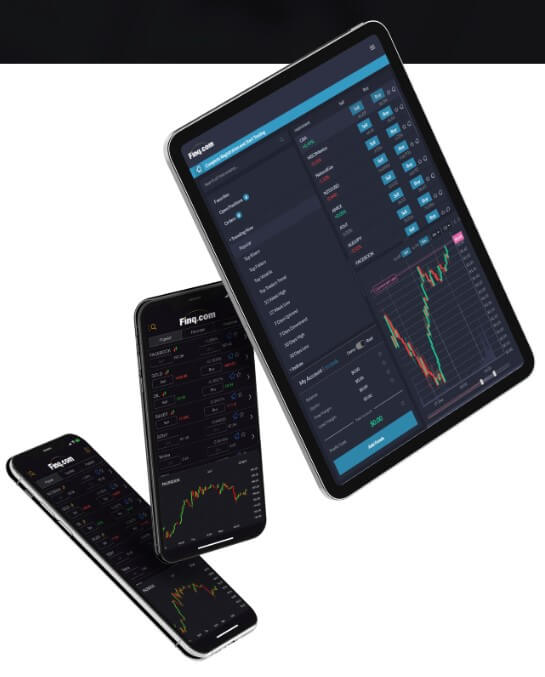
Every trader that opens an account through TenkoFX will have the advantage of trading from the highly popular MetaTrader 4 platform. MT4 was designed as a powerful, all-in-one option that is highly flexible and navigable. The platform provides a wide range of technical analysis tools while allowing one to execute trades efficiently, generate trading signals, and program MQL-based trading algorithms. Available on desktop, mobile, and through the web-browser, MT4 is also an accessible option that supports trading on the go from various devices, including iPod/iPad/tablets.
The platform allows all types of orders while providing a newsfeed and a wide range of analytical tools. The broker’s website offers the program download directly under “Trading” > “Trading Platform”. MT4 can also be found within the App Store and Google Play Store.
Leverage
 On the STP and ECN accounts, available leverage options depend on the account’s equity. The STP account offers a maximum cap of 1:500 on accounts holding up to $25,000 in equity, 1:200 on equity up to $100,000, and 1:100 for amounts up to $1,000,000. The ECN lowers the limits to 1:200 on accounts holding up to $100,000 and 1:100 for equity up to $1,000,000. Amounts over $1 million are negotiable. The Crypto account offers a leverage ratio of 1:3, which is expected for an account that focuses on trading volatile cryptocurrencies.
Trade Sizes
A minimum trade size of one micro lot (0.01) is supported on currencies and crypto pairs, while one mini lot (0.1) is required when trading indices. The broker offers a sufficient maximum trade size of 1,000 lots. The STP account allows for 100 orders to be open simultaneously, while the amount is unlimited on the ECN account. Scalping, algorithm-trading, and news trading are all allowed. Hedging is available with 50% margin release. Margin call occurs at 50% on the STP account, 100% on the ECN account, and 30% on the Crypto account.
Trading Costs
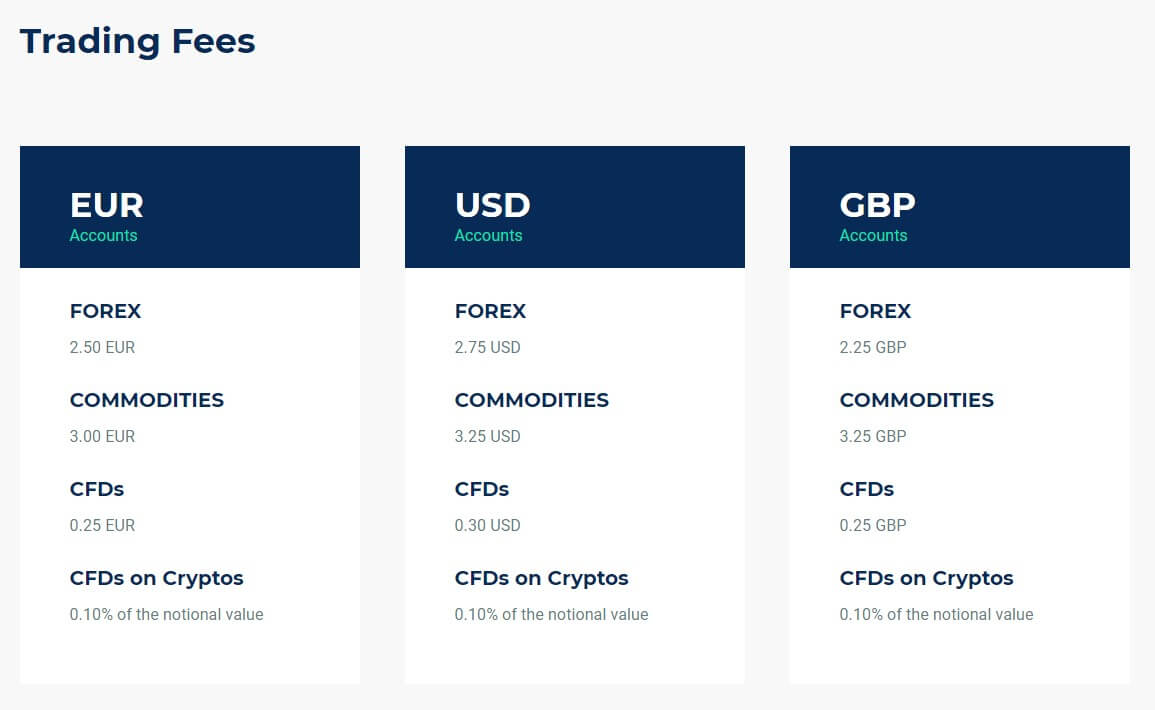
TenkoFX charges account holders through spreads, commissions, and swaps. Commission fees depend on the chosen account type. There is no markup on the STP account, but information suggests a $2 fee per 1 lot traded while a 0.5% half-turn fee is applied on the Crypto account. The ECN account maintains a schedule that depends on the account’s equity and trading volume for the previous 30 days.
Fees range from $10 – $40 USD round turn per 1 mio. Equity of $10K to $50K or more, plus a trading volume of 50,000,000 equals the lowest $10 charge. Equity of less than $1K with less than 5,000,000 trading volume results in the largest $40 fee. Other charges can fall into an $18 – 25 range, depending on the equity and volume, and the entire chart can be viewed under “ECN Trading Fees”.
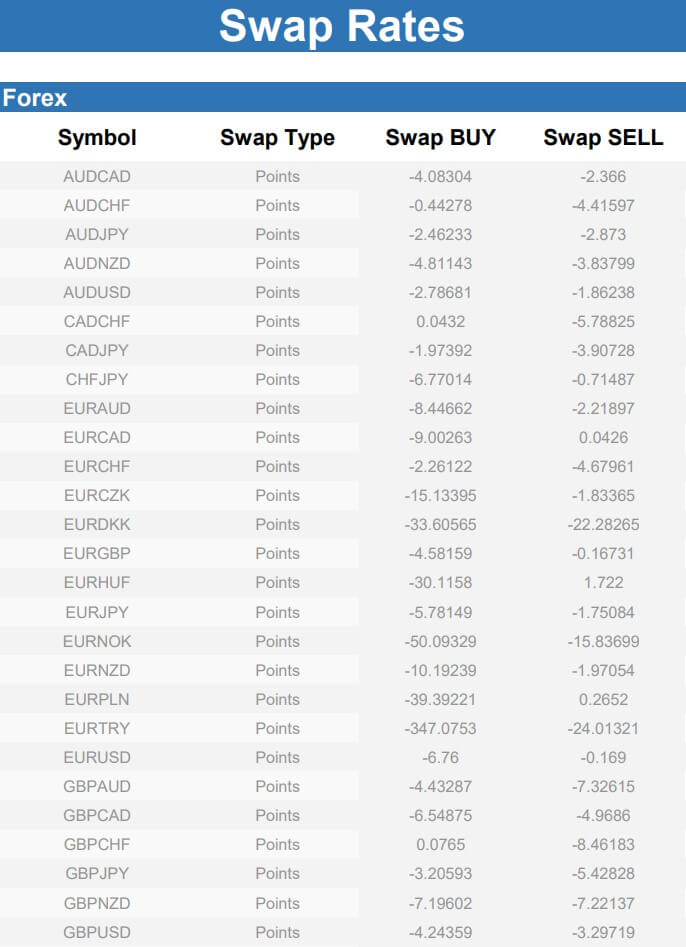
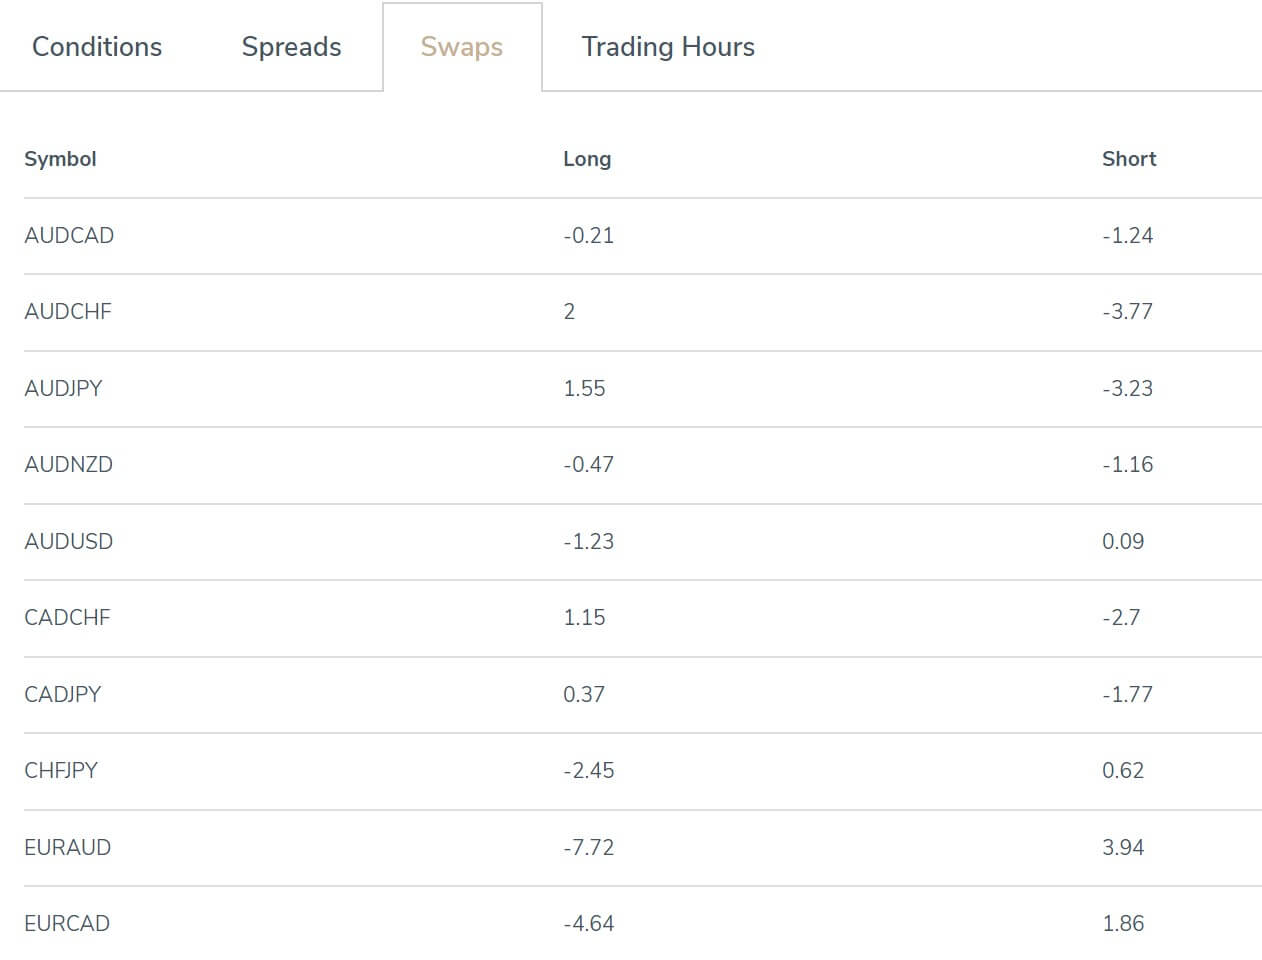
Overnight interest charges also apply, unless one is trading from an Islamic account, which is available in STP and ECN versions. Swap rates can be viewed on the website under “Contract Specifications”. Triple charges apply on Wednesdays. The broker applies a monthly $10 fee to accounts that have been deemed inactive, with charges occurring until trading activity resumes or the entire balance is depleted.
Assets
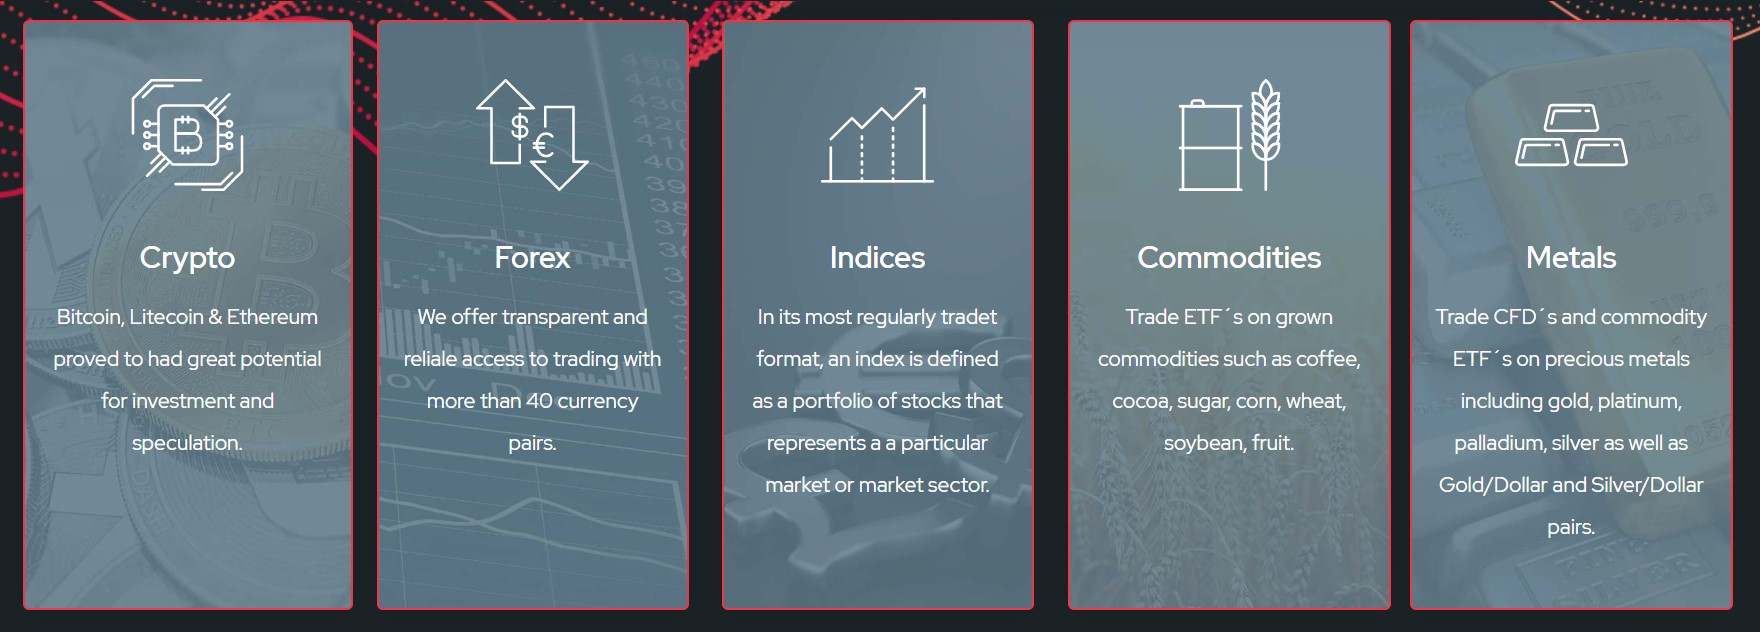
 TenkoFX offers different instruments based on an account type; STP and ECN account holders have access to 58 currency pairs, which provides a wide variety of choices in majors, minors, and exotics. Metals are also available, with additional CFDs offered on ECN accounts. The Crypto account features 29 currency pairs, including BTC (Bitcoin), LTC (Litecoin), ETH (Ethereum), BCH (Bitcoin Cash), DSH (Digital Cash), ETC, and XRP. The broker allows more than one account to be opened, so a trader could open a Crypto account in addition to one of the other accounts to access more instruments.
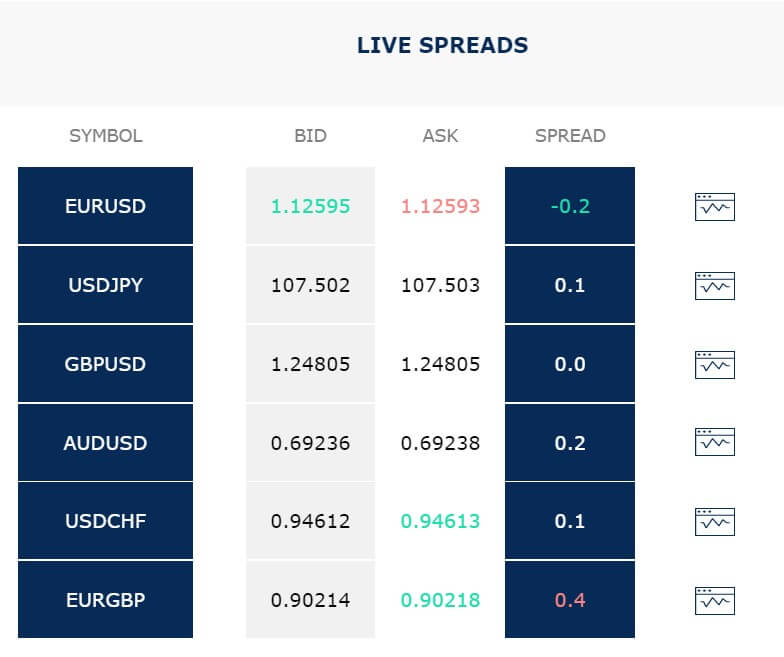
Spreads
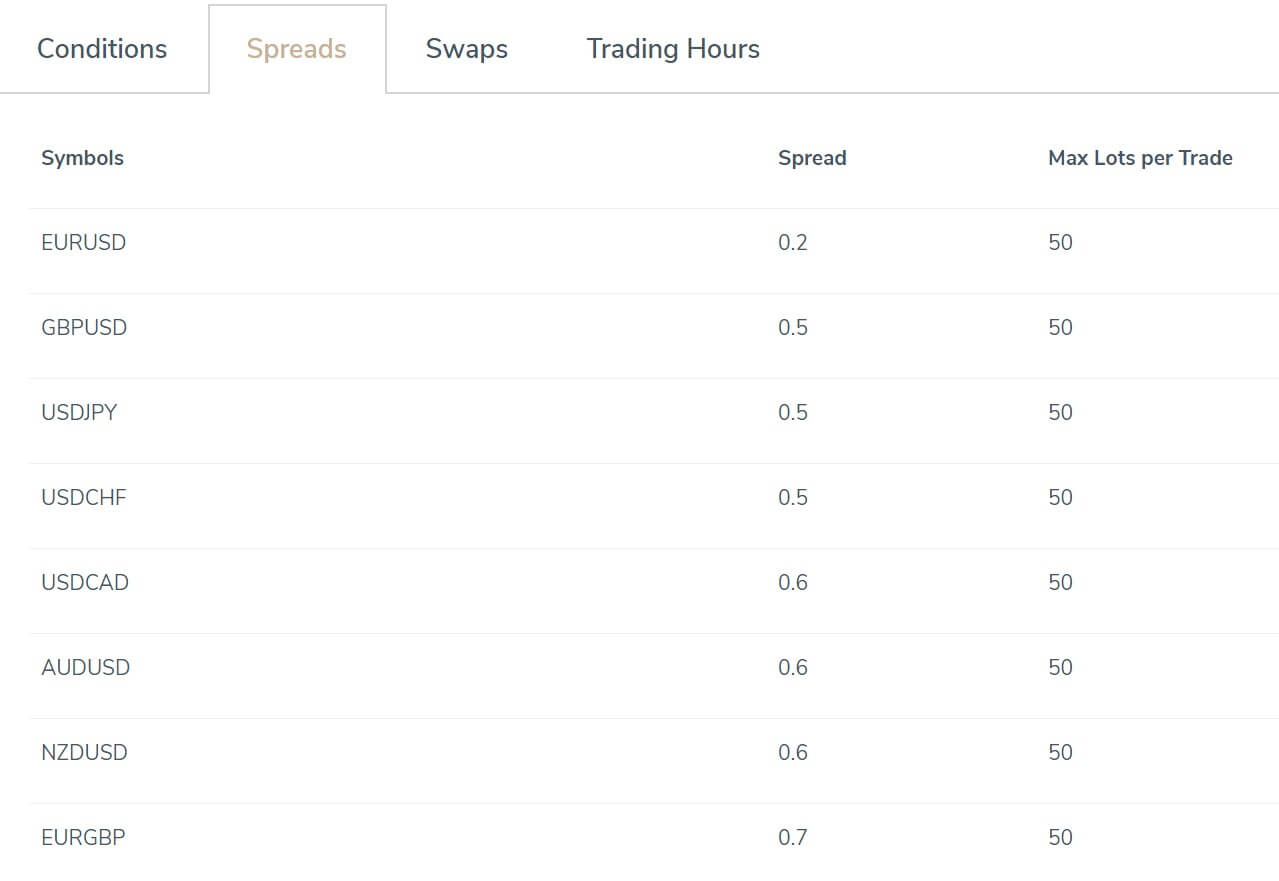
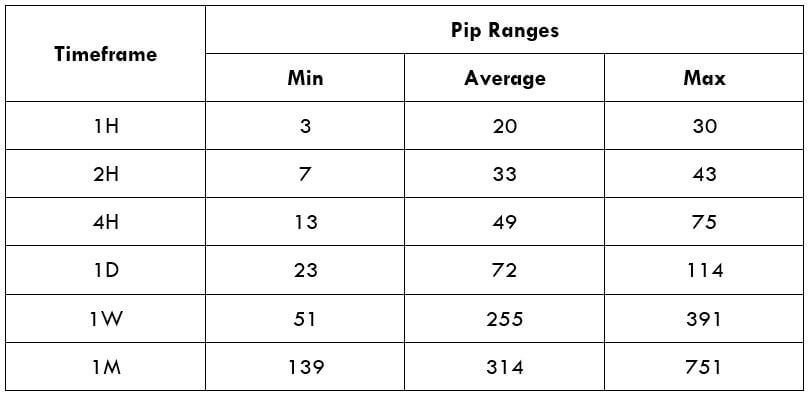
Aside from listing spreads as floating, the website doesn’t clearly detail what types of spreads one would see. After practicing on a demo account and conducting further research, we found that spreads seem to be lower than 1 pip on average. However, the broker states that conditions on the demo account are less reliable due to ongoing testing of new liquidity providers and that open orders can also affect spreads. This makes us less confident in the more competitive spreads we saw on the demo. TenkoFX may manage to bring those better options to traders due to the fact that commissions apply on the various account types, especially at the high rates on the ECN account applied when traders don’t qualify for the high-volume and higher equity discounts.
Minimum Deposit
 TenkoFX accepts deposits as low as $10 on the STP and Crypto accounts while asking for an average $100 USD deposit on their Crypto account. STP accounts can only be funded in USD, EUR, and RUB. ECN and Crypto accounts also accept deposits in MBTC, LTC, and ETH. The ECN account is the only account to accept JPY-based currency.
Even though some brokers have done away with requirements, the broker manages to keep their entry-level amounts at a threshold that is accessible to all traders, and there’s really no reason to deposit less than $10 regardless, otherwise, one’s trading options would be very limited. If one compares this broker’s ECN account type to others, then one would see requirements in the thousands elsewhere. The lower requirements should make it possible for traders to open the account of their choosing without being restricted based on price.
Deposit Methods & Costs
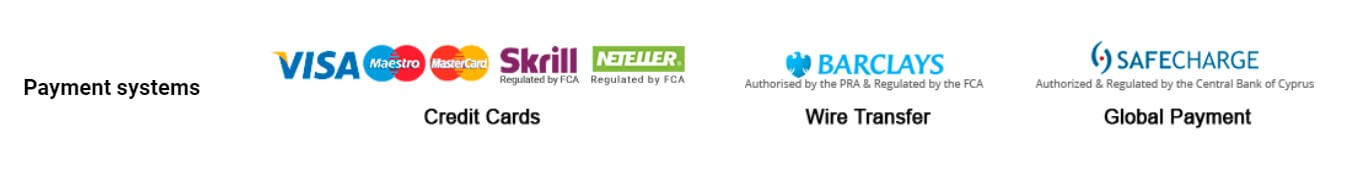
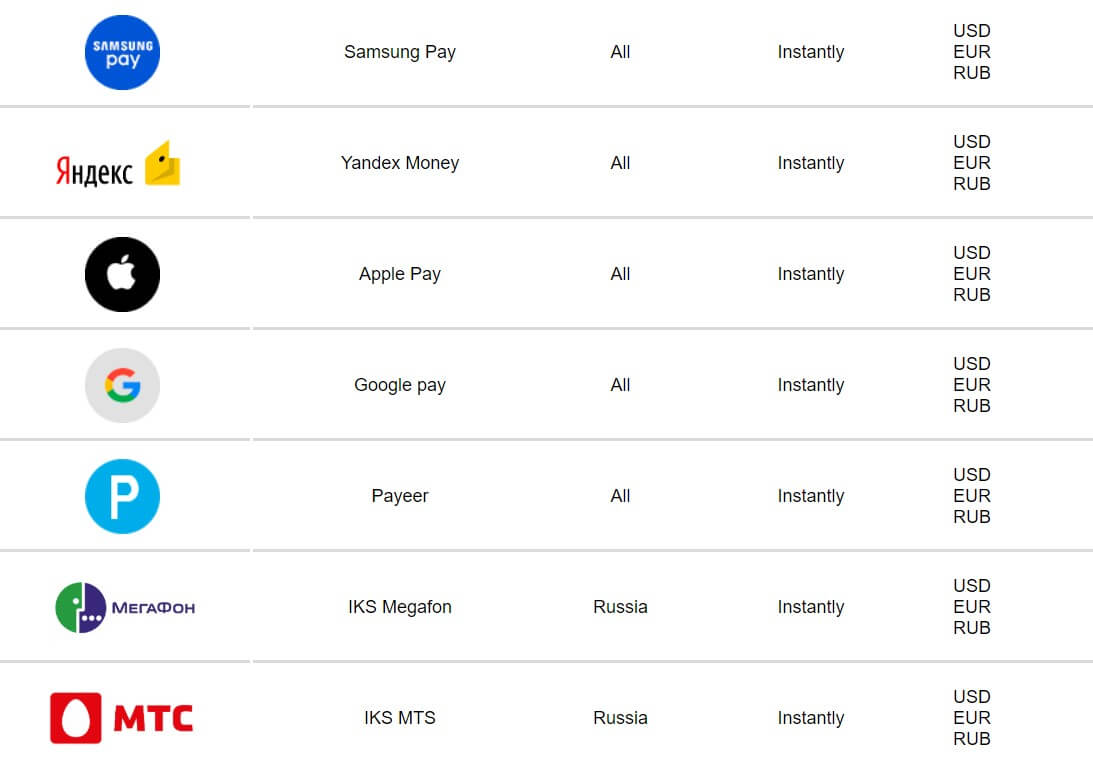
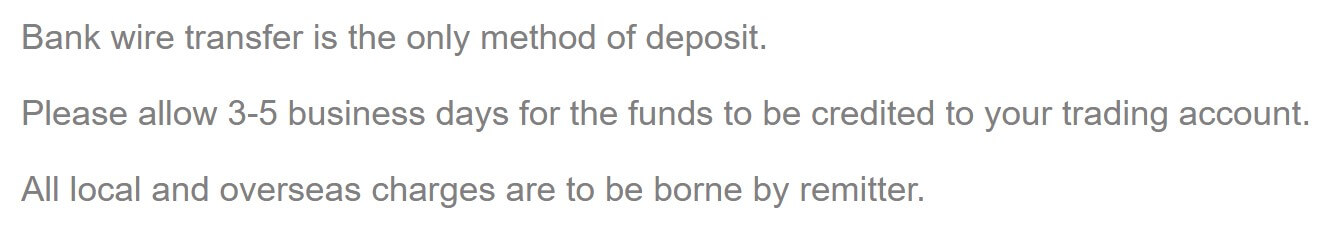
The broker provides a wide range of deposit options, including bank wire transfer, Visa/MasterCard, and China UnionPay, along with e-wallets Neteller, Skrill, QIQI, FasaPay, AdvCash, and PerfectMoney, plus additional cryptocurrency options Bitcoin, Ethereum, Litecoin, and Tether. Aside from bank wire, which has a 24-hour processing time, all deposits are credited instantly. Note that some of the funding methods are not available for all countries and there are a few significant deposit minimums on certain methods.
Bank wire transfer requires a $500 minimum funding amount, China UnionPay requires $1,000, and QIWI asks for $300. The remaining payment providers ask for small deposits of around $1-3. Fee-free deposit methods include all cryptocurrency options, QIWI, and PerfectMoney. Unfortunately, the remaining payment providers do place charges on deposits, and many charge withdrawal fees as well. Applicable deposit fees have been listed below.
- Bank Wire Transfer: Local bank fees (typically range from $25 and up)
- FasaPay: 0.5%
- Visa/MasterCard: 1.5% + 0.5 USD
- Neteller & Skrill: 1.5% + 0.5 USD
- China UnionPay: 2.5%
- AdvCash: 7%
- Withdrawal Methods & Costs
All of the deposit options are available for withdrawal, under the condition that withdrawals must be made back to the original payment method. Some of the payment providers require large minimum withdrawal amounts. This is especially true for bank wire, which asks for a $500 minimum withdrawal amount – this will potentially leave large amounts of funds stuck in the account and make it nearly impossible to withdraw profits. Steep fees are also charged on wire withdrawals, including a $45 USD charge. The only fee-free withdrawal methods are Tether and AdvCash. Even though AdvCash does offer free withdrawals, traders should note that the payment provider’s 7% deposit fee still makes it one of the most expensive funding methods available. Withdrawal fees for each of the remaining funding methods has been listed below.
- Bank Wire Transfer: 30 EUR/45 USD/1500 RUB/35 GBP/45 CHF/65 AUD/5,000 JPY
- QIWI & FasaPay: 0% + 0.5 USD
- PerfectMoney: 0.5%
- China UnionPay: 1.2%
- Visa/MasterCard: 1.5%
- Neteller & Skrill: 1.5%
- Bitcoin: 0.001 BTC
- Ethereum: 0.01 ETH
- Litecoin: 0.01 LTC

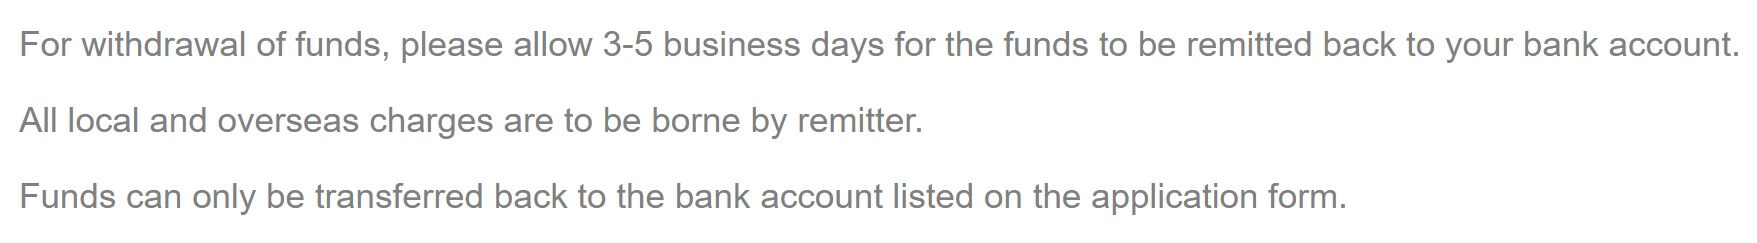
Withdrawal Processing & Wait Time
Withdrawals are processed between 9:00 am and 9:00 pm, GMT+4. Processing is guaranteed to be completed during the advertised processing time for each payment method, which is listed as being within 24 hours. Withdrawal requests made during the weekend will be processed the following Monday. This brings the broker’s processing times down to a relatively quick timeframe when compared to the multiple business days we’ve seen before.
Bonuses & Promotions
Active promotions consist of ECN Gravity, TenkoFX Cashback, The Way of the Samurai, and PAMM Investments. We’ve provided more details for a few of those promotions below.
ECN Gravity: ECN account holders would be given the option to trade for $10 per mln for the first three months the account is open, which equates to a 0.001% (one way) transaction cost. Conditions state that a deposit of at least $1,000 USD must be made to the account. Once the account has been opened and funded, the trader would need to email support to activate the offer.
TenkoFX Cashback: Under this loyalty program, the broker returns funds that were used for trading during the first three months that the account was opened. The broker used a commission multiplier to determine the exact amount of the refund, with $5 being the minimum amount per trade and $100 being the maximum per trade.
The Way of the Samurai: This monthly competition rewards winners (STP & ECN account holders) with a $200 prize. Conditions state that a $100 USD deposit must be made to the account and the goal is to make a steady 10-15% profit every month. Traders can view the countdown timer to the next start date on the broker’s website under “Company” > “Promotions”.
Educational & Trading Tools
Educational resources consist of a training academy that is sorted into beginner and expert levels, a glossary of trading terms that comes with a helpful search bar, and various articles. Granted, the academy section is simply typed information with some pictures, but the broker has put in an amount of effort to attempt to help educate their clients. It’s easy to miss those resources, so one should note that this section of the website can be accessed through the FAQ page.
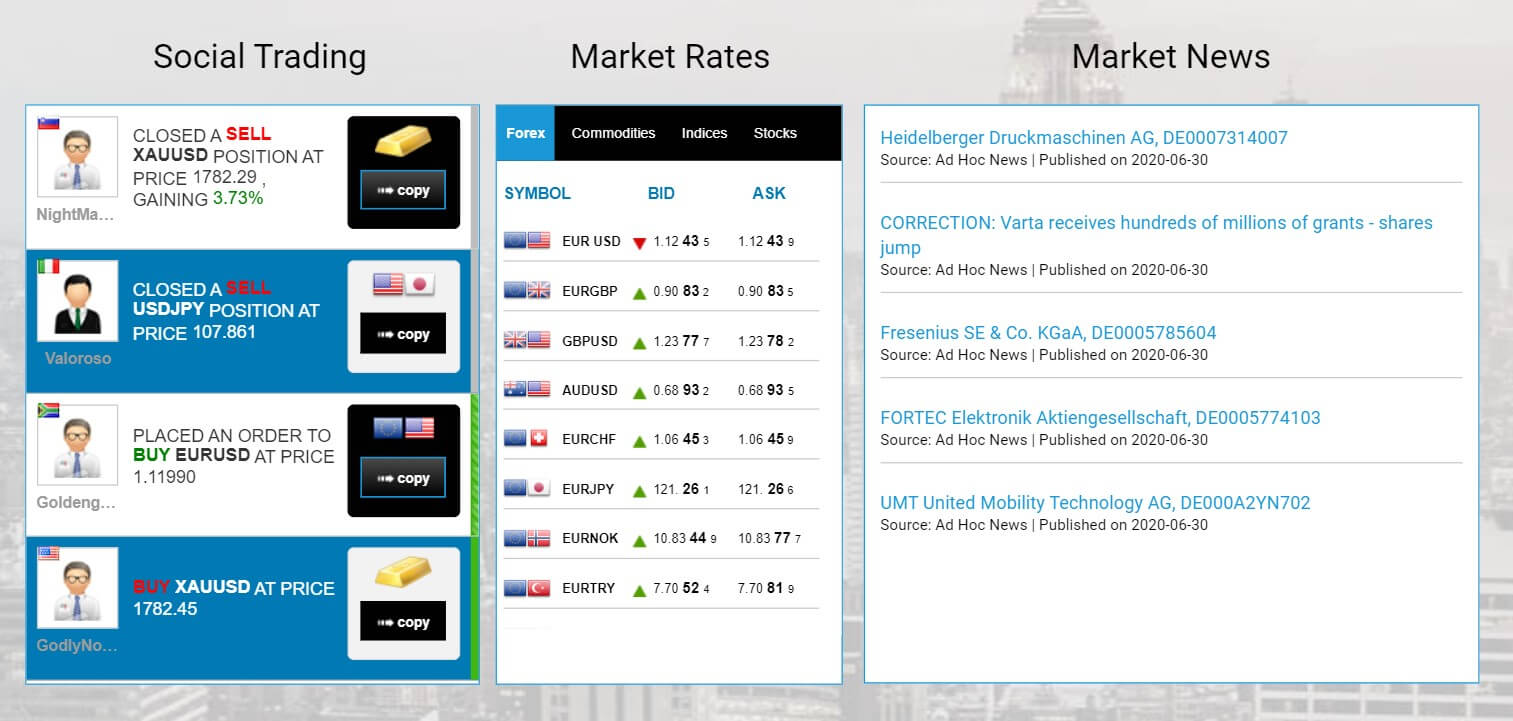
Analytics is also a major theme, the website offers a forex forecast, forex & crypto news, a technical blog, and an economic calendar under that section. AutoTrade is available. Through the service, one can link their TenkoFX account in order to copy trading transactions straight into their trading account. A trader’s calculator is another convenient tool on the website that can help one determine the cost of placing a trade once all factors, like commissions, spread, and so forth have been added together.
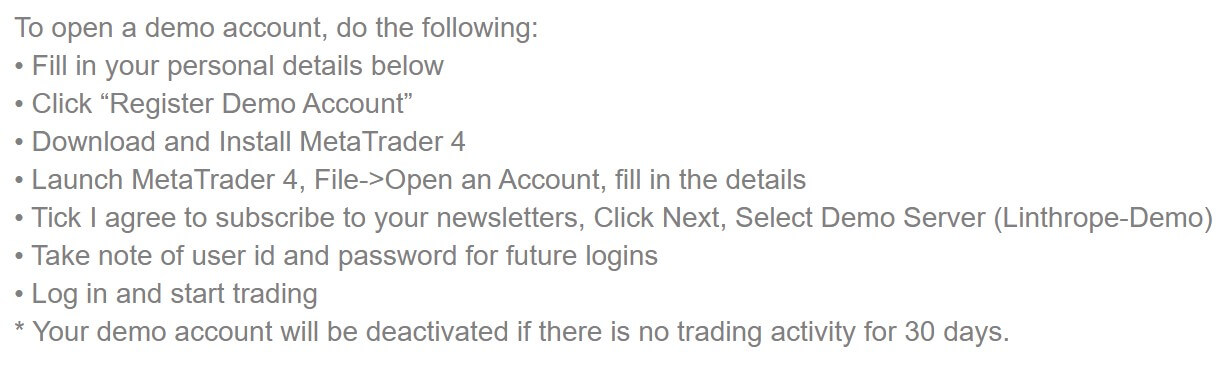
Demo Account
In order to login to a demo account, traders will need to have a Trader Password and use that to login using the following IP address on the MetaTrader 4 platform; mt-demo-01.tenkofx.com:443. The broker mentions that quotes on demo accounts differ from those used on their live accounts, due to the fact that demo accounts are used to test different liquidity providers. This could make one’s experience less realistic. Although the altered quotes don’t take away from the fact that traders can still practice trading in general and on the MT4 platform, it does affect one’s ability to trade under the broker’s conditions, which would be especially helpful considering that information about spreads is vague.
Customer Service
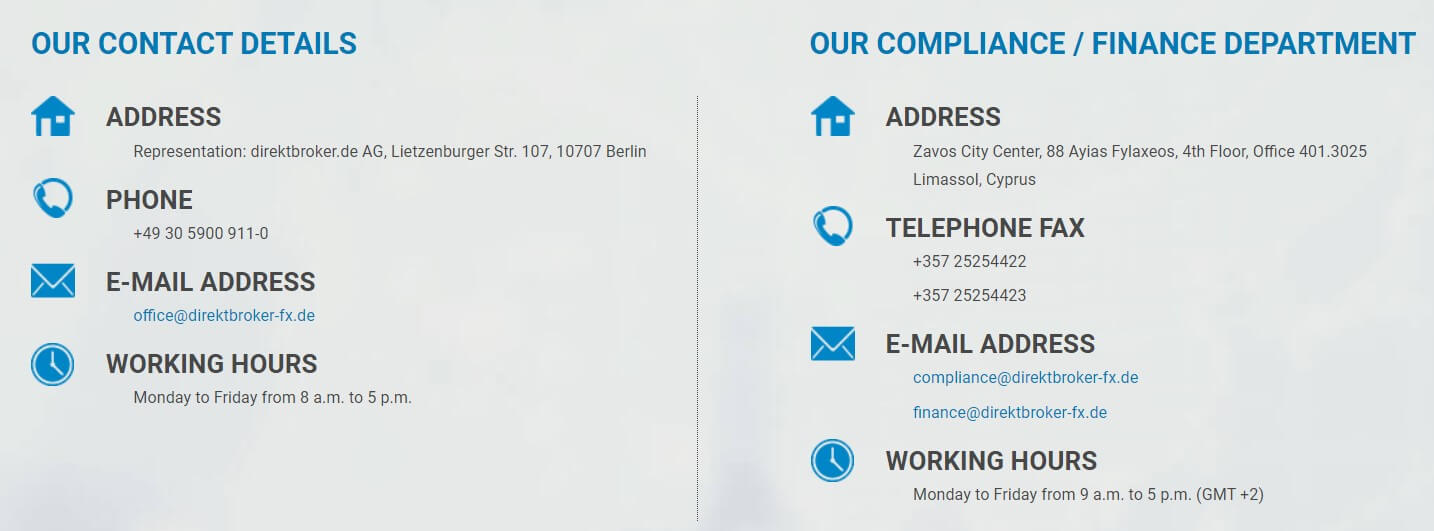
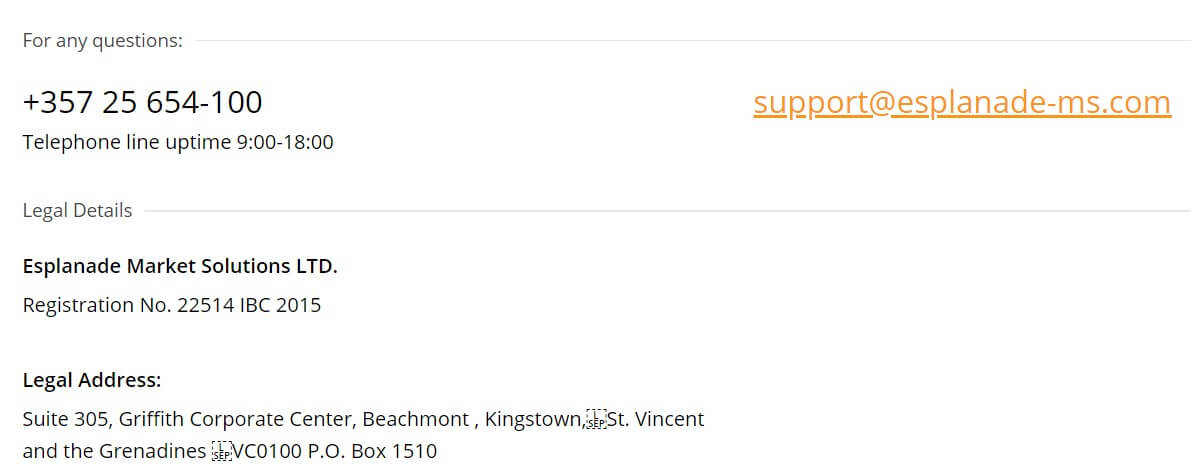
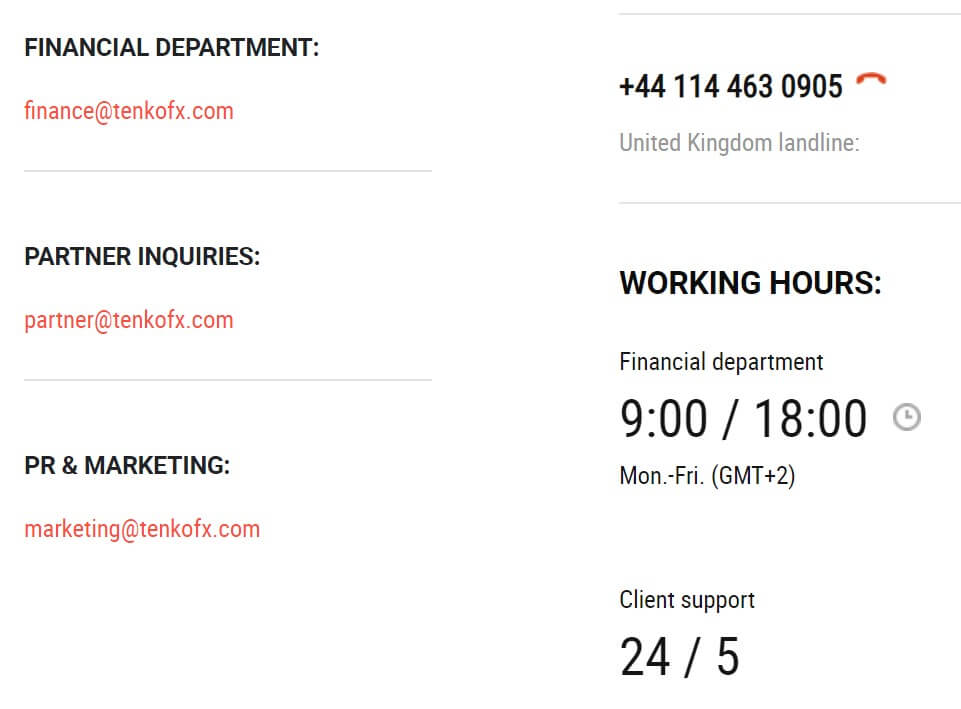
TenkoFX offers 24/5 customer support, with working hours from 9:00 18:00 (GMT+2) Monday through Friday for the financial department. Although the website doesn’t directly feature an instant chat feature, support can still be contacted quickly through the broker’s Skype and Telegram accounts, along with email and phone. From the bottom right corner of the website, the broker also offers a helpful feedback form. Judging from our experience, it seems that traders should expect to receive email responses within about a 24-hour timeframe. However, Skype/Telegram would be the fastest contact methods as long as agents are online. Contact details have been listed below.
Instant Contact Options
Skype: TenkoFX
Telegram: TenkoFX_bot
Phone (UK Landline): +44 190 421 1064
Email
Support: [email protected]
Finance Dept.: [email protected]
Partner Inquiries: [email protected]
PR & Marketing: [email protected]
Countries Accepted
The broker’s website claims that service is not offered to residents of the United States, likely due to stricter regulation laws for the country. On the bright side, the registration form doesn’t actually require one to input their country of residence, and we were able to register from our US-based office with no blocks placed on our IP address. This makes it seem as though the broker’s policy not to accept those clients is rather lenient, which is the case for many other brokers who supposedly blacklist the United States. Fortunately, it seems as though all traders will be able to get through the registration process.
Conclusion
TenkoFX offers leveraged trading of up to 1:500 on FX pairs, some CFDs, and cryptocurrencies from the MetaTrader 4 platform. Traders wouldn’t be able to access the broker’s entire investment library from one account; the STP & ECN account focuses on currency pairs, while the Crypto account features 29 crypto pairs. The website can be vague when it comes to describing spreads and some of the trading costs through commissions. Those that are planning on opening an ECN account will want an equity level above $10K and a higher maintained trading volume, otherwise, commission fees on the account can really add up, at $18 – $40 USD under certain conditions. The broker offers a large range of payment options, including popular options like Visa/MasterCard, in addition to e-wallets and cryptocurrency providers.
On the downside, some of the methods come with steep deposit/withdrawal minimums and fees are charged on nearly all deposits and withdrawals. Withdrawals are processed quickly and the broker has made it easy to reach out to a support agent if need be. The website features a training academy, in addition to news and some convenient trading tools, including AutoTrade and a trader’s calculator. Multiple promotions are available, including a loyalty program, reduced commission, a trading competition, etc. The lenient registration form also makes it possible for everyone to open an account, including US citizens.


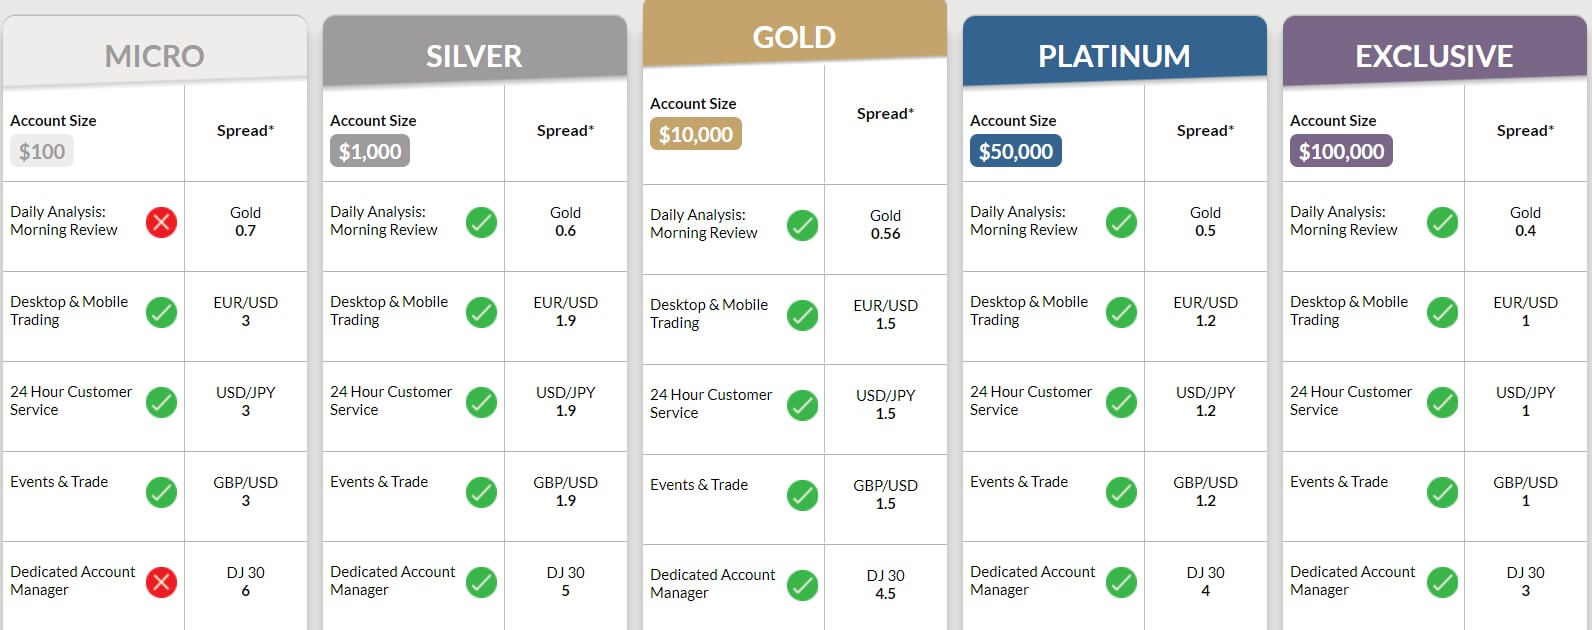
 Although MM Financial doesn’t provide a comprehensive list of their available instruments, they do advertise currency pairs, indices, commodities, and stocks as being among their offers. The broker also offers currency pairs, which aren’t offered nearly as common among their competitors. In total, MM Financial claims to offer more than 800 liquid assets for trading, but traders shouldn’t be surprised if this statement doesn’t hold up entirely.
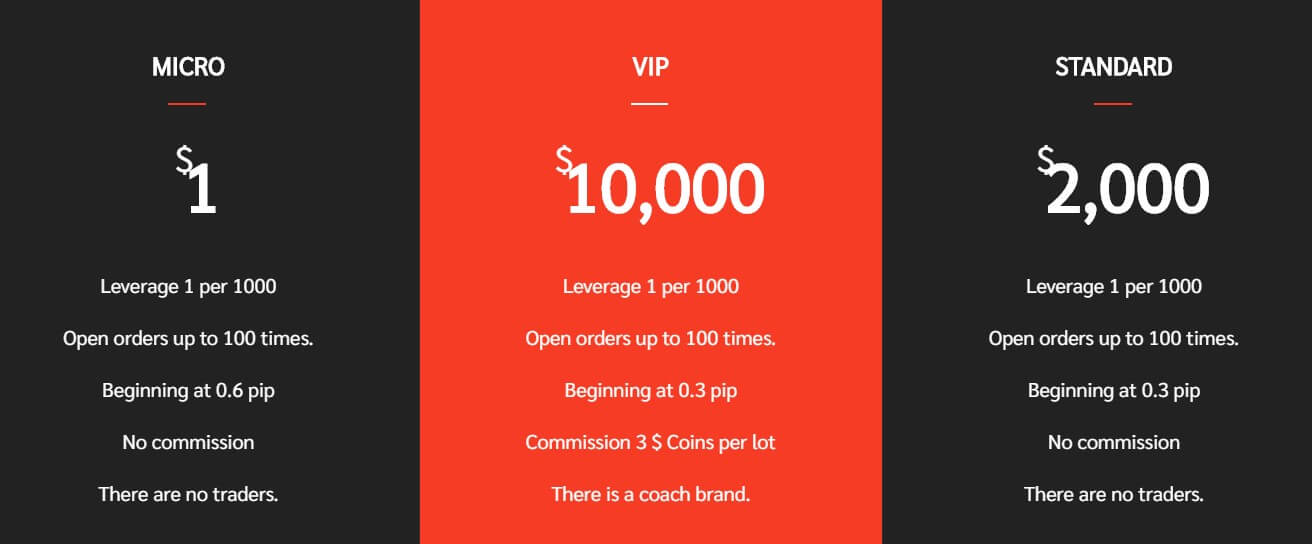
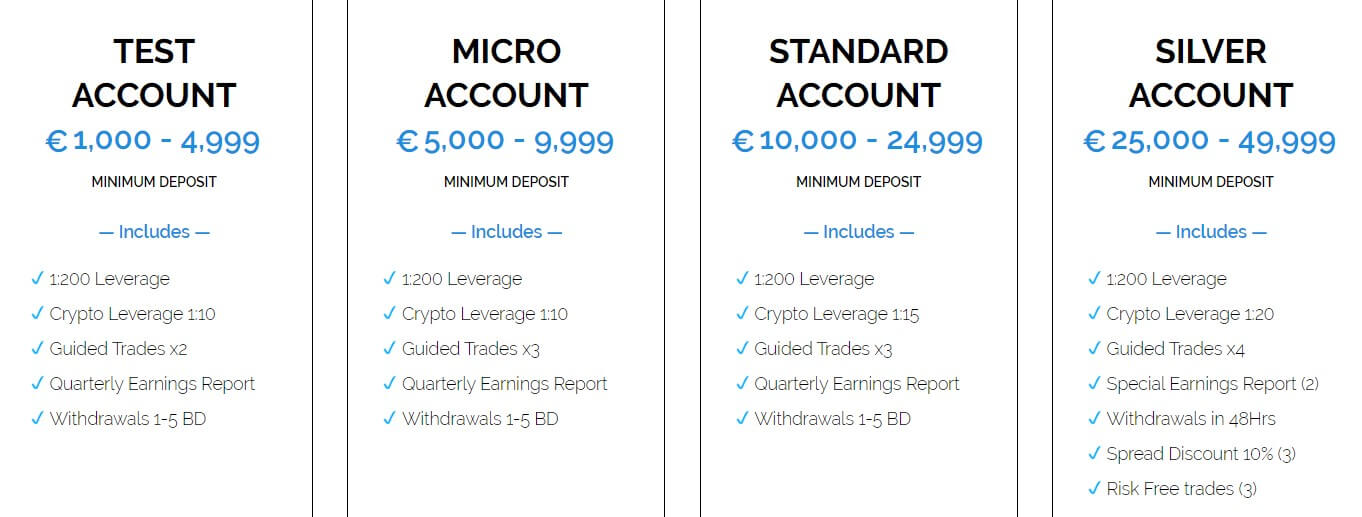
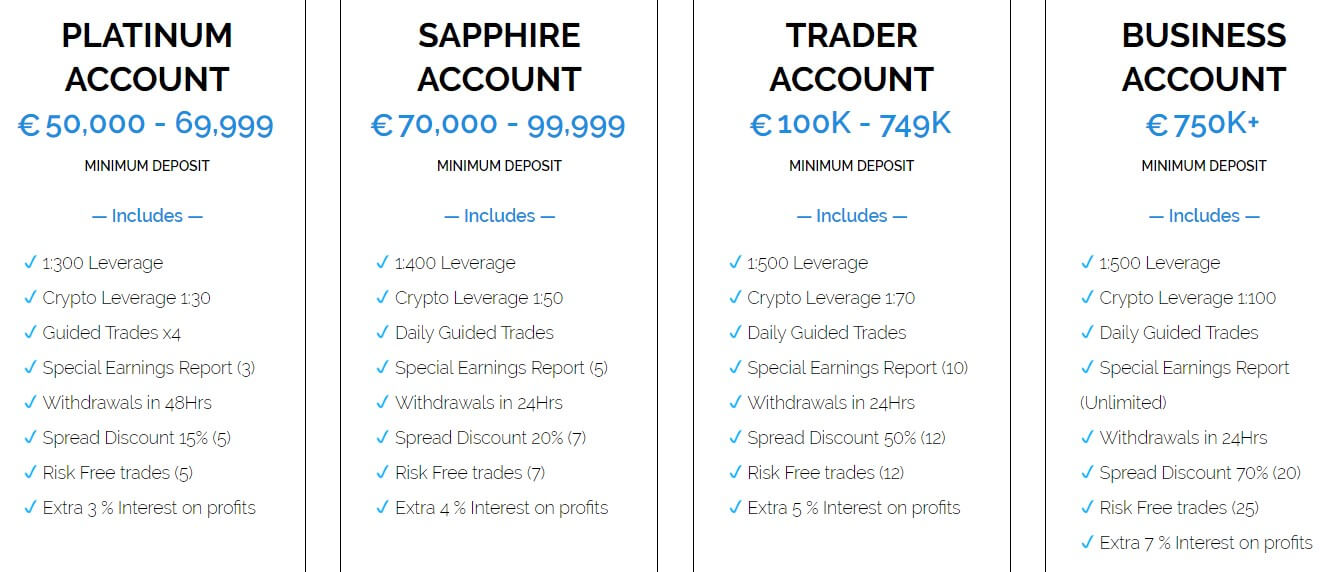
 MM Financial starts off with an expensive $1,000 entry-level deposit on their Test account, which is much higher than the $100 (or less) entry-level deposits offered by many other brokers. From there, the asking amounts keep climbing, up to $5,000 on the Micro account, $10,000 on the Standard account, $25,000 on the Silver account, $50,000 on the Platinum account, $70,000 on the Sapphire account, $100,000 on the Trader account, and $750,000 on the Business account. Traders should also note that each account holds a maximum balance that tops out at $1 below the funding amount for the next account. For example, the Test out tops out at $4,999, which is just $1 below the Micro account’s $5,000 deposit requirement. Costs with this broker aren’t exactly beginner-friendly and it may take some time to save up to open a simple Test account.
 Traders won’t find a wide variety of resources available on the broker’s website, instead, MM Financial focuses on providing some articles about forex basics, analysis, trading plans, and market volatility. While those articles can be helpful, beginners will likely benefit from searching elsewhere on the web for more in-depth information and better learning tools, like video tutorials, e-books, and other sources. MM Financial seems to provide services for more experienced traders that can make larger deposits, which is likely the reason why they haven’t invested much of an effort in this category.
 MM Financial doesn’t exactly make it easy to reach out to support – the website doesn’t offer any instant option like LiveChat and it also fails to list a contacts page. In fact, we couldn’t even find a listed email address on the site, so traders will have to reach out to an agent through a form that is provided at the bottom of the website. 24/5 support is advertised, but we wouldn’t expect to see quick responses with all things considered.


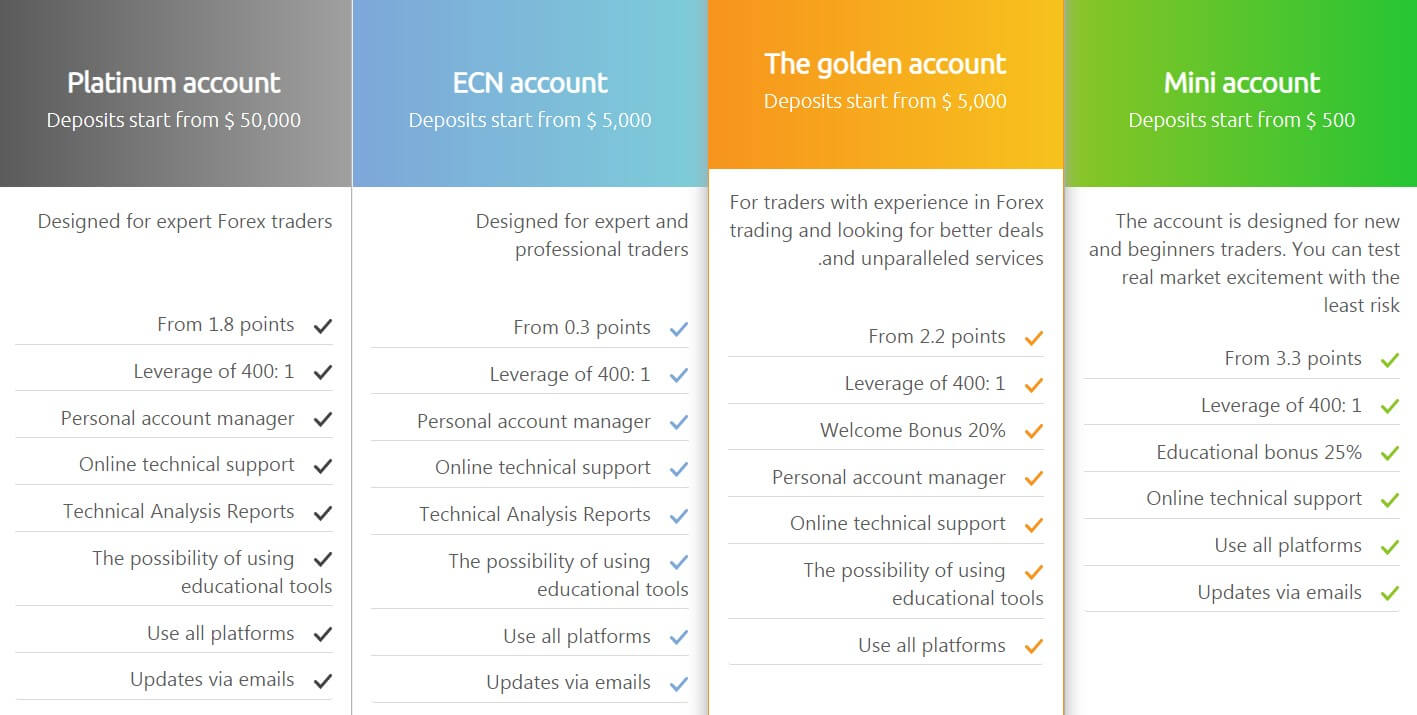
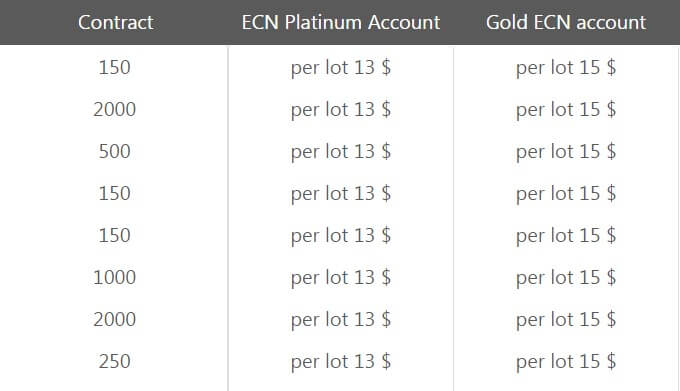
 The broker’s website features an education section that includes a forex glossary, articles, demo accounts, and a FAQ. When listing each account’s features, NetoTrade mentions the possibility to use educational tools on the Golden, ECN, and Platinum accounts, which means that Mini account holders are excluded. It’s extremely disappointing when traders try to withhold resources from certain account holders, especially considering that Mini account holders are more likely to be beginner-level status and would need the tools more than other traders. Educating clients is in the broker’s best interest, so it makes no sense to not offer those resources to everyone. It also isn’t clear as to whether traders would actually have access to additional resources since there are accessible options on the website.
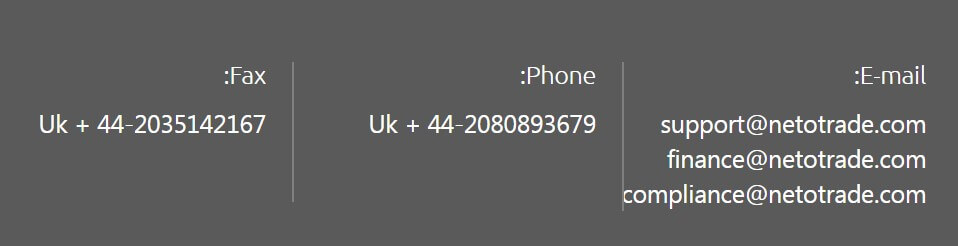
 Linthrope is a forex investment firm that features FX options with a leverage cap of up to 1:50. The company was founded by a group of retail entrepreneurs and capital market dealers with 15 years’ worth of experience serving the Forex industry. According to their mission statement, the founders claim that they understand their success goes hand-in-hand with the quality of services that are provided, which inspires transparent account practices and the desire to continuously expand their limited number of available trading instruments. As far as a central location, we did find the broker’s phone number to be within Hong Kong, but the website is missing a few concrete details. Some details about trading conditions are vague, so we scoured the website for our readers to paint the clearest picture possible.

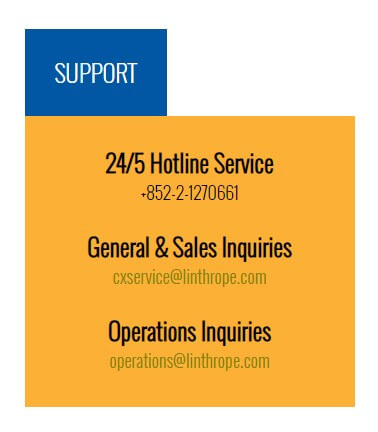 Phone: +852-2-12700661
 PVP Markets exclusively features the MetaTrader 4 platform, along with the majority of other foreign exchange brokers. MT4 is the most commonly chosen trading platform for several reasons, including accessibility, built-in features, customization options, a navigable interface, etc. The program also comes with multiple languages and supports everything a trader could need, including the ability to trade micro-lots, Expert Advisors, scalping, hedging, etc. MT4 can be accessed through the WebTrader or downloaded on PC, iOS, and Android devices, including tablets and iPads. Those trading from a Mac computer may have issues downloading the platform and would have easier access through the browser-based version.


 Traders will have the ability to choose between two platforms, with options being the MetaTrader 4 platform or a proprietary WebTrader platform. MT4 would probably be better suited for FX/CFD traders, while WebTrader is better for traders that are looking to trade equities and stocks, due to the fact that each platform does not offer access to the same instruments. MT4 features 5 asset classes including Bitcoin, while the WebTrader platform offers access to 7 asset classes, including 2,000+ stocks and ETF’s that cannot be traded from the MT4 platform.
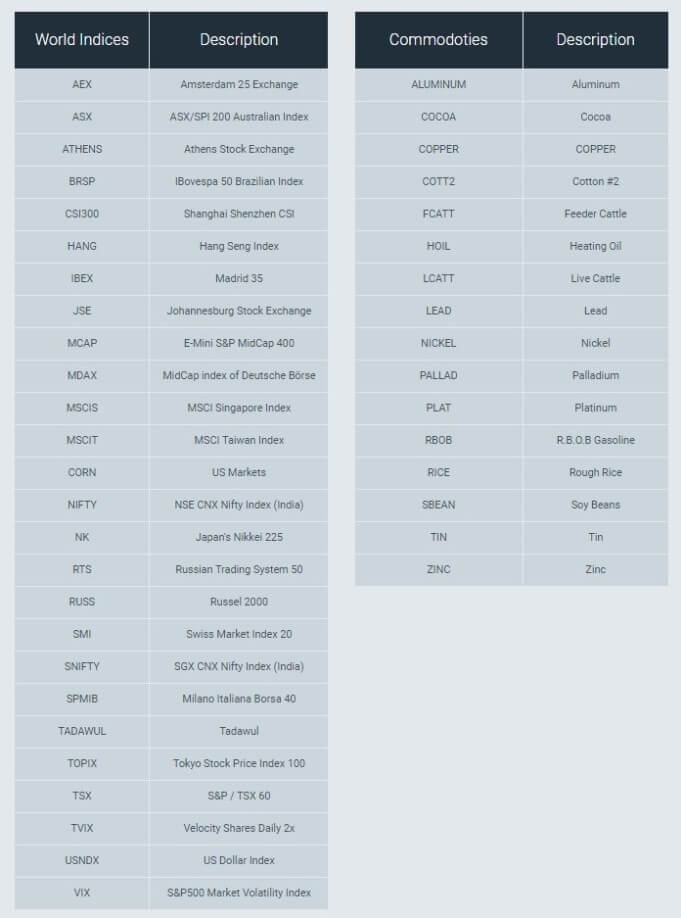
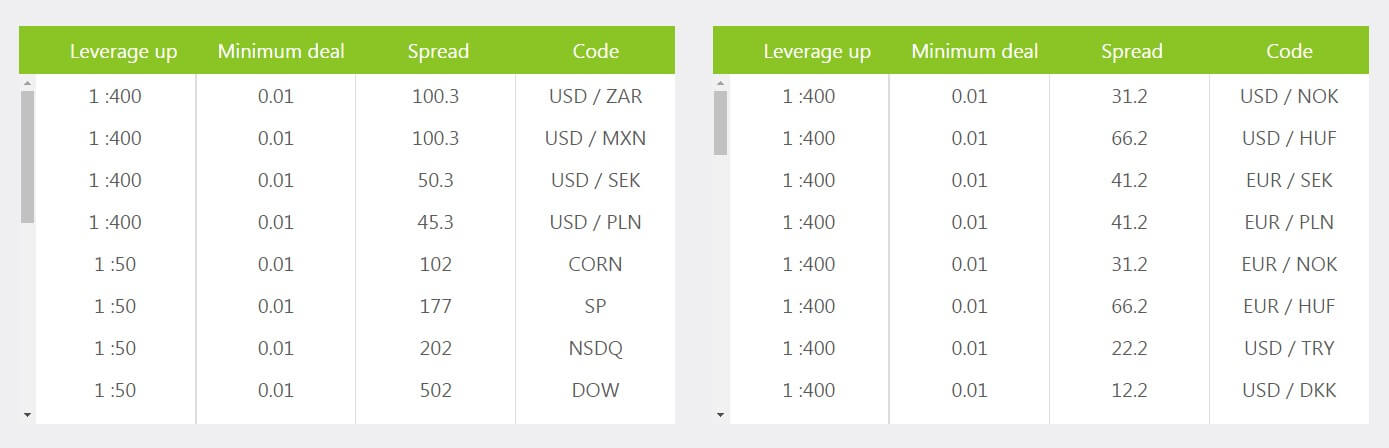
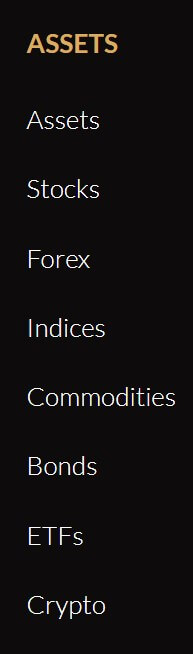 The broker’s instrument portfolio consists of 55 currency pairs (major, minor, and exotic options), precious metals Gold, Silver, Aluminum, Palladium, Platinum, Copper, and Zinc, plus commodities, 25+ stock indices, 4 bonds, energies, 55 ETF’s, and more than 2,000 stocks. Note that the last two categories (ETF’s and stocks) are only offered on the WebTrader platform and those options cannot be accessed on MT4. Commodities include Corn, Coffee, Rice, Cotton, Cocoa, Sugar, Wheat, and Soybean. Energy options include Heating Oil, Oil, Brent Oil, and Natural Gas. Traders would also have the ability to trade Bitcoin from the MetaTrader 4 platform (WebTrader does not offer this option).


 Phone
Phone