Fundamental Analysis For Novices – The Chicago Fed National Activity Index
Thank you for joining our educational video four fundamental analysis for novices. In this video, we will be looking at the Chicago Fed national activity index.
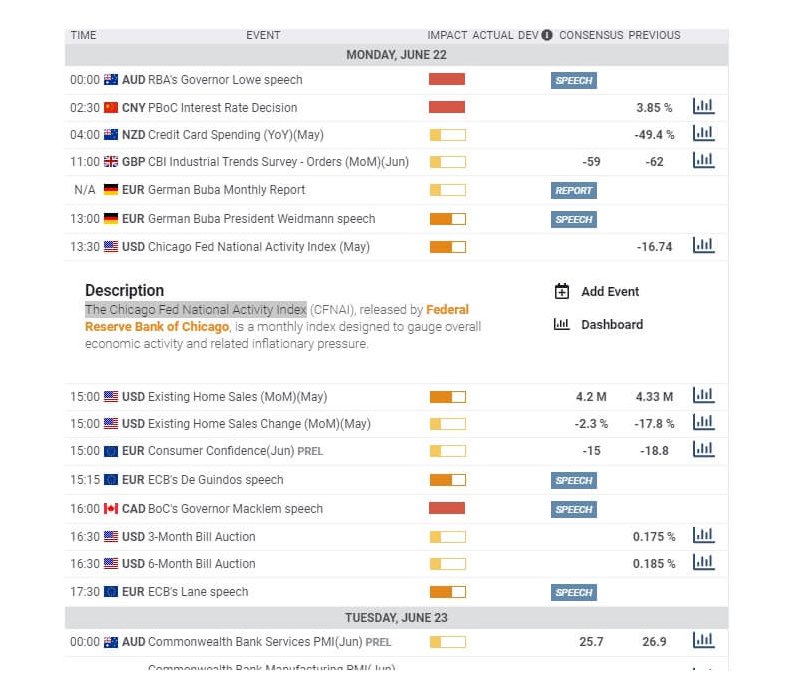
If you are new to trading, one of the most important aspects of a daily trading routine is to analyse economic data releases from the government’s around the world, which reflect the health of that particular nation’s economy. This data can be found on an economic calendar such as this one. Most brokers provide an economic calendar, and you should refer to it every day in order to avoid trading around times of possible extra market volatility surrounding the release of high impact economic data.
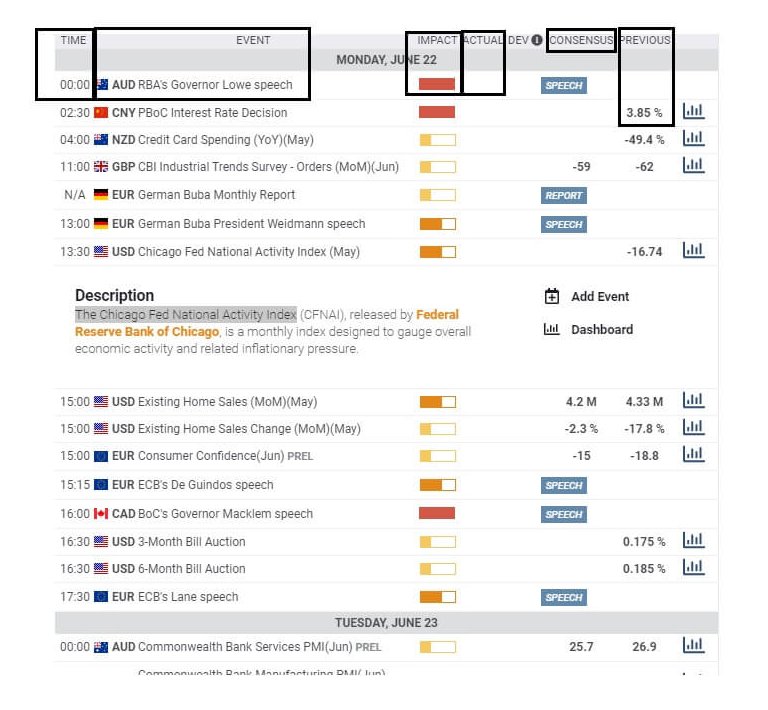
The most important aspects of the economic calendar are the time and date of the event, the impact value, which is typically low, medium, and high, and where a high impact event is more likely to cause extra volatility upon its release. The actual data, which is updated in the calendar at the time of the release and is usually subject to an embargo. The consensus – where available – which is the anticipated actual release as put together by economists and analysts, and also the previous data which is usually released weekly, monthly, quarterly, or annually.
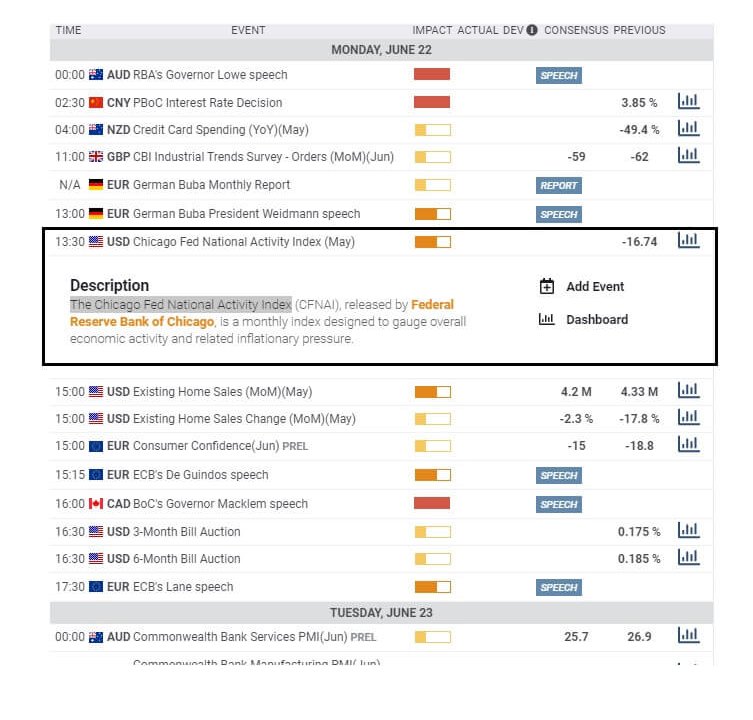
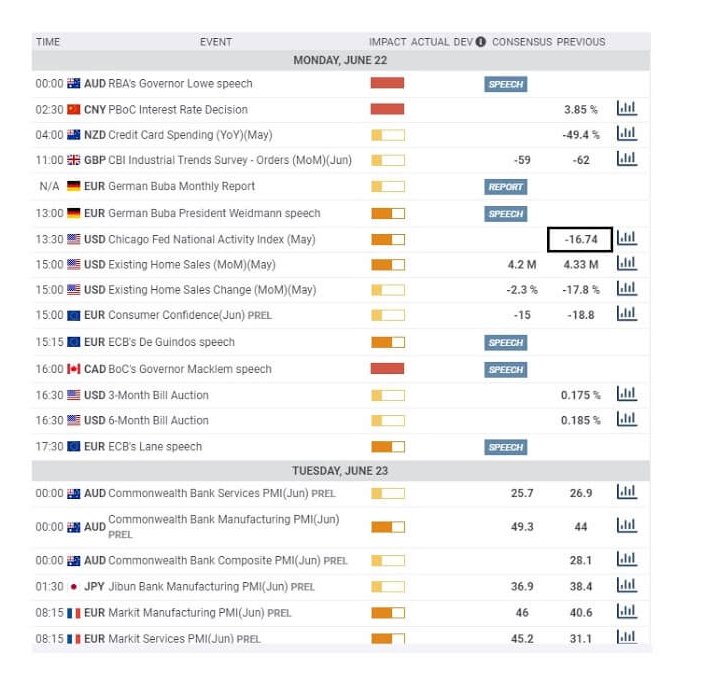
As we can see, the Chicago fed national activity index for May will be released at 1:30 BST on Monday, June 22nd, and the impact level is medium and where there is no consensus value, but the previous value for April was – 16.74.
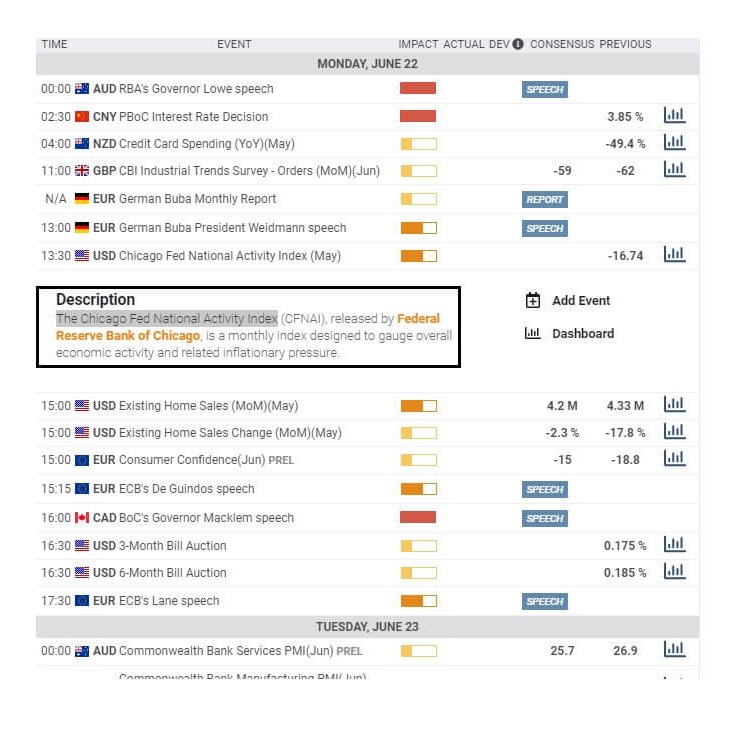
Some brokers’ economic calendars will provide a brief description of the event, and here we can see that the Chicago Fed national activity index, also referred to as the CFNAI on some calendars, Is released by the Federal Reserve bank of Chicago. It is a monthly index design to gauge overall economic activity and related inflationary pressure.
In fact, the CFNAI is actually a combination of 85 indicators covering areas such as housing, personal consumption, employment, unemployment, hours worked, income, production, factory orders, and inventories.
The index measures various aspects of overall macroeconomic activity and was designed by Harvard University. The idea being that all the data can be brought together in one single point in order that policymakers can have a more focused aspect for being able to forecast inflation within the US economy.
The index has an average value of 0 and a standard deviation of 1. Traders will be looking for a positive reading which will be considered as bullish and showing that the economy is improving, but if the value is negative, it implies that the US economy is contracting or in recession and is therefore seen as bearish.
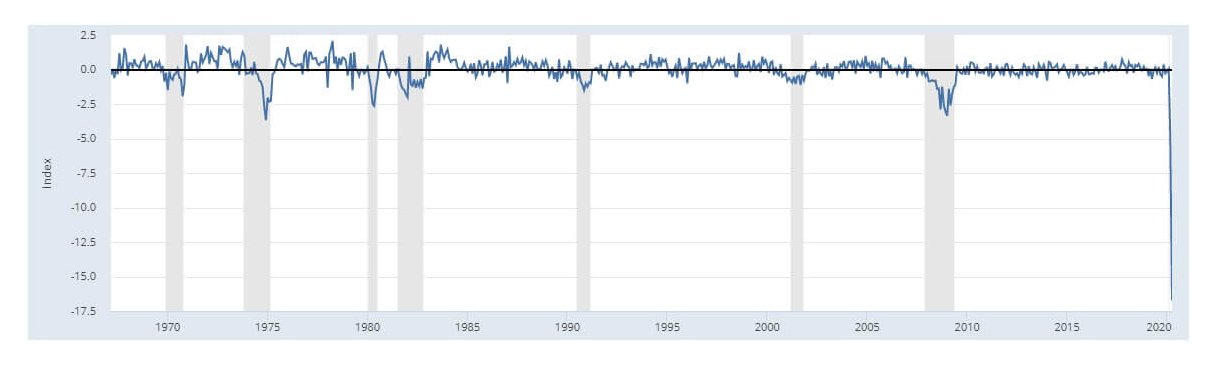
Here we can see that from as early as the 1970’s the index has been fairly tightly confined to its zero-axis. However, for the year 2020, we can see a huge spike lower to the current levels of – 16.74 for April. Of course, this can only be associated with the coronavirus pandemic, and the terrible impact it is having on the United States economy.
Traders already realise that the economy is in a bad state and that the figure is going to be well below the zero-axis. And so there will be no shocks or surprises that the figure is going to be bad. They will be looking for how greatly the number will be with regard to its divergence from the release for May.
Therefore, a lesser minus figure will show that the economy may be bouncing back and may have hit the bottom with regard to the impact from the coronavirus pandemic, and this will be seen as positive or bullish for the economy and where you would find potentially an improvement in the exchange rate for the United States dollar against its counterparts and also an uptick in us stocks and indices.
However, should the minus figure be even greater in value you and the previous release, this will show that the worst is not yet over for the US economy, and we might find that the US dollar loses value against its counterparts and stocks and indices may fall as a result.
The higher the divergence from the previous month’s figure in either direction, the greater the risk of market volatility.