Categories
Forex Options

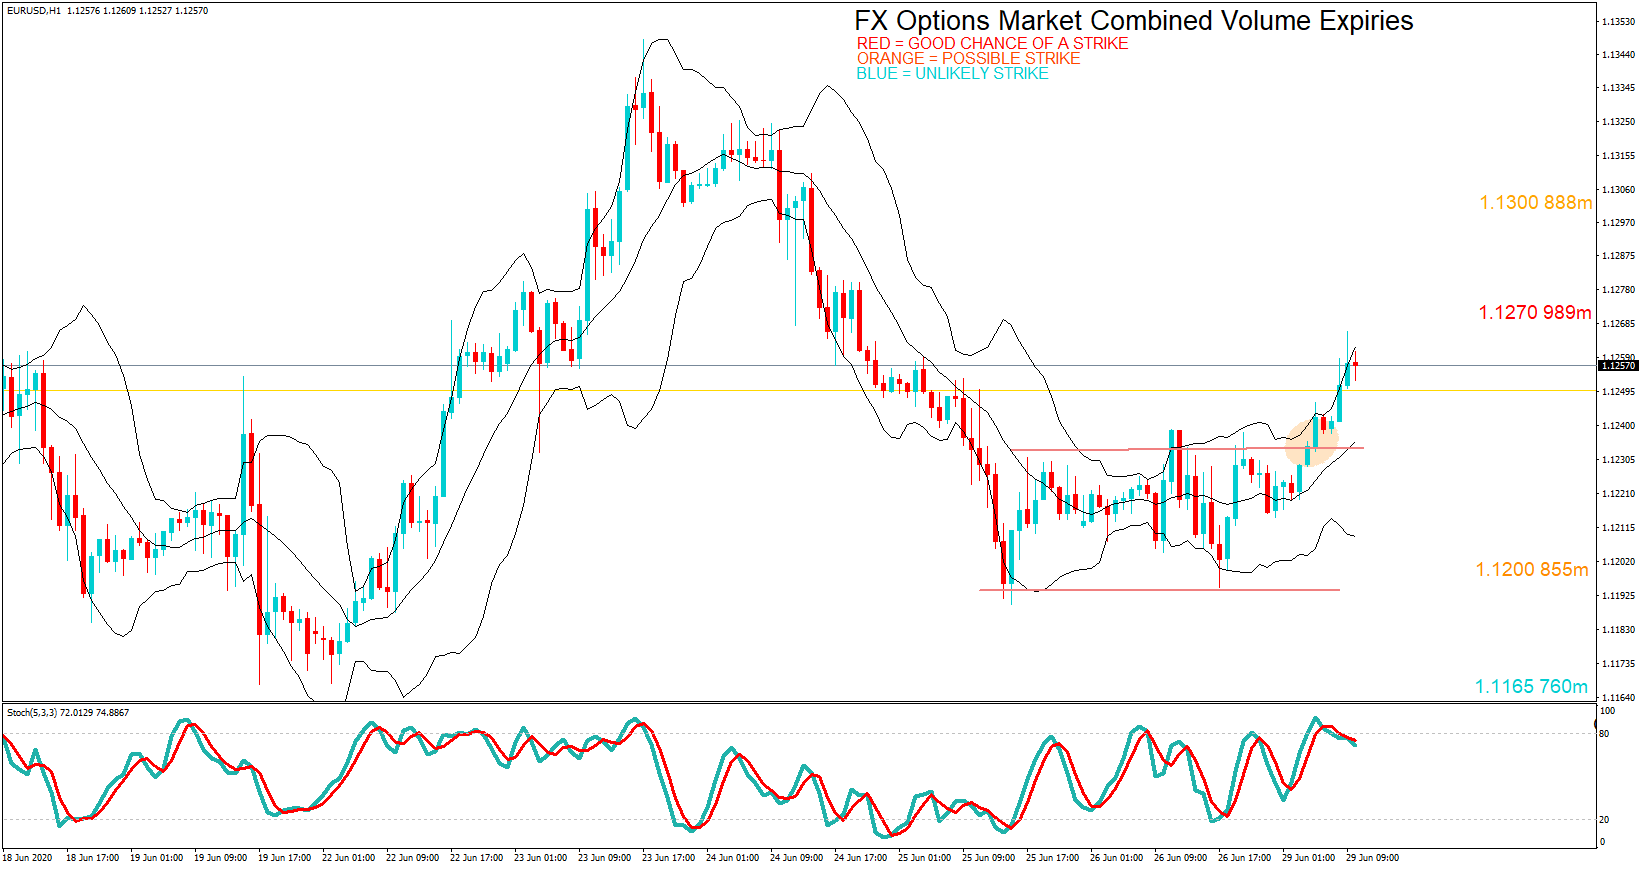
FX Options Market Combined Volume Expiries for 29th June 2020

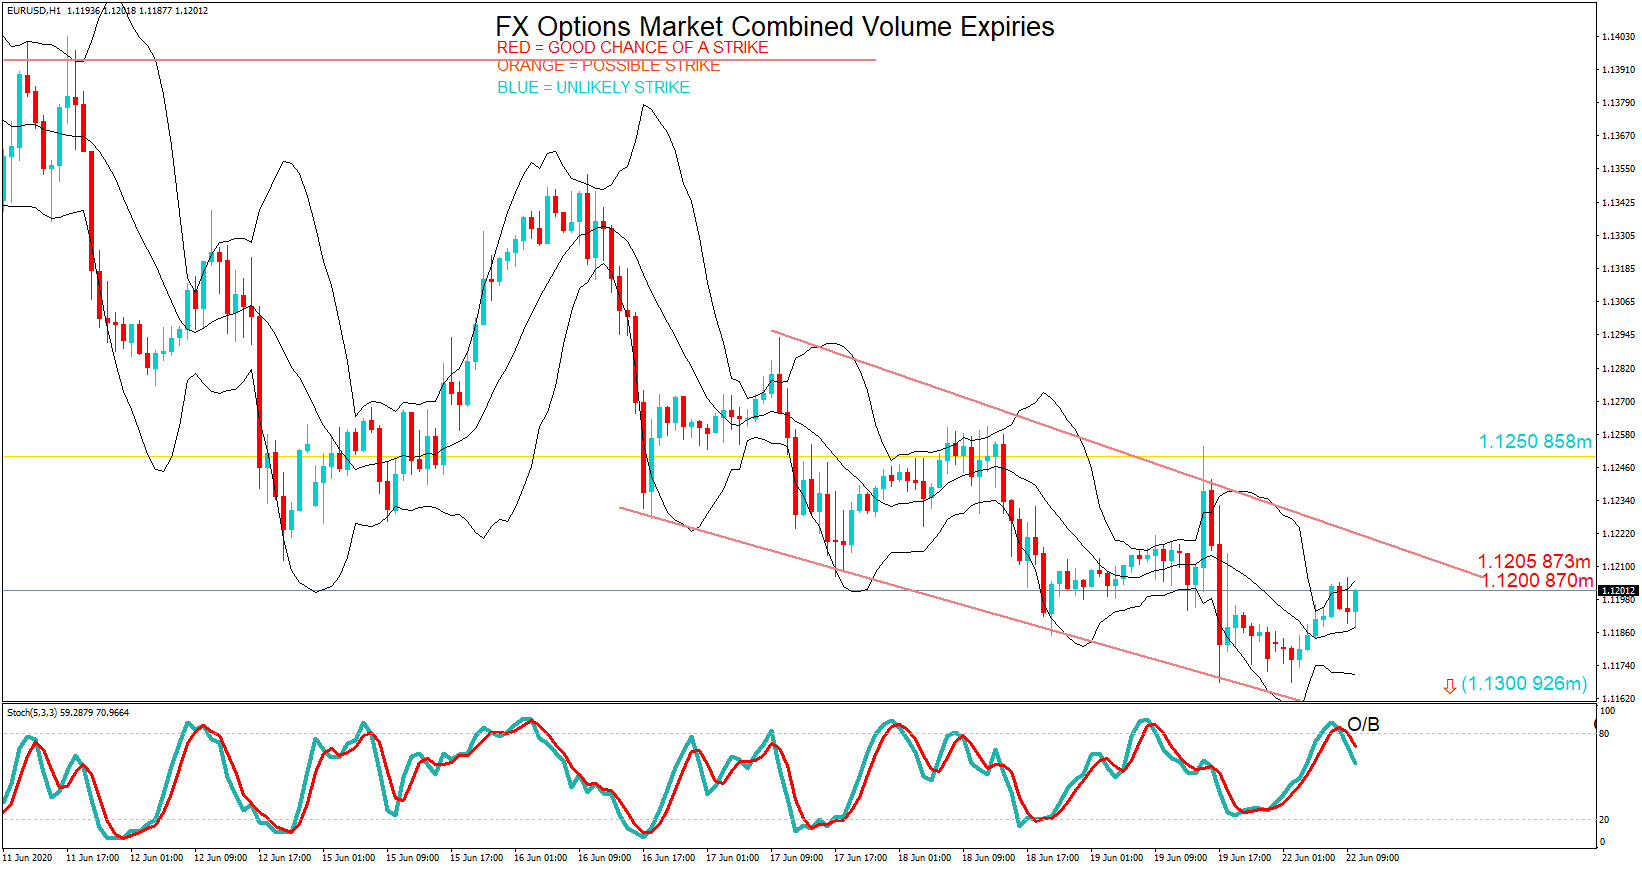
Thank you for visiting the Forex Academy FX Options market combined volume expiries section. Each day, where available, we will bring you notable maturities in FX Options of amounts of $100 million-plus, and where these large combined maturities at specified currency exchange rates often have a magnetic effect on price action, especially in the hours leading to their maturities, which happens daily at 10.00 AM Eastern time. This is because the big institutional players hedge their positions accordingly. Each option expiry should be considered ‘in-play’ with a good chance of a strike if labelled in red, still in play and a possible strike if labelled in orange and ‘out of play’ and an unlikely strike if labelled in blue, with regard to the likelihood of price action meeting the strike price at maturity.

………………………………………………………………………………..

FX option expiries for June 29 NY cut at 10:00 Eastern Time, via DTCC, can be found below.

– EUR/USD: EUR amounts

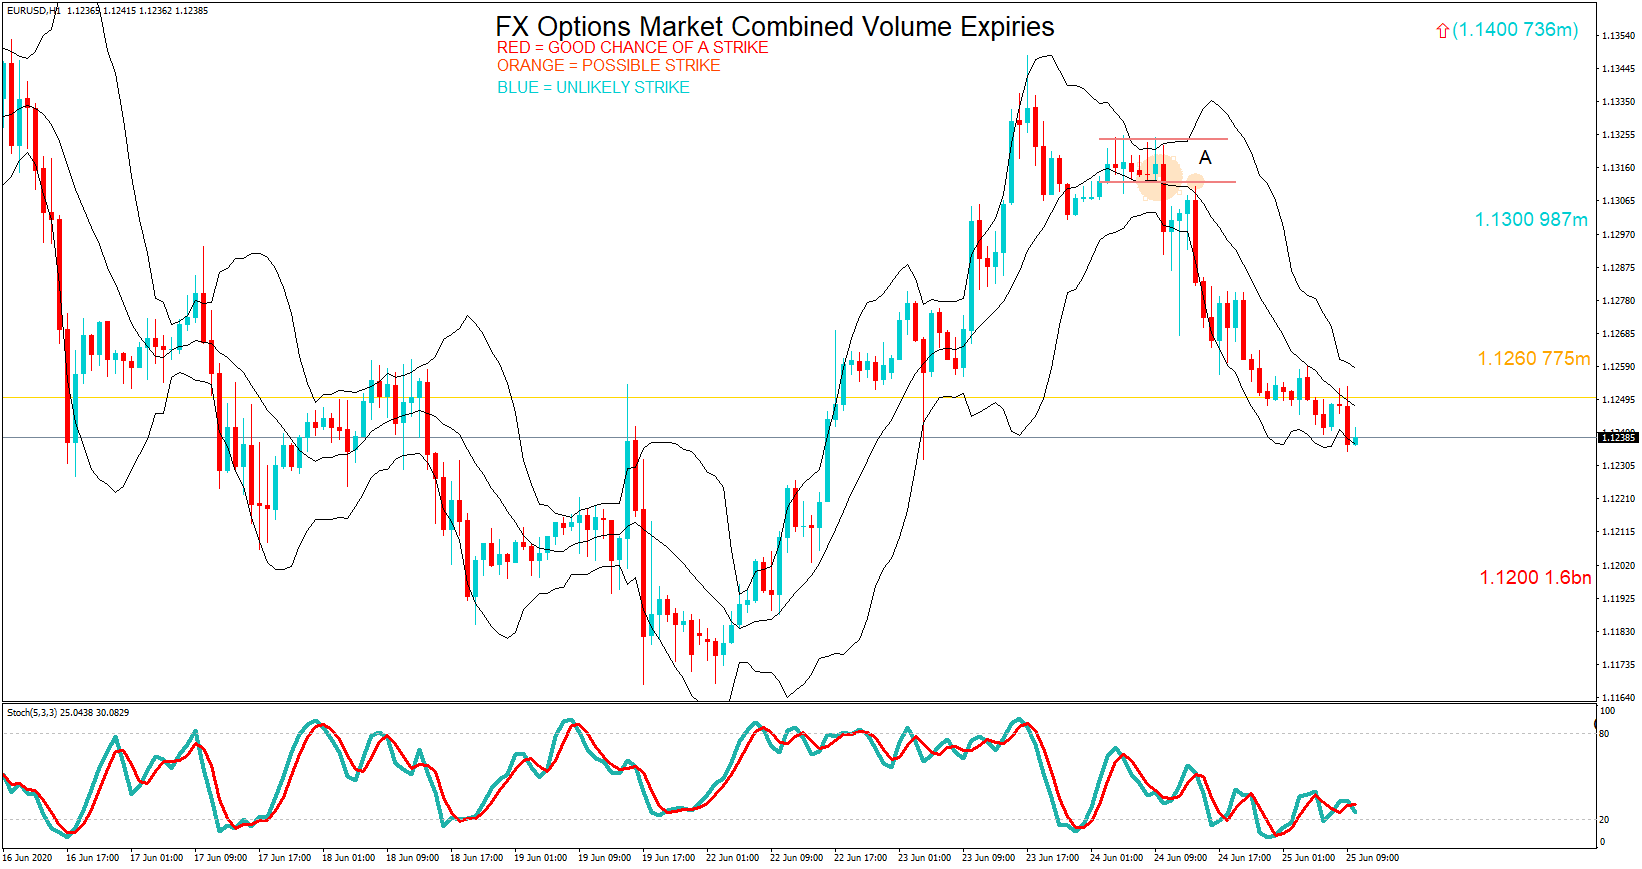
  • 1.1165 760m
  • 1.1200 855m
  • 1.1270 989m
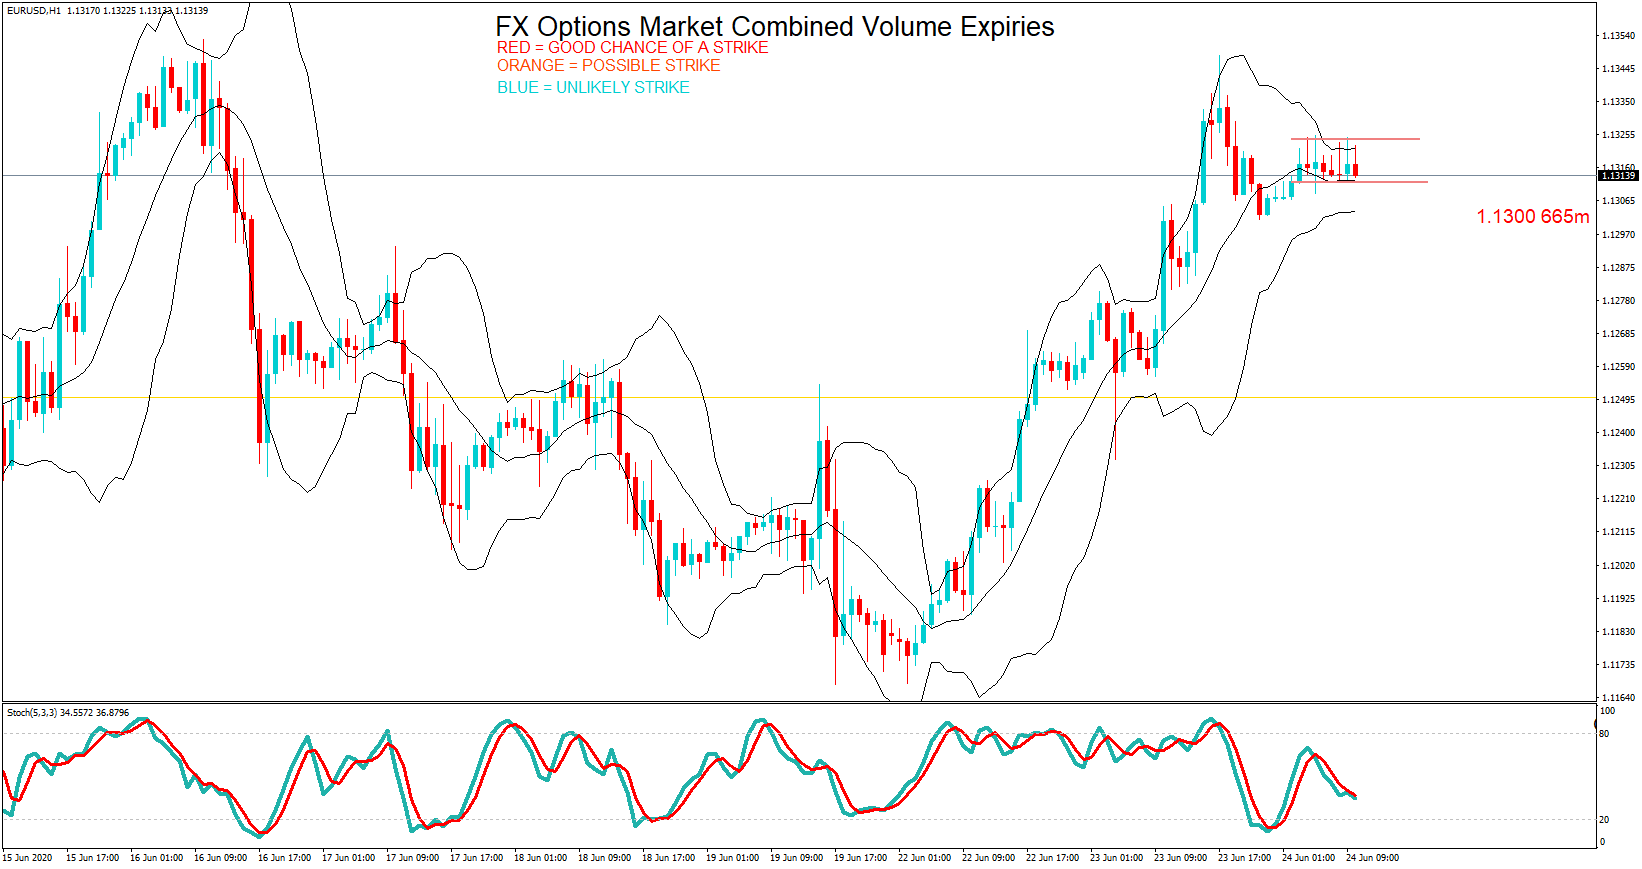
  • 1.1300 888m

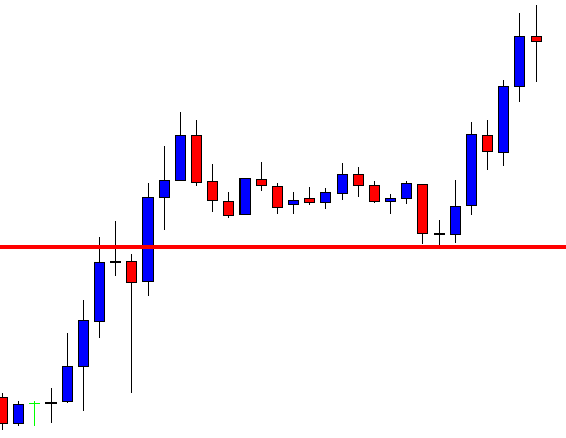
EURUSD pair broke free to the upside from a consolidation range with 1.1200 showing strong support. Likely candidates for a strike at the New York cut at 1.1270 & 1.1300 as the pair remains in a bull trend. Eurozone and US data out later, plus month end and quarter end rebalancing may all cause volatility.

– USD/JPY: USD amounts

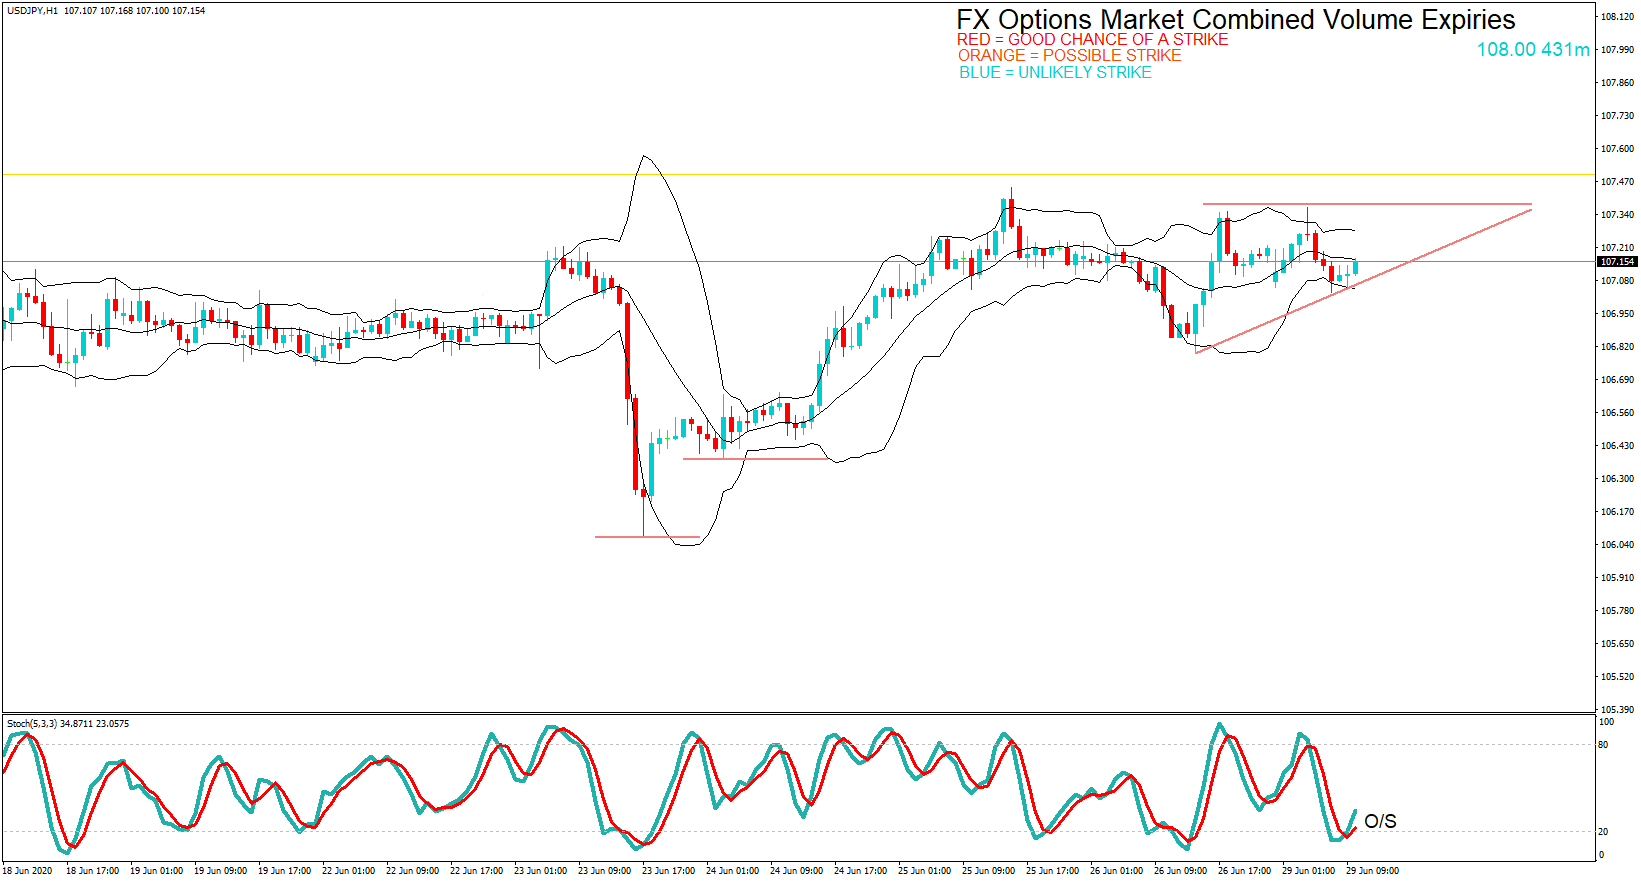
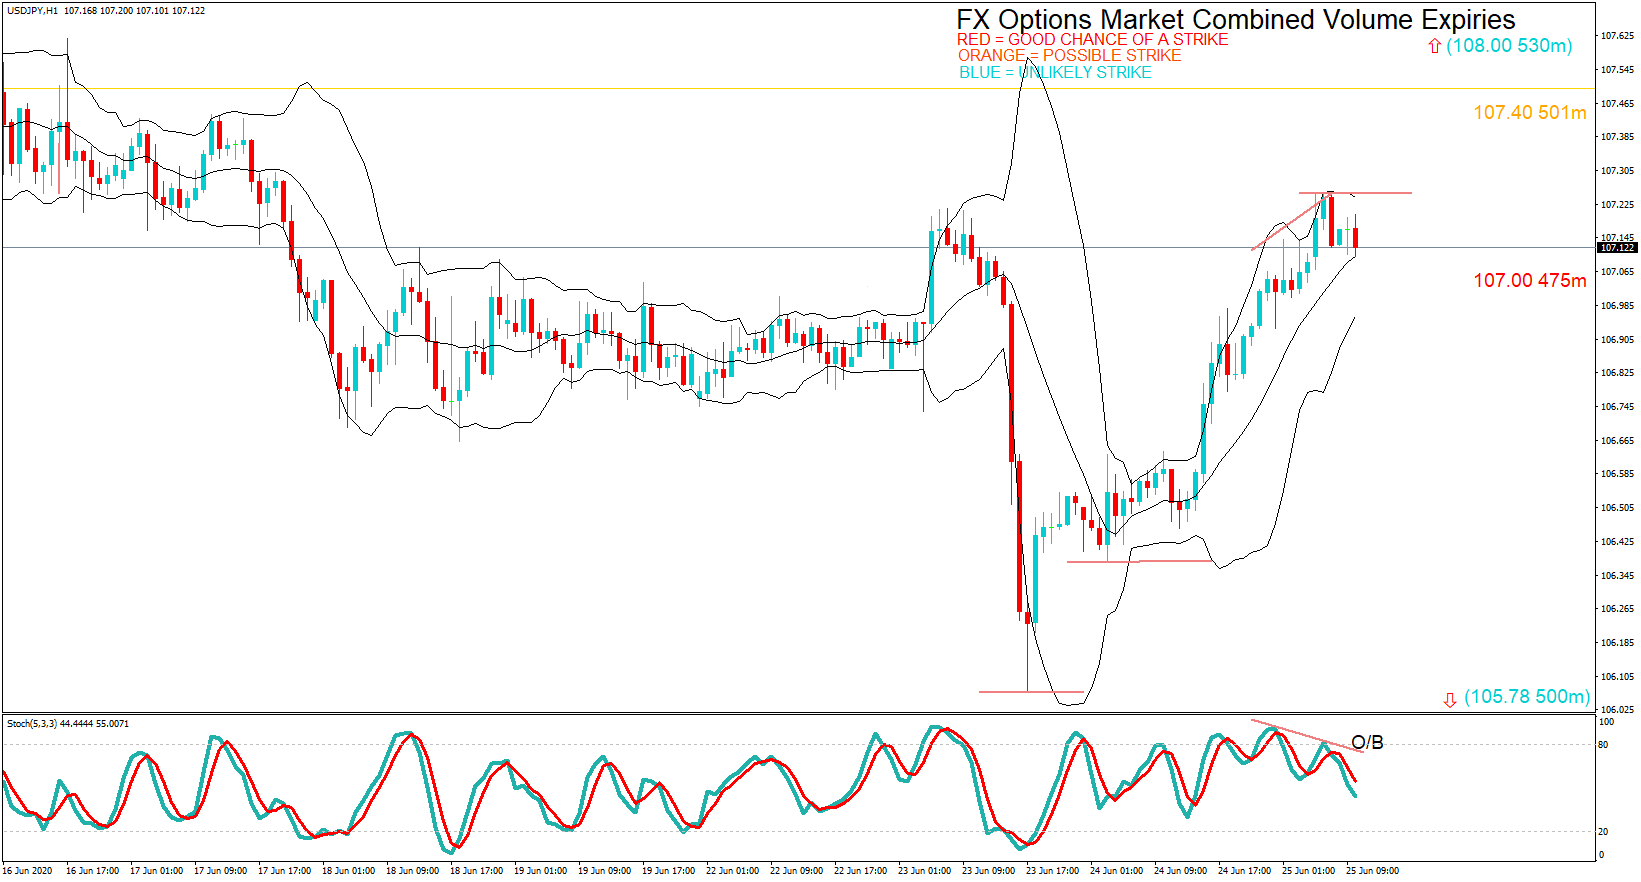
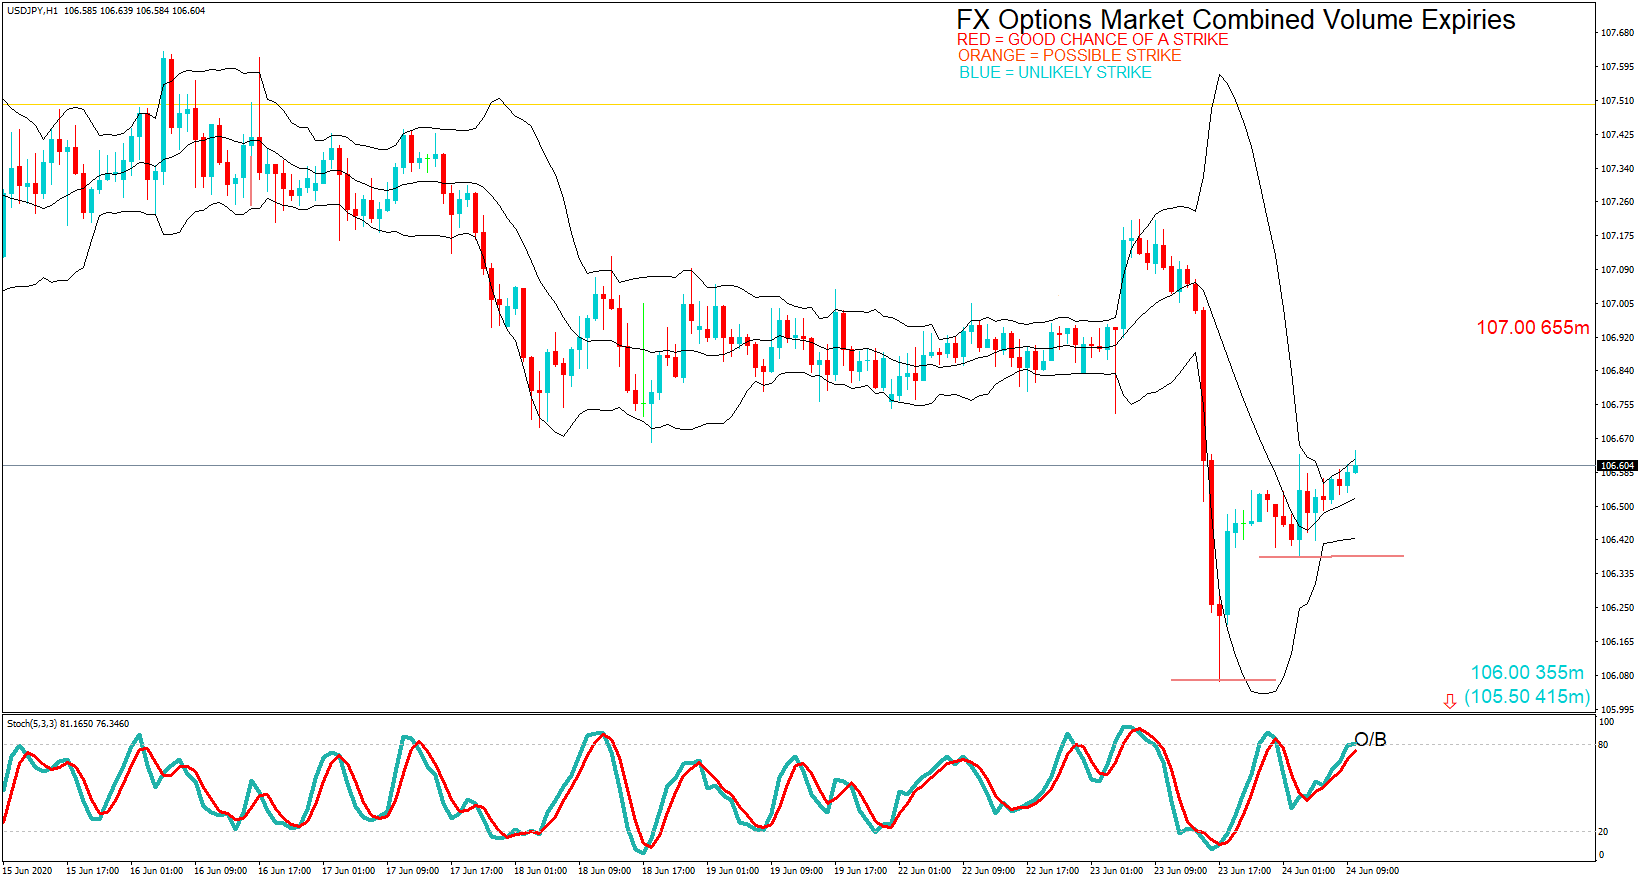
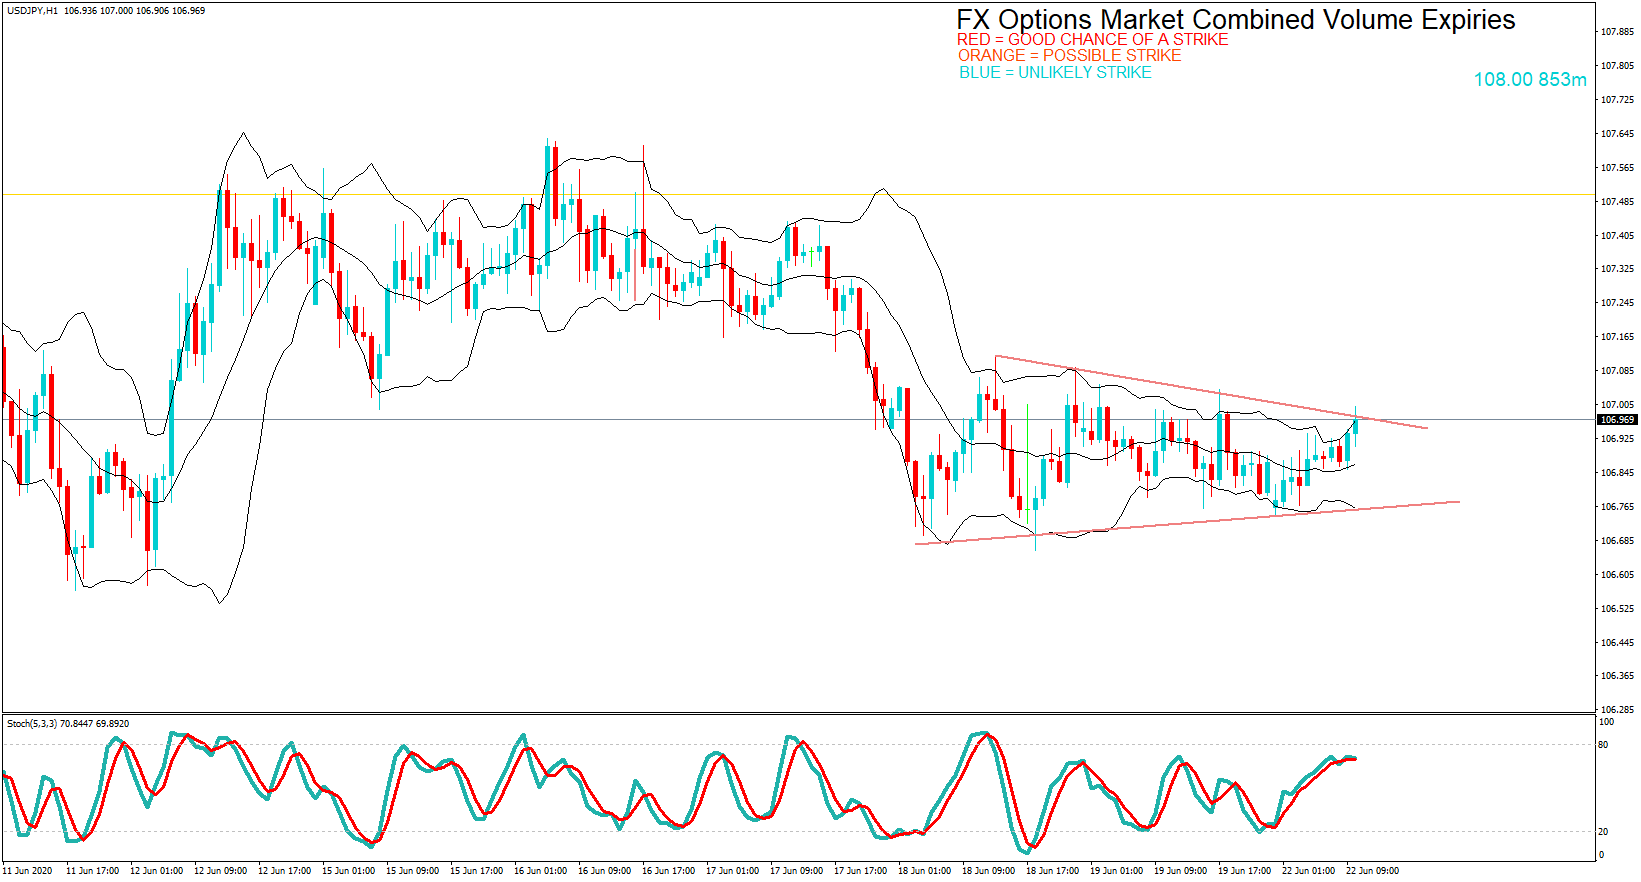
  • 108.00 431m

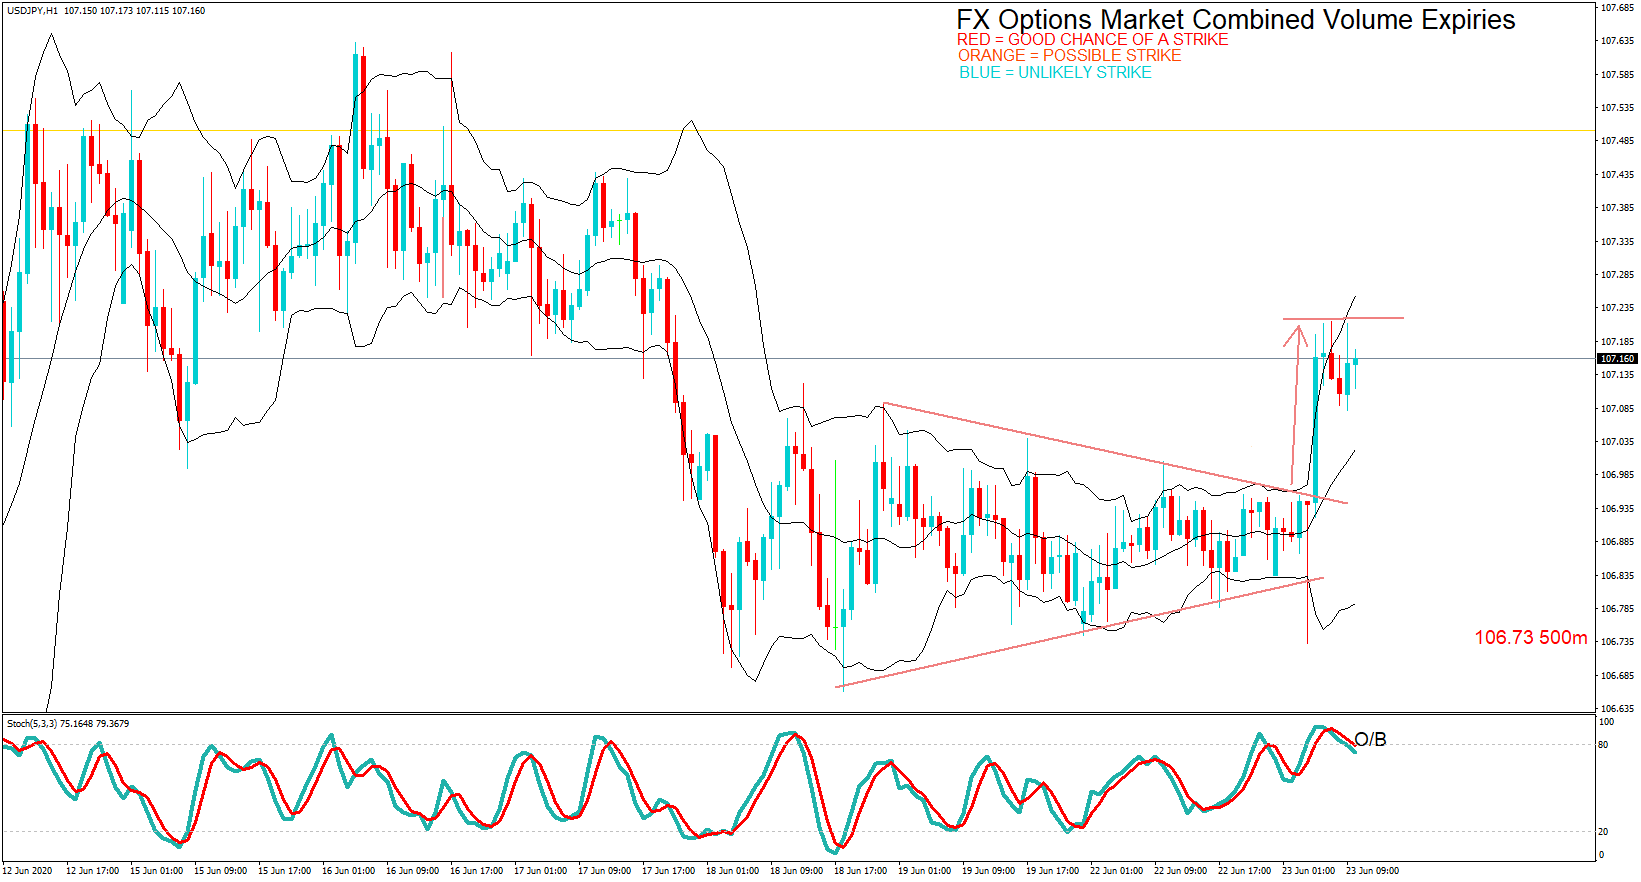
USDJPY is in a bull trend squeeze with the resistance line at 107.37. The pair will need a strong break above here before the 108.00 option maturity comes in play.

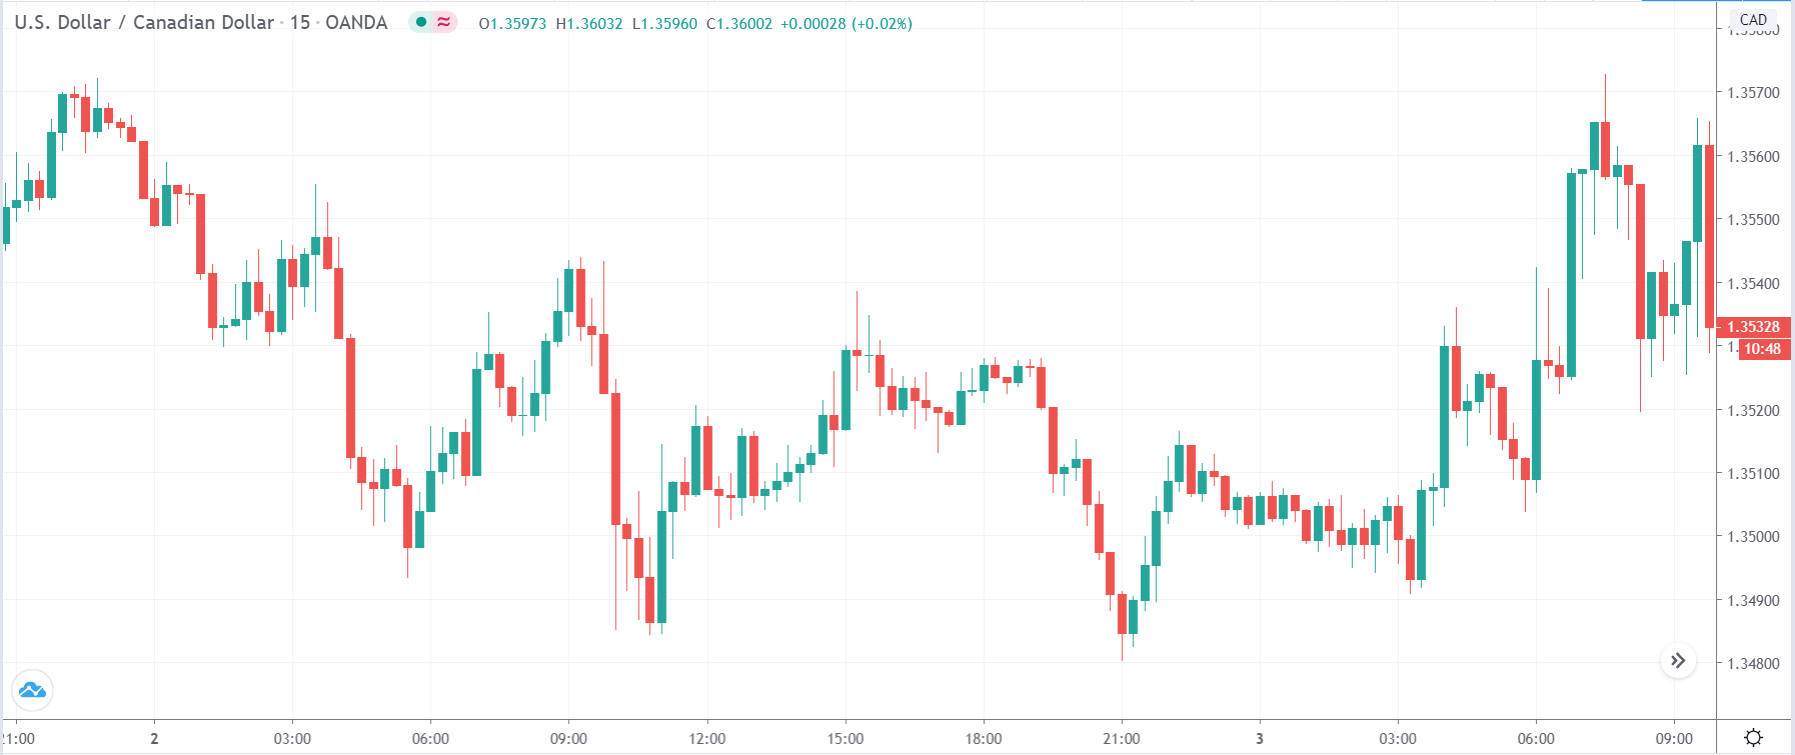
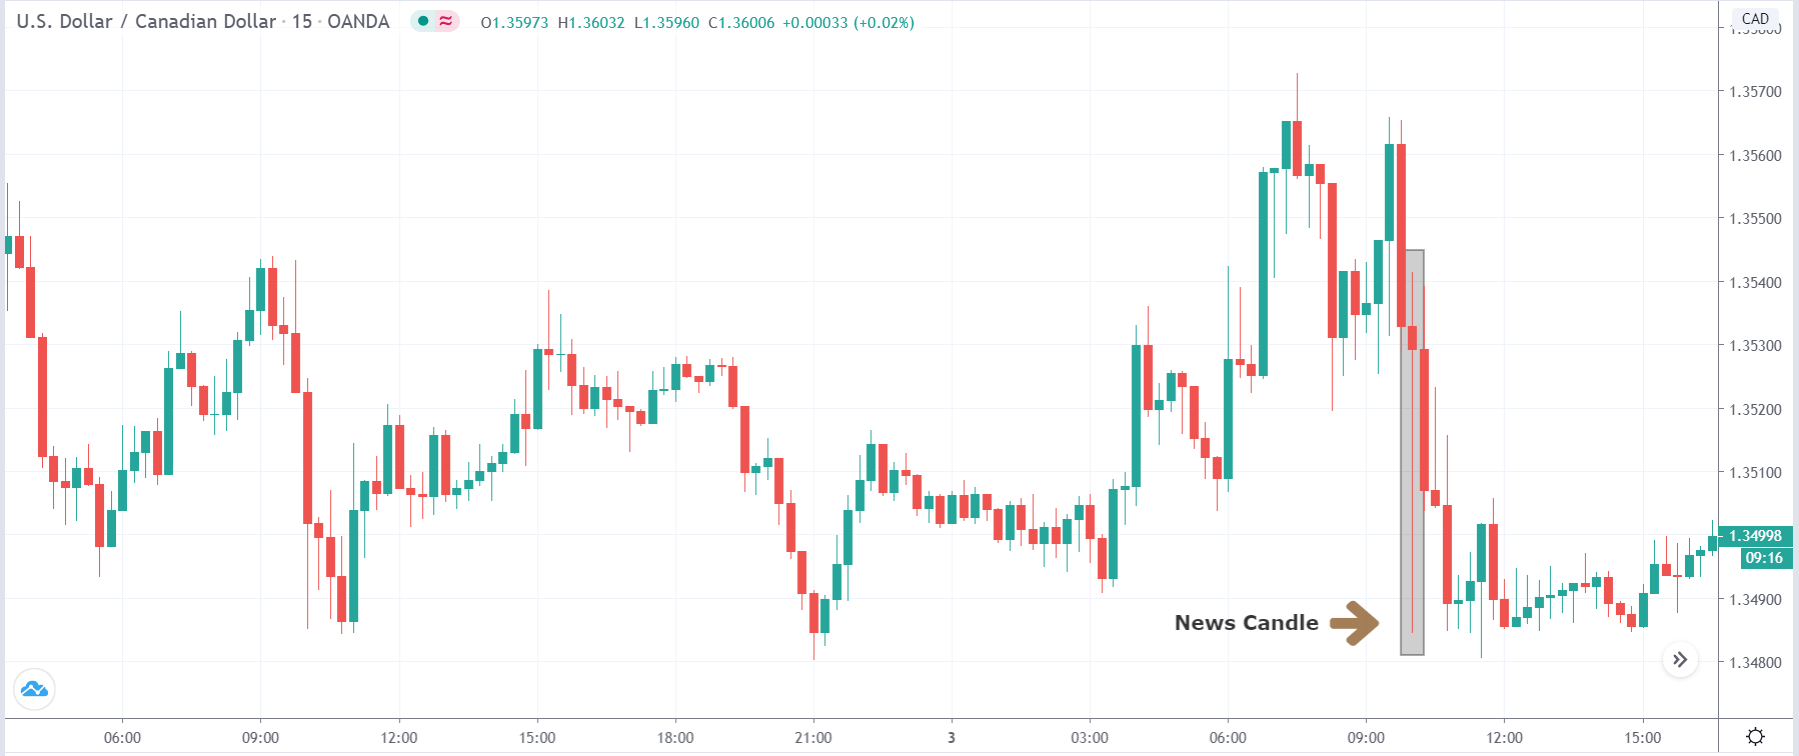
– USD/CAD: USD amounts

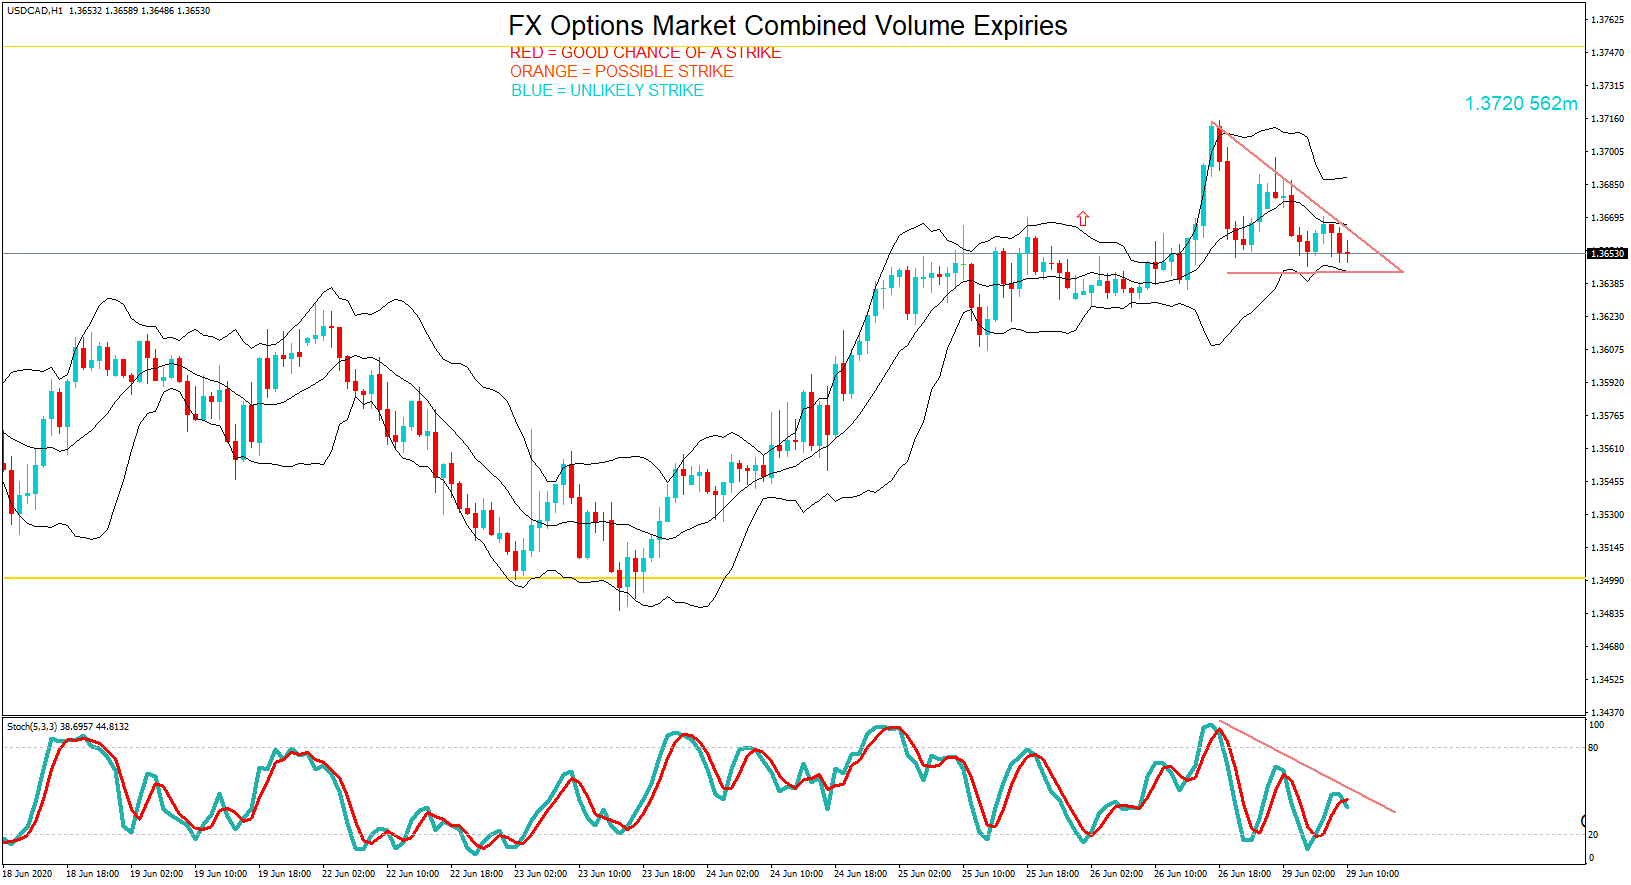
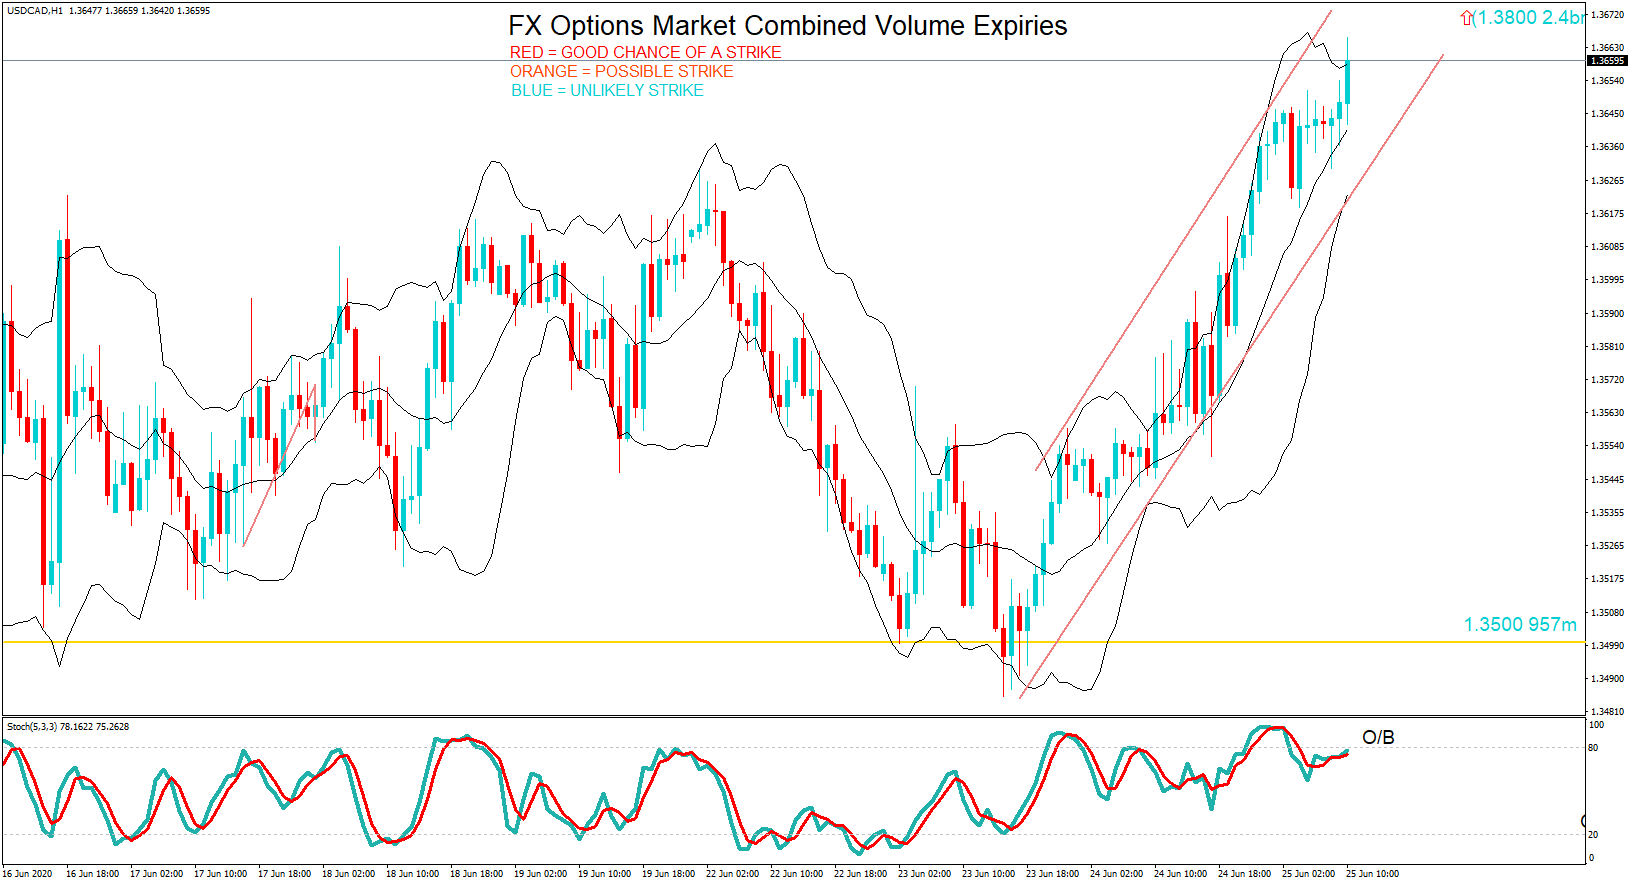
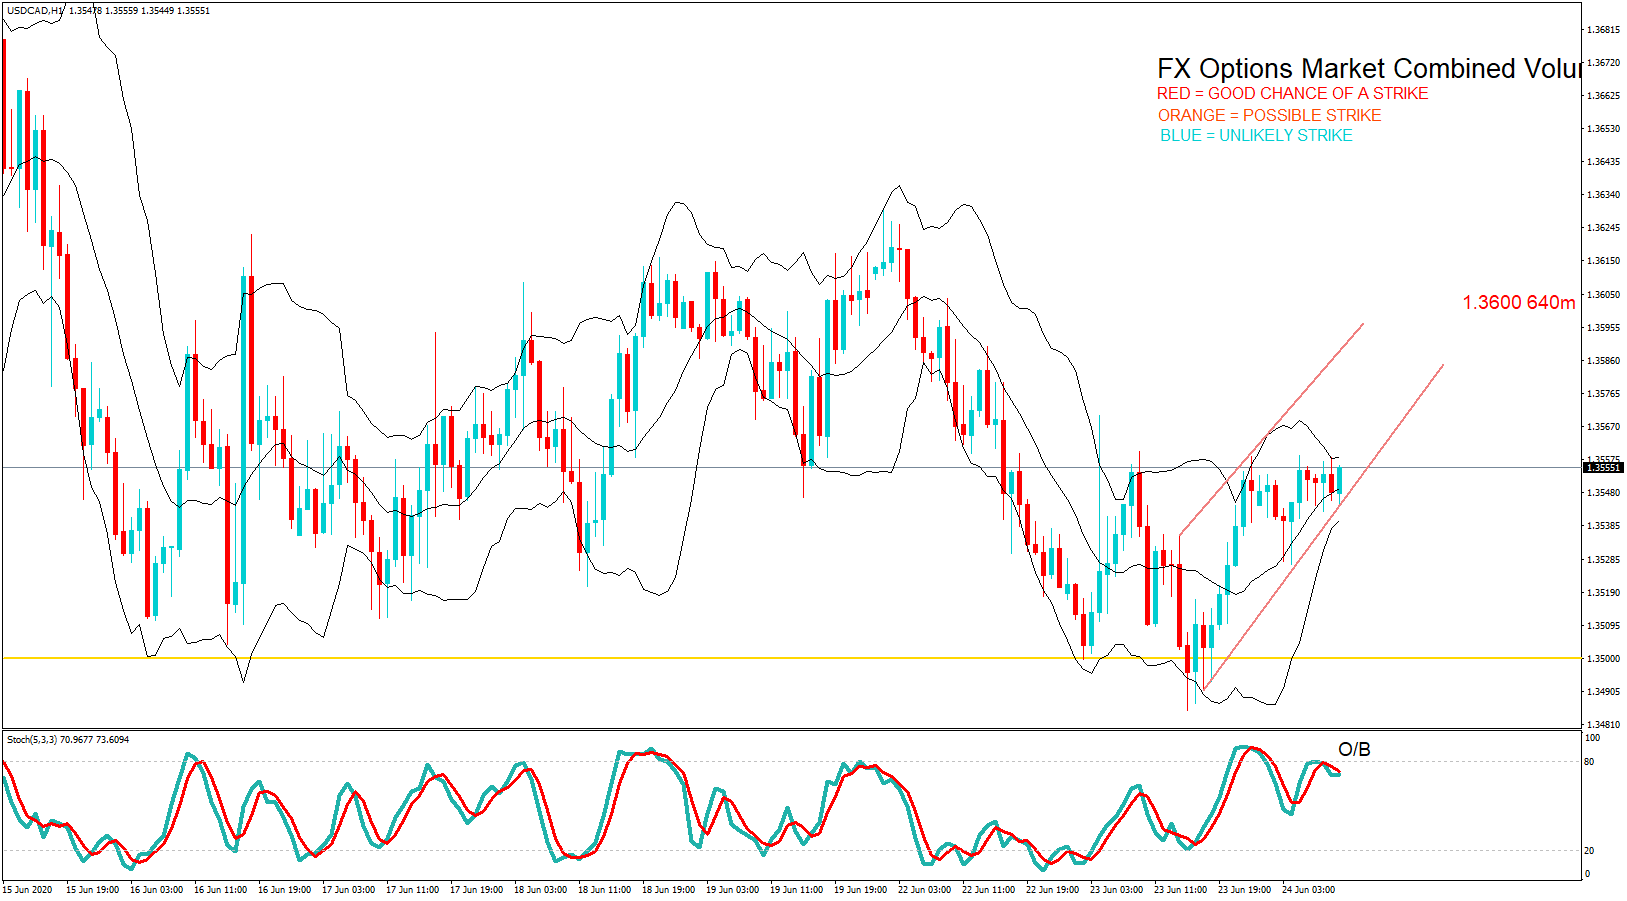
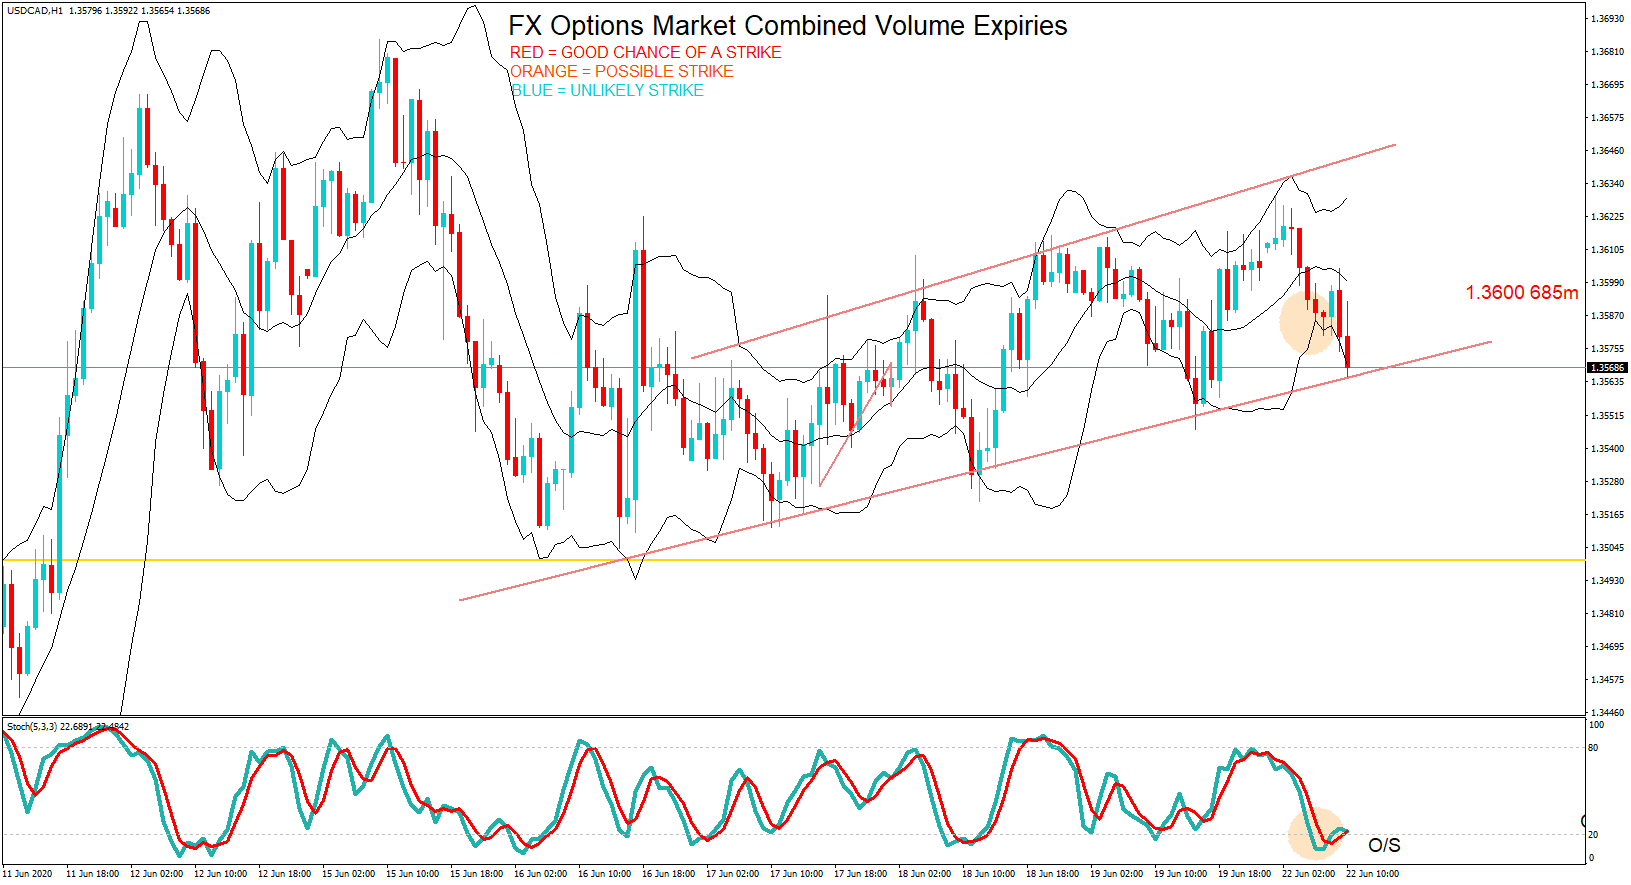
  • 1.3720 562m

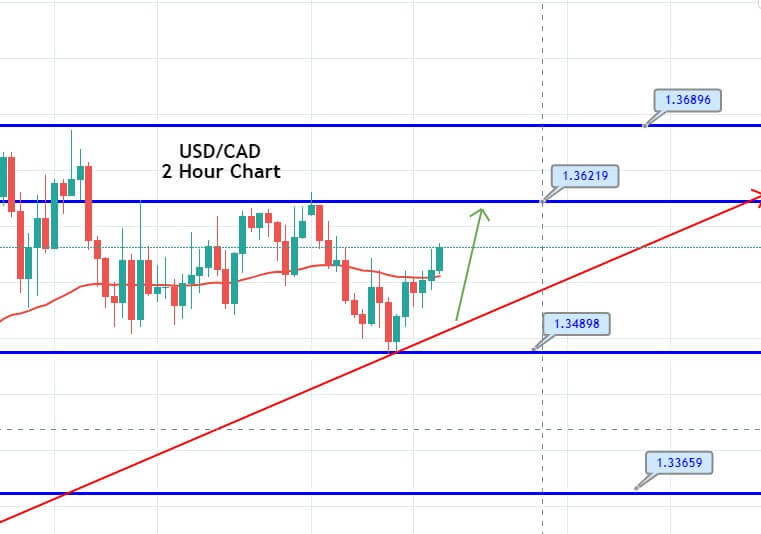
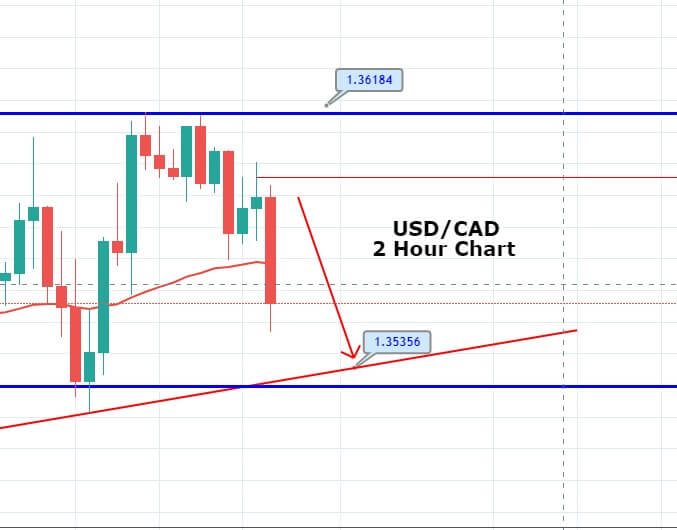
USDCAD is in a descending wedge formation. The squeeze to the downside looks likely leaving the option expiry at 1.3720 out of play.

………………………………………………………………………………..

As you can see on the charts we have also plotted the expiration levels at the various exchange rate maturities and we have also labelled in red, orange and blue.  Therefore, if you see option expiry exchange rates labelled in red these should be considered in-play, because we believe there is a greater chance of the expiry maturing at these levels based on technical analysis at the time of writing. There is still a lesser possibility of a strike if they are in orange and so these are ‘in-play’ too. However, if we have labelled them in blue, they should be considered ‘not in-play’ and therefore price action would be unlikely to reach these levels, which are often referred to as Strikes, at the time of the 10 AM New York cut.

Our technical analysis is based on exchange rates which may be several hours earlier in the day and may not reflect price action at the time of the maturities. Also, we have not factored in economic data releases or keynote speeches by policymakers, or potential market volatility leading up to the cut.

Although we have added some technical analysis, we suggest you take the levels and plot them onto your own trading charts and incorporate the information into your own trading methodology in order to use the information to your advantage. Remember the higher the amount, the larger the gravitational pull towards the exchange rate maturity at 10:00 AM Eastern time.

If you want to learn how forex option expiries affect price action in the spot FX market see our educational article by clicking here: https://bit.ly/2VR2Nji

DISCLAIMER: Please note that this information is for educational purposes. Also, the maturities will look more or less likely to become a strike at 10 AM NY time due to exchange rate fluctuations resulting in a different perspective with regard to technical analysis, and also due to upcoming economic data releases for the associated pairs.

Categories
Forex Daily Topic Forex Fundamental Analysis

Heard Of Germany’s ‘ZEW Economic Sentiment Index’?

Introduction

ZEW Economic Sentiment Index is a leading economic indicator that specially focuses on Germany and a few other countries. The correlation of the index with the growth is healthy. Hence, like any other business sentiment index, it is handy for our fundamental analysis to predict near-term economic activity, and identify potential opportunities.

What is the ZEW Economic Sentiment Index?

The ZEW Economic Sentiment Index is a sentiment index compiled out of the ZEW Financial Market Survey.  ZEW stands for Zentrum für Europäische Wirtschaftsforschung, which means the Center for European Economic Research.

ZEW Financial Market Survey 

It was introduced in 1991. A survey of about 350 analysts working at banks, insurances, and significant industrial firms are surveyed in a time frame of about two weeks. The proportion of participants from different sectors generally remains constant. It collects the general German sentiment or expectations with regards to the development of six international financial markets, especially Germany.

The panel of financial experts selected for the survey express their near-term expectations of the business cycle growth and progress, inflation rates, short and long term interest rates, stock market, exchange rates, and the oil prices. The survey questions aim to answer the situations in Germany, the USA, Japan, France, Great Britain, Italy, and the Euro-zone as a whole.

The experts are finally asked to assess the profitability of many economic sectors like banks, insurances, trade, construction, vehicle industry, chemistry, electronics, mechanical engineering, utilities, services, telecommunication, and information technology. Each expert forecasts on every category form a fraction that reflects different assumptions in percentages. The score from each individual in percentages are summed together to give an overall sentiment.

The results of this method, when it is applied to forecasted changes in the economic situation in Germany, is known as the “ZEW Indicator of Economic Sentiment.” The ZEW Indicator of Economic Sentiment is obtained from the results of the ZEW Financial Market Survey. It is computed as the difference between the percentage share of analysts that are bullish and those that are bearish towards the German economy in six months.

For instance, if 30% of the survey respondents predict the German economic situation to deteriorate, 20% expect it to remain the same as before, and 50% expect it to improve. The overall score of the survey would be a positive value of 20. It is a bullish reading and suggests that financial experts see positive signs for growth in the medium term.

Note: The IFO Business Climate Index is also a similar survey-based index that is popular in Germany. It is also a monthly report that surveys over 7,000 companies in Germany to obtain business condition sentiment for the near term. It measures business confidence and is also a leading indicator. It is a weighted index, meaning company scores are weighted in based on their contribution to the economy’s revenue.

However, the ZEW panel comprises of financial experts and is more diverse in its area of coverage as it also publishes estimates about other economic zones outside of Germany. IFO is business sentiment, while ZEW is economic sentiment, economic sentiment is a broader gauge, and hence, for our fundamental analysis, it is more useful.

How can the ZEW Sentiment Index numbers be used for analysis?

Sentiment Index in any country or any sector is the leading economic indicators for traders, investors, economists, and policymakers. Since the ZEW Sentiment Index is composed of a panel of financial market experts, people who are well-versed with the economy and business cycles throughout their career, their assessments generally have a strong correlation with actual GDP growth.

As with any sentiment index, the ZEW index also tends to be overly sensitive to changes in the economy, meaning the results sometimes would seem exaggerated but in the right direction. For our analysis, the direction of the economy is essential, and the magnitude can be understood over time with historical data.

Overall, the Economic Sentiment Index is helpful for us to predict the upcoming six-month changes with a good amount of certainty.

Impact on Currency
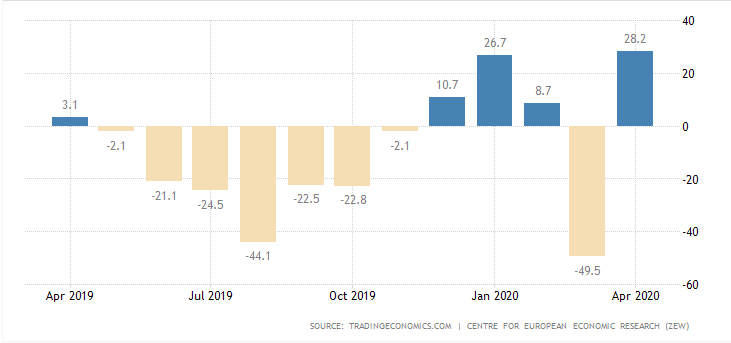
Market volatility is sensitive to Economic Sentiment Indexes. Significant moves in the index cause volatility in the market. It is a leading indicator. The above picture is a snapshot of ZEW for the past one year.

High Positive Economic Sentiment Index figures translate to improving economic prospects, which will translate to higher GDP prints and currency appreciation. Low or NegativeEconomic Sentiment Index figures translate to possible business slowdowns in the near-term, in extreme cases, even a recession. It will translate to the contracting economy, and lower GDP print, and thereby leading to currency depreciation.

Economic Reports

The ZEW Economic Sentiment Index is released every month on its official website, with insightful comments on different sectors. The IFO reports and ZEW Economic Sentiment Index are the two popular Sentiment Indexes in Germany.

Other companies also publish Economic Sentiment numbers, and IHS Markit Group is one such company that puts out numbers on the international scale for many countries. Internationally, IHS Markit business surveys are popular, but within Germany, ZEW is more popular amongst the traders, investors, policymakers.

Sources of ZEW Economic Sentiment Index

We can monitor the reports on the official website of the ZEW.

We can also go through the Sentiment Index of other countries here.

We can also find the aggregated statistics of all business confidence indexes for various countries here.

Impact of the ”ZEW Economic Sentiment Index” news release on the Forex market

In the previous section of the article, we understood the ZEW Economic Sentiment fundamental indicator, which essentially rates the outlook of an economy for a six-month period. On the index, a level above zero indicates optimism, below indicates pessimism. It is a leading indicator of economic health.

The reading is compiled from a survey of about 350 German institutional investors and analysts. Therefore, it is given a fair amount of importance from investors, especially when analyzing growth in the Eurozone. The ZEW financial market survey covers a number of areas, sectors, and regions which are used to create the ZEW Economic Sentiment.

In this part of the article, we will examine the impact of the ZEW Economic Sentiment indicator on the value of various currencies involving the EUR and witness the change in volatility. For that, we have collected the latest data of ZEW Economic Sentiment, which was published in the month of April. We can see in the below image that the index jumped by a huge margin in April 2020, which was well above market expectations.

EUR/USD | Before the announcement
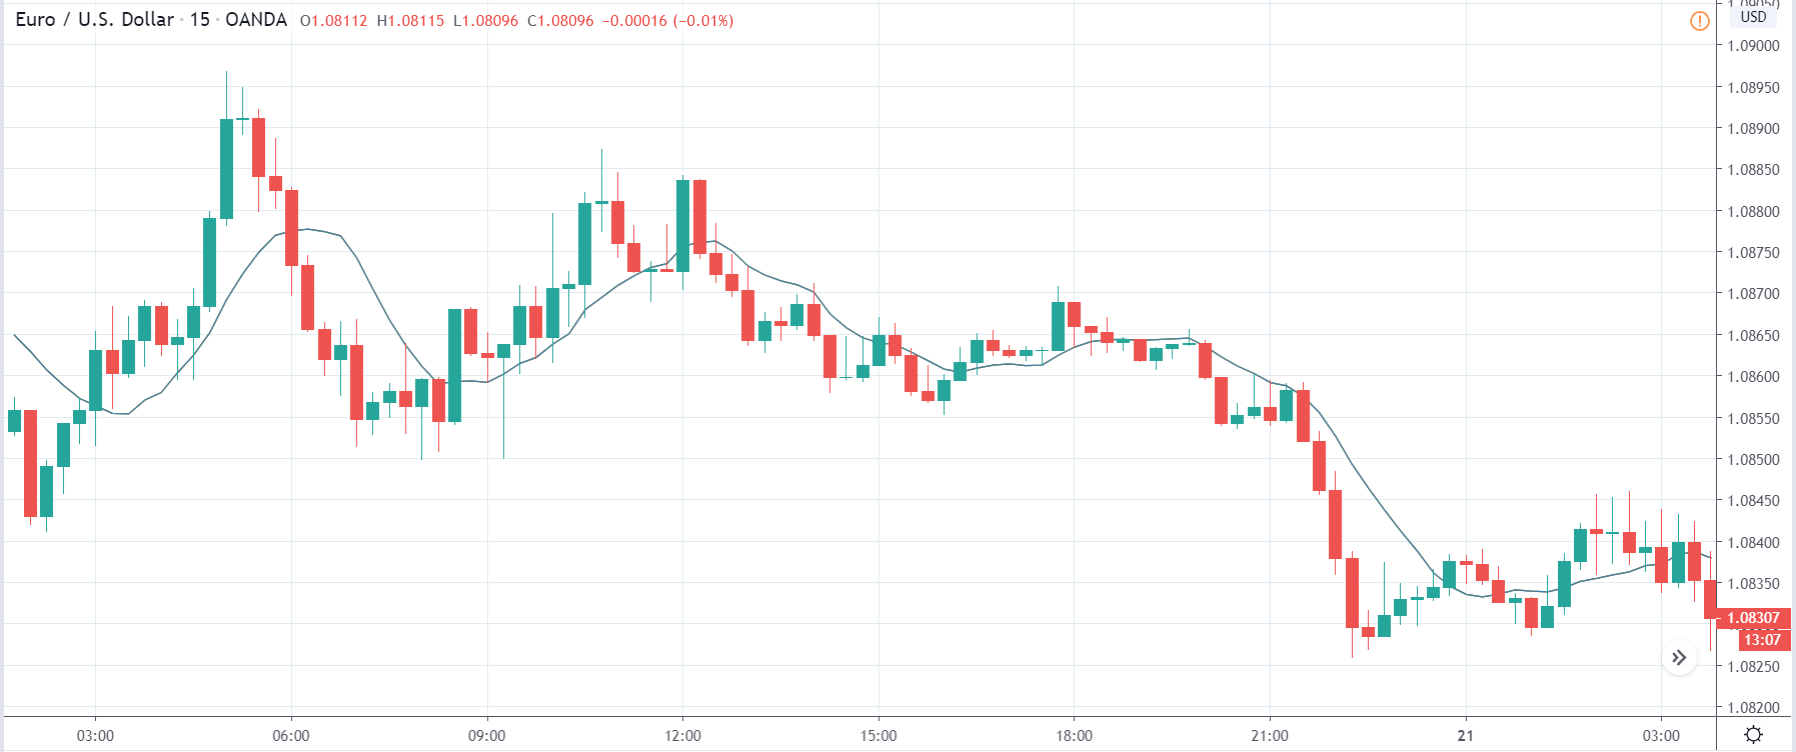
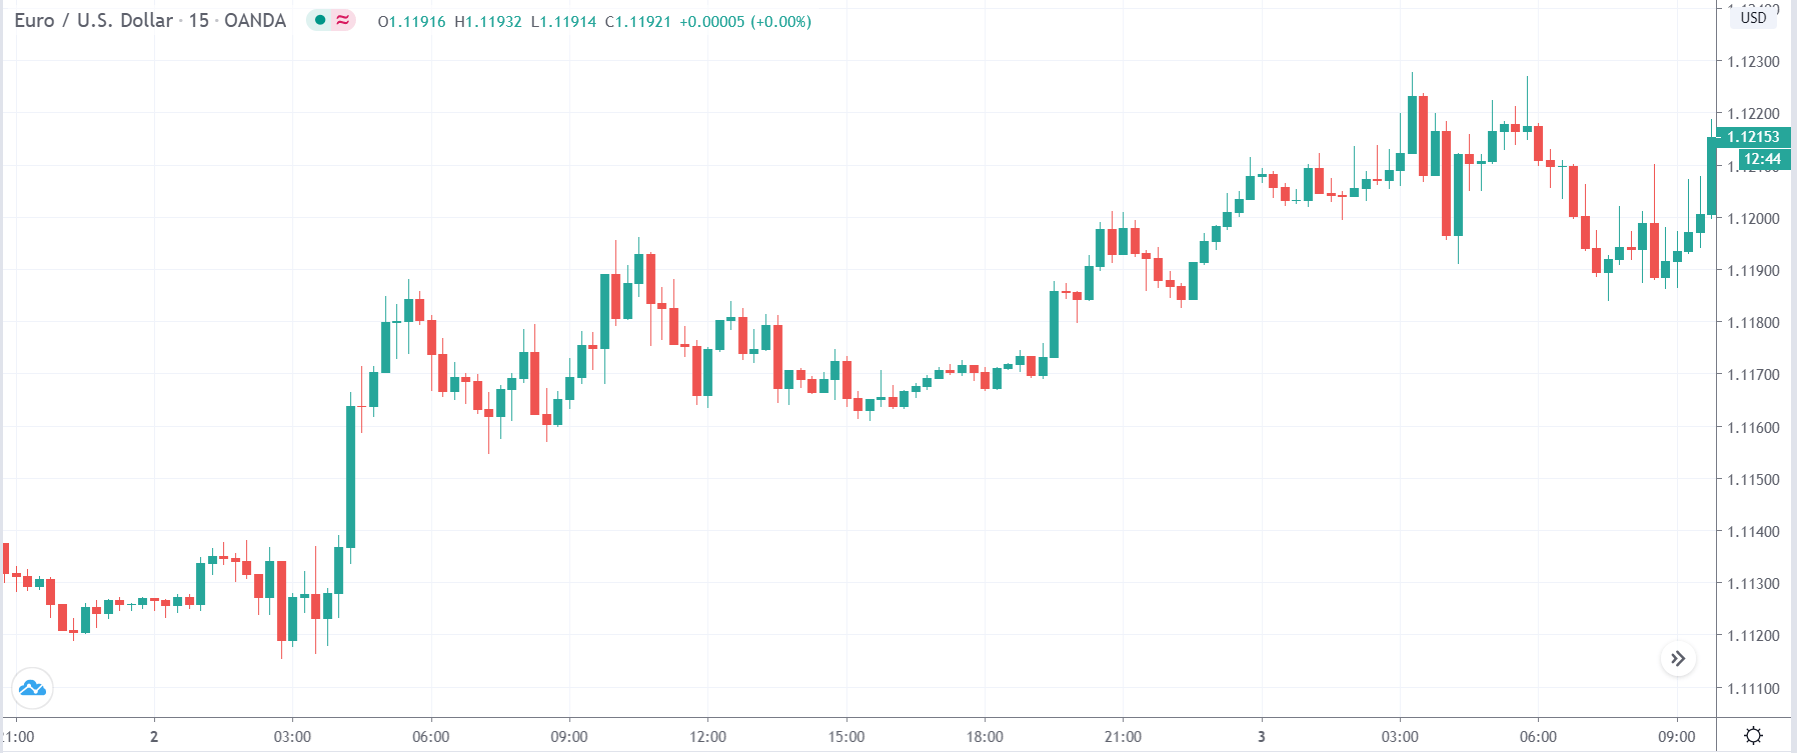
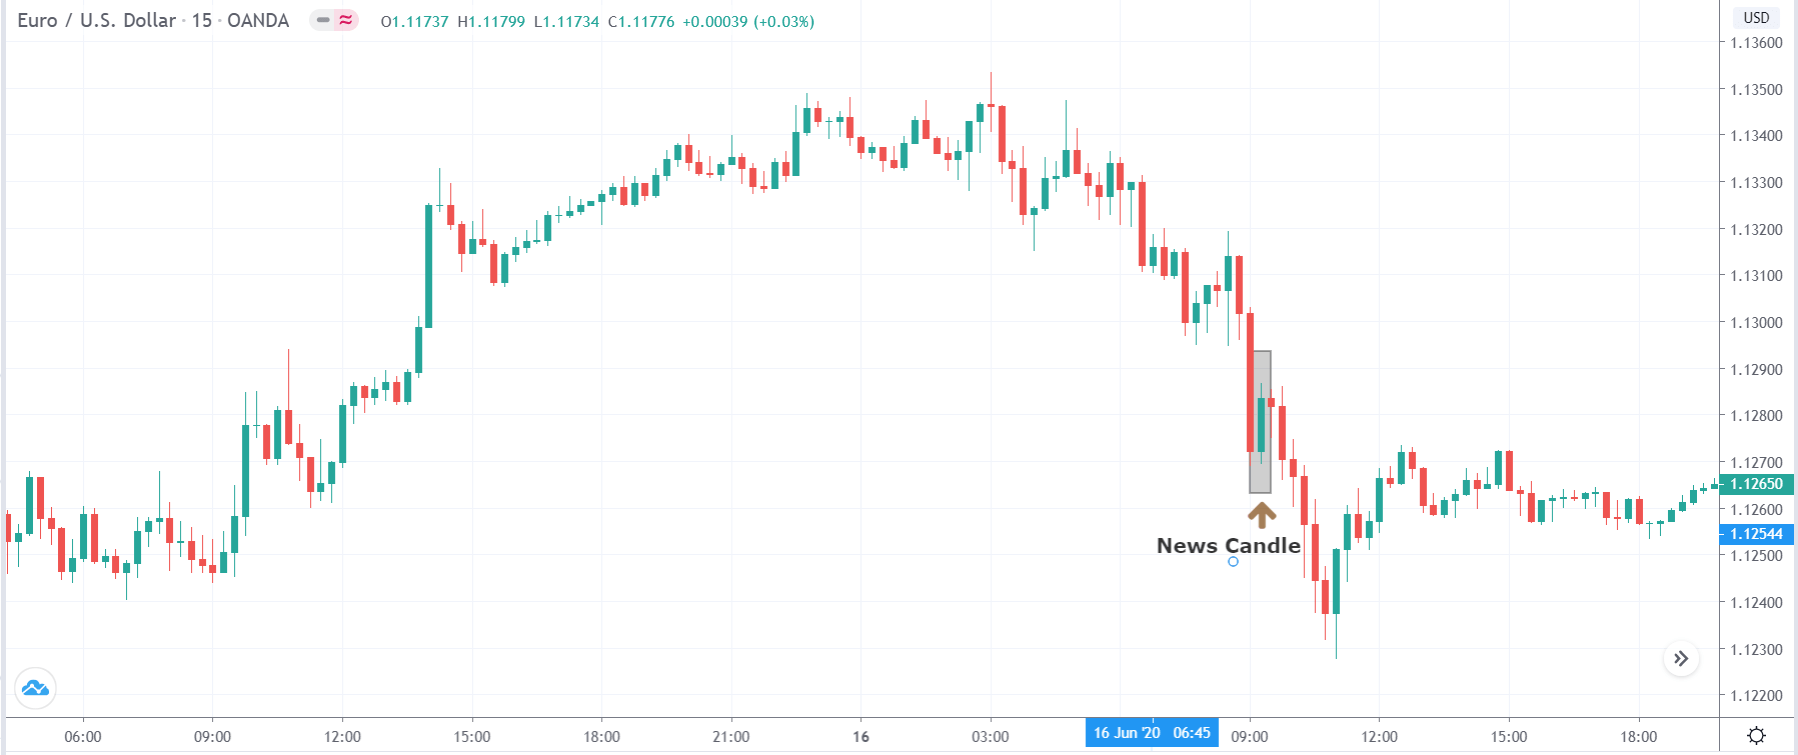
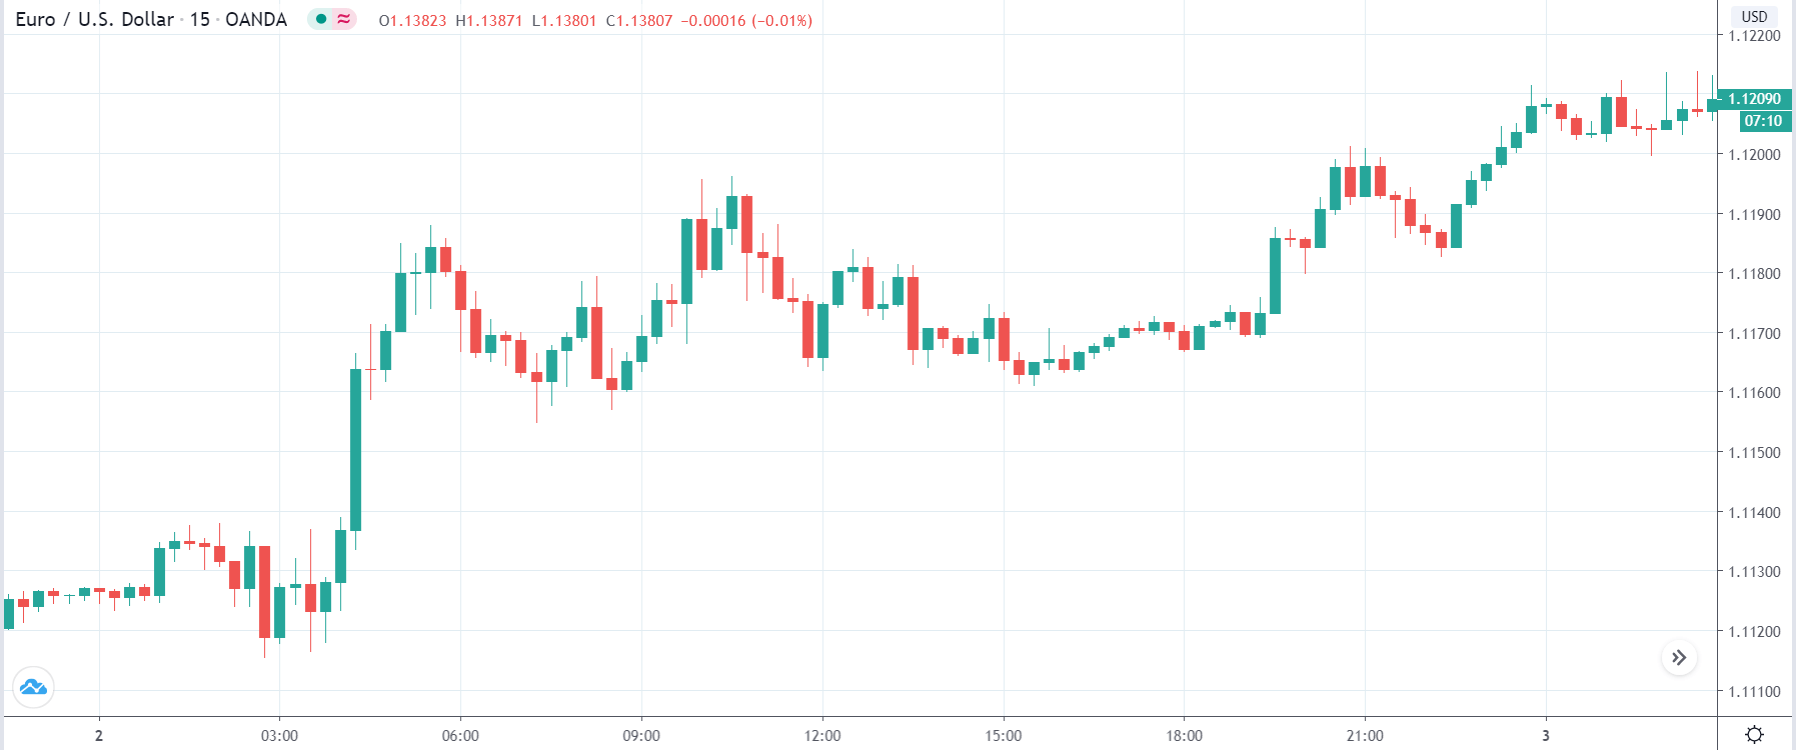
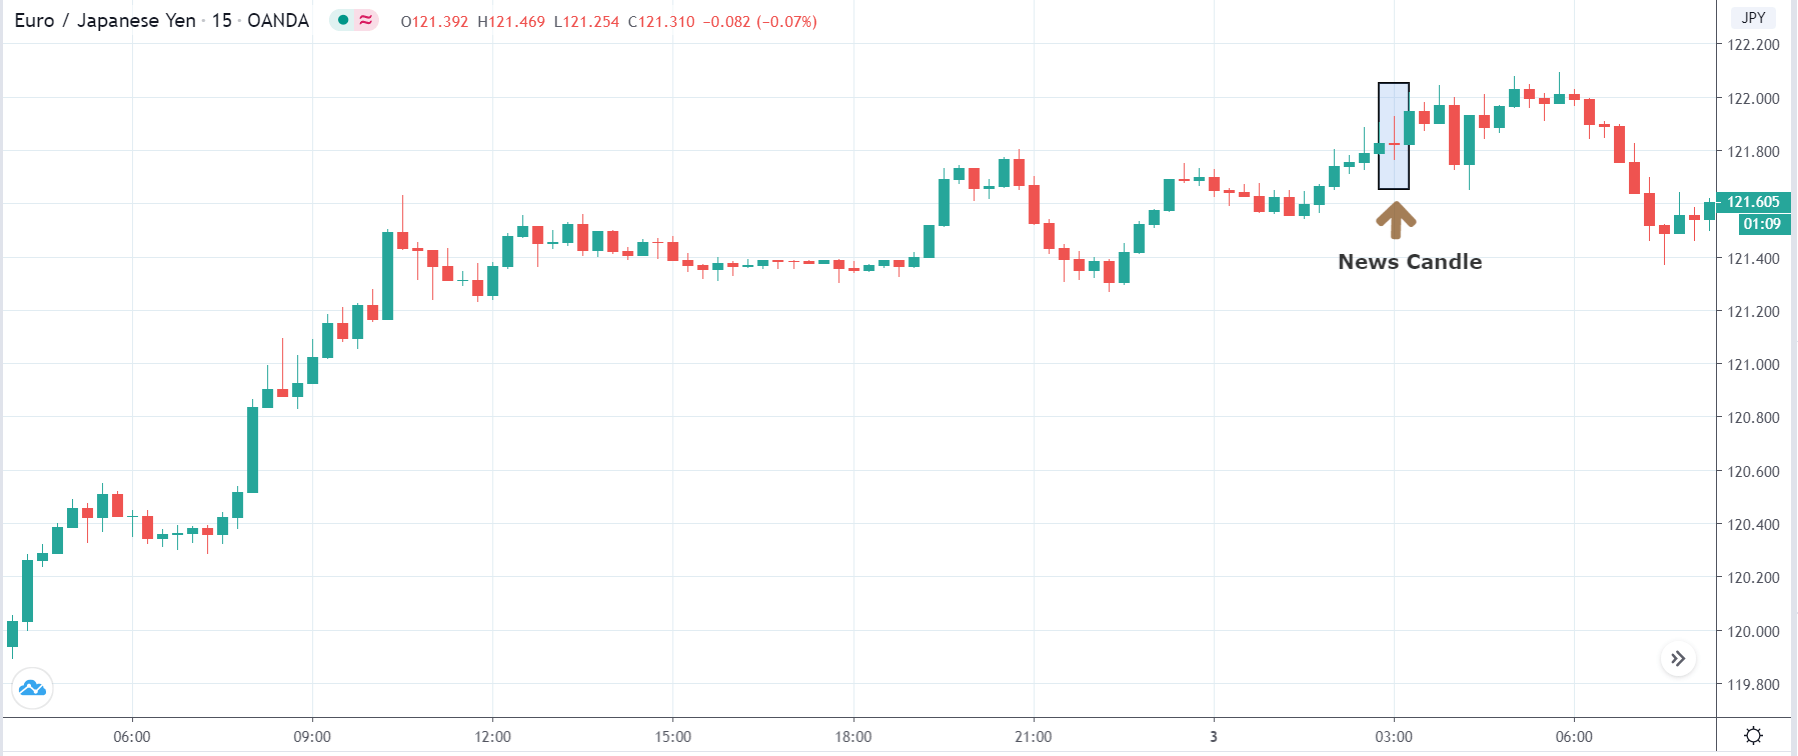
Let us start with the EUR/USD currency pair to observe the impact of the ZEW Economic Sentiment Indicator on the value of EUR. The above image shows the state of the chart before the news announcement, where we see that the price is in a downtrend, and very recently, the price has formed a ”range.” Just before the news release, the price is at the bottom of the ”range,” so we can expect buyers to come back in the market, initiating some strength in the Euro.

EUR/USD | After the announcement
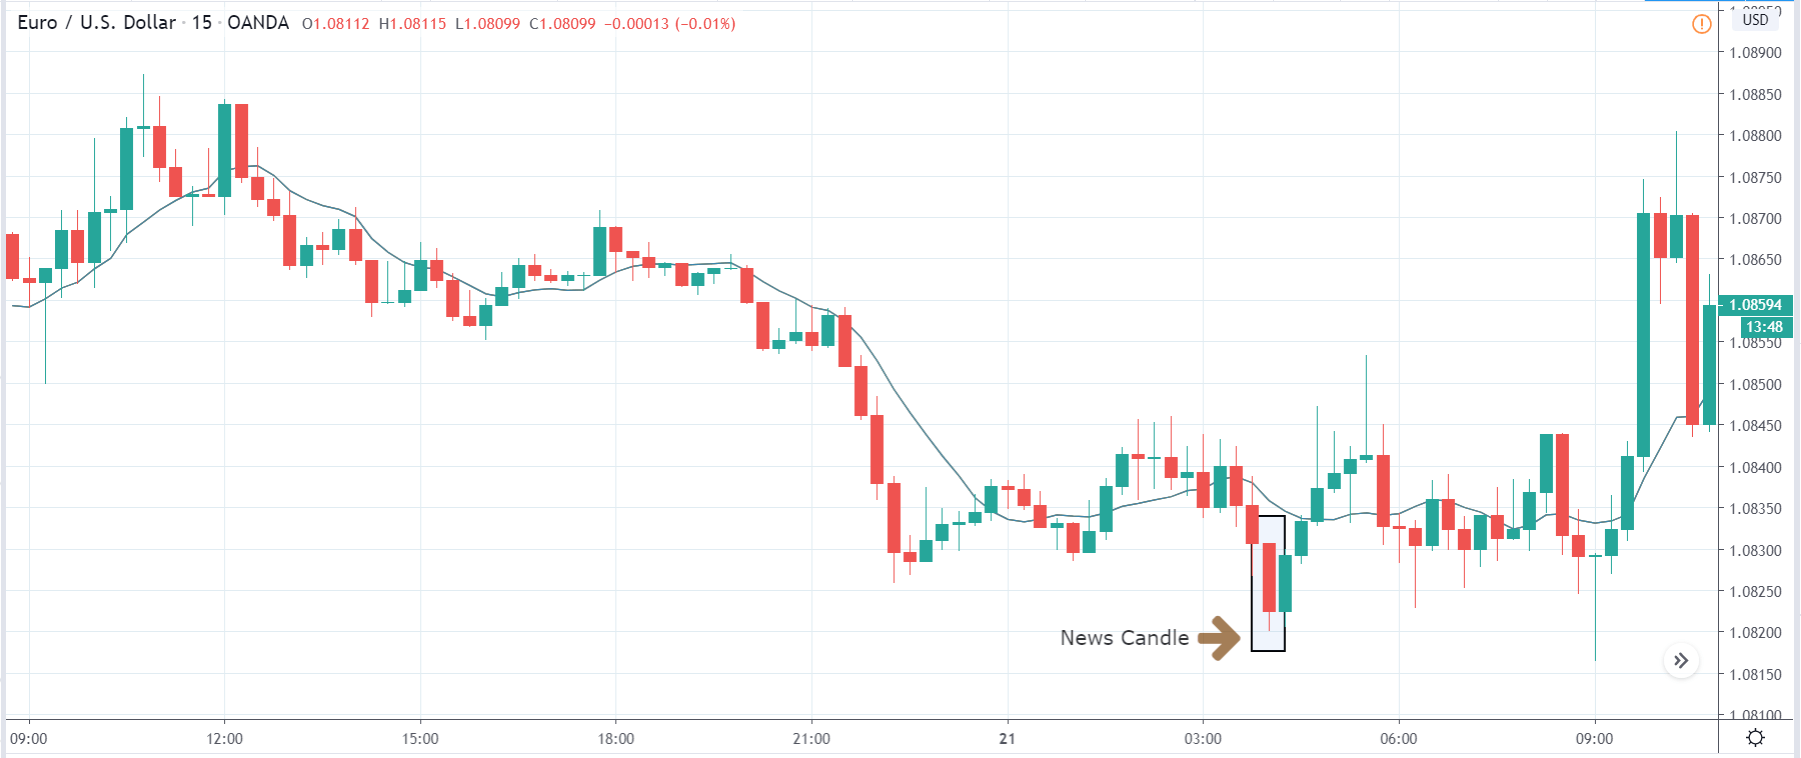
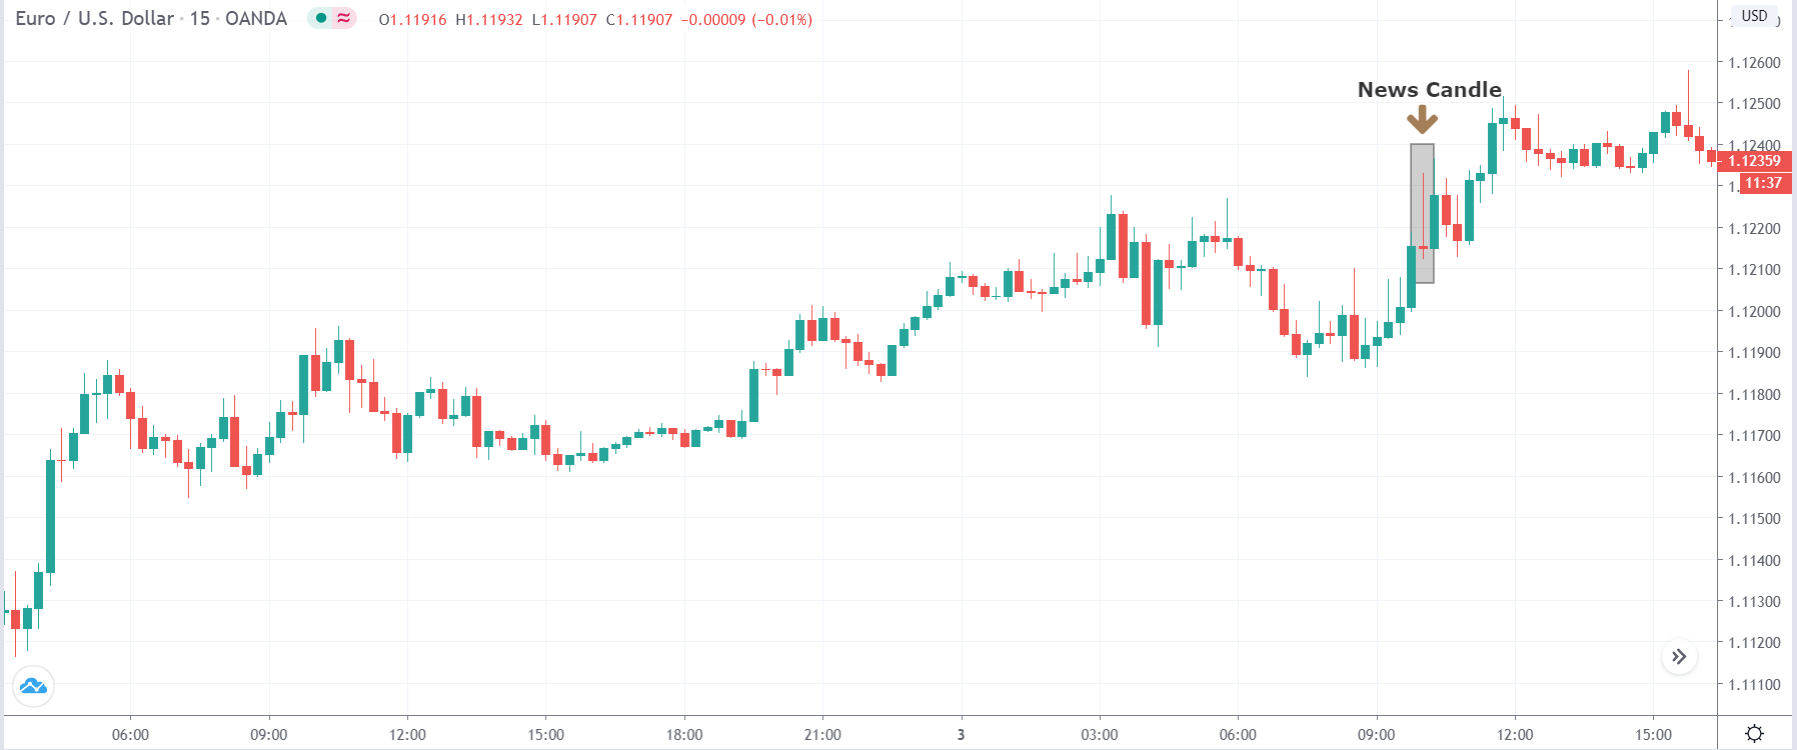
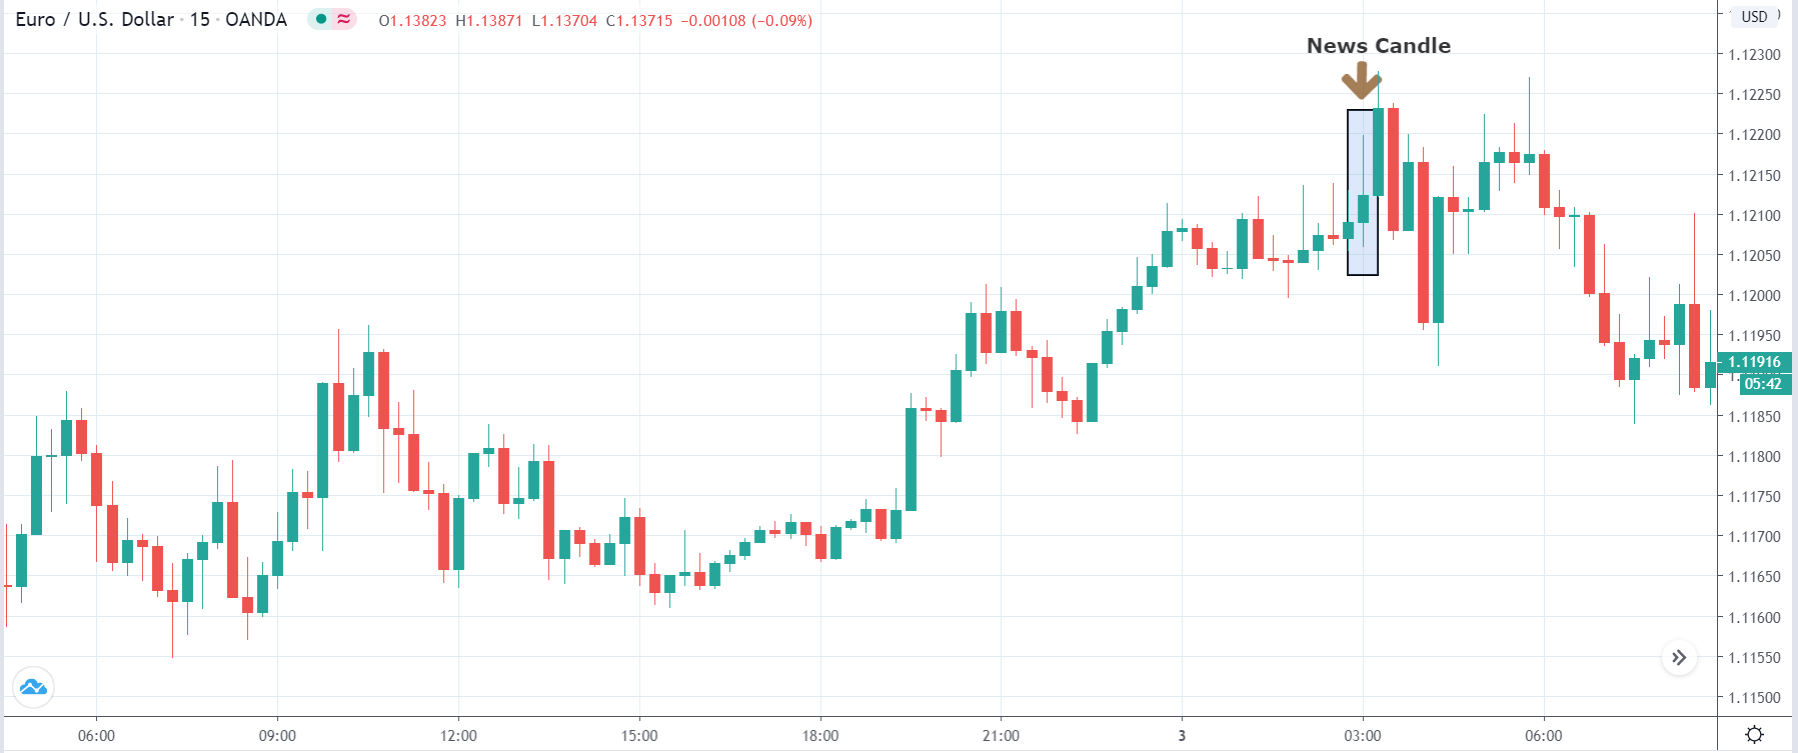
After the news announcement, market crashes below the ”support” of the ”range” and volatility increases to the downside. Although the ZEW Economic Sentiment was extremely positive for the economy, market participants do not by Euro immediately at the ”news candle,” but instead, we see a rally in the price after the close of ”news candle.” Thus, we witness moderate volatility in the currency pair after the news release.

EUR/CAD | Before the announcement
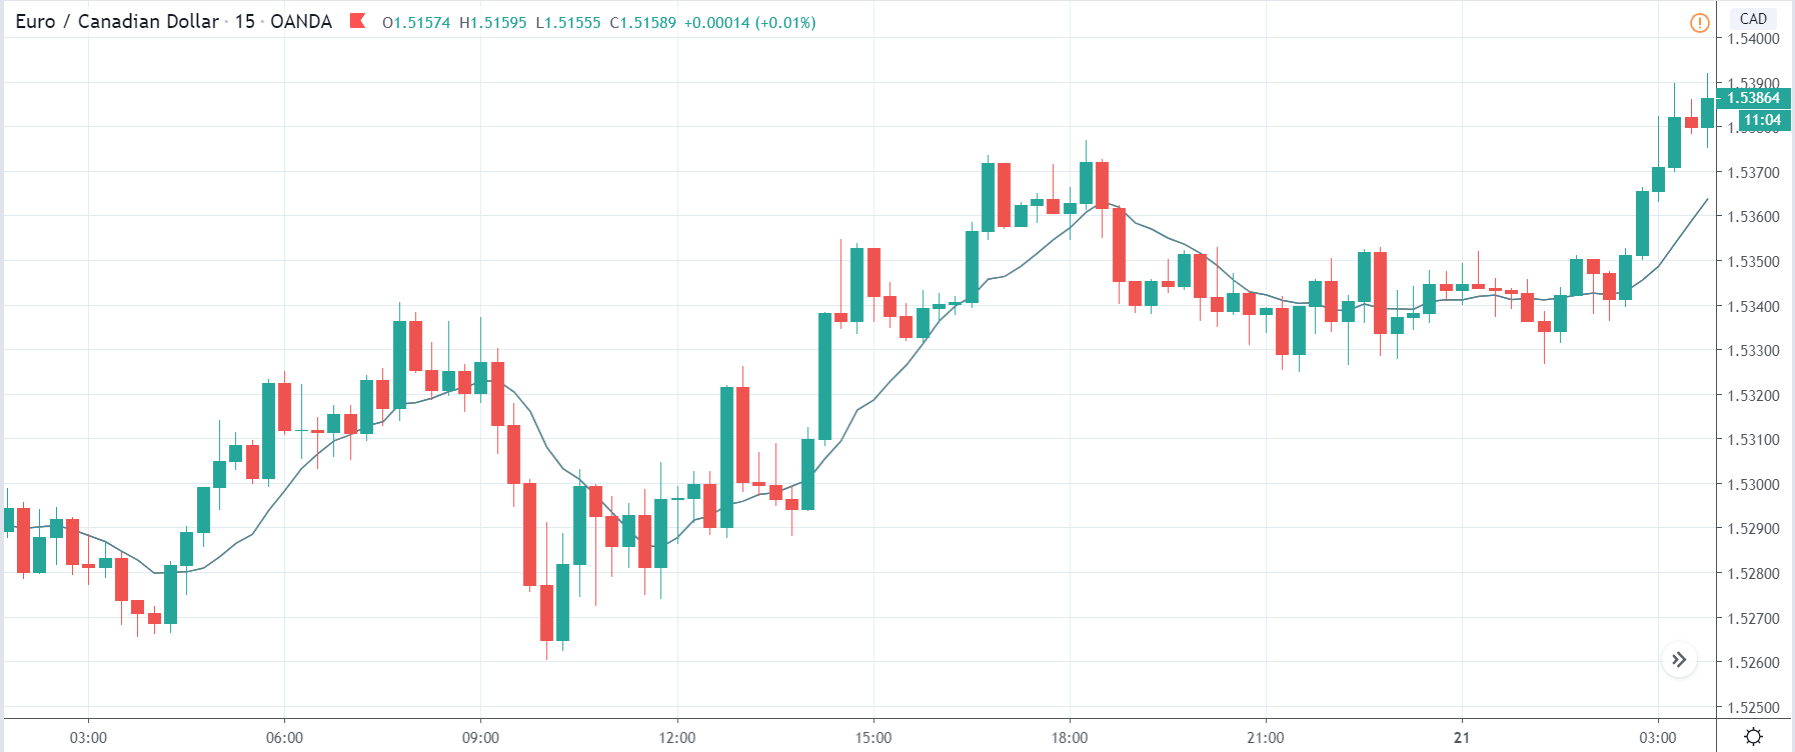
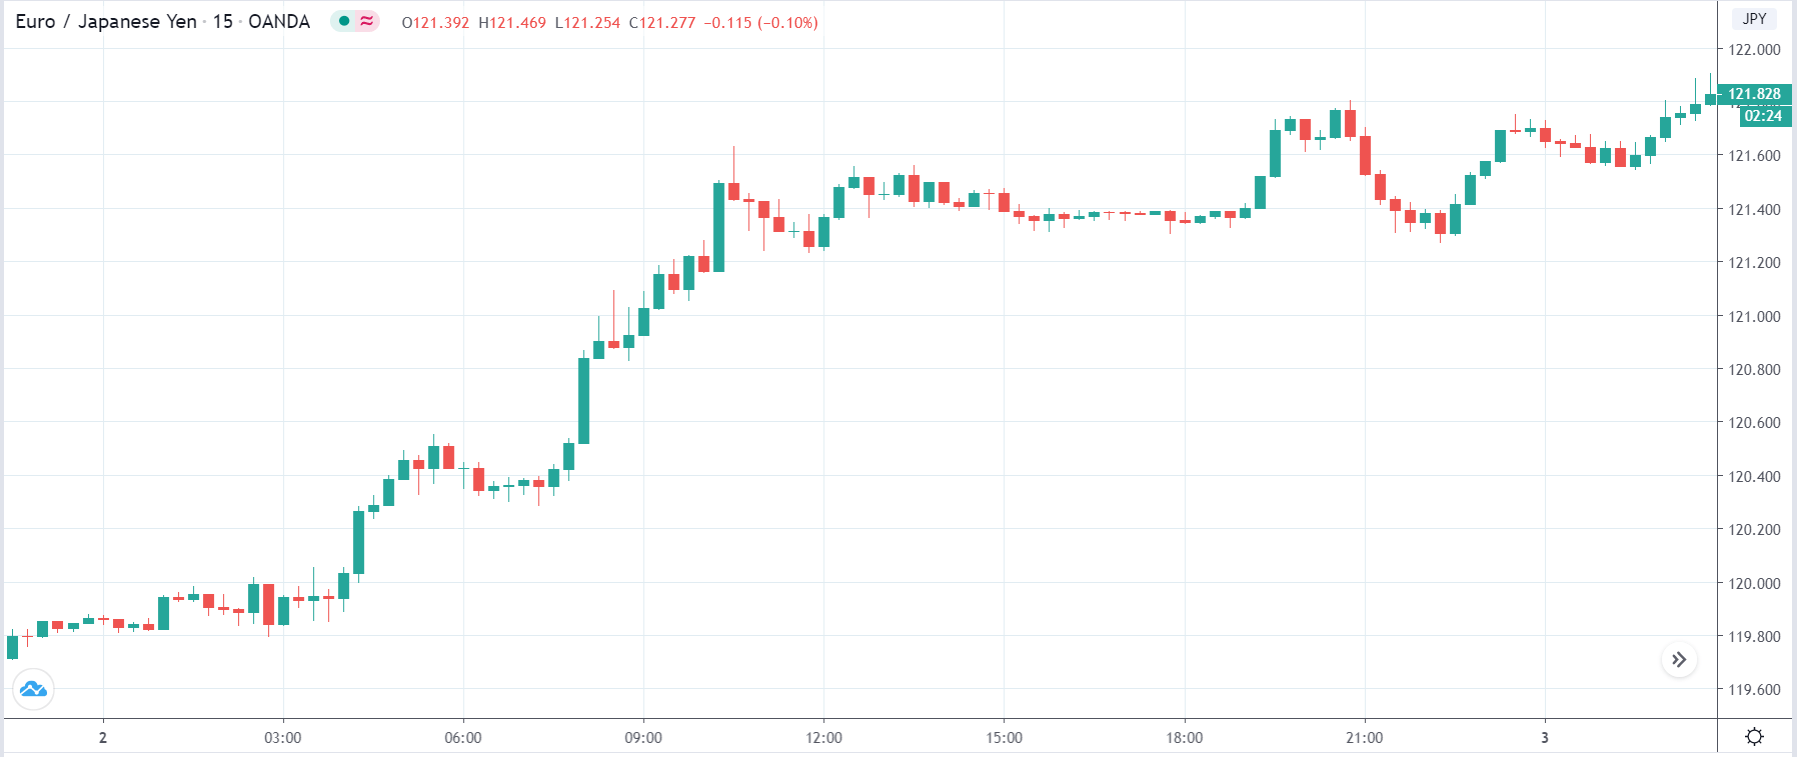
The above images represent the EUR/CAD currency pair, where, in the first image, we see that the market is in an uptrend signifying strength in the Euro. Currently, the price is at its highest point, crossing the previous ”higher high.” As per the technical analysis, we should wait for price retracement to a ”support” or ”demand” area in order to join the trend. Depending on the impact of the news release, we will position ourselves in the currency.

EUR/CAD | After the announcement
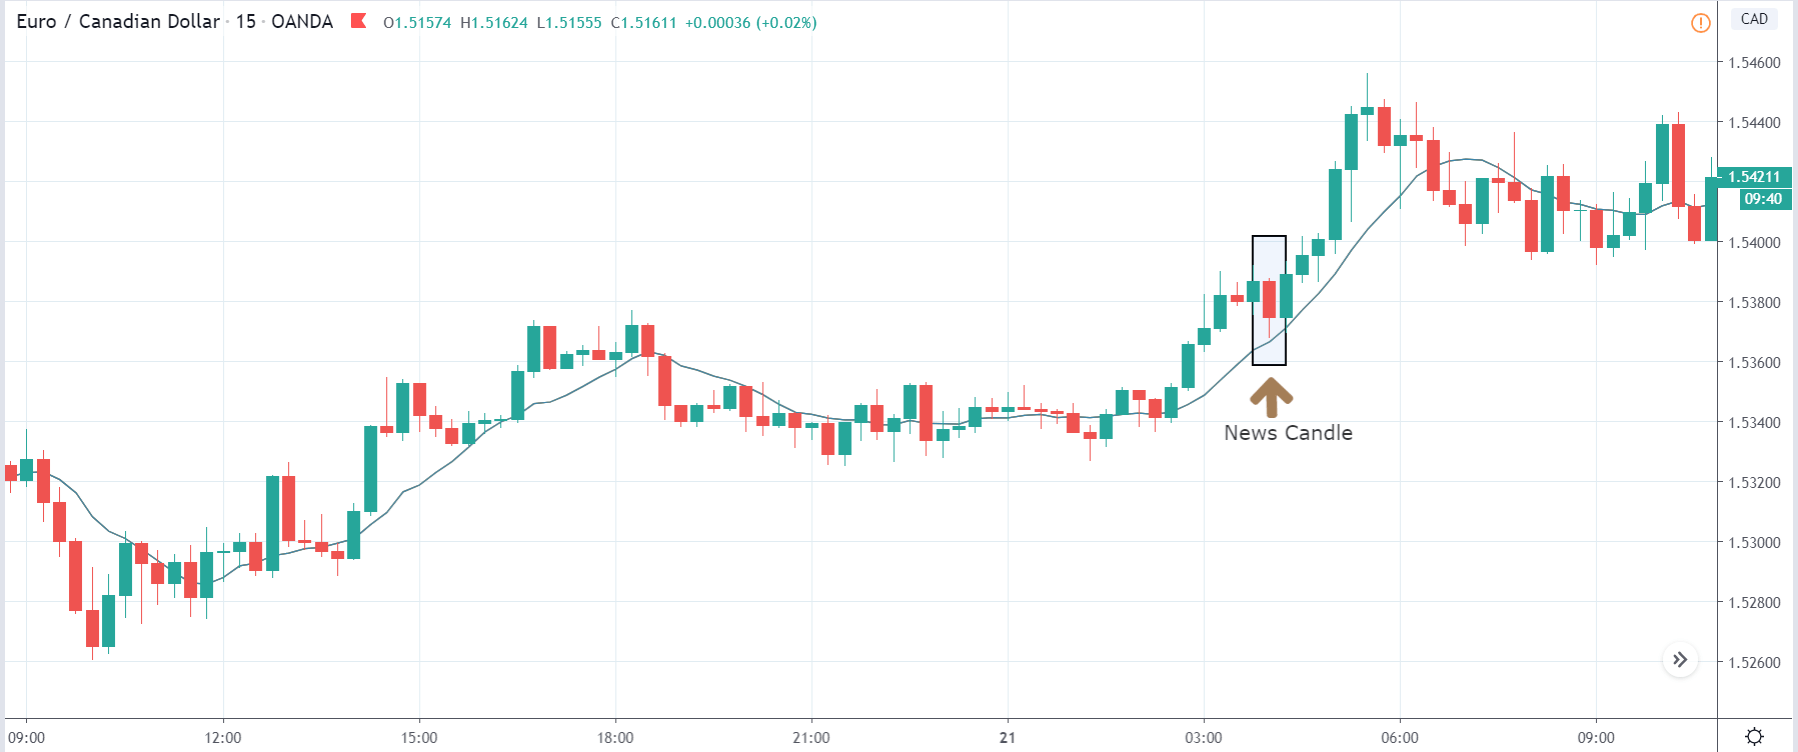
After the news announcement, the price initially falls lower due to volatility, but it does not sustain at that level where the buyers immediately take the price higher. We can see that the market bounces exactly from the moving average and continues to move higher. The market is seen to react oppositely to the ZEW Index at the time of release, but one should not conclude the impact of news from just one candle.

EUR/AUDBefore the announcement


EUR/AUD | After the announcement
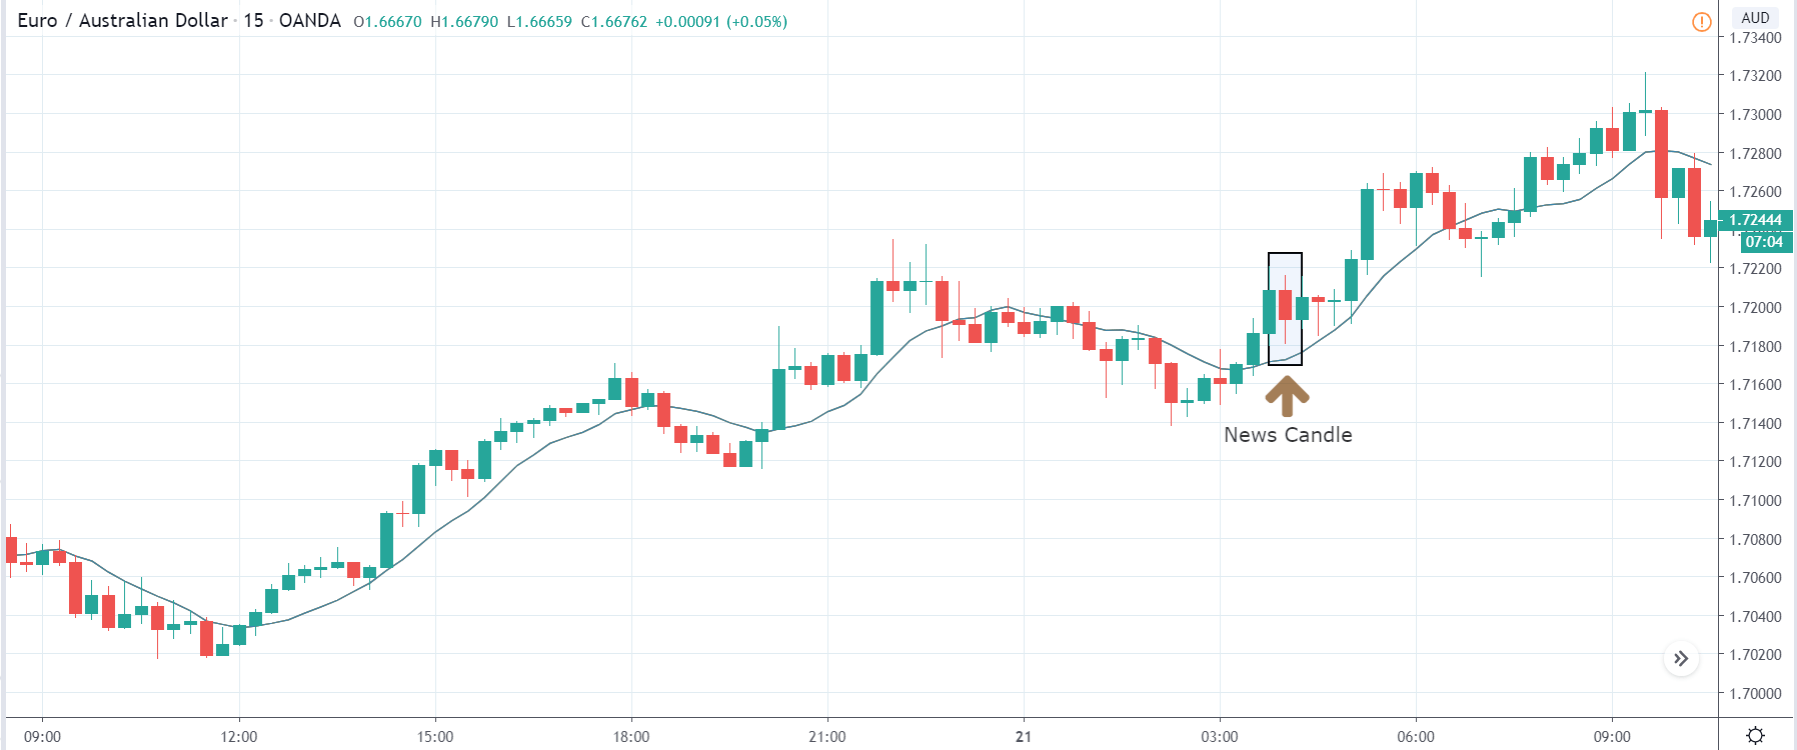
The above images are that of the EUR/CAD currency pair, where we see that before the news announcement, the market is in a strong uptrend again, signifying the great amount of strength in the Euro. Just before the release, the price appears to be at the ”supply” area, which means we should expect some selling pressure from this point. A breakout trade is possible if the price sufficiently breaks the ”supply” area.

After the news announcement, we witness slight bearishness in the currency but was not large enough to cause a reversal of the trend. We see that the price only hovers at the ”supply” area, with no major impact, which results in a breakout.

That’s about the ‘ZEW Economic Sentiment Index’ and the relative impact of its news announcement on the Forex price charts. Let us know if you have doubts regarding the article in the comments below. Cheers!
Categories
Forex Videos

The Golden Rules of Trading III


The Golden Rules of Trading III – Trading like a Business

The majority of new participants approach Forex trading with no idea in mind but to trade and win. They did not make a plan, and their objectives aren’t clear as well. They enter the market with one dream: getting rich, starting with a $1,000 or less trading account. Usually, they did not make a plan, don’t know the needed skills, their strengths, and weaknesses, and think that trading is just predicting the market. The outcome of this mindset is failure and frustration. To succeed, trading must be considered as a business.
In this video, we are going to talk about the importance of treating trading like a business.


1.- Initial Assessment
You need to create an initial assessment document. On it, you’ll need to define the following:
Your current beliefs about yourself and the market. Your vision about you, your life, and your goals.
List your strengths ( what are you good at- programming, recognizing patterns, math skills…)
List the resources you will need
Determine your weaknesses and how to overcome them.


2.- Establish your objectives
Set your monthly profits goal, then divide it by 20 to determine your daily profits goal. Finally, establish how many market signals you take on average using your trading plan and decide on your average profit per trade.
Define your tolerance for drawdowns. Will you allow 10%, 26%, 40%, or higher max drawdown? Max drawdown is a critical value you should know for you to set your dollar risk per trade. That was dealt with already, but let’s remember the key fact: Max drawdown, together with the percent losers of your system will help you set a likely max losing streak. For example, a well known trend-following system with only 35% winners will sometimes show up to 20 losers in a row. If a trader using this system establishes its max drawdown to 30%, the dollar risk per trade must be set to 30%/20, which is 1.5% risk. Determine how much you will pay yourself and what percentage of your profits will be reinvested to grow your trading account.


3.- Operating rules and contingency plans:
Establish the maximum number of consecutive trades you’re going to take
Set the maximum daily dollar losses you will accept before stopping to trade for the day
Set the maximum dollar gains you are going to take before halting your day-to-day operations. That way, you keep your trading rational, avoiding losses due to your child’s side take control.
Define also your weekly and monthly loss sizes. In the case these amounts are reached, you should switch to paper trades until the next week or month.
Establish a trading record with the relevant information needed to measure and analyze your performance and the system’s improvement/adaptation to the current market conditions.
Define the reviewing period for the performance analysis of your systems. Use statistical methods to analyze them.

4.- Markets, Timeframes, diversification
Define the best timeframe for your needs and time availability. Please beware that shorter timeframes are more costly because the costs of trading (commissions, spreads, and slippage) do not change, but the trading ranges shrink, and so do your profits.
Define your basket of pairs to trade. Criteria for the list should include liquidity, volatility, and trendiness. Avoid illiquid markets or excessive volatility.
Ensure diversification to lower your overall risk. For instance, trading only major pairs will be sensitive to the dollar movements; thus, a sharp dollar move against you will affect all your trades at the same time. In this case, make sure you have 50% of your positions long the dollar and 50% short the dollar.
Know the big picture of all the pairs on your basket. We should remember that Fundamental Analysis is the driver of the underlying trend, and that surprising figures will trigger price shocks.

5.- A basket of Systems
Make sure your systems have an edge and that the average Reward/risk ratio is greater than one.
System diversification: Use at least two different and facing systems. One of them might be a trend-following system, while the second system fades the trend. That will help when there are no trends, and the pair is ranging. Sometimes one will lose, and the other one will win. If both systems are profitable, the long-term result will be the sum of their performance, but the downside is limited, as one of them will tame the other system’s losses.
Use the position sizing as explained above, ensuring that your maximum risk per trade is limited to fit your preferences for drawdown.
Continue developing new ideas and strategies, doing paper trading on them if the backtests are worthwhile.

Categories
Forex Signals

EUR/JPY Breaks Below Descending Triangle – Brace for Selling! 

The EUR/JPY failed to extend its early-day bearish moves and rose well above 119.820 support levels, mainly due to bullish correction. It seems like a sharp rise in the coronavirus cases in Europe and on-going tensions between the EU-US undermined the shared currency and kept a lid on any additional gains in the pair, at least for now. Currently, the EUR/JPY trading at 120, holding right below an immediate resistance level of 120.193. However, the hopes of the European Union (E.U.) Recovery Fund deal kept the positive tone around EUR/JPY pair high.

The mounting concerns about the second wave of coronavirus outbreak sent investors into the safe-haven assets. The warning of the World Health Organization that indicated the second wave of the virus was picking up the pace once again, with an average of 20,000 new cases per day and 700 daily deaths in the Old Continent. In the meantime, the U.K. reported 149 further coronavirus-related deaths in the past 24 hours, as U.K. health experts warned about an imminent second wave of the virus due to the government early- lifting of lockdown measures.

Moving on, the directionless sentiment surrounding the currency pair could be long-term as the US-EU trade war continues to increase and could see the E.U. and Washington move forward with more tariffs through the rest of the year. Besides this, the shared currency Euro gained further support upon the reports from the President of the European Commission that the European Union (E.U.) Recovery Fund that the deal should be agreed before the summer holidays. 

Looking forward, the market participants will keep their eyes on the broader market sentiment on Friday. The European Central Bank President Lagarde will be under the close eye during her speech at 07:00 GMT, as she will likely reiterate willingness to provide additional stimulus and stress the requirement for more work on the fiscal front.


Despite positive fundamentals, the reason for opening a sell trade was to capture a quick sell in the EUR/JPY. As you can see on the hourly timeframe, the EUR/JPY has closed shooting star right below downward trendline and 50 periods EMA which suggests bearish sentiment amount investors. Thus, we entered a sell position below 119.934 to target 119.534 today. 

Entry Price – Sell 119.934  

Stop Loss – 120.334    

Take Profit – 119.534

Risk to Reward – 1

Profit & Loss Per Standard Lot = -$374/ +$374

Profit & Loss Per Micro Lot = -$37.4/ +$37.4

Categories
Forex Basic Strategies

Trading The Forex Market Using The ‘Pendulum Strategy’

Introduction

In the previous set of articles, we developed techniques and strategies using the most important technical analysis indicators. We also discussed how one could enter the market and make the most out of those strategies. In today’s strategy, we shall discuss a technique that will help us to anticipate a range and trade in the later stages of the range formation.

Time Frame

The suitable time frame for this strategy is the hourly (H1) or 4-hourly (H4) chart. This means each candle on the chart represents 1 hour or 4 hours of price movement, respectively. This does not mean one cannot use the strategy on the 15 minutes or daily time frame. The only difference is that it is difficult to spot trading opportunities on those time frames.

Indicators

We will not be using any indicators for this strategy. The strategy is more price action based.

Currency Pairs

One should note that this strategy is suitable for all currency pairs listed on the broker’s platform. However, it is recommended to trade only in the seven major currency pairs, as the patterns are clearer in these currency pairs.

Strategy Concept   

A pendulum in motion swings back and forth because gravity is pulling it back to the normal position every time it swings away from it. The pendulum reaches a maximum height before it starts to fall back. However, if the swinging force is a lot, the string holding the pendulum will be cut, and the pendulum will fly off.

A ranging market acts similarly to the pendulum. Every time prices pull away from the mid-point of the range towards the top or bottom end of the range, market forces pull it back towards the mid-point of the range. However, sometimes when the market gains enough momentum, prices will break the support and resistance of the range and move into a trend.

In this strategy, we wait for the pendulum to reach it’s optimal height and fall before entering the trade. We do this by executing a trade after the prices bounce back at the 10% market from either support or resistance. Our first target is set at 50% of the range, and the second target is set at the 90% mark of the range.

Trade Setup

We used the EUR/USD currency pair to illustrate the strategy, where we will be discussing a ‘long’ trade. Here are the steps to follow in order to execute the pendulum strategy.

Step 1

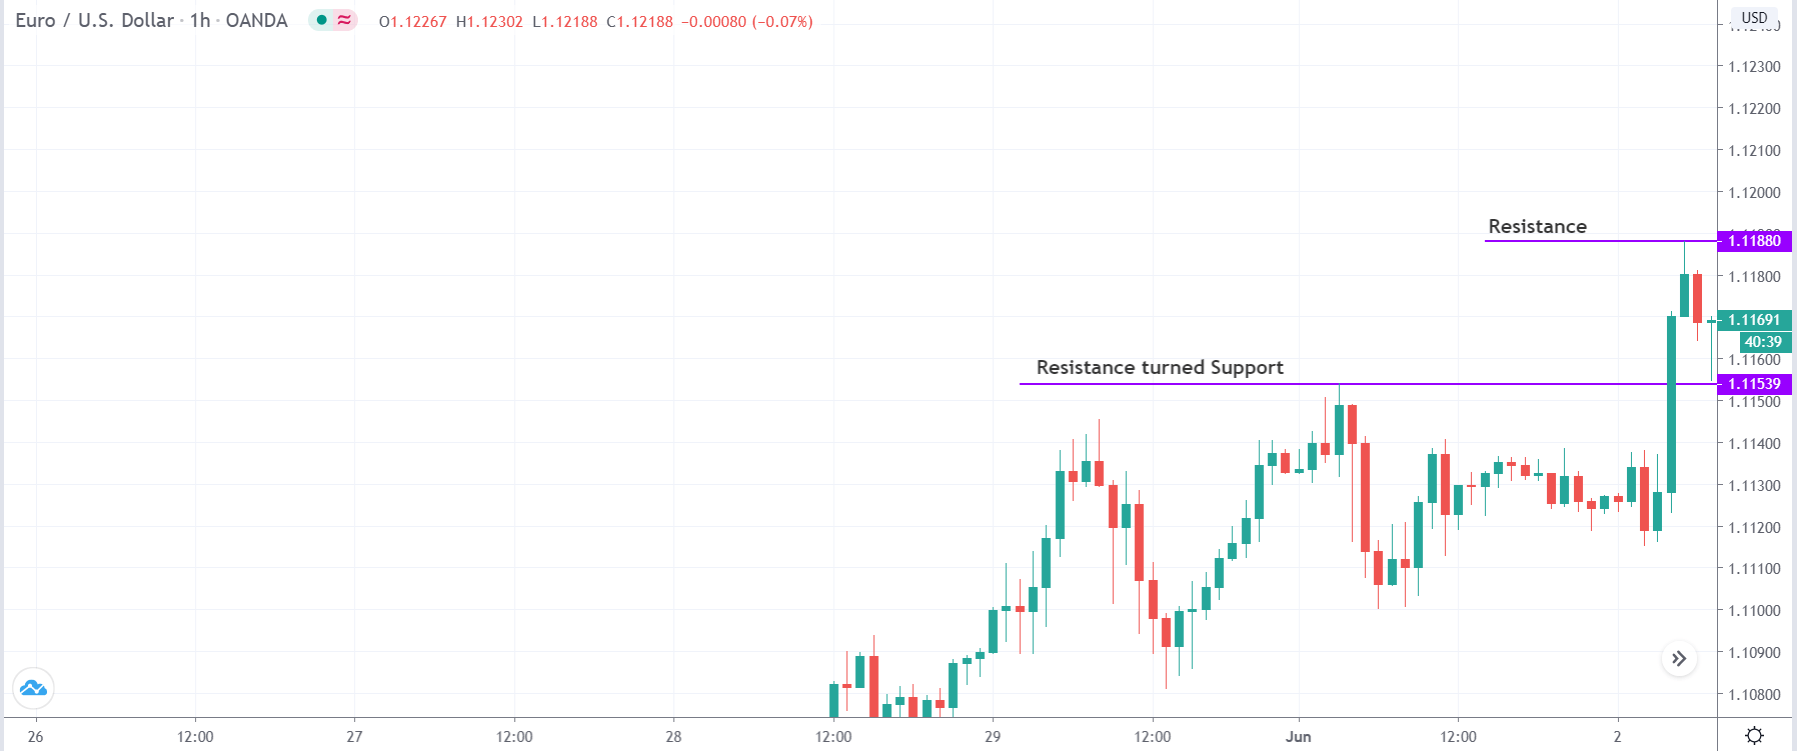
The first step of the strategy is to look for established levels of resistance turned support. By established, we mean the resistance which has now turned into support should be quite strong. It will be prominent if the breakout happens with strength, or essentially which happens after a news release.  After that, we need to mark our resistance, or ‘high’ from the market retraces to our support. These two important levels are marked in the below figure.

Step 2

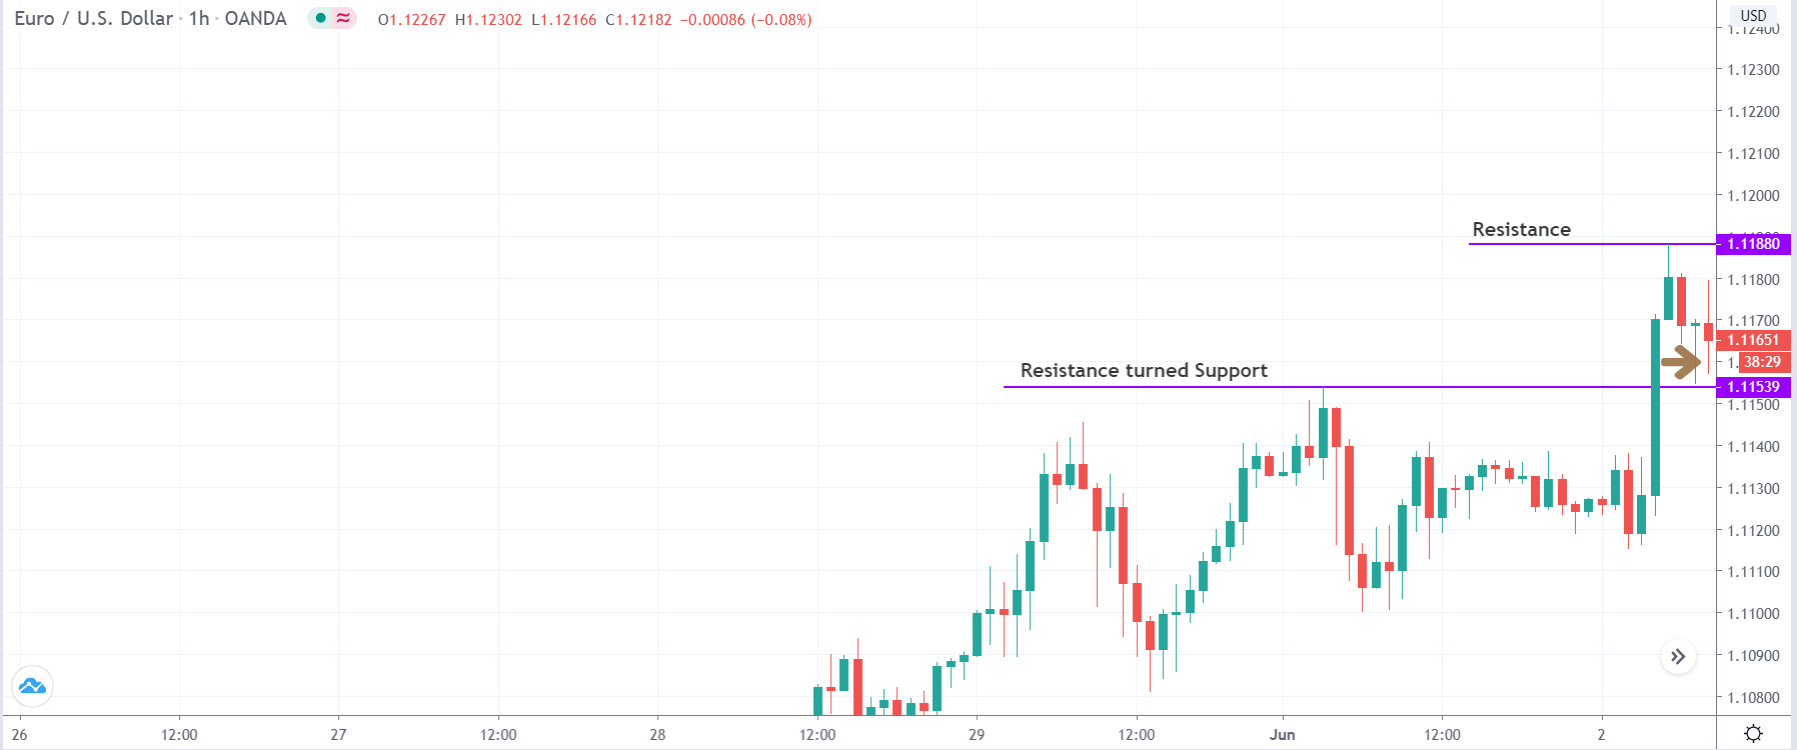
The next step is to wait for the price to bounce off from the support area by 10% of the range that is created between the two lines marked. In the above example, the arrow mark points at the 10% value of the range, as shown in the below image. We will be entering the market for a ‘buy’ exactly after this 10% bounce. The stop loss for this strategy is placed somewhere at a price where the resultant risk to reward is 1.

Step 3

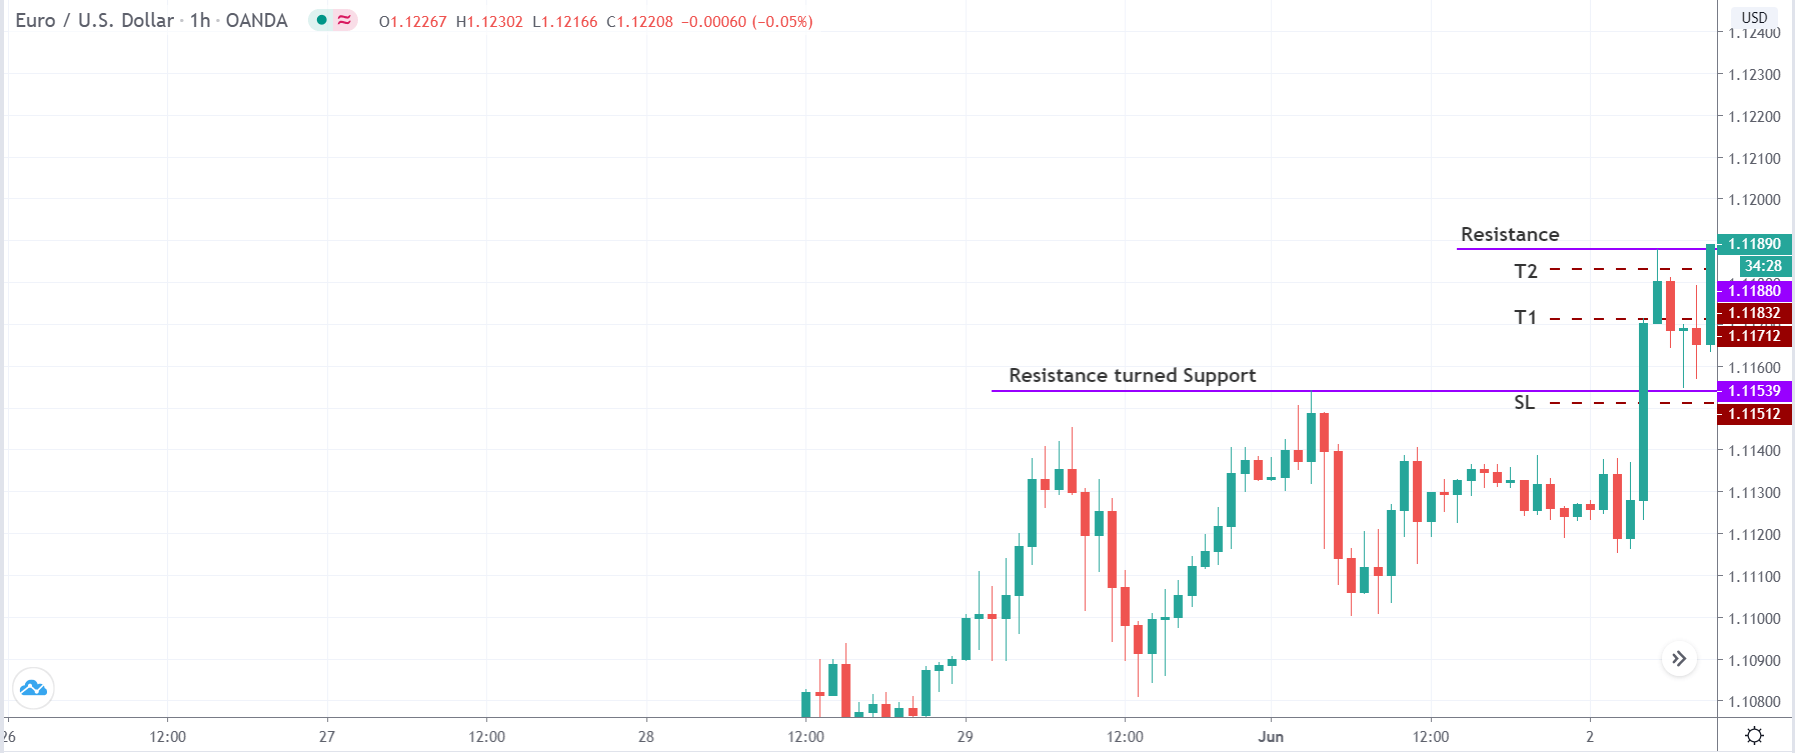
The best part of this strategy is that many emphases are put on trade management. In this step of the strategy, we remove 50% of our positions at the 50% mark of the range and 90% of the positions at the 90% mark of the range. In this, we ensure that even if the market reverses from the middle of the range and breaks below the support, we will still be profitable and would not any money even if the price hits our stop loss.

The points of the first and second targets are shown in the below figure, represented by brown dashed lines. One can also see the position of the Stop Loss marked by a brown dashed line.

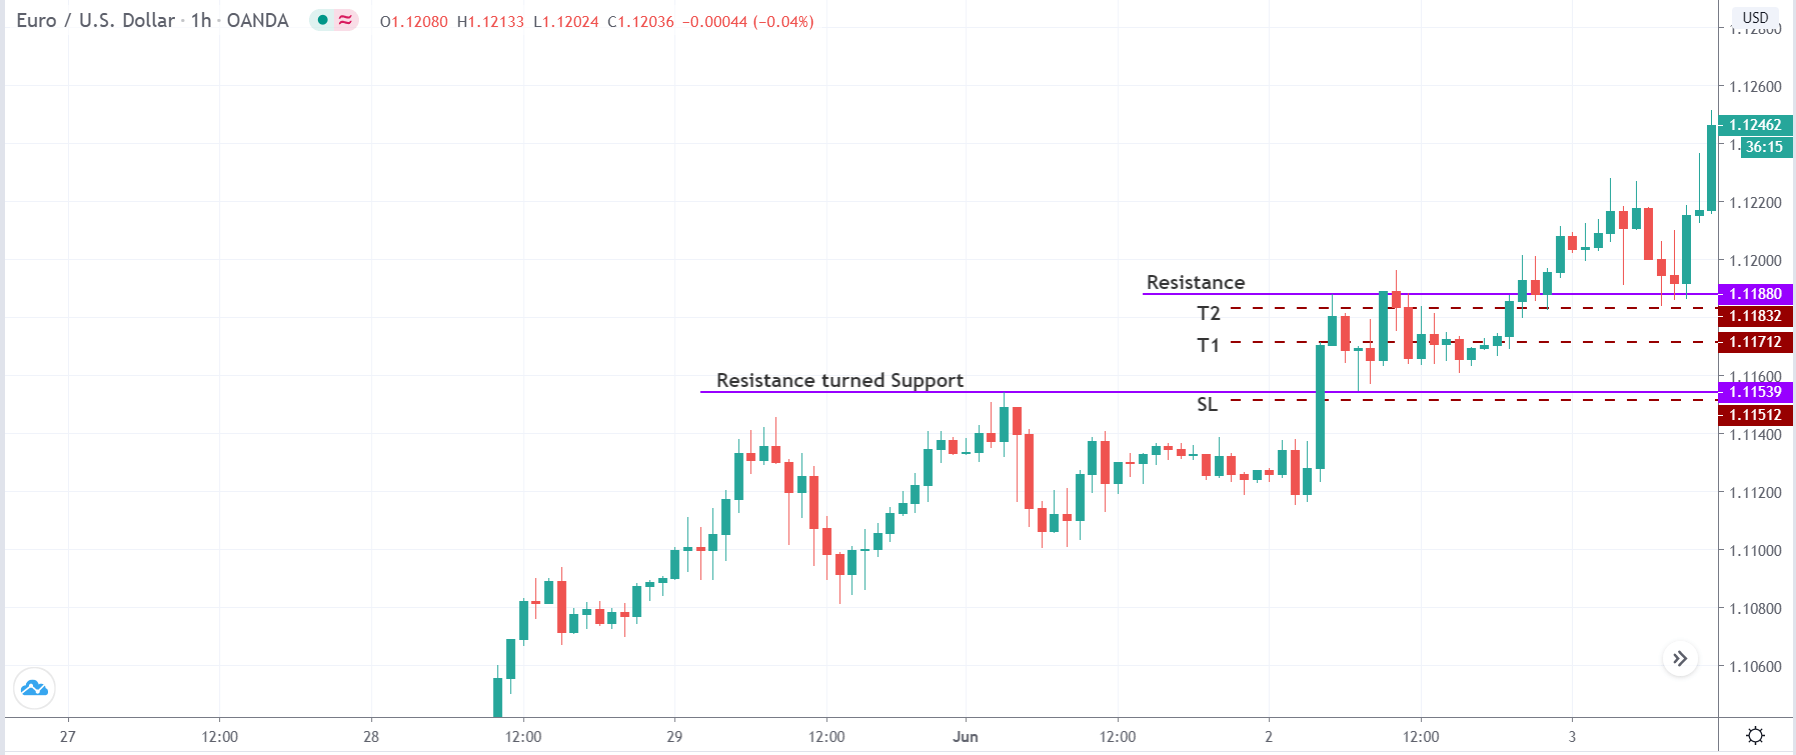
We can see in the image below that the market finally breaks out and continues its upward momentum. When critical levels of resistance turned support and support turned resistance are found in an uptrend and downtrend respectively, traders can wait for the market to make new ‘highs’ or ‘lows’ and then book their profits.

Strategy Roundup

This strategy is applicable as long as the market is swinging back and forth in the form of a range. However, the main requirement of the strategy is to find strong levels of resistance turned support in an uptrend (preferably) and support turned resistance in a downtrend (preferably). If the breakout or breakdown does not occur with strength, the strategy might not yield the desired result, or the trade might work just a little bit. Although it looks like trading simple support and resistance strategy, establishing key levels at the beginning of the strategy and application of trade management is what makes this strategy different from trading traditional support and resistance.

Point of Caution

Previously, we mentioned to look out for key levels in trending markets, but at the same time, one needs to be cautious while determining these levels. One needs to check if the market is overbought, in case of an uptrend, or oversold, in case of a downtrend. An indicator that can help us determine the overbought and oversold conditions of the market is the Stochastic indicator.

Categories
Forex Signals

USD/JPY Bearish Engulfing & 50 EMA Crossover Signals Sell – Who’s Up? 

The USD/JPY pair was closed at 107.195 after placing a high of 107.450 and a low of 106.829. Overall the movement of the USD/JPY pair remained bullish throughout the day. The USD/JPY jumped to fresh weekly high around 107.45 regions on the back of increased demand for the US dollar despite the risk-off market sentiment.

At 9:30 GMT, the All Industries Activity from Japan came in line with the expectations of -6.4% in April. From the American side, the Core Durable Goods Orders for May surged to 4.0% against the 2.1% of expectations and supported the US dollar. The Durable Goods Orders for May also increased to 15.8% against the 10.3% forecast and supported the US dollar. The Final GDP for the second quarter came in line with the expectations of -5.0%.

However, the Unemployment Claims from the US last week exceeded 1.480M from 1.320M of expectations and weighed on the US dollar. The Goods Trade Balance also showed a deficit of 74.3B against the expected deficit of 68.0B and weighed on the US dollar. The Prelim Wholesale Inventories for May decreased to -1.2% from the expected 0.4% and supported the US dollar. However, the quarter’s final GDP Price Index also came in line with the expected expansion of 1.4%.

The mixed data from the United States could not overcome the greenback’s strength on Thursday, which came in after the growing market worries related to surge in the number of coronavirus cases, which could trigger the fresh lockdown measures in the US. The economic recovery in case of renewed lockdown will become slower, and this raised the US dollar due to its status as a global reserve currency.

Meanwhile, the traders were rather unaffected by the selling bias around the equity market in the absence of risk sentiment, which tends to increase the safe-haven Japanese Yen and decrease the currency pair USD/JPY gains. Even the reduced US Treasury bond yields also could not affect the USD/JPY pair’s bullish move on Thursday.

On US-China front, the White House Advisor, Peter Navarro, said on Thursday that if China failed to fulfill the clause of phase-one deal related to increased purchases of American Lobsters, then the US will impose new reciprocal tariffs on China seafood industry. China committed to purchasing $150M worth of American Lobsters in the phase-one trade deal.


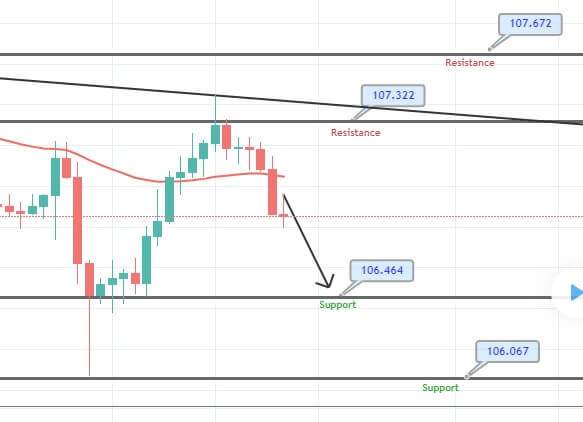
As we can see on the 4-hour timeframe, the USD/JPY has crossed below 50 periods EMA at 107.050 level, which was supposed to work as resistance later. While the recent candles were closing below a strong resistance area of 107.322, therefore, we decided to take a sell trade to target 106.654. Here’s an update on the trade plan. 

Entry Price – Sell 107.054    

Stop Loss – 107.454

Take Profit – 106.654    

Risk to Reward – 1

Profit & Loss Per Standard Lot = -$400 / +$400

Profit & Loss Per Micro Lot = -$40/ +$40

Categories
Forex Course

134. Knowing the State of the Market

Introduction

Many newcomers and novice traders believe that the market moves in a random direction. They think it is all about the fundamental factors that keep the market going. In reality, the market does move based on fundamental factors, but it doesn’t imply that the prices move in random directions. The prices on the charts move in a specific direction as they are nothing but the past transactions of the big institutional players.

Charts tell a lot about the market environment. It clearly determines who is in control of the market – the buyer or the sellers. Based on this, there are three states of the market:

  • Trend
  • Range
  • Channel

Broadly speaking, in any market, be it Stock, commodity, currency, or cryptocurrency, the prices move only these three states. Let us understand each of them.

Of course, there are several types of chart patterns, but they all fall in one of the types on a bigger picture. All technical traders must have an understanding of the market environment. Whatever be the strategy, it will work applied in the right state of the market. Also, every type of market has its own concepts to trade.

Trend

The most evident type of market is a trending market. At the same time, it is one of the most confusing states to understand. A trending market is a type where the prices make Higher High & Higher Low sequences or Lower Low & Lower High sequences. In other words, in a trending market, the prices make a Higher High / Lower Low, retrace to the Support & Resistance, and continue with the same pattern.

A trending market is a type that can be found in any type of market. That is, even in ranges and channels, trends can be spotted (in a miniature picture).

Based on the direction of the market, we can divide trends into two types –

Uptrend (Bullish) – A market that faces upwards is an uptrend. The price makes Higher Highs and Higher Lows. It is a market where the buyers (bulls) are in control of the market. Note that a Higher High alone cannot be regarded as an uptrend.

Downtrend (Bearish) – A market whose trajectory is downwards is referred to as a downtrend. The price moves by making Lower Lows and Lower Highs. In this market, the sellers (bears) dominate the market.

Range

A ranging market is a type where the price does not create Higher Highs of Lower Lows. Thus, it moves sideways. There is a certain price shoots up and a price where it drops. It moves within these two prices. In this market, both buyers and sellers are strong. For example, if we say the market is ranging between 0.1200 and 0.2400, it means that the buyers are pushing up the market to 0.2400 from 0.1200, while the sellers are hitting it right back down to 0.1200.

Channel

A channel is basically a tilted channel. In other sense, a channel is a trend that is quite weak. In a channel, the price does try to make a Higher Highs or Lower Lows but retraces deeply before going for the next set. In a trend, the market respects the Support & Resistance, but the channel does not.

We hope you were able to get a gist on the states of the market. In the coming article, we shall elaborate on each of the types and understand how to trade them.

[wp_quiz id=”81457″]
Categories
Forex Fundamental Analysis

Did You Know That ‘Internet Speed’ Of A Nation Is Also Considered A Forex Fundamental Driver?

What is Internet Speed?

Internet Speed refers to the speed at which data, voice, and video travel long distances. This is achieved with the help of broadband. Broadband refers to the transmission technologies used to transmit the internet. The term is used to describe high-speed and high-bandwidth communication infrastructure. Without broadband, it is not possible to attain high-speed internet at any cost. The common medium of transmission technologies includes coaxial cable, fiber optic cable, and radio waves.

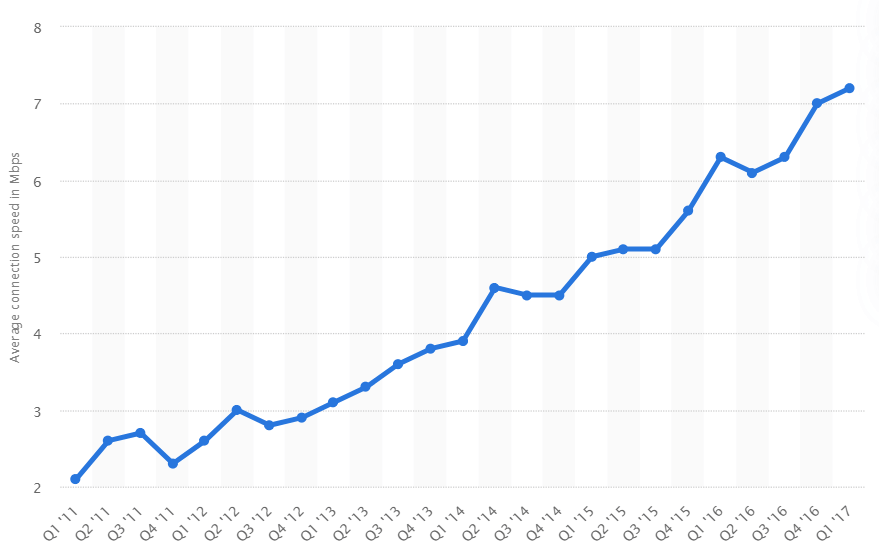
(Source: Statista.com)

Business and Internet Speed  

Companies accessing the internet is nothing new. In the 80s, banks and Wall Street began changing the way they dealt with information. Back then, internet-related tasks were accomplished with the help of a simple modem and dial-up connection. In today’s demand scenario, much faster and reliable systems of internet connection are required. Business owners and IT professionals have a lot to choose from.

High-speed internet leads to greater advantages for companies that rely on cloud-based apps and data. According to the study conducted by an international group, a city with high-speed internet, over a gigabit connection, has an overall healthier economy. The research was carried out by comparing 14 metropolitan areas where more than half the population has access to high-speed internet with that of 40 neighboring cities without high-speed internet.

It was reported that cities that had gigabit connections, like the fiber optics, can support a 1.1% higher gross domestic product than other “slower internet” cities. A 1.1% contribution might soundless, but when this is seen in the context of developed countries that grow a minimum of 1-2% every year, one can estimate how significantly it can impact economic growth. It could mean up to $1.5 billion in the local economy.

Importance of High-Speed Internet

On a global level, increasing internet speeds have the power to transform whole economies. During the keynote speech at Broadband World Forum, Johan Wiberg (Head of Business Unit Network, Ericsson) described that when more and more people begin to have access to high-speed internet and mobile broadband, people will find new ways to conduct the businesses.

High internet speed has the power to spur economic growth by creating efficient systems for businesses and consumers. It opens up opportunities for more advanced online services, smarter utility services, and telecommunication. In healthcare, for instance, innovative mobile applications will be used by nearly 800 million people.

But when it comes to high-speed internet, it is not easy to launch into an area overnight. It takes effort from companies and governments to introduce data and wi-fi connectivity in rural areas. Hence, the positive effects of these new technologies are hard to see right away. As more and more businesses get access to high-speed internet, whole verticals of the economy will transform.

With these effects sounding exciting, one shouldn’t expect higher income levels with the introduction of high-speed internet in our communities. When governments and policymakers fully comprehend the importance of digital highways, it is then we can find drastic changes in the economy in no time.

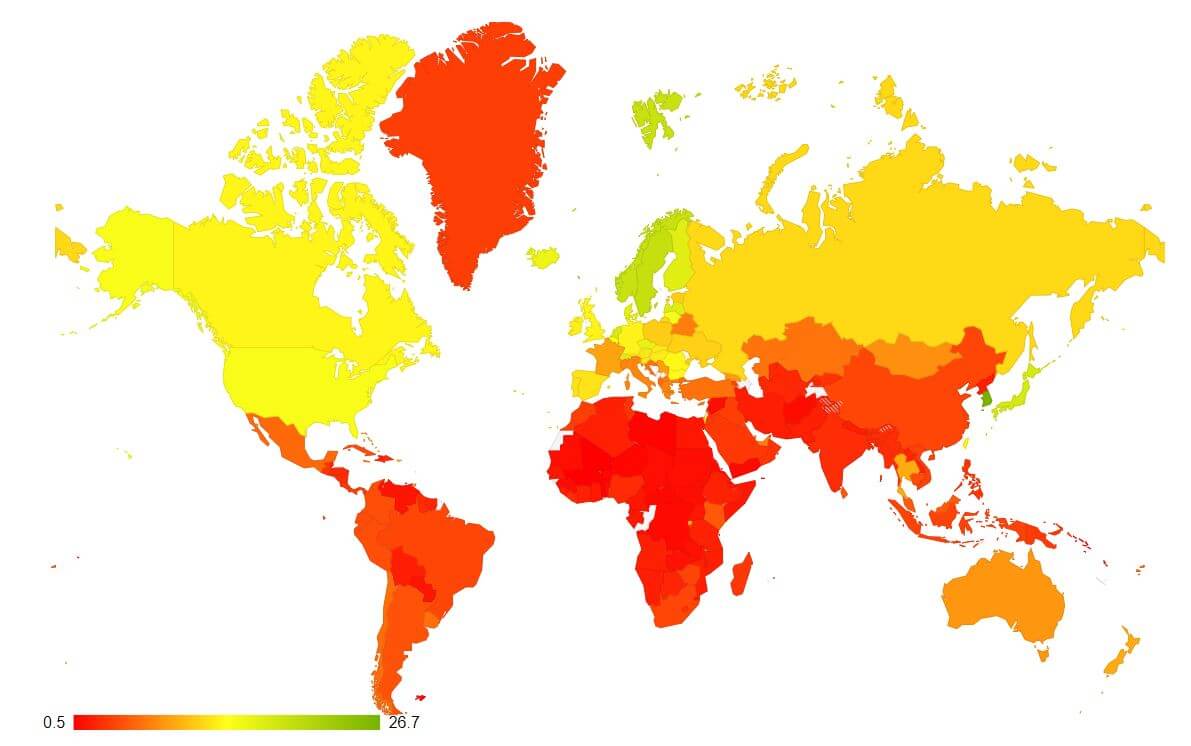
Countries with Fastest Internet around the World

Taiwan has the fastest internet with an average speed of 85Mbps, followed by Singapore, Jersey, Sweden, and Denmark. While Yemen has the slowest internet in the world with an average speed of just 0.38Mbps. Thirty-seven of the fifty fastest internet countries are located in Europe, with 10 in Asia, 2 in North America, and just 1 in Africa. The global internet speed is getting faster.

The previous year, global average internet speed was 9.1Mbps while this year, the global average is 11.03Mbps, a rise of more than 20%. Generally speaking, countries which have the fastest internet speeds are the ones which are small and developed. The larger & less developed a nation is, the slower will be the internet.

By looking at the present statistics, we can say that there is little change in development, availability, and rollout of faster infrastructure in the bottom half of the ranking compared to the top half.

Below is the avg Internet Speed of different countries in the world (In terms of MBPS)

(Source – Fastmetrics)

Impact on Currency 

Temporary internet shutdown in a high connectivity country is estimated to have a GDP impact per 10 million people per day of $23.5 million on average. The average impact in a medium connectivity country would be an estimated $6.5 million and $0.6 million of GDP, respectively. Therefore, Internet Speed does impact the value of the currency as well. But it does not an immediate impact, rather the effect is felt on a longer-term.

Sources of information on Internet Speed

There are many speed testing websites that calculate internet speed and keep them updated every few minutes. However, this information cannot be found on most of the economic websites as it is a very important economic indicator for traders. The website of telecommunication ministry is also a source of information on the internet and broadband.

Links to Internet Speed information sources

GBP (Sterling) – https://tradingeconomics.com/united-states/internet-speed

AUD – https://tradingeconomics.com/australia/internet-speed

USD – https://tradingeconomics.com/united-states/internet-speed

CAD – https://tradingeconomics.com/canada/internet-speed

JPY – https://tradingeconomics.com/japan/internet-speed

CHF – https://tradingeconomics.com/switzerland/internet-speed

Final Words

Broadband has created new sectors and redefined the old ones. The music industry, for example, after years of declining sales, is growing rapidly after the adoption of digital distribution models. All this is possible only with the help of fast internet. As broadband becomes abundant and faster, everything from retail to government services finds new ways to reinvent themselves, especially in knowledge-based sectors where such speed and efficiency can enhance competitiveness.

Digital infrastructure opens up possibilities for more advanced online services, smarter utility services, e-health, telecommunication, and telepresence. All are dependent on high-speed broadband networks. Hence Internet Speed of a nation pays a key role in determining how advanced the country is in terms of technology as well.

Having that said, the news release of Internet Speed figures for different countries doesn’t really affect the Forex price charts in any way. Hence, technical analysts can ignore this fundamental driver’s news announcements. Cheers!

Categories
Forex Market Analysis

Daily F.X. Analysis, June 26 – Top Trade Setups In Forex – Potential Breakouts Everywhere!

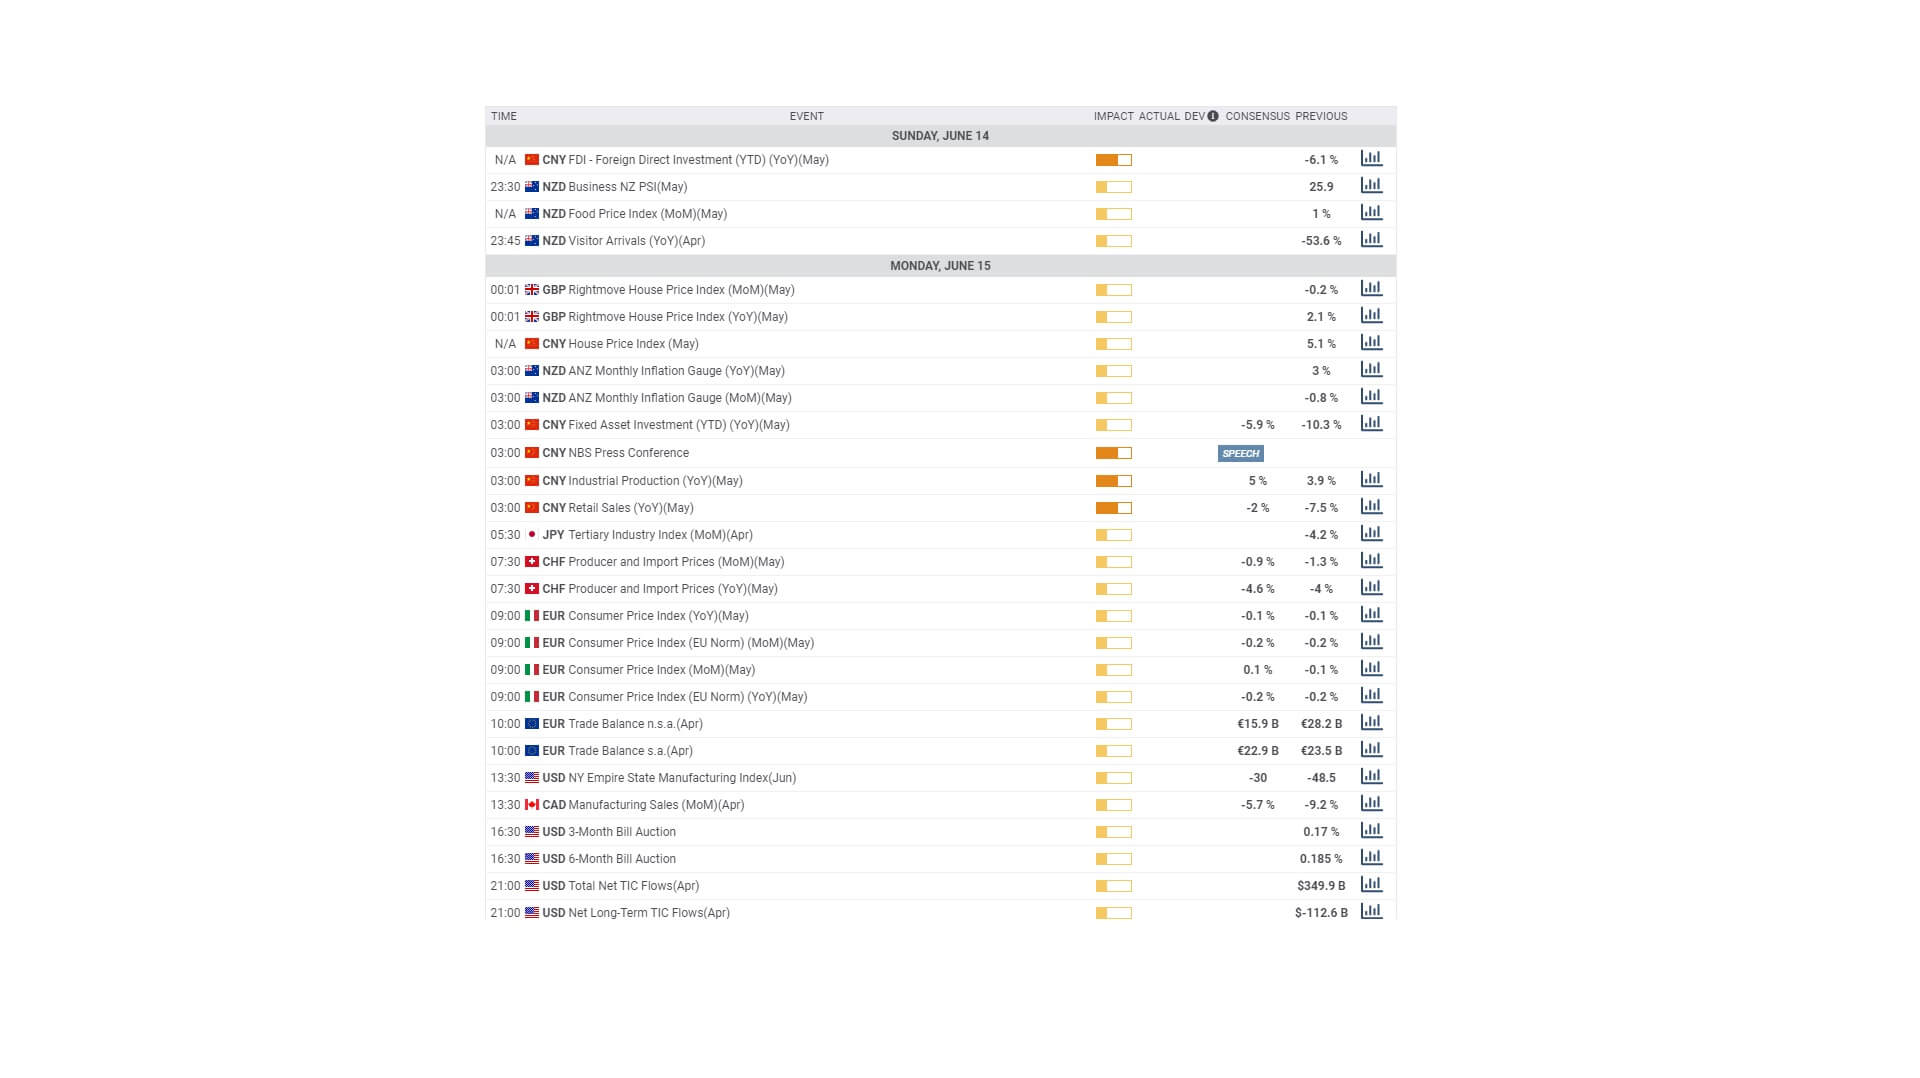
The fundamental side is again muted with a limited number of economic events that don’t have the potential to drive major movement in the market today. Therefore, the focus will remain on the technical side of the market.

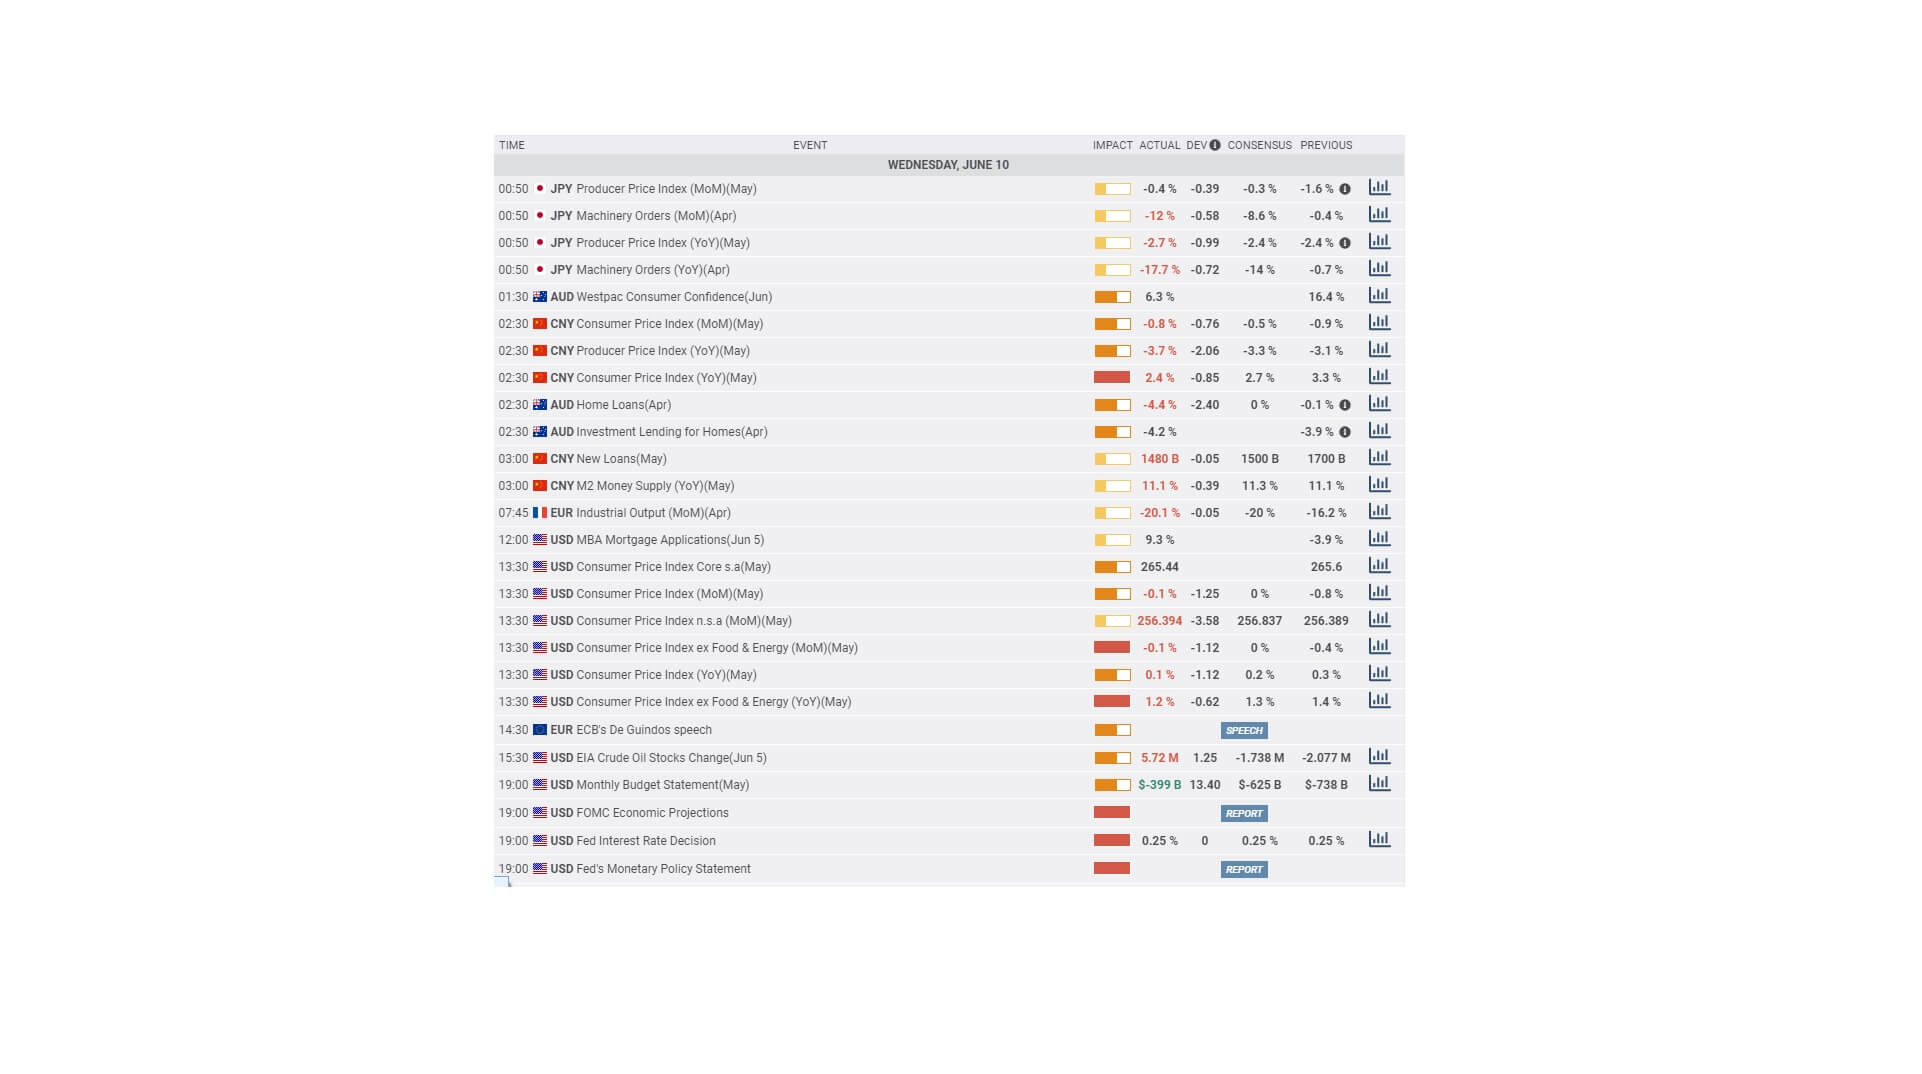
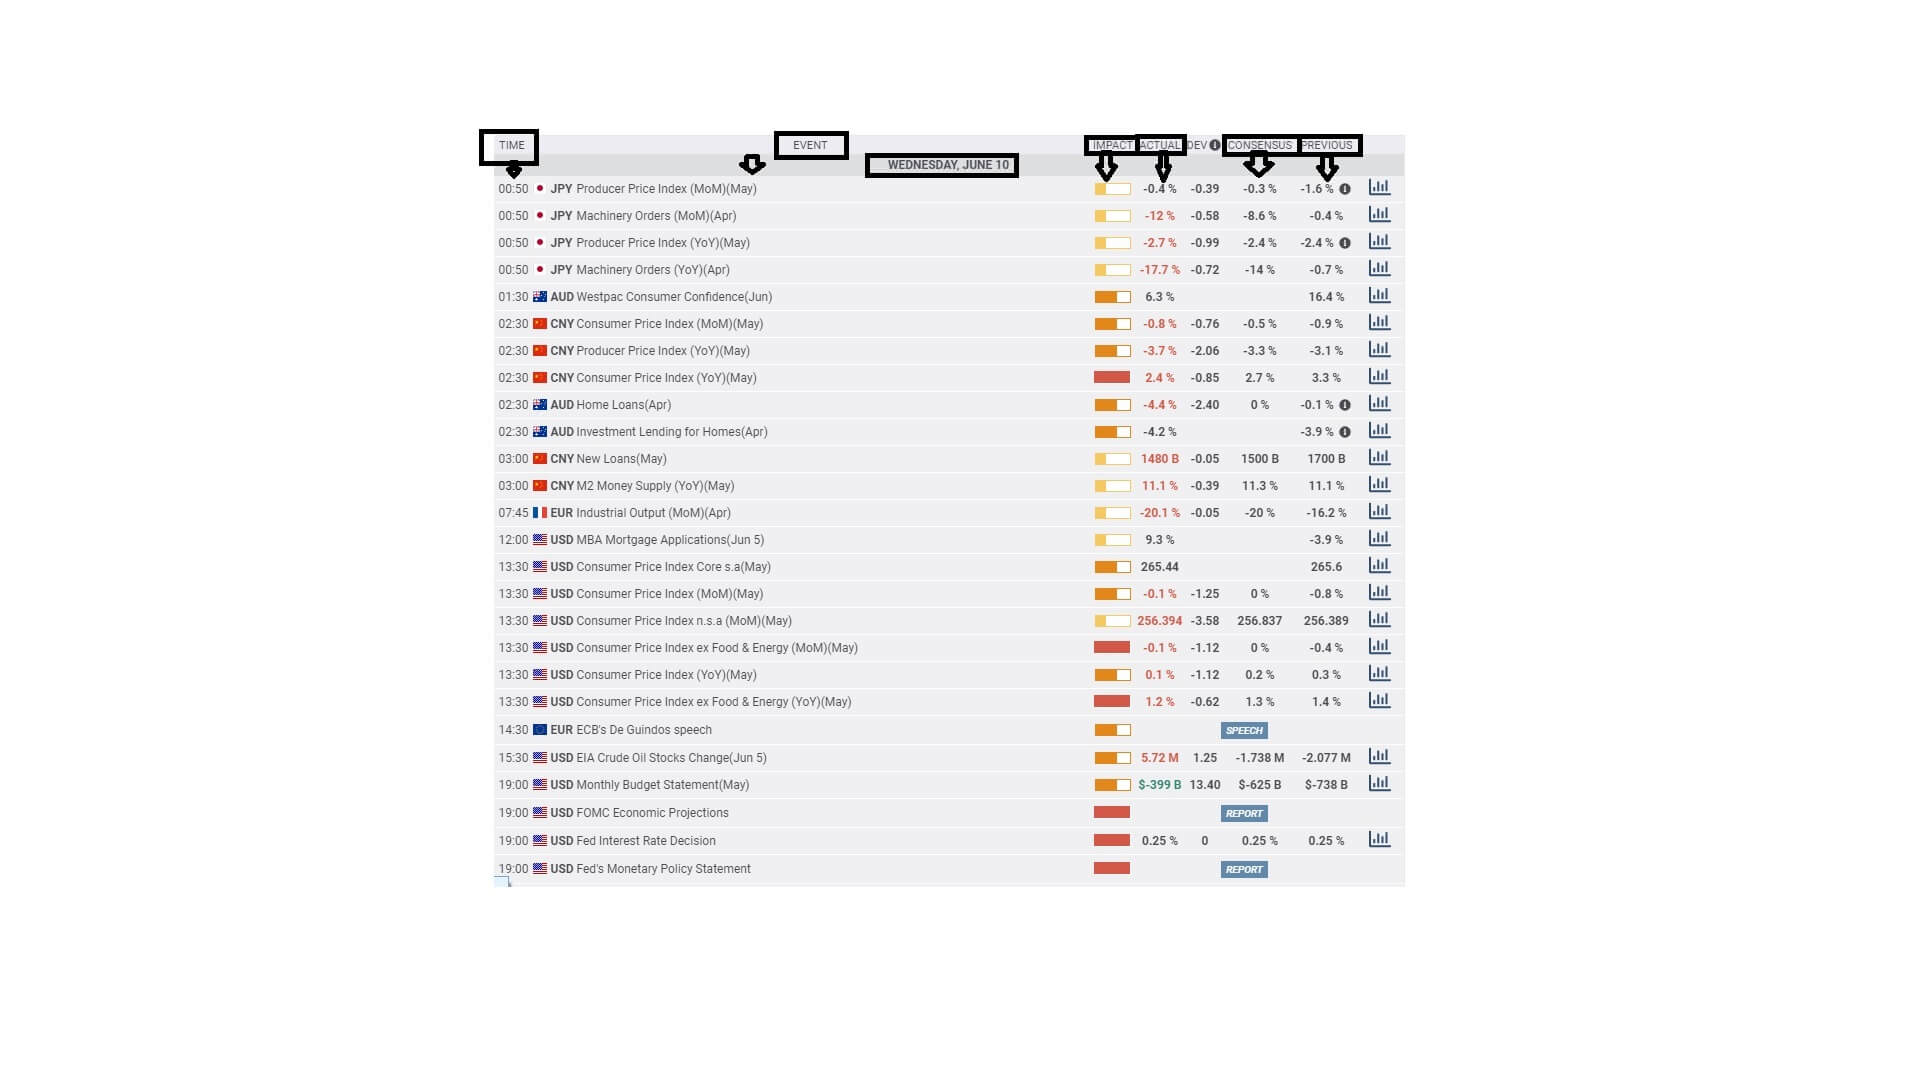
Economic Events to Watch Today 


EUR/USD – Daily Analysis

The EUR/USD pair was closed at 1.12177 after placing a high of 1.12595 and a low of 1.11902. The EUR/USD pair posted losses on Thursday for the second consecutive day on the back of U.S. dollar strength amid risk-averse market sentiment. The worries over an increase in the number of coronavirus cases across the globe raised fears in the market. The number of death tolls in the U.S. topped to 120 thousand, and the number of rising cases reached 2.4M.

The S&P 500 declined to a 2-week lowest by 2.55% on Thursday. The U.S. Dollar Index rallied higher on the day but remained within a broader range near the starting point of the month. On the data front, at 11:00 GMT, the German GfK Consumer Climate for June supported Euro when it came in as -9.6 against the forecasted -11.7.

On Thursday, ECB released its last monetary policy meeting minutes, which revealed that ECB aimed to neutralize a German court ruling and to justify its bond purchasing scheme. ECB will also release confidential documents to curb the threat.

In May, Germany’s constitutional court threatened to block the central bank from participating in the stimulus plan unless ECB could prove that its government debt purchases exceeded the legal limits. German court provided a time period of 3 months to ECB to prove that. The critics argued that the bond purchases exceeded the ECB’s mandate, and the leading judge of the court said that ECB should not consider itself the ‘master of the universe.’

In monetary policy minutes, the ECB also underlined the delicate economic situation with millions of jobs at risk and inflation at weak levels. The forecast for Eurozone’s deep recession was also mentioned while stressing the efficiency of stimulus measures in helping to stimulate economic growth.

In short, the minutes send two messages: the ECB was ready to do more if needed, and the ECB efforts to end the conflicts with the German Constitutional court. Whereas, from the U.S., the Core durable goods orders for May increased by 4.0% against the forecasted 2.1% and supported the U.S. dollar. The Durable goods orders for May also increased by 15.8% against the expected 10.3% and supported the U.S. dollar, which weighed on EUR/USD pair on Thursday.

Daily Support and Resistance

  • R3 1.1383
  • R2 1.1355
  • R1 1.1304

Pivot Point 1.1276

  • S1 1.1225
  • S2 1.1197
  • S3 1.1147

EUR/USD– Trading Tip

The EUR/USD is trading in a narrow range of 1.1243 – 1.1193 level, which limits the price action for now. On the lower side, the EUR/USD pair can drop towards 1.1145 level upon the bearish breakout of 1.1193 level, while the bullish breakout of 1.1243 level will allow us to go long. Simultaneously, the RSI and MACD are still in a bearish zone, while the 50 EMA also suggests selling bias. Therefore, we should look for selling trades below 1.1250 levels.  


GBP/USD – Daily Analysis

The GBP/USD pair was closed at 1.24184 after placing a high of 1.24642 and a low of 1.23888. Overall the movement of GBP/USD pair was flat throughout the day. The GBP/USD pair attempted to recover amid the hopes of Brexit breakthrough as the next round of face-to-face talks came. However, the fresh Brexit optimism was not expected to offset the disappointing U.S. coronavirus data giving strength to the greenback.

Britain’s chief negotiator David Frost warned Michel Barnier to ‘get real’ ahead of the face-to-face meeting in months. Both men will conduct an intensified round of talks at the Commission headquarters on Monday in a view to strike a breakthrough.

Frost said that he would go to Brussels in good faith to engage with the E.U.’s concerns, and this should be a real negotiation, and for that, E.U.’s unrealistic positions must have to change if they wanted the U.K. to move forward.

He added that U.K. sovereignty over its laws, its courts, and its fishing waters were not up for discussion. He also said that the U.K. did not seek anything that could undermine the E.U.’s single market. This raised the bars that the Brexit deal could be done when the face-to-face meeting will happen, but at the same time, the U.K.’s decision not to show any relaxation towards E.U.’s demands weighed on the positive expectations.

According to the European Social Survey (ESS), a pan-European poll carried out every two years, 56.8% of respondents in the U.K. showed a willingness to remain in Europe while 34.9% said that they would leave the bloc while 8.3% said that they would not vote at all. This survey also exerted pressure on GBP/USD on Thursday.

On the other hand, at the economic data front, the CBI Realized Sales from Great Britain remained flat with the expectations of -37 in June. While from the American side, the core durable goods order gave strength to the U.S. dollar when exceeded the expectations of 2.1% and came in as 4.0% and weighed on GBP/USD. The durable goods orders from the U.S. in May also exceeded 15.8% from the expected 10.3% and supported the U.S. dollar to weigh on GBP/USD pair. However, the Unemployment claims exceeded 1.480M from the expected 1.320M and weighed on the U.S. dollar, which supported the GBP/USD pair. Hence, the GBP/USD remained flat throughout the day.

Daily Support and Resistance

  • R3 1.2633
  • R2 1.2588
  • R1 1.2504

Pivot Point 1.2459

  • S1 1.2375
  • S2 1.233
  • S3 1.2245

GBP/USD– Trading Tip

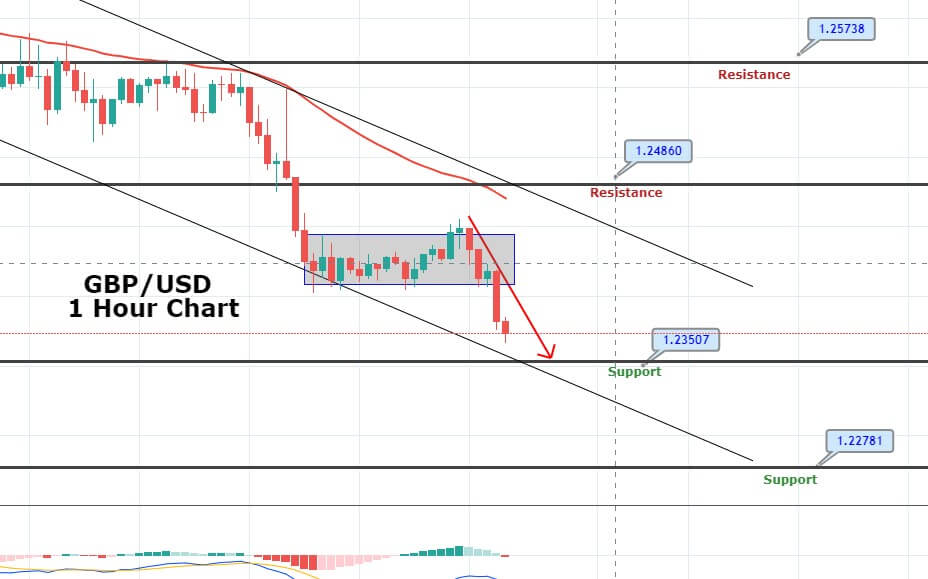
The GBP/USD extends trading with bearish momentum at 1.2406 level, having disrupted the 1.2460 support level. This mark is presently serving as resistance and can point the GBP/USD prices lower until 1.2380 level. On the downside, the Cable may find support around 1.2380 and 1.2336 levels. Acknowledging the fresh bearish crossover on the MACD and bearish bias extended by the RSI, the pair can show us a bearish trend. The 50 EMA is also proposing selling sentiment; hence, we should consider taking selling trades below 1.2459 level on Friday. 


USD/JPY – Daily Analysis

The USD/JPY pair was closed at 107.050 after placing a high of 107.069 and a low of 106.382. Overall the movement of USD/JPY remained bullish throughout the day. The US Centers for Disease Control and Prevention (CDC) Director Robert Redfield recently said that the number of actual confirmed cases is ten times bigger than reported cases. The Redfield indicated that approximately 92 to 95 % of the U.S. population is still in trouble by the fears of ever-increasing virus figures. There are 37,667 new cases with 692 deaths in America on June 25 as per the latest report, which initially weighs on the risk sentiment and contributed to the yellow-metal gains.

The risk-off market was further bolstered by the latest report that the United States recently announced to impose fresh sanctions on eight entities connected with Iran’s metal industry that supply revenue for the country’s Revolutionary Guard Corps. As per the U.S. Secretary of State Mike Pompeo tweet, “Today, we are sanctioning nine entities for their connections to Iran’s metals sector. Iran’s leaders must stop squandering resources to support proxies abroad while Iranians suffer.” which adds strength to the risk-tone and weighs on the riskier assets.

It’s worth mentioning that the U.S. also imposed sanctions on a Chinese company known as the Global Industrial and Engineering Supply Ltd., for providing graphite — a vital material in Iran’s metal industry — to Tehran in 2019.

Moreover, the reason behind the risk-off market sentiment could also be associated with the report of a huge unconfirmed blast in Tehran and the trade wars between the U.S. and the rest of the major global economies. It should be noted that the police have started to look into an incident that happened over the last few hours in Tehran, where a bright light and loud sound in the eastern portion of Tehran were reported.

Besides the geopolitical tensions, the Federal Reserve recently banned 34 largest banks from share buybacks in the 3rd quarter (Q3). As well as, the Federal Reserve capped dividend payment to the second quarter (Q2) levels for these banks. While the U.S. central bank also released gloomy analyses, due to the coronavirus (COVID-19) economic impact, which exerted some downside press on the risk-tone. 

Daily Support and Resistance    

  • R3 107.99
  • R2 107.54
  • R1 107.28

Pivot Point 106.83

  • S1 106.58
  • S2 106.12
  • S3 105.87

USD/JPY – Trading Tips

The USD/JPY is consolidating with bullish sentiment at 107.191 marks, but the closing of recent candles underneath 107.220 marks can encourage selling or retracement. Although the pair has violated the downward trendline resistance at 107 mark and technically, it should dispense selling the USD/JPY pair below 107.225. But we also require to recognize the double top resistance mark of 107.250. I will be glad to take a sell-trade if the USDJPY holds below 107.250 level to target 106.450 today. Good luck! 

Categories
Forex Options

FX Options Market Combined Volume Expiries for 26th June 2020

Thank you for visiting the Forex Academy FX Options market combined volume expiries section. Each day, where available, we will bring you notable maturities in FX Options of amounts of $100 million-plus, and where these large combined maturities at specified currency exchange rates often have a magnetic effect on price action, especially in the hours leading to their maturities, which happens daily at 10.00 AM Eastern time. This is because the big institutional players hedge their positions accordingly. Each option expiry should be considered ‘in-play’ with a good chance of a strike if labelled in red, still in play and a possible strike if labelled in orange and ‘out of play’ and an unlikely strike if labelled in blue, with regard to the likelihood of price action meeting the strike price at maturity.

………………………………………………………………………………………………………………

FX option expiries for June 26 NY cut at 10:00 Eastern Time, via DTCC, can be found below.

– EUR/USD: EUR amounts

  • 1.1100 756m
  • 1.1150 820m
  • 1.1180 630m
  • 1.1200 2.2bn
  • 1.1250 764m
  • 1.1300 699m
  • 1.1350 586m

The EURUSD pair is in a consolidation phase after the recent bear move. Support and resistance lines have been added on the one-hour chart. The likely area is around 1.12 for price action at the New York cut. Watch out for US data before then

– USD/JPY: USD amounts

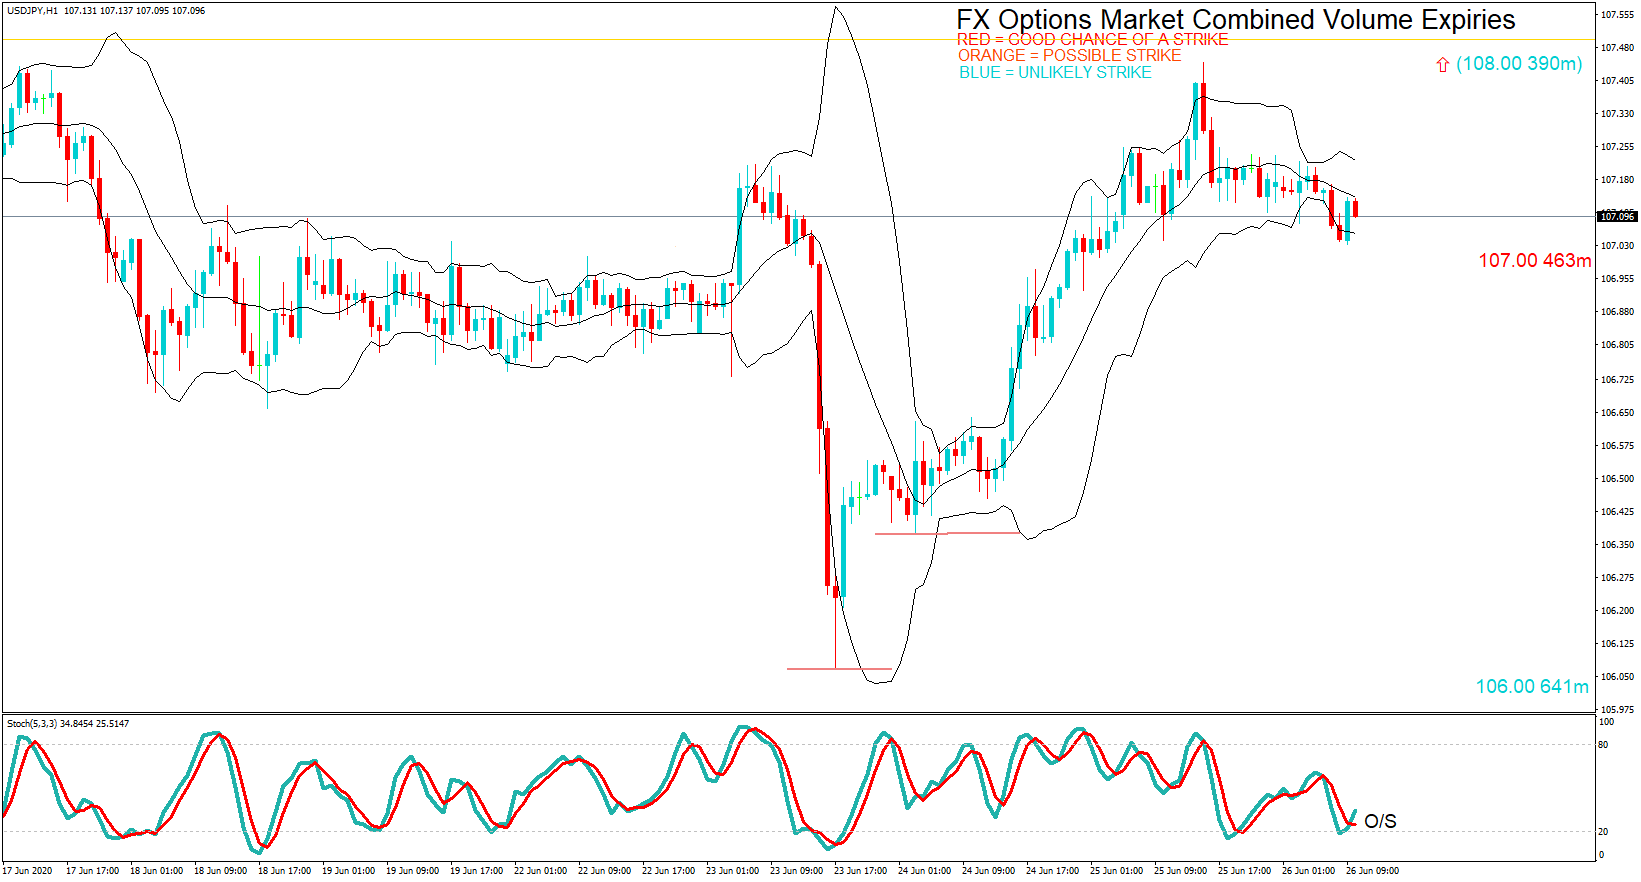
  • 106.00 641m
  • 107.00 463m
  • 108.00 390m

USDJPY is ignoring the oversold indicator on the one-hour chart and price action is fading from the recent high at 107.40. Expect some price action dithering until the US data has been released. The 107.00 option remains in play.

– USD/CAD: USD amounts

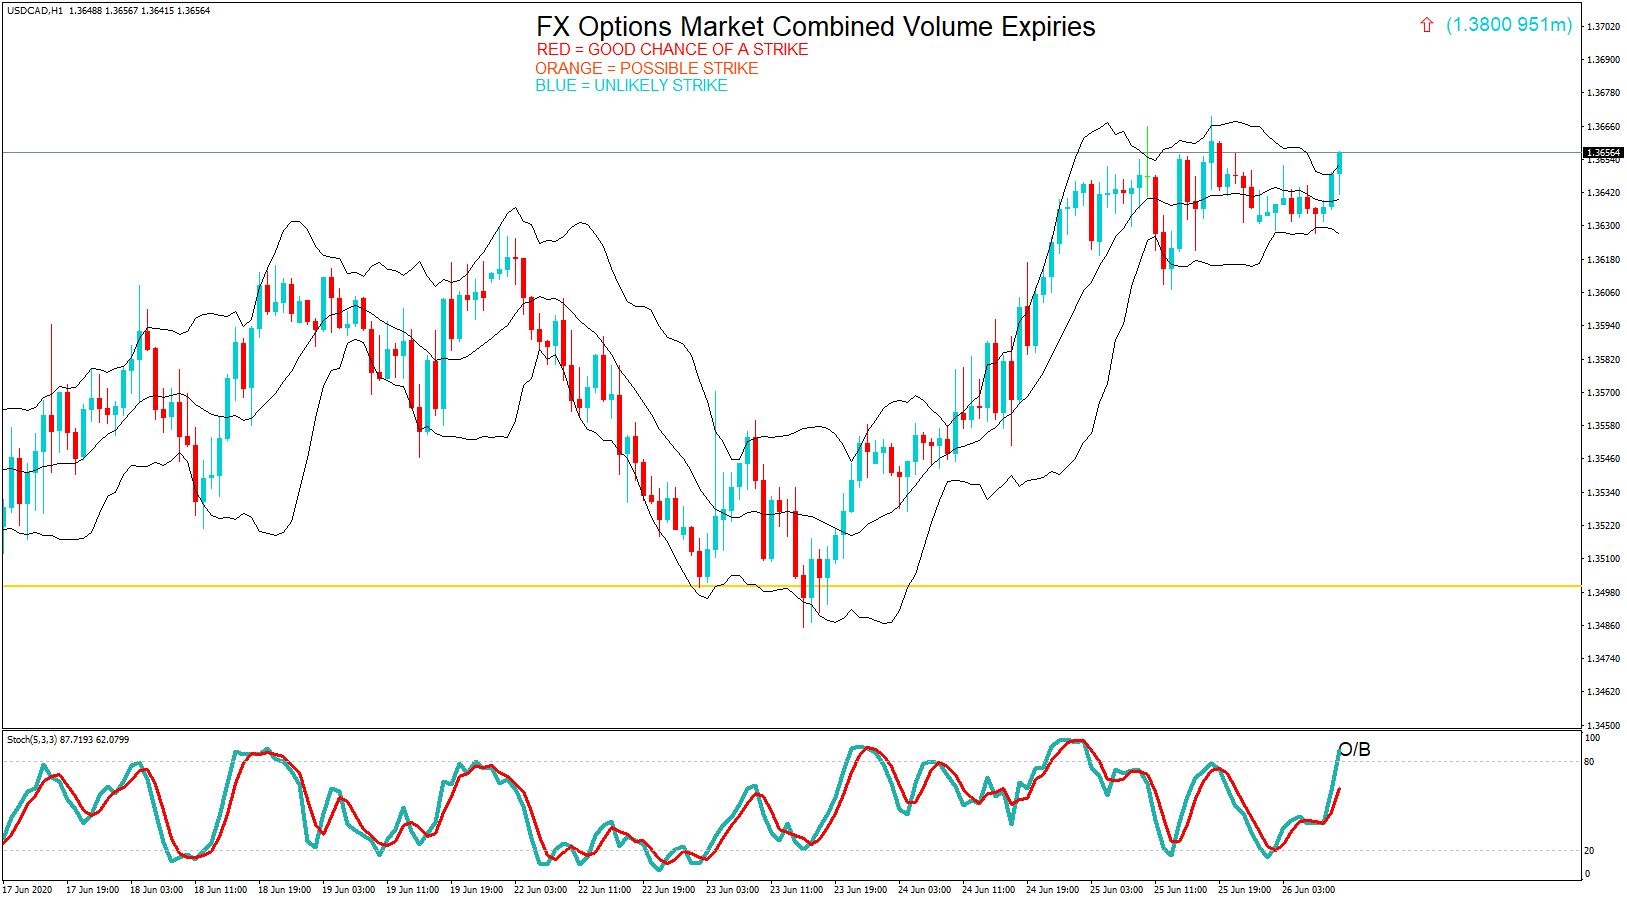
  • 1.3800 951m

USDCAD is still bid. But the 1.3800 option is currently not in play.

– NZD/USD: NZD amounts

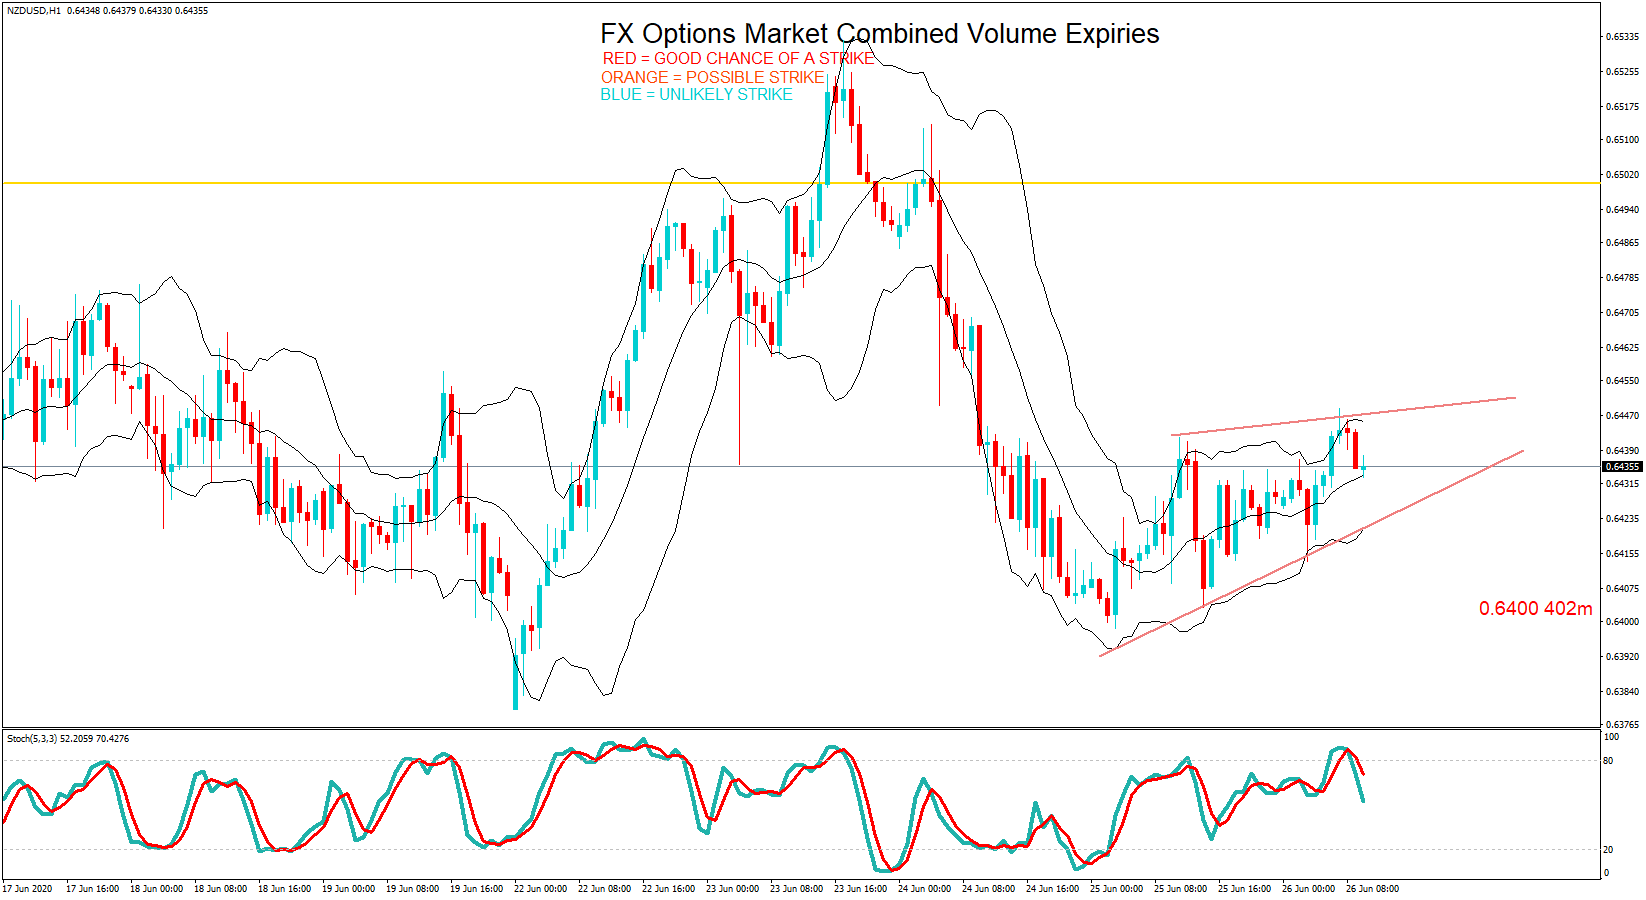
  • 0.6400 402m

NZDUSD price action will likely conform to the general bid tone in the USD. Expect downside in the pair where the 0.6400 option remains in play if the support line can be breached on the one-hour chart.

………………………………………………………………………………………………………………

As you can see on the charts we have also plotted the expiration levels at the various exchange rate maturities and we have also labelled in red, orange and blue.  Therefore, if you see option expiry exchange rates labelled in red these should be considered in-play, because we believe there is a greater chance of the expiry maturing at these levels based on technical analysis at the time of writing. There is still a lesser possibility of a strike if they are in orange and so these are ‘in-play’ too. However, if we have labelled them in blue, they should be considered ‘not in-play’ and therefore price action would be unlikely to reach these levels, which are often referred to as Strikes, at the time of the 10 AM New York cut.

Our technical analysis is based on exchange rates which may be several hours earlier in the day and may not reflect price action at the time of the maturities. Also, we have not factored in economic data releases or keynote speeches by policymakers, or potential market volatility leading up to the cut.

Although we have added some technical analysis, we suggest you take the levels and plot them onto your own trading charts and incorporate the information into your own trading methodology in order to use the information to your advantage. Remember the higher the amount, the larger the gravitational pull towards the exchange rate maturity at 10:00 AM Eastern time.

If you want to learn how forex option expiries affect price action in the spot FX market see our educational article by clicking here: https://bit.ly/2VR2Nji

DISCLAIMER: Please note that this information is for educational purposes. Also, the maturities will look more or less likely to become a strike at 10 AM NY time due to exchange rate fluctuations resulting in a different perspective with regard to technical analysis, and also due to upcoming economic data releases for the associated pairs.

Categories
Forex Assets

Everything About Trading The CHF/DKK Forex Asset Class

Introduction

The abbreviation of CHF/DKK is Swiss Franc, paired with the Danish Krone. Here CHF is the official currency of Switzerland and is also the fifth highly traded currency in the Forex market. In contrast, DKK stands for the Danish Krone, and it is the official currency of Denmark and the provinces of Greenland and the Faroe Islands.

Understanding CHF/DKK

In the Foreign exchange market, to ascertain the comparative value of one currency, we need an alternative currency to evaluate. Once when we buy a currency, which is identified as the base currency and simultaneously sell the quote currency. The market value of CHF/DKK helps us to comprehend the power of DKK against the CHF. So if the trade rate for the pair CHF/DKK is 6.9915, it means to buy 1 CHF, we need 6.9915 DKK.

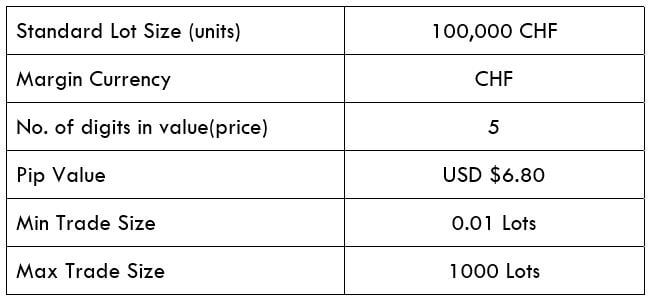
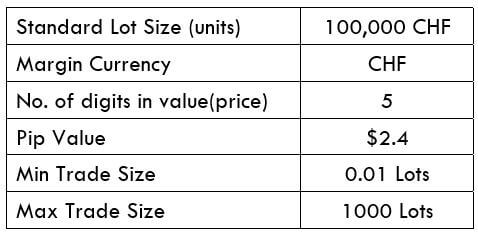
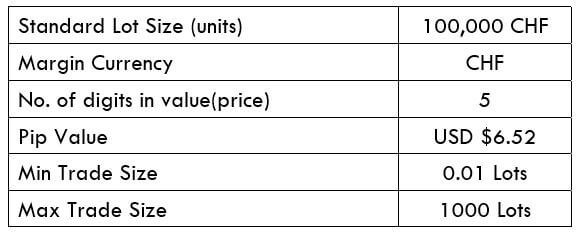
CHF/DKK Specification

Spread

A spread is described as a distinction between the buying & offering price of a Forex pair. In other words, it is a distinction between the ask-bid price of an asset. Below is the spread charges for ECN and STP stock brokers for CHF/DKK pair.

ECN: 12 | STP: 17

Fees

A Fee is a cost that we traders pay to the broker for achieving a trade. The Fees differ on the type of broker (STP/ECN) we use.

Slippage

When we want to implement a trade at a specific market rate, but as a replacement for it, the trade gets implemented at a different rate, and that is because of the slippage. Slippage occurs when we deal with a volatile market, and when we execute a large order at the same time.

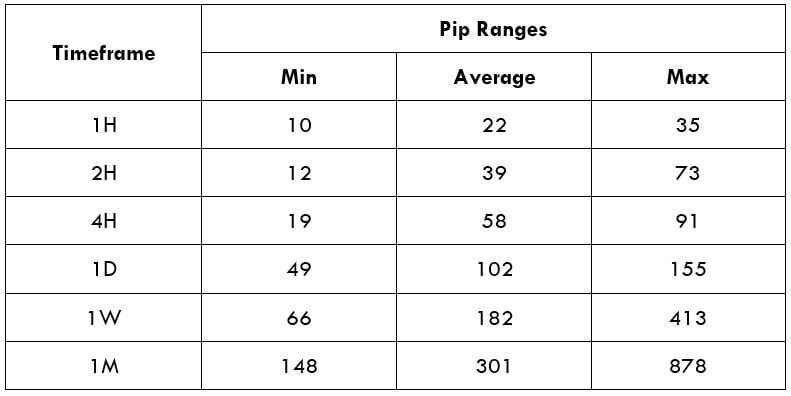
Trading Range in CHF/DKK

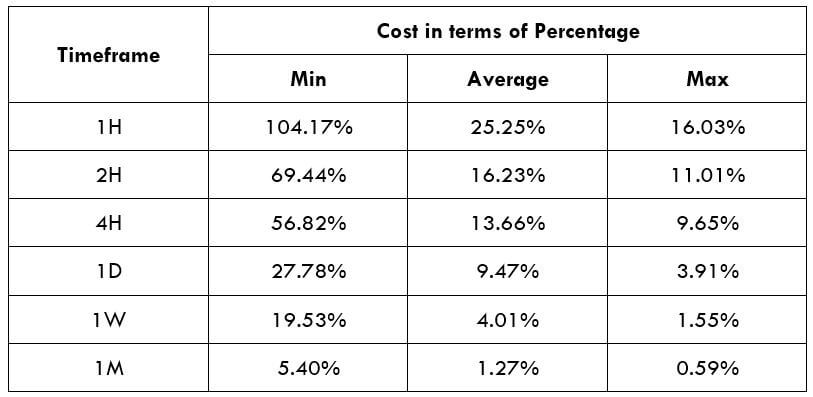
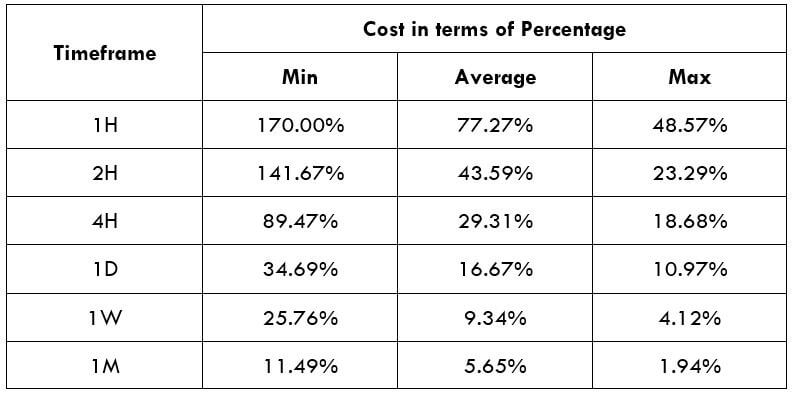
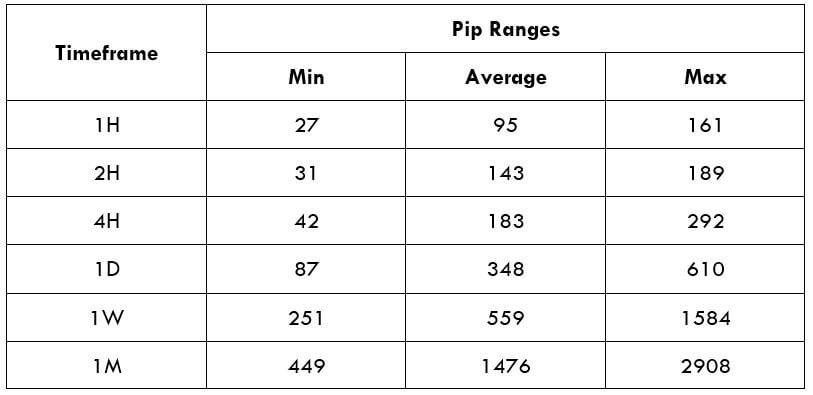
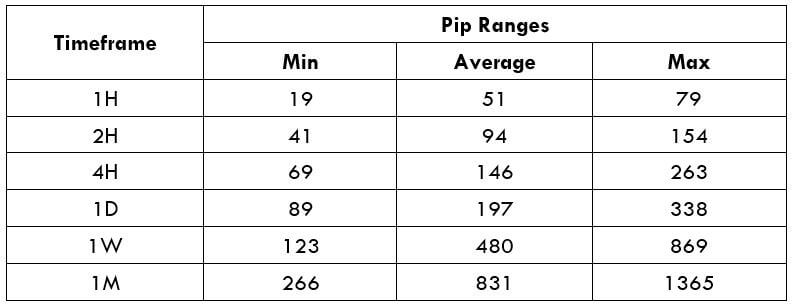
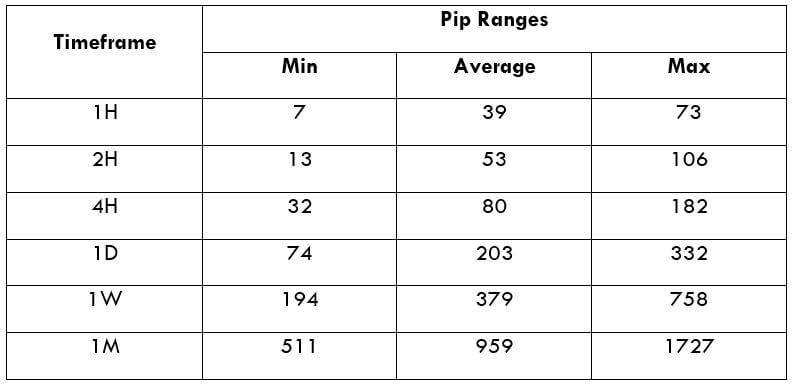
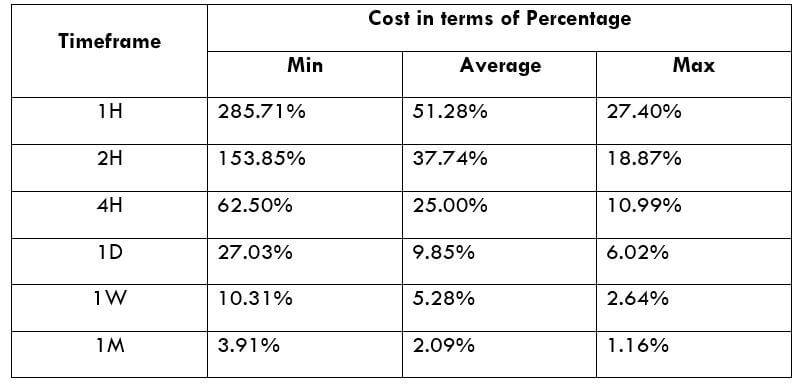
The trading range in the table below will ascertain the amount of money we will gain or lose in each timeframe. We have the interpretation of the minimum, average, and maximum pip movement in a currency pair in the below table. Now we will use the ATR indicator that demonstrates the price movement in a currency pair.

Below is a table demonstrating the minimum, average, and max volatility (pip movement) on numerous timeframes.

Procedure to assess Pip Ranges

  1. Add the ATR indicator to your chart
  2. Set the period to 1
  3. Add a 200-period SMA to this indicator
  4. Shrink the chart so you can assess a large time period
  5. Select your desired timeframe
  6. Measure the floor level and set this value as the min
  7. Measure the level of the 200-period SMA and set this as the average
  8. Measure the peak levels and set this as Max.

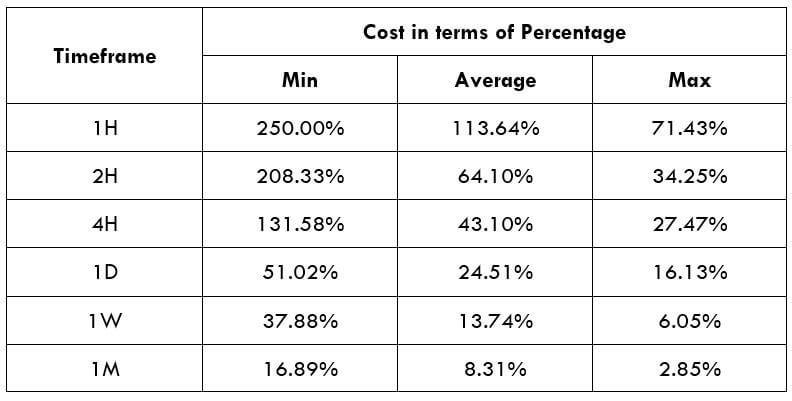
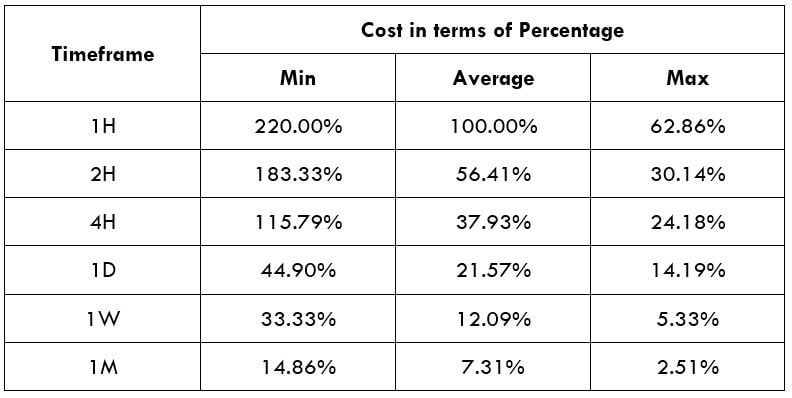
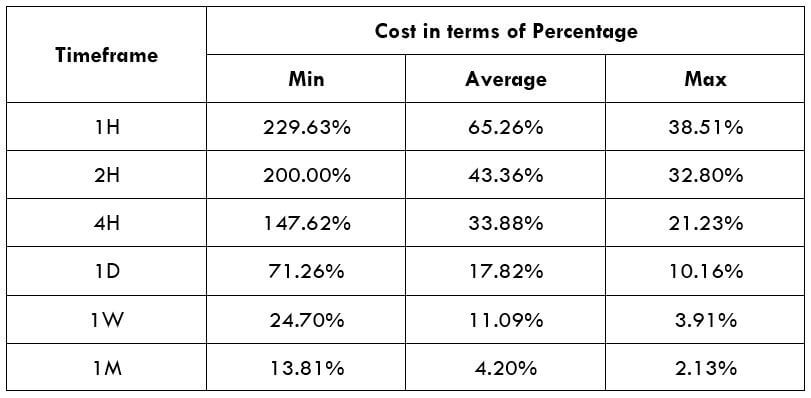
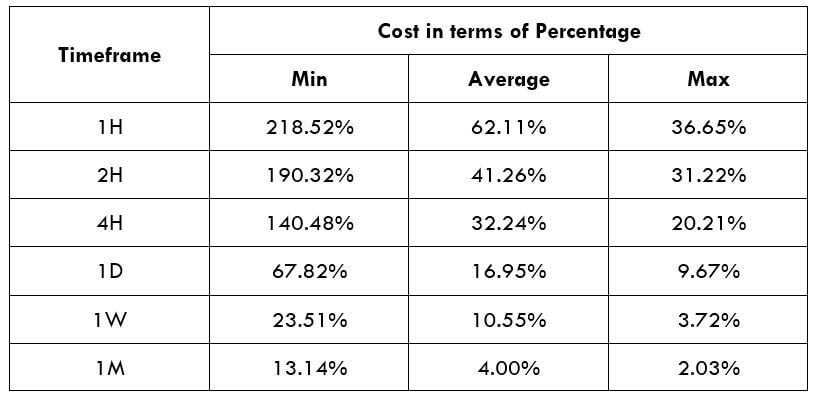
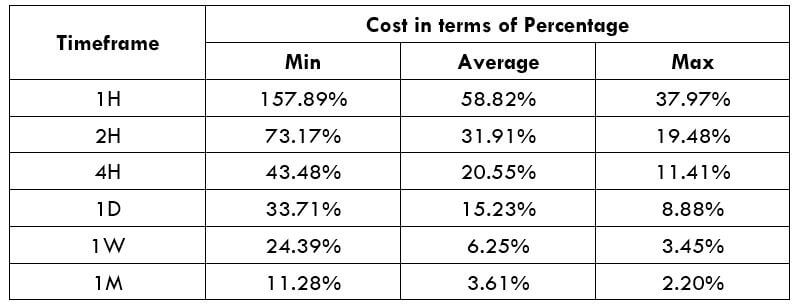
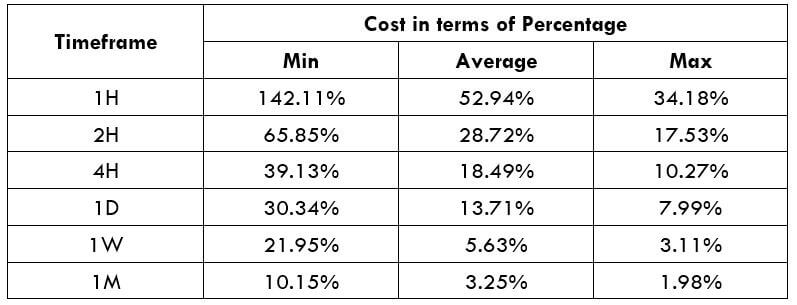
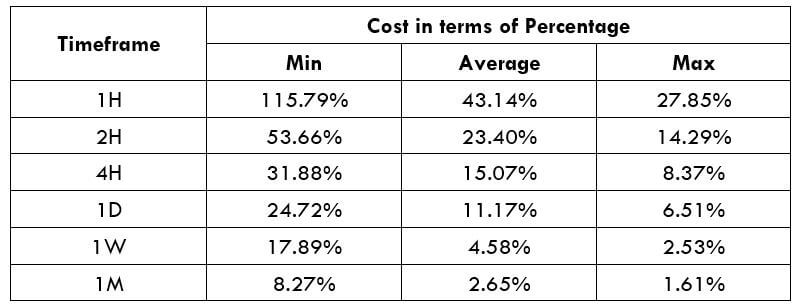
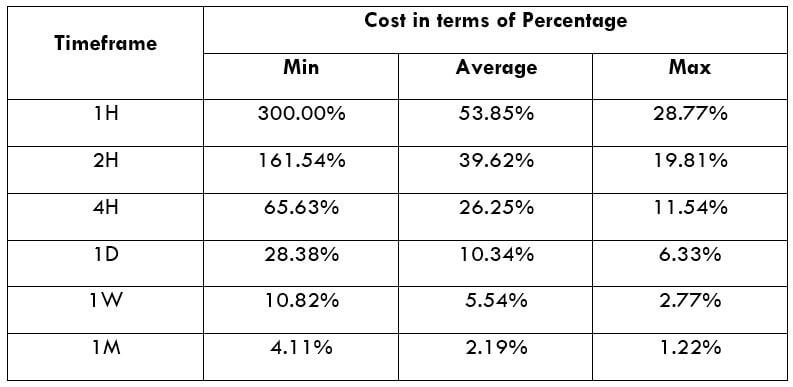
CHF/DKK Cost as a Percent of the Trading Range

The price of trade differs on the type of broker and fluctuates based on the volatility of the market. The aggregated cost of trade involves spread, fees, and occasionally slippage if the volatility is high. To reduce the cost of the trade, we can use limit orders as an alternative for market execution.

ECN Model Account

Spread = 12 | Slippage = 5 | Trading fee = 8

Total cost = Slippage + Spread + Trading Fee = 5 + 12 + 8= 25

STP Model Account

Spread = 17 | Slippage = 5 | Trading fee = 0

Total cost = Slippage + Spread + Trading Fee = 5 + 17 + 0 = 22

The Ideal way to trade the CHF/DKK

CHF/DKK is an exotic currency pair. Here, the average pip movement in 1hr timeframe is 99, which implies higher volatility. The greater the volatility, the greater is the risk and low cost of the trade and the other way around. Considering the above tables, we can see from the trading range that when the pip movement is lower, the proportion is high, and when the pip movement is elevated, the proportion is low.

The ratios are higher in the minimum column. This indicates the cost is high when the volatility of the market is lower. For example, on the 1H timeframe, when the volatility is 24 pips, the cost percentage is 104.17%. Meaning, one must accept high costs if they enter or exit trades when the volatility is around 24 pips. So, preferably, it is suggested to trade when the market volatility is higher than the average.

Categories
Forex Harmonic

Head and Shoulders Often Comes with a Different Look

The Head and Shoulders formation is one of the most traded patterns in the financial market. It offers an excellent risk-reward, thus it is very fruitful if we understand and get well acquainted with it. A typical Head and Shoulders pattern that we usually see in the trading lesson is very easy to be spotted out. However, the financial market makes a lot of adjustments. Thus, the traders need to make some adjustments as well. In today’s lesson, we are going to demonstrate an example of a Head and Shoulder pattern, which is a bit different in its looks.

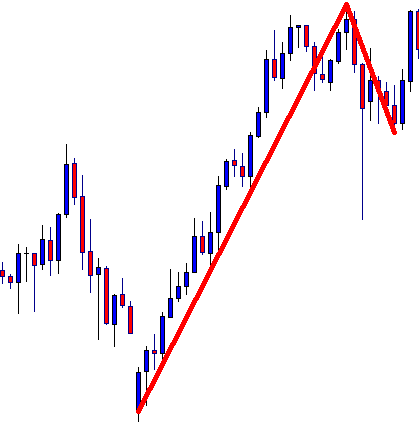
The price heads towards the North with good bullish momentum. It seems that it has found its resistance, where it has produced a double top. At its second rejection, it has produced a bearish engulfing candle followed by another bearish candle. Thus, we have drawn a line to show the lowest low and the highest high.

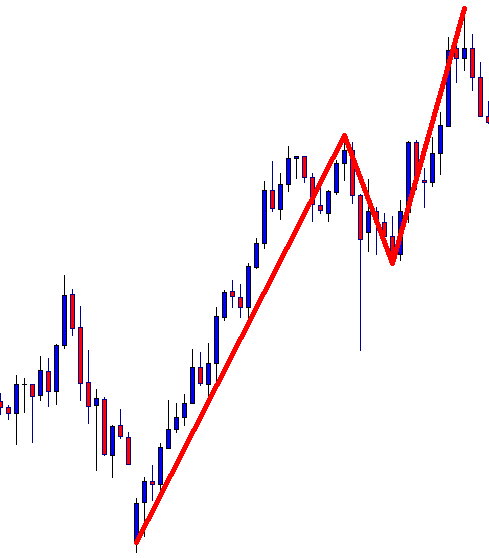
The price makes a bearish correction. It seems to have found its support. It has produced a bullish engulfing candle followed by another one. Let us assume this is the last wave’s lowest low.

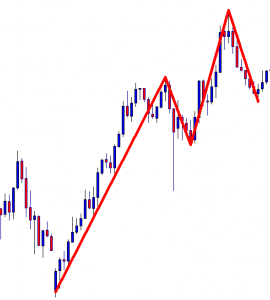
The price heads towards the North and makes a breakout at the wave’s highest high. So far, it seems like an ABC pattern. However, the price produces another bearish engulfing candle followed by a bearish candle. It suggests that the price may head towards the South for a bearish move.

It makes a bearish move and seems to have found its support. The level of support produces three consecutive bullish candles. Let us draw another line here. Here is a question. Do you see anything here? If you do, you are well known with Head and Shoulder pattern. If you do not, you may have to study and work with your Head and Shoulder pattern more.

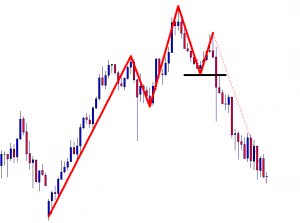
The price makes another bearish move upon producing two consecutive bearish candles. Some Head and Shoulder pattern sellers may want the price to go further down to have its support at the same neckline level. However, the price does not go towards the same neckline level. It makes a breakout at the very last lowest low. What do the sellers do here? Let us find the answer from the next chart.

The chart shows that the price heads towards the South with good bearish momentum. It may continue its move up to the first swing low from where the Head and Shoulder is initiated. The most important point here is the price gets bearish once it makes a breakout at the level of support drawn by the black line. This is the neckline of the Head and Shoulder. It may get difficult to find out since many sellers may wait for the price to have a bounce at the around the same level where the price produces its neck. As mentioned, this world is not perfect, neither the Forex market is. We often need to adjust in the market to trade. Today’s lesson is one of the examples of that.

Categories
Forex Course

133. Divergence Cheat Sheet and Summary

Introduction

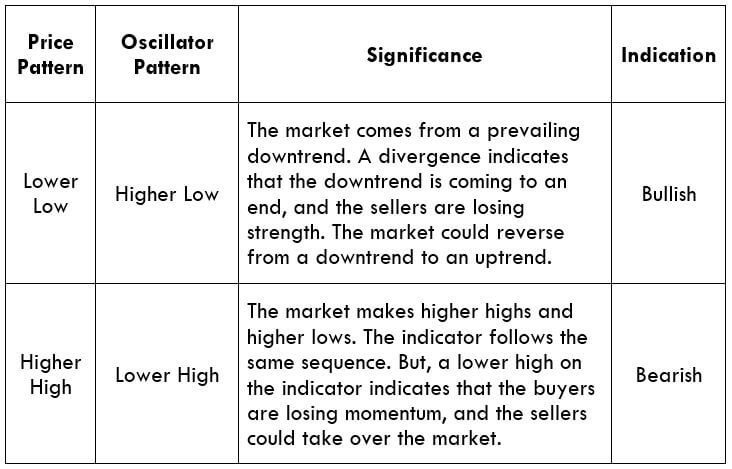
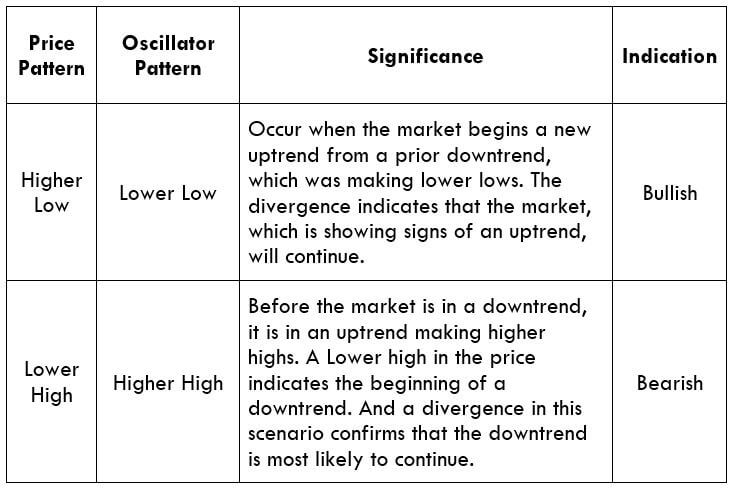
The previous chapters dealt with the interpretation of divergence, its types, strategies, and the rules involved in it. In this article, we have provided a cheat sheet that will cover all the divergence topics in short.

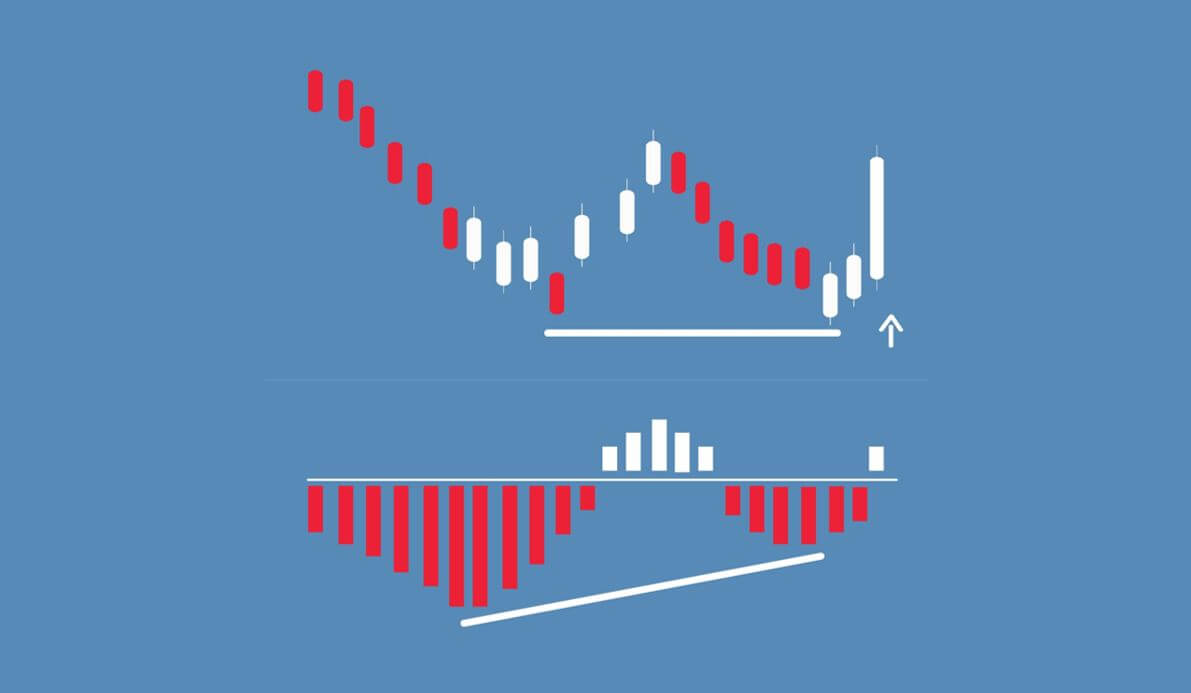
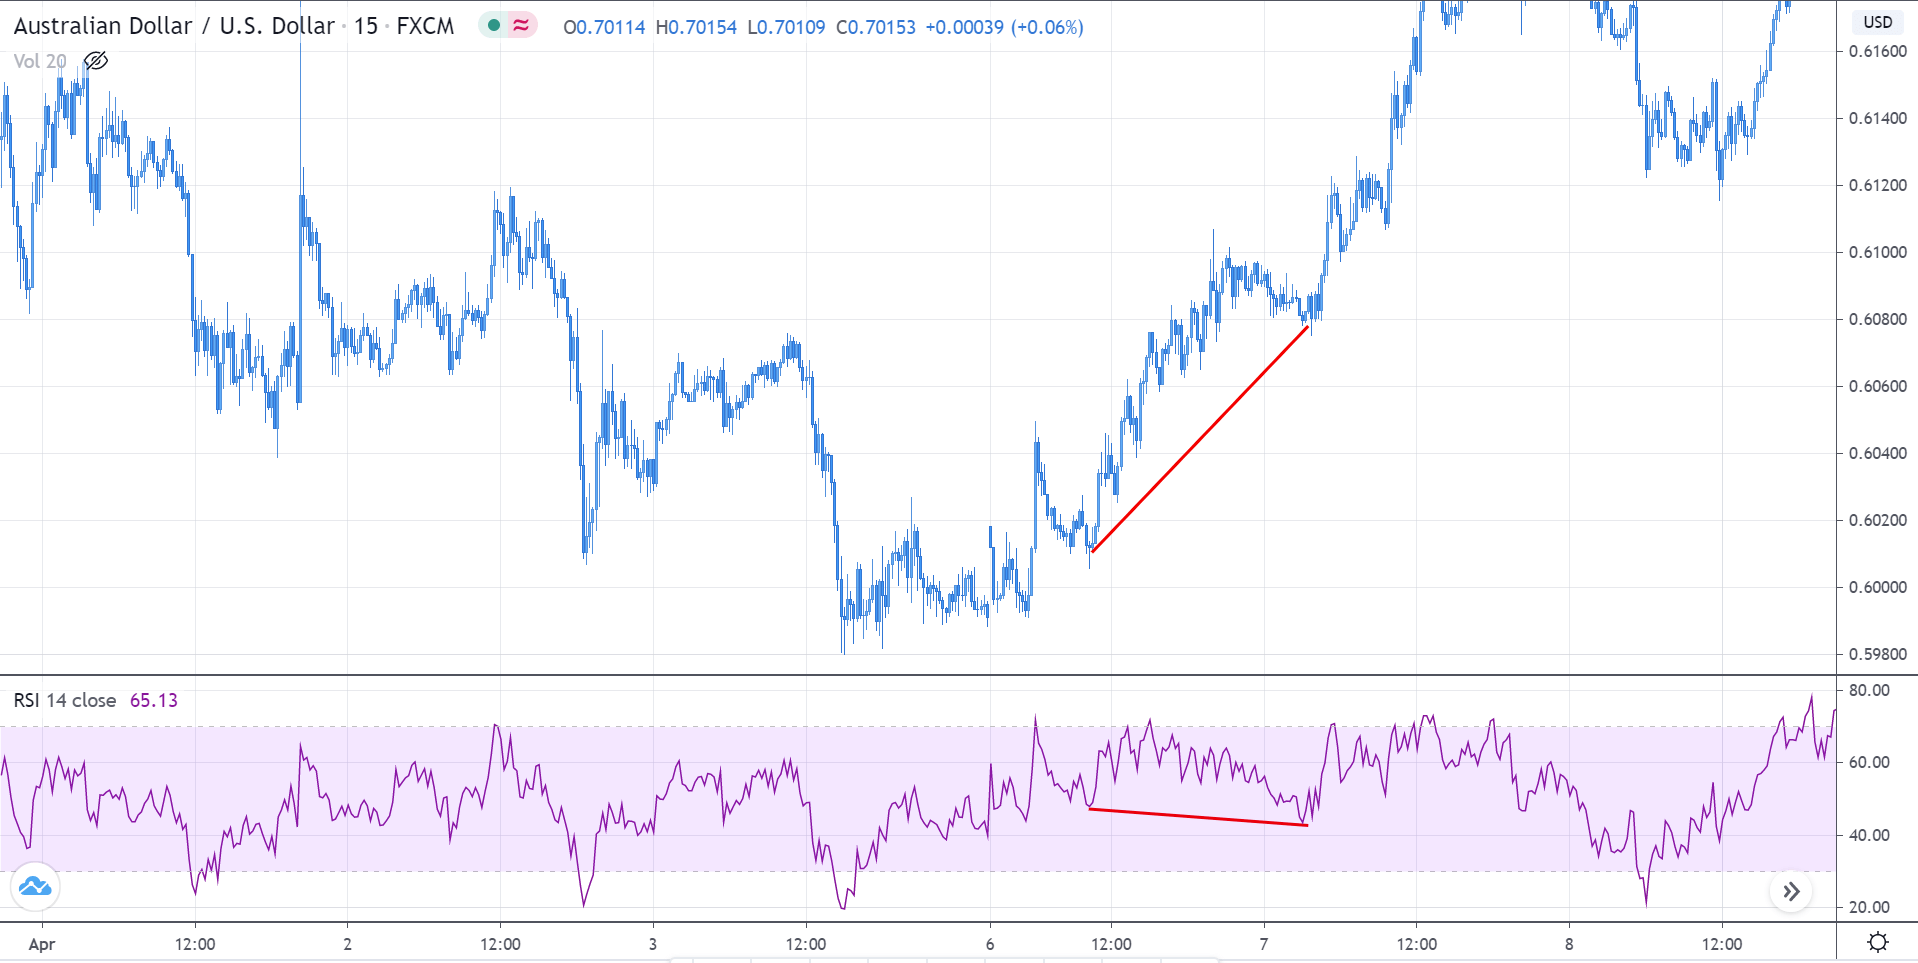
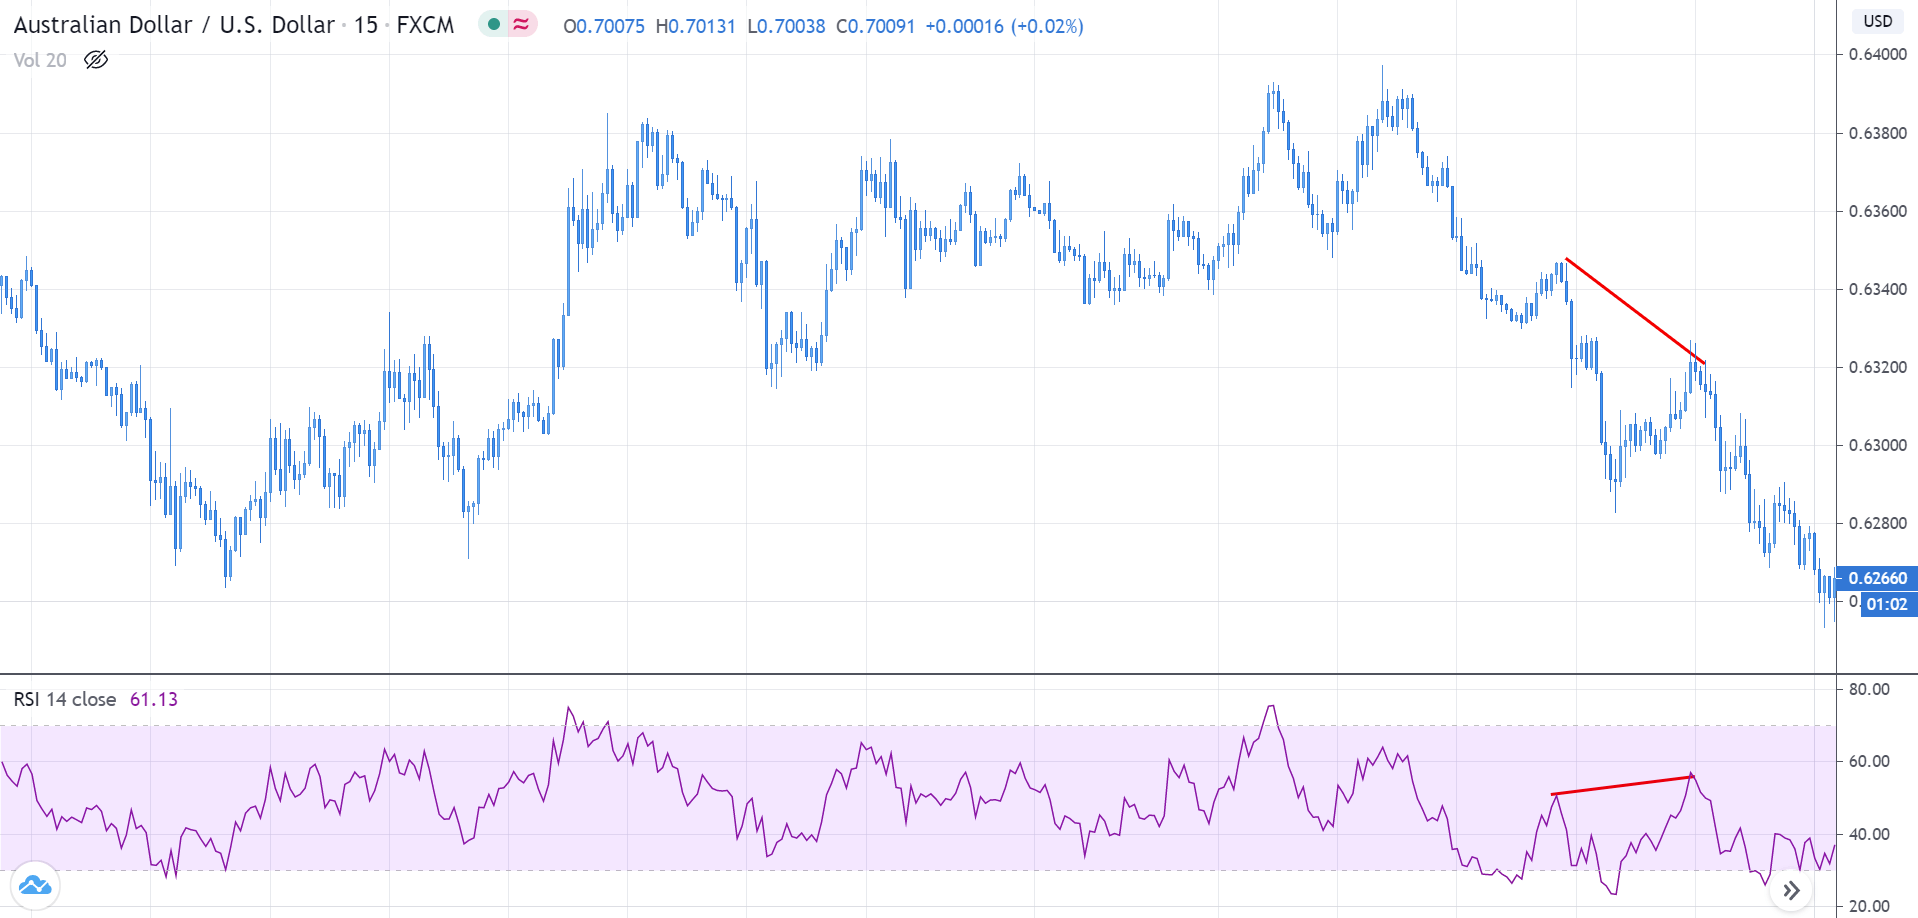
Divergence: This a concept in technical trading that determines if the market is going to reverse or continue the trend. It is identified when the price and the indicator move in opposite directions.

Based on the direction it will prevail in, there are two types of divergence:

  1. Regular Divergence
  2. Hidden Divergence

Each of them is divided into types – Bullish and Bearish, based on the direction they are biased. Here is a quick cheat sheet for trading Regular and Hidden Divergence.

Regular Divergence

Regular divergence is divergence, which indicates a reversal in the market. These occur during the end of a trend and are quite easy to spot.

Hidden Divergence

Hidden divergence indicates a possible trend continuation. These usually occur at the beginning of a new trend and are comparatively tricky to spot.

Not all indicators can be used to spot divergence. Only momentum oscillators indicate a divergence in the market. Some of the most used momentum oscillators to determine divergence include Commodity Channel Index (CCI), Relative Strength Index (RSI), Stochastic, and William %R.

Divergence is a trading concept that works exceptionally well in some cases but fails to give the right indication sometimes. Thus, traders must follow every rule that is discussed in the previous article. We hope you found this course of Divergence trading informative and useful. Happy trading!

Categories
Forex Daily Topic Forex Fundamental Analysis

How Important Is ‘Corporate Profits’ Economic Indicator In Determining A Nation’s Economy?

What is Corporate Profit?

Corporate profit is the money left after the company pays all its expenses and taxes. The money that is collected by the company after selling all products and services during the specified period is considered as line revenue. From this revenue, various deductions happen in the form of tax and salaries, to name a few. Money left over after all the expenses are paid considered to be the company’s profit. The profit earned by the company is an important parameter when it comes to the fundamental analysis of a company.

How is Corporate Profit measured?

The corporate profit economic indicator calculates the net income of a company that is measured by considering the following factors:

Profits from present production – This type of profit is gained from two components. First, the income that is gained after inventory replacement is included in this, and secondly, the income statement depreciation is considered. This type of profit is also known as operating or economic profit.

Profit on books – The profit earned from net income minus inventory and depreciation adjustment is known as book profits.

Profit after-tax – Book profit after the tax deduction is called profit after-tax. This type of profit is believed to be the most relevant number when calculating corporate profit.

Real Corporate Profit

Corporate profits are one of the most studied data of a company. It also plays a major role in other financial measures of the country. Profit is not a measure of the amount of cash a company earned in a given period. We need to understand the income statement that includes non-cash expenses as well. It is also important to understand the changes in accounting methods that have influenced the profit margins.

These are some hidden charges that are directly deducted from the net profit. Therefore, it is often more appropriate to consider profit as a percentage of sales when comparing one company to another. Remember, a comparison between companies should be made among companies within the same industry, and the net profit should be seen in this context.

Analyzing corporate profits

Corporate profit is nothing but a company’s income and the one that is directly reflected in the official statement. Hence, they are one of the most important things to consider when investing in the shares of a company. Increasing corporate profits means either increasing corporate spending, growth in retained earnings, or increasing dividend payments to shareholders. All of these are positive steps taken by a company indicating growth.

The corporate profits data is most useful for an investor rather than a trader. It involves buying the shares of a company and holding them for a minimum of 3 months. An investor may also use this number to do performance analysis. If an individual notices an increase in the profit of a particular company while the overall corporate profits are declining, it could signal company strength. Alternatively, if an investor notices that the company’s profits are declining while overall profits are increasing, i.e., of the sector, a structural problem may exist in the company.

Economic reports

Corporate profits are through statistical reports that are published by the Bureau of Economic Analysis (BEA). It is a comprehensive report comprising of the company’s net revenue, earnings before tax, earnings after tax, corporate profits, expenditure, etc. Finally, the report summarises the net income of corporations in the National Income and Product Accounts (NIPA). One thing we have to make a note of here is that the corporate profit numbers derived from the NIPA, which is dependent on the GDP growth, are different from the profit statements released by the companies. So, while analyzing the data, we need to be cautious by looking at both the numbers and rely on the ones where the difference is not huge.

Impact on Currency

There might not be a direct relationship between corporate profits and the value of a currency as the former is more company-specific and represents a very small portion of the economy. However, an overall corporate profit that is a collective data of all companies affects the stock market. If the data is good, it means the manufacturing is growing and that domestic companies are generating profits. This, in turn, has a positive impact on the currency and leads to an appreciation of the domestic currency. However, if the collective data is negative, it can lead to depreciation of the currency in the long term.

Sources of information on Corporate Profits

Corporate tax data is released by the Bureau of Economic Analysis (BEA) quarterly on the official website. Another reliable source of information on corporate profits is the press release by the respective companies. The press releases can be found on the website of the stock exchange. Links to Corporate Profits sources

GBP (Sterling) – https://tradingeconomics.com/united-kingdom/corporate-profits

AUD – https://tradingeconomics.com/australia/corporate-profits

USD – https://tradingeconomics.com/united-states/corporate-profits

CAD – https://tradingeconomics.com/canada/corporate-profits

EUR – https://tradingeconomics.com/germany/corporate-profits

JPY – https://tradingeconomics.com/japan/corporate-profits

Corporate profits are a closely watched economic indicator by institutional investors. Profitability provides a summary of the company’s financial health and serves as an essential indicator of economic performance. Profits are retained earnings, providing much of the capital for investing in productive capacity. The estimates of profits and related measures are used to evaluate the effects on corporations of changes in economic policy and the financial condition of the country.

Impact of the ‘Corporate Profits’ news release on the Forex market

Corporate profit, also called net income, is the amount remaining within the company after all costs such as interests, taxes, and other expenses are deducted from total sales. It is also referred to as net profit or net earnings. A high cumulative corporate profit generally indicates that a company is running efficiently, providing value to its shareholders, and contributing towards the growth of the manufacturing sector.

It is significant because it shows how well the company has managed its costs. The corporate profit data is not that important for traders as it does not have a direct impact on the value of a currency. Hence, we should not expect high volatility in the currency after the news announcement.

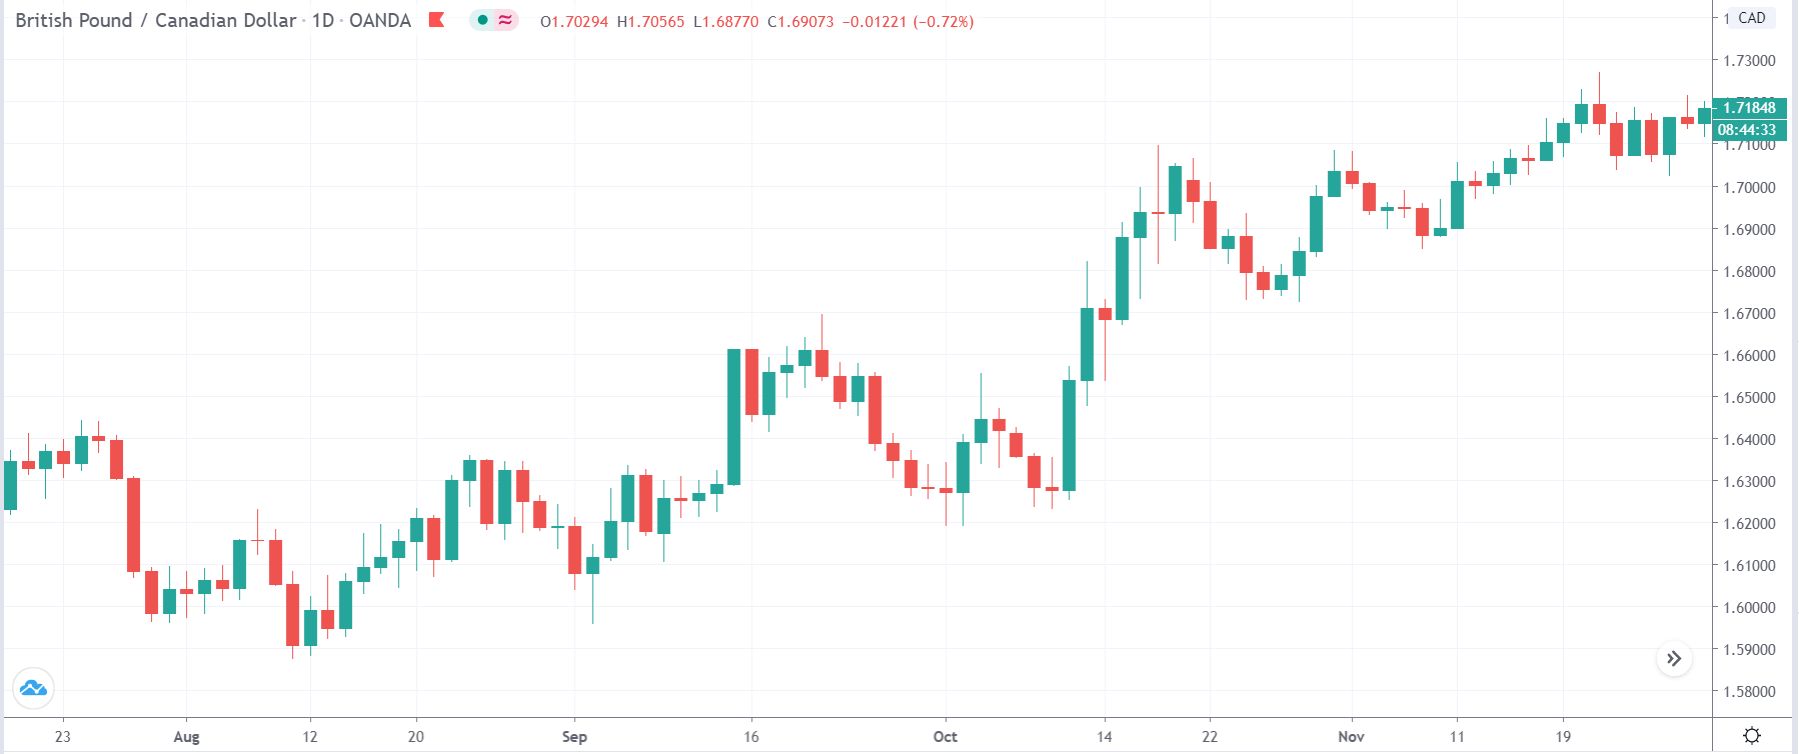
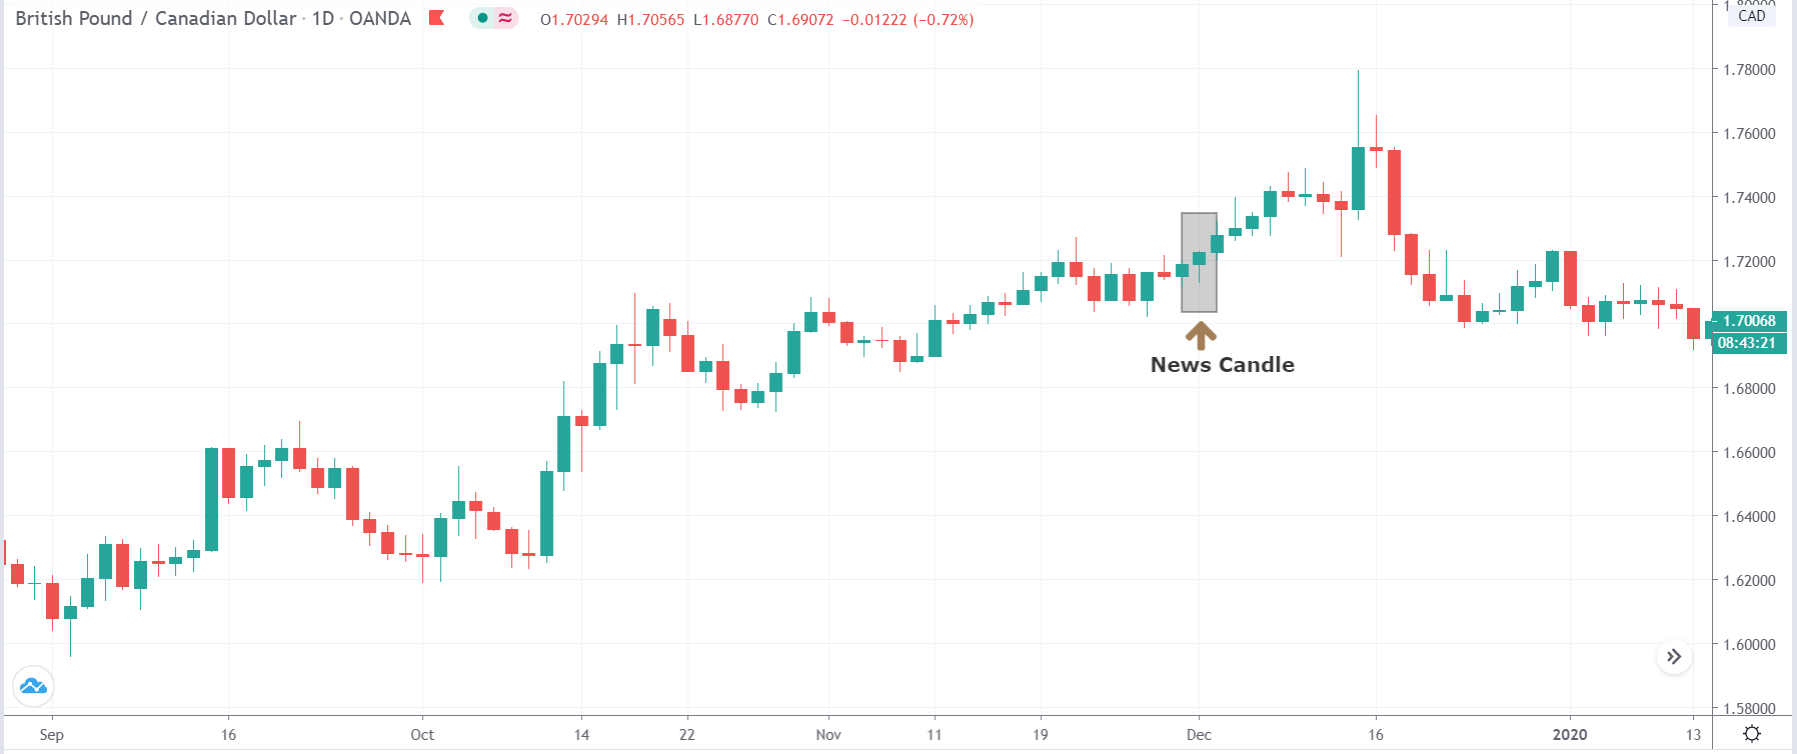
In the following section of the article, we will be analyzing the impact of Corporate Profit on various currency pairs and analyze the change in volatility due to the news release. The below image shows the latest quarter’s corporate profit in Canada that was released in June. We see a major drop in profits compared to the previous quarter, which means companies were unable to make huge profits in this quarter. Let us find out the reaction of the market to this data.

USD/CAD | Before the announcement

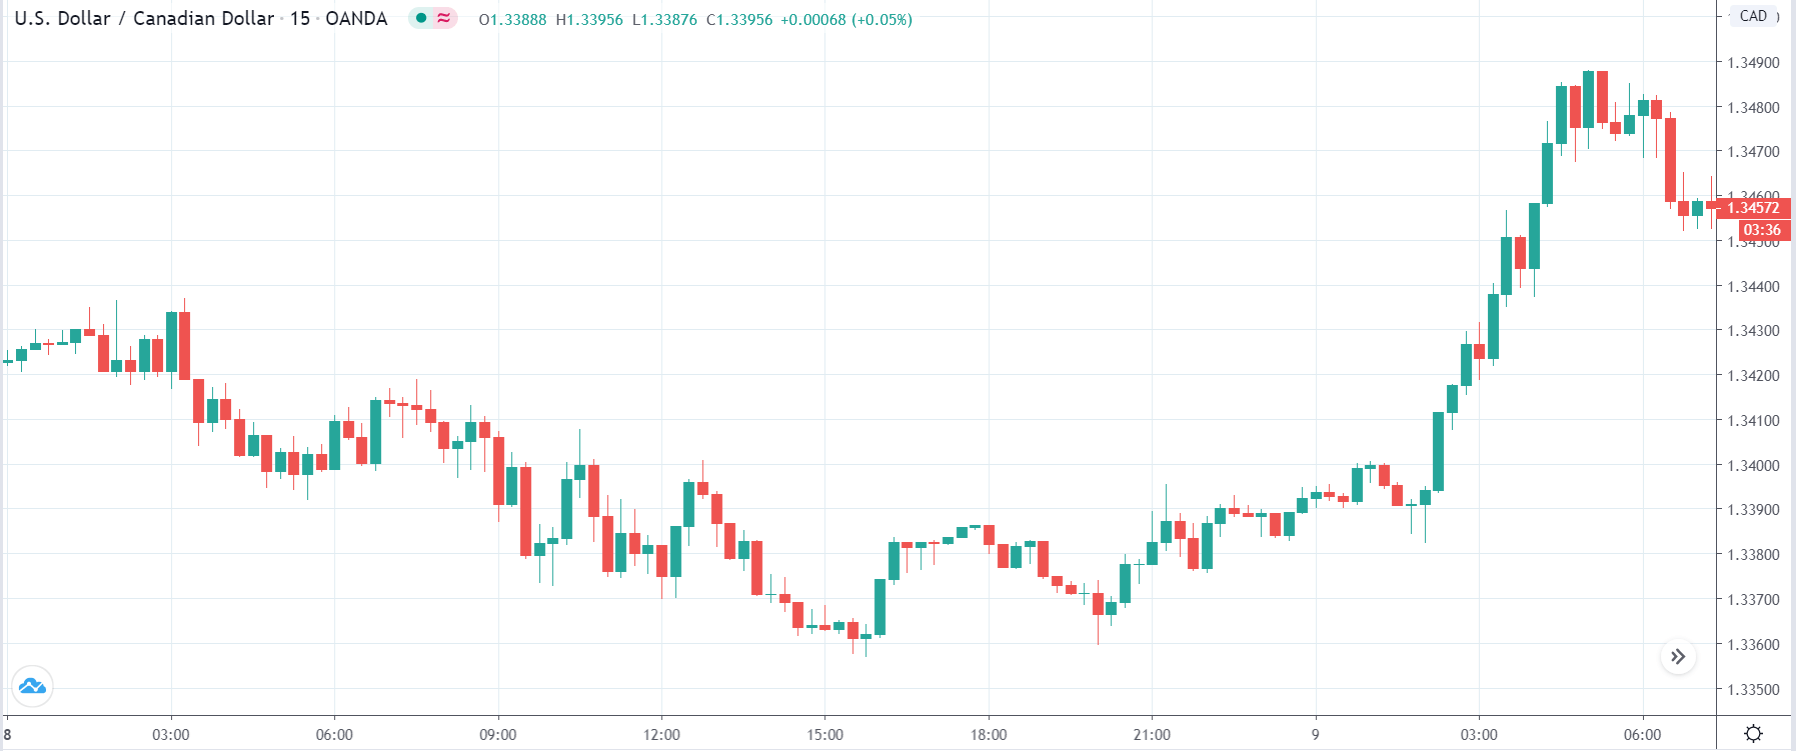
We will first examine the USD/CAD currency pair to observe the impact of corporate profit on the Canadian dollar. The above image shows the state of the chart before the news announcement. We see that the pair is in a strong uptrend, and recently the price seems to be retracing. Our approach should be to ‘buy’ the currency pair as the major trend is up, but the price needs to retrace to an important technical level before we can buy. Let us see that if ‘news’ gives us that opportunity.

USD/CAD | After the announcement

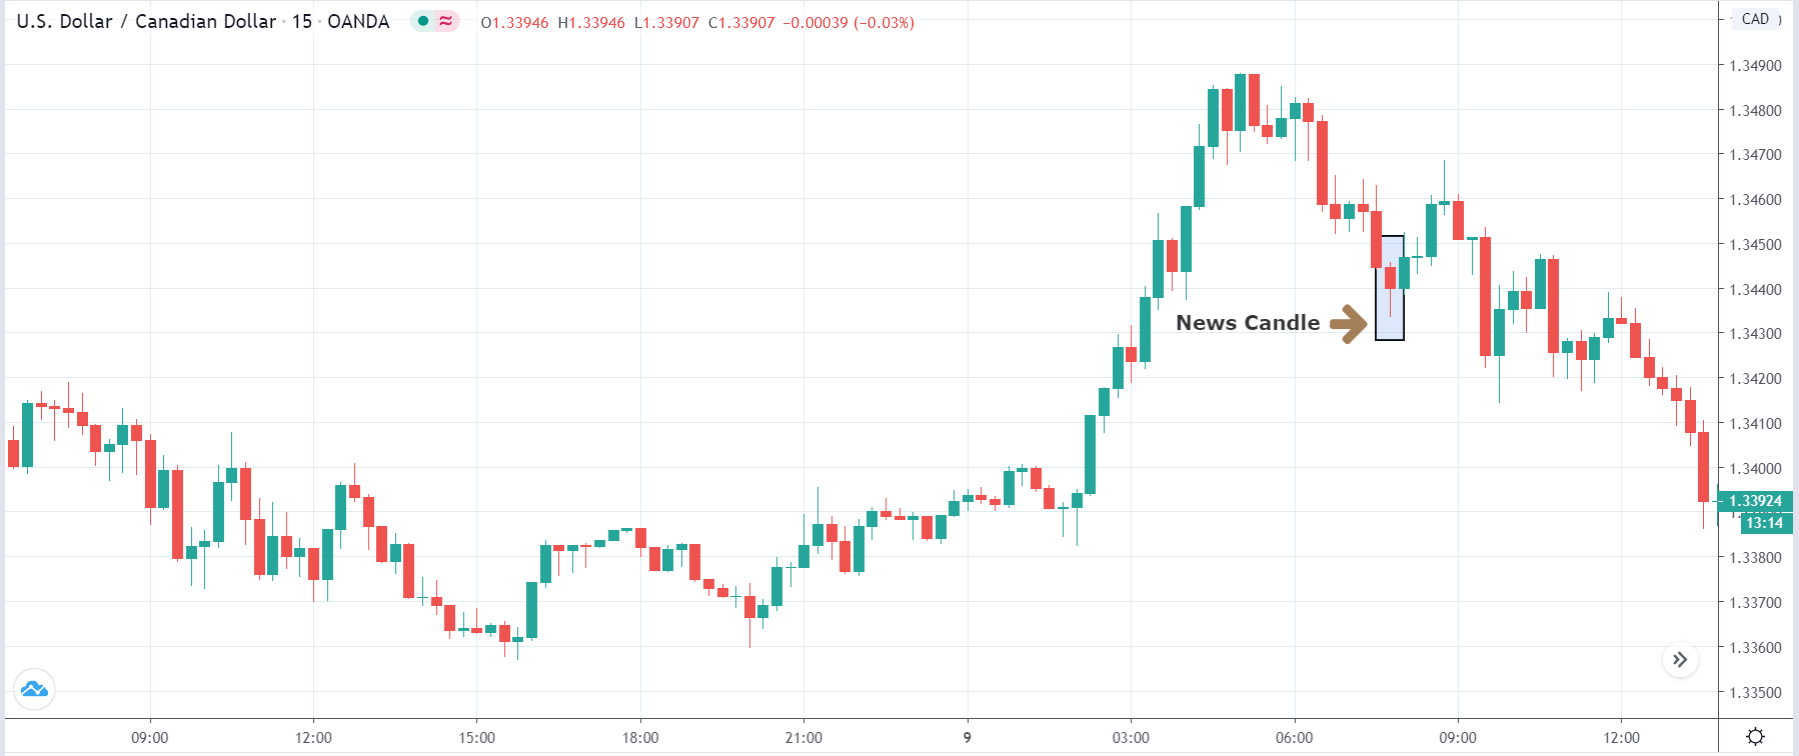
After the news announcement, the price goes lower, and volatility increases to the downside. Even though the Corporate Profit data was awful for the economy, traders went ‘long’ in the Canadian dollar by selling U.S. dollars. The bearish news candle shows that the news candle did not have any adverse effect on the currency. Few hours after the news announcement, volatility continues to increase on the downside, and we witness large selling pressure in the market.

GBP/CAD | Before the announcement

GBP/CAD | After the announcement

The above images represent the GBP/CAD currency pair, where we see that before the news, the market is moving in a ‘range,’ and recently, the price has moved higher after reacting from the support. Since the impact of corporate profits is least on the currency, traders shouldn’t be scared of the news release and can take a position in the market according to their strategy.

After the news announcement, the market slightly moves lower, or even one could argue that the news release had a major impact on the currency. The corporate profit data had a minor impact on the currency pair, which lasted for a few minutes. Traders should analyze the pair technically and not be worried about news data.

CAD/CHF | Before the announcement

CAD/CHF | After the announcement

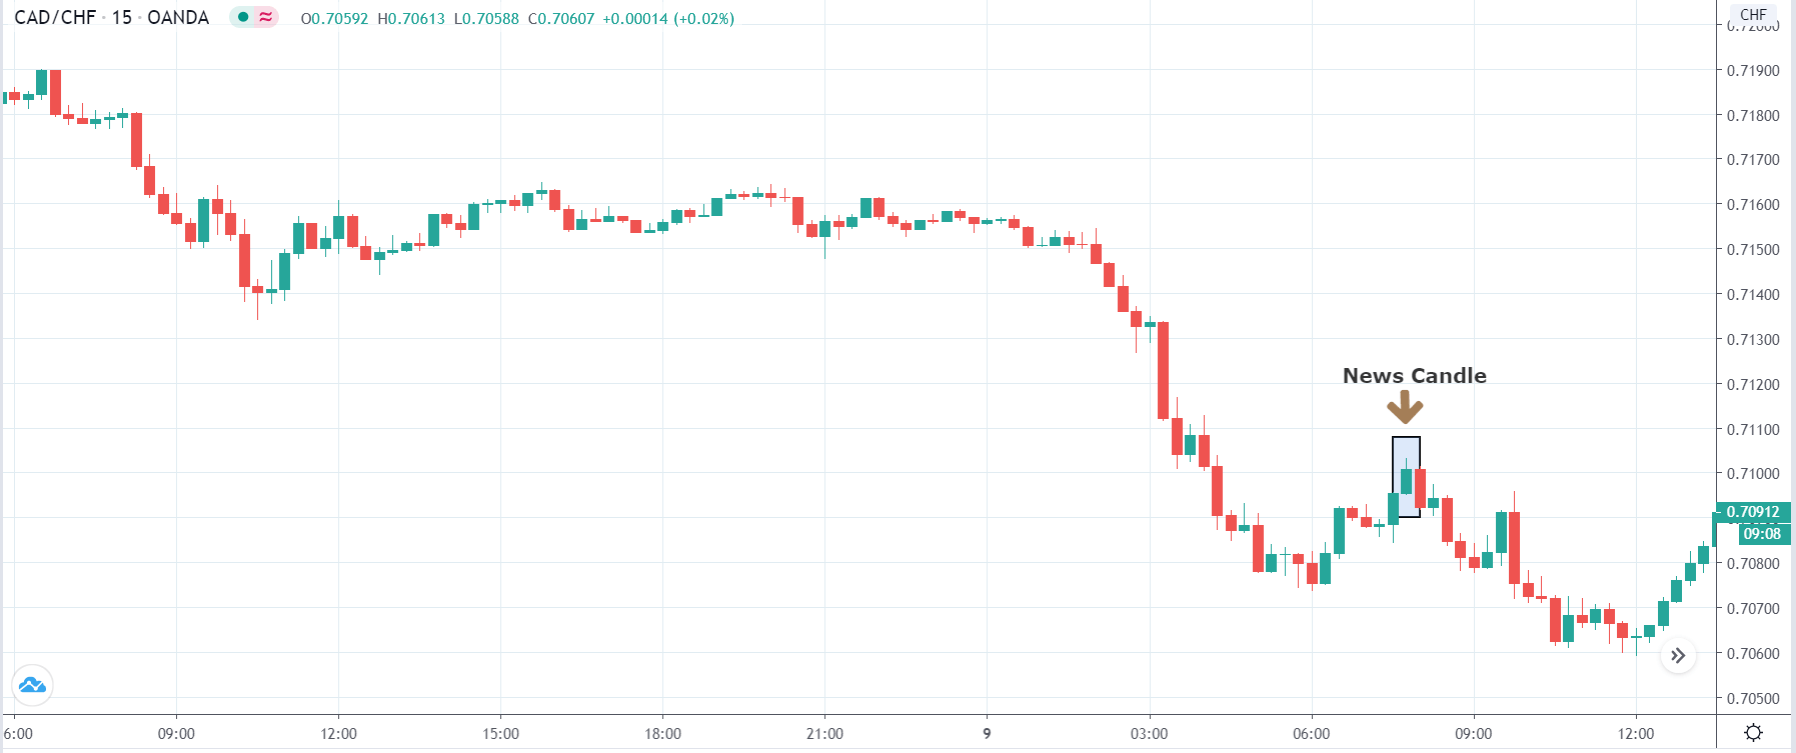
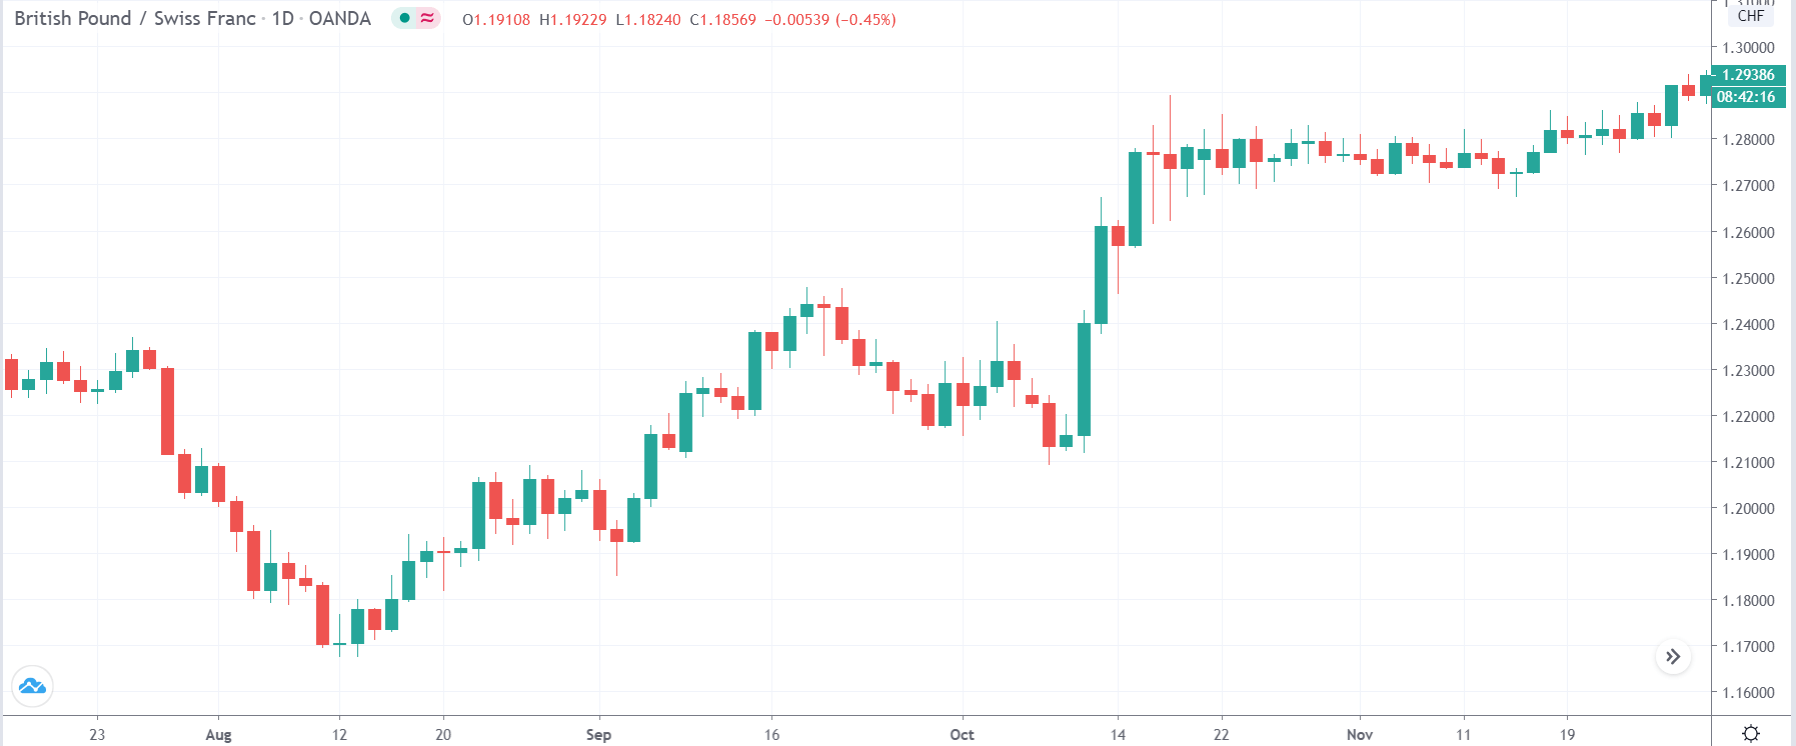
The above images are that of CAD/CHF currency pair, where we see that the market in a strong downtrend with some minor price retracement at the moment. We should be looking to go ‘short’ in the currency pair after the occurrence of the price continuation pattern in the market. However, if the price continues to move higher, the sell trade is off the table. Conservative traders can wait for the news release and then take a position based on the impact of the news.

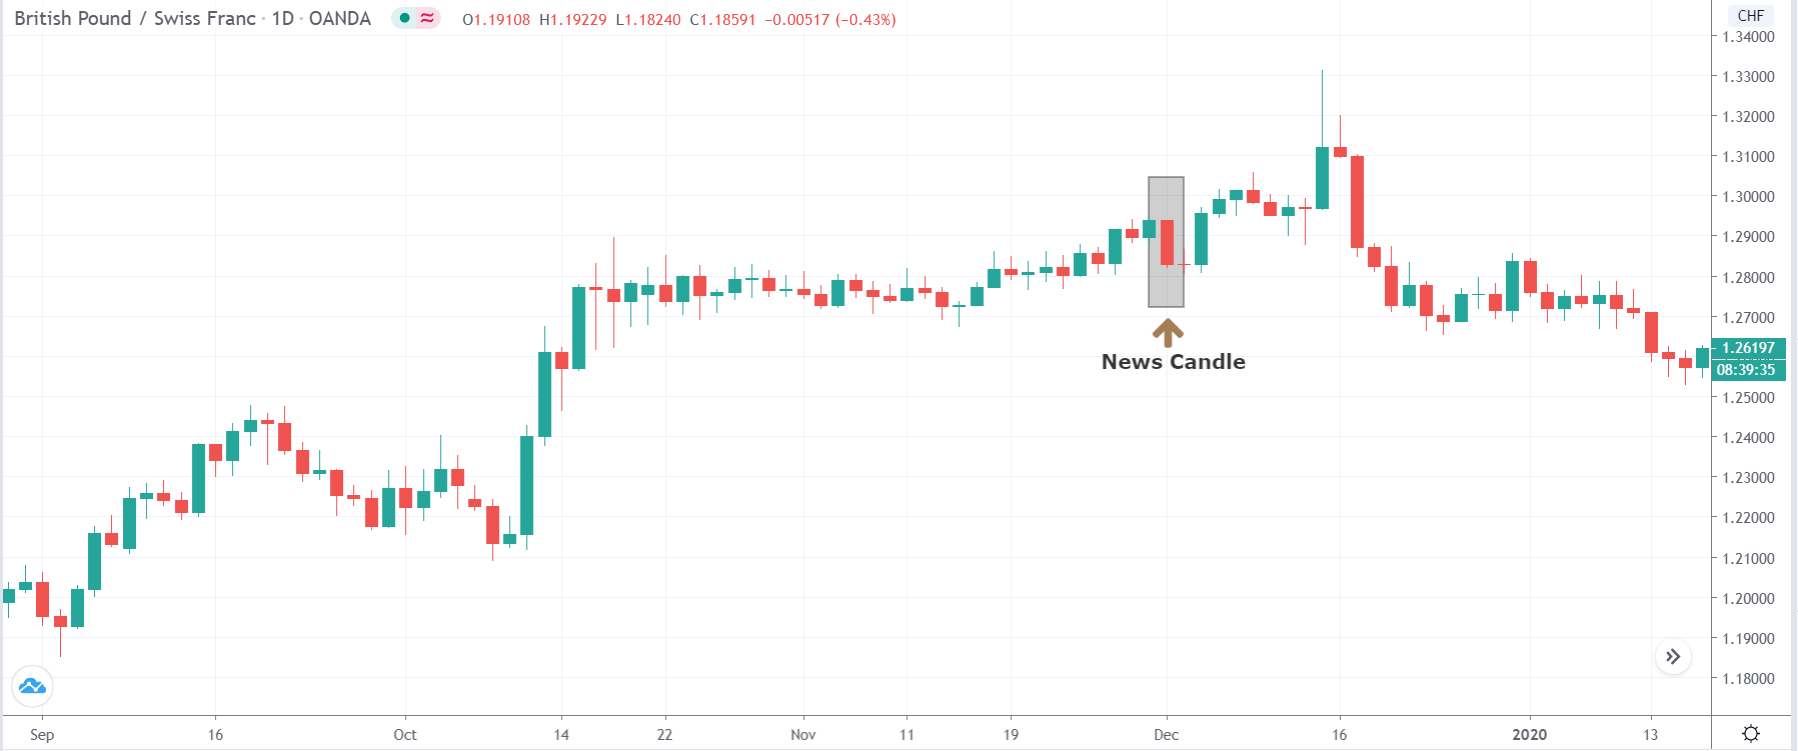
After the news announcement, the price moves higher, and volatility expands on the upside. The small up move gets completely retraced by the immediate next candle, and the market continues to move lower. Hence, it is evident that the news has a negligible impact on the currency pair, where the overall trend of the market dominates the move after the announcement.

We hope you understood this Fundamental Indicator and its relative impact on the Forex price charts. All the best!

Categories
Forex Market Analysis

Daily F.X. Analysis, June 25 – Top Trade Setups In Forex – U.S. GDP Under Spotlight!

As risk aversion emerged in the market, the U.S. dollar became strong, and equity prices in Wall Street started losing as the speed of the U.S. dollar rallied. On the news front, the eyes will be on the U.S. Final GDP, Durable Goods Orders m/m, and Unemployment Claims figures due to come out during the New York Session. Overall the macroeconomic events are expected to be positive, and these may keep the U.S. dollar bullish today while keeping gold bearish.

Economic Events to Watch Today 


EUR/USD – Daily Analysis

The EUR/USD pair was closed at 1.12499 after placing a high of 1.13257 and a low of 1.12481. Overall the movement of the EUR/USD pair remained bearish throughout the day. The EUR/USD pair in the risk-off market sentiment moved in a downward trend on Wednesday on the back of strong U.S. dollar and U.S. tariffs on E.U. & U.K.

On late Tuesday, a document from the United States Trade Representative office said that the U.S. was considering an additional list of products from France, Germany, Spain, and the U.K. to be placed with 100% duty. The products included olives, beer, chocolate, coffee, gin, some trucks, and machinery. The enforcement of the new tariffs will potentially take effect from July 26. The move was taken against the long-lasting dispute with E.U. over subsidies to large civil aircraft manufacturers.

In October, WTO ruled that Germany, France, Spain, and the U.K. granted illegal subsidies to plane-maker Airbus and allowed the U.S. to impose $7.5 billion in duties as part of the punishment. Furthermore, in December, WTO also said that the European Union did not end its illegal subsidies, which gave the U.S. further room to impose new tariffs on European products.

This weighed heavily on Euro and dragged the pair EUR/USD towards the negative side. EUR/USD pair was already under pressure due to risk-off market sentiment & U.S. dollar strength. However, the losses were limited as the better than expected macroeconomic data from Europe gave some strength to the Euro. At 13:00 GMT, the German Ifo Business Climate for June exceeded the expectations of 85.0 and came in as 86.2 and supported EUR/USD pair. On the other hand, the Belgian NBB Business Climate was expected as -25.1, which came in June as -22.9 and supported Euro.

As risk aversion emerged in the market, the U.S. dollar became strong, and equity prices in Wall Street started losing as the speed of the U.S. dollar rallied. The DXY was up 0.6 % and rose above 97.10 level on Wednesday. Dow Jones lost 2.40%, and Nasdaq lost 2.05%, the lower return in Wall Street Journal stocks was followed by the latest COVID-19 reports from the several U.S. States. The strength of the U.S. dollar remained a key driver for EUR/USD pair on Wednesday.

Daily Support and Resistance

  • R3 1.1383
  • R2 1.1355
  • R1 1.1304

Pivot Point 1.1276

  • S1 1.1225
  • S2 1.1197
  • S3 1.1147

EUR/USD– Trading Tip

The EUR/USD pair has violated the upward trendline support level of 1.1280, and now it’s finding support around 1.1240 level. The violation of the 1.1240 level can also extend sell-off until 1.1195. The MACD and RSI are holding in a selling zone, which is supporting the selling bias. On the lower side, recently, the formation of a bearish engulfing candle is also suggesting a strong selling bias. Today, we should look for taking a selling position below 1.1240 level to target 1.1195 level, but don’t forget to monitor the U.S. GDP, and Jobless claims data as these are the main ones to impact the market.   


GBP/USD – Daily Analysis

The GBP/USD pair was closed at 1.24199 after placing a high of 1.25425 and a low of 1.24141. Overall the movement of GBP/USD pair remained bearish throughout the day. The risk perceived, GBP/USD currency pair came under heavy pressure after the risk appetite from market faded h gave strength to the U.S. dollar. The GBP was one of the worst-performing currencies on Wednesday after AUD & NZD. Along with decreased risk appetite, Brexit uncertainties also weighed on British Pound. Britain’s Prime Minister Boris Johnson also unveiled new easing measures across England from July 4. This indicted the reopening of pubs and restaurants and less social distancing.

On Brexit front, the E.U. chief negotiator, Michel Barnier, said that he was neither optimistic nor pessimistic about achieving a deal and also described himself as determined to break the deadlock. He also believed that the deal was still possible.

He showed concerns and said that a failure to reach a deal with the European Union would only damage the U.K.’s economy. He added that it was in particular interest of Britain to reach an agreement and avoid no-deal Brexit. He also added that the E.U. was willing to find a margin of flexibility on the sticking point of Britain’s fishing water, but he did not include the level playing field in this statement.

However, talks between E.U. & U.K. will start in the coming week, and the U.K. was an inch closer to the 1st July deadline for extending the transition period, which will end on December 31. On the data front, there was no macroeconomic data to be released from the U.K. so, the pair showed technical movement and followed the U.S. dollar on Wednesday. 

At 18:00 GMT, the House Price Index for April from the United States came in as 0.2% against the expected 0.3% and weighed on the U.S. dollar. But GBP/USD pair failed to give attention to the macroeconomic data from the U.S. and continued falling on the back of a key technical level, which was rejected.day.

Daily Support and Resistance

  • R3 1.2633
  • R2 1.2588
  • R1 1.2504

Pivot Point 1.2459

  • S1 1.2375
  • S2 1.233
  • S3 1.2245

GBP/USD– Trading Tip

The Cable continues to trade with bearish momentum to trade at 1.2406 level, having violated the 1.2460 support level. This level is now working as resistance and can lead the GBP/USD prices until 1.2460 level. On the downside, the GBP/USD may gain support at 1.2380 level and 1.2336 level. Considering the recent bullish crossover on the MACD and bearish bias extended by the RSI, the pair is confusing traders about which way to move. The 50 periods EMA is still suggesting selling bias; therefore, we should consider taking selling trades below 1.2459 level today. 


USD/JPY – Daily Analysis

The USD/JPY pair was closed at 107.050 after placing a high of 107.069 and a low of 106.382. Overall the movement of USD/JPY remained bullish throughout the day. The USD/JPY pair extended the rebound on Wednesday, which was started on Tuesday from the lowest level in seven weeks, near the 106.00 level. The surge in USD/JPY prices was due to the U.S. dollar’s strength across the board.

The Japanese Yen failed to benefit from the declines in the Wall Street Journal and lower U.S. yields. The Dow Jones fell almost 3% on the day, and the S&P 500 fell 2.70%. The U.S. Treasury yield of 10 Years fell to 0.679%. Usually, the risk-off market sentiment tends to give strength to Japanese Yen on Wednesday, the yen fell, and the U.S. dollar gained traction on the back of increasing concerns related to coronavirus contagion.

The President of Chicago Fed, Charles Evans, said on Wednesday that no one at the central bank was thinking about negative interest rates and if Fed moved there it would be a big surprise. He said that there was more space for monetary stimulus and expected the economy to rebound in the other half of the year.

On the other hand, The Bank of Japan offered 8.28 trillion yen (US$ 77.74billiom) in loans to financial organizations under a new lending program. The new fund was aimed at channeling funds to cash strapped firms hit by the coronavirus pandemic. BOJ also eased monetary policy in March & April by pledging to buy more assets, gobble up unlimited amounts of government’s debt and create lending facilities to channel more money to firms.

After BOJ decided to pay 0.1 % interest to financial institutions for taking up loans from the central bank, the number of participants surged to 180 from only 18 in March. The central bank announced that the three-month loans would be extended from Thursday through December 25. On the data front, the Services Producer Price Index (SPPI) from Japan for May came in line with the expectation. From the American side, the House Price Index for April came in as 0.2% against 0.3% expected and weighed on USD.

Daily Support and Resistance    

  • R3 107.99
  • R2 107.54
  • R1 107.28

Pivot Point 106.83

  • S1 106.58
  • S2 106.12
  • S3 105.87

USD/JPY – Trading Tips

The USD/JPY is trading with a bullish bias at 107.191 level, but the closing of recent candles below 107.220 level can drive selling or correction un the market. Although the pair has violated the downward trendline resistance at 107 level and technically, it should show us more buying in the USD/JPY pair. But we also need to consider the double top resistance level of 107.250. I will be happy to take a buy-trade if the USDJPY manages to break above 107.250 level to target 107.650 today. Good luck! 

Categories
Forex Options

FX Options Market Combined Volume Expiries for 25th June 2020

Thank you for visiting the Forex Academy FX Options market combined volume expiries section. Each day, where available, we will bring you notable maturities in FX Options of amounts of $100 million-plus, and where these large combined maturities at specified currency exchange rates often have a magnetic effect on price action, especially in the hours leading to their maturities, which happens daily at 10.00 AM Eastern time. This is because the big institutional players hedge their positions accordingly. Each option expiry should be considered ‘in-play’ with a good chance of a strike if labelled in red, still in play and a possible strike if labelled in orange and ‘out of play’ and an unlikely strike if labelled in blue, with regard to the likelihood of price action meeting the strike price at maturity.

…………………………………………………………………………………………………………………..

FX option expiries for June 25 NY cut at 10:00 Eastern Time, via DTCC, can be found below.

– EUR/USD: EUR amounts

  • 1.1200 1.6bn
  • 1.1260 775m
  • 1.1300 987m
  • 1.1400 736m

EURUSD (1-hour chart) pair is pausing from the bear move yesterday where price action consolidated at position A, and where the support line became a resistance line and where price action was defended at the key 1.13 level. Buyers eventually through the towel in, even after better data came from Germany. This was driven by Dollar strength and where that will continue today, at least until the important slew of US data out later today. The 1.1200 option expiry looks the most likely contender for a strike.

– USD/JPY: USD amounts

  • 105.78 500m
  • 107.00 475m
  • 107.40 501m
  • 108.00 530m

USDJPY is showing signs of being overbought, including the stochastic and divergence. The likely contender for a strike is the 107.00 option maturity. However, signs are that the Yen currency may get bought as risk-off factor gets some momentum due to the spike in Covid-19 cases in the USA. Data from the USA will be telling for the pair later.

– USD/CAD: USD amounts

  • 1.3500 957m
  • 1.3800 2.4bn

USDCAD is in a strong bull trend and is likely to continue for the duration of the European session, at least until US data comes out today. Both option expiries look to be out of play.

Watch out for Initial jobless claims and GDP from the USA plus a slew of other data at 1:30 BST today.

……………………………………………………………………………………………………………………..

As you can see on the charts we have also plotted the expiration levels at the various exchange rate maturities and we have also labelled in red, orange and blue. Therefore, if you see option expiry exchange rates labelled in red these should be considered in-play, because we believe there is a greater chance of the expiry maturing at these levels based on technical analysis at the time of writing. There is still a lesser possibility of a strike if they are in orange and so these are ‘in-play’ too. However, if we have labelled them in blue, they should be considered ‘not in-play’ and therefore price action would be unlikely to reach these levels, which are often referred to as Strikes, at the time of the 10 AM New York cut.

Our technical analysis is based on exchange rates which may be several hours earlier in the day and may not reflect price action at the time of the maturities. Also, we have not factored in economic data releases or keynote speeches by policymakers, or potential market volatility leading up to the cut.

Although we have added some technical analysis we suggest you take the levels and plot them onto your own trading charts and incorporate the information into your own trading methodology in order to use the information to your advantage. Remember the higher the amount, the larger the gravitational pull towards the exchange rate maturity at 10:00 AM Eastern time.

If you want to learn how forex option expiries affect price action in the spot FX market see our educational article by clicking here: https://bit.ly/2VR2Nji

DISCLAIMER: Please note that this information is for educational purposes. Also, the maturities will look more or less likely to become a strike at 10 AM NY time due to exchange rate fluctuations resulting in a different perspective with regard to technical analysis, and also due to upcoming economic data releases for the associated pairs.

Categories
Forex Videos

Fundamental Analysis For Novices – China Fixed Asset Investments


Fundamental Analysis For Novices – China Fixed Asset Investments

Welcome to the educational video on Fundamental Analysis For Novices. In this session, we will be looking at some Chinese economic data, including Fixed Asset Investment, NBS Press Conference, Industrial Production, and Retail Sales.


If you are not already doing so, we advise you to check a reliable economic calendar each day to be forewarned about economic data releases from countries that might affect your trades.


Economic data releases impact the market in various degrees, and you should pay particular attention to the date of the event, the time, and most importantly, the likely impact it will have, which usually is in 3 degrees, low, medium, and high.


Reliable calendars will provide you with the previous data release in each category, the consensus, or the expected data release. This will have been compiled by analysts and economists who have come to an average consensus value and the actual figure, which is updated with the data upon release.
Each country releases similar titled economic data into the market, mostly on an embargoed basis, in order not to give traders an advantage and to avoid market manipulation.


China typically releases economic data releases during the Asian session. It is released by the National Bureau of Statistics of China. And due to the complex nature of the coronavirus pandemic and due to the fact that China was the first country to be severely affected by the disease and the fact that it is the first country to have significantly recovered from the disease, data coming out of the country is of greater market focus at the current time, than perhaps previously.
It is also important to remind ourselves that there is a brewing amount of this quiet between the United States and China and other countries and China who feel that China should have been more proactive when the disease initially broke out.


In the first instance, we can see that there is data due for release for fixed asset investments, year-to-date, year on year, and for the month of May, in monetary value.
Fixed asset purchases is a comprehensive index in the area of construction. These are also known as tangible assets, including machinery, land, buildings, installations, vehicles, and technology. The figure itself shows the scale of pace with regard to overall economic growth within urban investments. In general, a higher number he seemed as bullish for China while a lower number is considered negative. As the whole world looks towards China with regard to how it improves its economic position post epidemic, outside countries who trade with China view this as a significant release.


The data release is followed by a National Bureau of Statistics press conference where a prepared text is usually offered to the media and which will also shed light on the economic situation within China.

Also simultaneously released into the market is industrial production year on year on year for May. Again this has significant importance because it shows the volume of production within Chinese Industries, including factories and manufacturing. This data can also have an effect on inflation and, in which case it is closely monitored by the People’s Bank of China who will adjust monetary Policy if inflation falls outside of its target range.
Generally, high industrial production growth is positive, both in sentiment terms and economic terms for the country, and is seen as bullish. If the reading is low or negative, it means that China is still struggling to improve its economy post epidemic.


And finally, also simultaneously released into the market is retail sales year on year for May. This will also be viewed by all markets as important because it shows the recovery status for China and whether or not the general public is feeling confident enough to go out and purchase goods where they are available in outlets which have been allowed to reopen or have the confidence to post epidemic.
The figure measures the total receipts for retail consumer goods for household purchases, and in general, a high reading is positive because it shows the economy returning to normal, while a low reading is seen as negative, meaning that the Chinese economy is still struggling.
Therefore during the Asian session, you might expect that stock markets rally if the news is good, and you might find that stock markets fall if the news is bad. Commodity countries such as Australia and New Zealand who export heavily into China, might find that their local currencies improve against the dollar if the numbers are high, is because it means China is improving its economy and likely to be importing goods from these countries. And the opposite applies if the data from China is poor.

Categories
Forex Assets

CHF/SGD – Trading Costs Involved While Trading This Forex Exotic Pair

Introduction

CHF/SGD is the short form for the Swiss Franc against the Singapore Dollar. It is classified as an exotic Forex currency pair. Currencies in the Forex market are always traded in pairs. The key currency in the pair (CHF) is the base currency, while the subsequent one (SGD) is the quote currency.

Understanding CHF/SGD

The market value of CHF/SGD determines the value of SGD required to buy one Swiss Franc. It is quoted as 1 CHF per X SGD. Therefore, if the market price of this pair is 1.4699, then these many Singapore Dollar units are necessary to buy one CHF.

Spread

The spread is the distinction between the bid-ask price. Generally, these two prices are set by the stockbrokers. The pip contrast is through which brokers generate revenue.

ECN: 12 pips | STP: 17 pips

Fees

The fee is the commission you pay to the broker on each spot you open. There is no fee charged on STP account models, but a few extra pips on ECN accounts.

Slippage

Slippage is the distinction between the price at which the trader implemented the trade and the actual price he got from the broker – this change based on the volatility of the market and the broker’s implementation speed.

Trading Range in CHF/SGD

The trading range table will help you ascertain the amount of money that you will win or lose in each timeframe. This table represents the minimum, average, and maximum pip movement in a currency pair.

Procedure to assess Pip Ranges

  1. Add the ATR indicator to your chart
  2. Set the period to 1
  3. Add a 200-period SMA to this indicator
  4. Shrink the chart so you can assess a large time period
  5. Select your desired timeframe
  6. Measure the floor level and set this value as the min
  7. Measure the level of the 200-period SMA and set this as the average
  8. Measure the peak levels and set this as Max.

CHF/SGD Cost as a Percent of the Trading Range

The price of the trade fluctuates based on the volatility of the market. Therefore, the total cost involves slippage and spreads, excluding from the trading fee. Below is the interpretation of the cost difference in terms of percentages.

ECN Model Account

Spread = 12 | Slippage = 5 |Trading fee = 8

Total cost = Slippage + Spread + Trading Fee = 5 + 12 + 8 = 25

STP Model Account

Spread = 17 | Slippage = 5 | Trading fee = 0

Total cost = Slippage + Spread + Trading Fee = 5 + 17 + 0 = 22

Trading the CHF/SGD

The CHF/SGD is not a volatile pair. For example, the average pip movement on the 1H timeframe is only 22 pips. If the volatility is higher, then the cost of the trade is low. However, it involves an elevated risk to trade highly volatile markets. Also, the higher/lesser the percentages, the greater/smaller are the costs on the trade. So, we can conclude that the costs are higher for low volatile markets and high for highly volatile markets.

To diminish your risk, it is advised to trade when the volatility is around the average values. The volatility here is low, and the costs are a slightly high matched to the average and the maximum values. But, if the priority is towards lowering costs, you could trade when the volatility of the market is near the maximum values with optimal risk management.

Advantage on Limit orders (STP Model Account)

For orders that are executed as market orders, there is slippage applicable to the trade. But, with limit orders, there is certainly no slippage applicable. Only the spread and the trading fees will be accounted for by calculating the total costs. Hence, this will bring down the cost considerably.

Spread = 17 | Slippage = 0 | Trading fee = 0

Total cost = Slippage + Spread + Trading Fee = 0 + 17 + 0 = 17

Categories
Forex Signals

USD/CAD Crossover 50 EMA – Can Upward Trendline Drive More Buying? 

The USD/CAD currency pair extended its previous day winning streak and rose to 1.3580 level, mainly due to the declines in the crude oil prices, which tend to undermine the commodity-linked currency the loonie and contributed to the pair’s modest gains. The broad-based U.S. dollar strength initiated by the fresh pickup in the U.S. Treasury bond yields turned out to be one of the key factors that kept currency pair higher, at least for now. Currently, the USD/CAD currency pair is currently trading at 1.3562 and consolidating in the range between 1.3525 and 1.3583.

Moreover, the gain in the currency pair was further bolstered by the downbeat comments from the BOC Governor Macklem that they expect more coronavirus outbreaks as the economy reopens, which initially weighed on the Canadian dollar but the comments burden was short-lived.

The broad-based U.S. dollar stopped its early-day losses and mainly took fresh bids due to a rise in the U.S. Treasury bond yields. As well as, the remaining uncertainty in the market backed by trade and virus worries also lend some support to the U.S. dollar. Whereas the U.S. 10-year Treasury yields remained positive, around 0.72% and stocks in Asia flashed mixed signals. However, the U.S. dollar’s fresh gains turned out to be one of the key factors that kept the currency pair higher. The dollar index, which measures the greenback performance versus a basket of six other currencies, was up 0.15% at 96.798. 

At the Crude oil front, the WTI crude oil prices failed to stop its previous day losing streak and dropped below $40.00 level on the day mainly due to the bearish U.S. inventory report released by the American Petroleum Institute (API) which eventually added worries about oversupply and contributed to the oil declines. The selling bias in the oil prices ultimately undermined the commodity-linked currency the loonie and contributed to the pair’s modest gains.

The traders will keep their focus on the USD price dynamics and the broader risk sentiment. This makes it reasonable to wait for some strong follow-through strength before confirming that the USD/CAD pair might have bottomed out.


Technically, the USD/CAD is supported around 1.3489 level, and closing of candles above this level is suggesting odds of bullish trend continuation. Recently, the USD/CAD has also crossover over the 50 EMA from the lower side to up, making it a bullish crossover. The bullish crossover demonstrates that traders are trading and supported the bullish bias, and we seem to have a chance to capture a quick buying position in the USD/CAD pair. Here’s a quick trade signal. 

Entry Price – Buy 1.35759    

Stop Loss – 1.35359

Take Profit – 1.36159    

Risk to Reward – 1

Profit & Loss Per Standard Lot = -$400 / +$400

Profit & Loss Per Micro Lot = -$400/ +$40

Categories
Forex Videos

Fundamental Analysis For Novices – Consumer Confidence


Fundamental Analysis For Novices – Consumer Confidence

Thank you for joining the fundamental analysis for novices’ educational video. This time we will be reviewing consumer confidence.
Hopefully, you will be reviewing all the fundamental analysis for novices videos in the series is comprehensive, and we fully recommend that you work through each educational video.


As a trader, it is imperative that you regularly refer to an economic calendar, such as this one, which is provided by most brokers. Consider this to be your Bible. Use it as a tool to plan your trades, and most importantly, use it as a facility to tell you when to trade and, more importantly, not to trade, especially at times of release of very important and potentially highly volatile producing economic data releases.


The key information that you need to take particular attention to is the time of the event, the economic event itself, the day and date, the impact level, which typically comes as low, medium, and high, the actual economic data release as listed at the time of the event, which is usually subject to an Embargo, and before this pay particular attention to the general consensus of what the actual figure might be. This is put together by leading economists and market analysis. Also, pay attention to the previous release of this data.

So what is Consumer Confidence?

The consumer confidence index, or CCI, is an economic barometer that tells the story via the consumer. This measure is how optimistic or pessimistic consumers are regarding their financial circumstances. If consumers are optimistic, they tend to spend more money, and if they are pessimistic, they tend to save more. If consumers aren’t spending, economies are failing, and if consumers are spending, it usually follows that economies are doing well.
The CCI is conducted by Nielson Inc. as a survey of over 5000 households within the United States, as an example, and is administered by the US conference board on the last Tuesday of every month. Households are asked five questions, 1: their view of the current business conditions, 2: their view of current employees conditions, 3: their expectations regarding business conditions in the next six months, 4: their expectations regarding employment conditions for the next six months and 5: their expectations regarding total family income for the next six months.
Financial markets look towards this barometer with regard to the varying degrees of the fluctuations up and down.


On Wednesday the 10th of June at 1:30 AM BST, Australia released its consumer confidence data for the month of June, which was considered to be a medium level of impact and which came out at 6.3%. No consensus was offered, and the previous figure was 16.4%. Straight away, we noticed that the actual figure is lower than the previous figure, and we will explore this further on in the video.
In Australia, the CCI is produced by the Melbourne Institute and published by the Westpac Banking Group. Countries vary slightly with regard to the questions asked of households. In Australia for example 1200

Australian adults asked their opinions on the household financial situation currently, compared to 12 months ago, their expected household financial situation for the coming year, their anticipated economic conditions over the coming year, their anticipated economic conditions over the next five years, and their buying conditions for major household items.
However, essentially the results are treated almost identically on a country-by-country basis.


Upon the release of the data, traders look for the actual figure, and in this case, it comes in lower than the previous, which suggests that consumer confidence is lower during the month of June and below the figure released for May.
Potentially this means consumers are spending less, and this is therefore bad for the Australian economy, and we might expect a weakening of the Australian dollar against its counterparts. This is referred to as bearish.
Had the figure been higher than 16.4% for May, the reverse would have been true and would have shown the economy growing, with consumers more confident and potentially spending more money, and this would have been good for the Australian dollar against its counterparts. This is referred to as bullish.

Categories
Forex Education

How to Use Reversal Patterns to Create a Trading Strategy

Introduction

The basic premise of technical analysis is to identify the dominant trend in the financial market and make money trading in its direction. Likewise, when the trend changes, the market analyst should recognize that the previous trend has ended and that it is time to join the new trend.

In this context, the chart pattern analysis offers a wide range of technical formations that reveals the reversion or continuation of a trend. These formations repeat themselves again and again in financial markets. 

This educational article will review a set of chart patterns of reversal and continuation of the trend.

Reversal Chart Patterns

Reversal patterns tend to appear after a prolonged uptrend or downtrend and is usually accompanied by higher volatility. Likewise, the size of the chart formation is indicative of the future movement, as the next move usually experiences advances or declines of similar proportions.

Double Top and Bottom

The double top and bottom is the most common reversal formation that appears in a chart. The following figure illustrates a double top and a double bottom formation.

In a double top, the price reaches a determined top level twice, and it will be confirmed once the price breaks and closes below the valley between the two highs. In the double bottom case, the price moves up, then retraces but cannot break through the previous support level. The pattern is confirmed once the price rises and closes above the minor top between the two lows.

The profit target of this structure can be set to a distance similar to the range between the top and the valley that conforms to the double top/bottom pattern. The invalidation level is located above (or below) the top (or bottom) of the reversal formation.

Triple Top and Bottom

The triple top and bottom formation arise from the same market factors of a double pattern, the next figure shows the setup of this formation. The stop-loss and profit target calculations are similar to those of a double top/bottom pattern. 

In technical terms, the triple top and bottom pattern will be completed when the price action advances a distance similar to the range between the top and the valley that conforms to the triple pattern.

Head and Shoulder Pattern

The head and shoulder pattern is by far the best-known formation warning of the end of a trend. This reversal pattern looks similar to the triple top and bottom structure. The second high (identified as 3 in the following figure) is higher than the tops preceding and following the central high.

The formation is said to be completed once the price breaks and closes below the neckline. The target will correspond to the length between the head and the neckline when projected from the neckline. A possible choice for the stop-loss level is to place it above the second shoulder (5). An alternative to this placement is to put it above the top level of the head (3).

Three Falling Peaks or Three Rising Valleys

The three falling peaks or rising valleys are seldom spotted, although its technical structure is clear. The following figure illustrates both cases.

The three falling peaks will generate a sell-side position if the price breaks and closes below the second valley. In the three rising valleys case, a buy-side position will be activated if the price climbs and closes above the second peak. 

A potential zone of profit target would correspond to the length from the top (or bottom) to the second valley (or peak) and projected from the breakout zone. The stop-loss level could be set above the second peak or valley.

Key-Reversal Day

The key-reversal formation requires that the price action moves in a volatile trading session triggered by high impact news, leading to an extreme euphoric or panicked sentiment on investors. 

These movements could also cause the market to develop false moves, especially when the price moves in an extreme zone. This pattern could be combined with one of the previous formations reviewed previously.

Conclusions

Chart patterns are technical configurations, which, based on its internal structure, provides a clue of the likely market’s next movement. In this context, there are two main groups of chart patterns: reversal and continuation formations.

In this educational article, we reviewed five trend-reversal patterns that can be the basis of a trading strategy that, hopefully, triggers its entries in the early stages of a new trend. Moreover, the chart analyst should consider that each entry setup must have a stop-loss and a profit target identified before jumping into the market.

In the next article, we’ll present continuation chart patterns that can help enter the market when the price moves in a prolongued trend.

Suggested Readings

  • Fischer, R., Fischer J.; Candlesticks, Fibonacci, and Chart Patterns Trading Tools; John Wiley & Sons; 1st Edition (2003).
Categories
Forex Signals

EUR/GBP Fails to Break Triple Bottom Support – Is Our Signal Still Safe?

The EUR/GBP pair is trading at 0.9028 level, holding above the triple bottom support area of 0.9020 level. Overall, the EUR/GBP is trading with a bullish bias, both from fundamental and technical perspective. For instance, the headline IFO Business Climate Index was improving to 85.0 against 79.5 previously. While, the Current Assessment sub-index was arriving at 84.0 this month, while the IFO Expectations Index – indicating firms’ projections for the next six months – is likely to come out at 87.0 in the reported month vs. 80.1 last.

Looking ahead, the big surge in the data will likely bolster market expectations toward faster recovery in the Eurozone’s largest economy, which may provide support to the shared currency. As we know, the economic activity has already recovered slightly since the March crash. As the Manufacturing and service sector activity improved in Germany in June, it showed in the preliminary PMIs released on Tuesday. 

One of the reasons behind a slight bearish bias today is that coronavirus remains a risk, said by the German Health Minister Jens Spahn, while speaking to broadcaster ARD on Wednesday, which eventually undermined the shared currency and contributed to the pair declines. As per the Jens Spahn, “we see that if we make it too easy for this virus, it spreads very, very quickly again even all over the world, we do not only see the relaxing attitude in Guetersloh – we’ve also seen it in Goettingen, in Leer, in Bremen and at churches and family celebrations.”

While the number of confirmed coronavirus cases increased to 191,449 with a total of 8,914 deaths so far, the cases rose by 587 in Germany on Wednesday against Tuesday’s +503, and the death toll rose by 19 as per the German disease and epidemic control center, Robert Koch Institute (RKI), on Wednesday.

The EUR/GBP pair early-day gains could be associated with the report that President Emanuel Macron and Dutch Prime Minister (PM) Mark Rutte made some progress on the talks over the European Union budget and recovery fund in the Netherlands which initially underpin the shared currency and provided support to the major during the early Asian session on the day.

Looking forward, the trader will keep their eyes on the German IFO Business Climate and pandemic updates for fresh impetus. As well as, Fed speech could offer additional directions for the pair.


On the technical side, the EUR/GBP is gaining support above 0.9020, and the closing of candles above this level can drive buying in the pair. Lagging indicators like the 50 periods EMA also suggests the bullish bias and extend support at 0.9007. However, the lagging indicator 50 periods EMA is suggestings odds of a bullish bias. Here’s a quick trade plan for the day. 

Entry Price – Buy 1.12914    

Stop Loss – 1.12514    

Take Profit – 1.13314

Risk to Reward – 1

Profit & Loss Per Standard Lot = -$400 / +$400

Profit & Loss Per Micro Lot = -$400/ +$40

Categories
Forex Daily Topic Forex Fundamental Analysis

The Impact Of ‘Factory Orders’ News Release On The Forex Price Charts

What are Factory Orders?

Factory orders are the dollar value of all orders received by factories. The U.S. Department of Commerce reports the number of new orders every month. Factory orders are divided into four parts: new orders, unfilled orders, shipments, and inventories. It includes information about durable goods and non-durable goods. Factory orders data is often not very surprising because the report of durable goods orders comes out one or two weeks earlier.

Dividing Factory Orders        

The factory orders data is divided into four sections:

  • New orders, which indicate whether orders are increasing or decreasing
  • Unfilled orders, indicating a backlog in production
  • Shipments, which indicate produced and sold goods
  • Inventories, which indicate the strength of future production

The figures are mentioned in billions of dollars and also as a percent from the previous month and previous year. Factory orders data is often dull, mostly because the durable goods orders come out a couple of weeks earlier, and people have an idea of factory orders for the current month. However, the official factory orders data gives more detailed information on orders estimate and fulfillment.

The factory orders report includes information about both durable and non-durable goods. Durable goods have a life span of at least three years and often refer to items not purchased frequently, such as machines, garden equipment, motor vehicles, and electronics. In contrast, non-durable goods include fast-moving consumer goods such as food, clothes, footwear, medication, and cleaning items.

Investors get an insight into the growing trend of the economy with the help of factory orders report, which largely influences their investment decisions. Factory orders give an early indication of the growth in the economy, and its impact is felt on the equity market.

Analyzing the data

When it comes to the fundamental analysis of a currency pair, it is important to understand how factory orders are analyzed to make proper investment decisions. Factory orders are analyzed by comparing the previous and current readings, where, if we notice a consistent drop in the ‘orders,’ it could signal a slump in the overall demand.

These factory orders are not just used for analyzing one country but also for comparing the economic growth of any two countries. Investors shift their funds to countries where there is a growth in the factory orders, and demand is high. One needs to remember to compare countries with the same economic status. For example, factory orders of a developed country should not be compared with that of a developing nation.

The economic reports

Factory orders are released monthly by the Censuses Bureau of the U.S. Department of Commerce. The full name is “Full report on Manufacturers’ Shipments, Inventories and Orders” but is commonly referred to as Factory Orders. This report usually follows the Durable Goods Reports, which provides data on new orders received from more than 4,000 manufacturers of durable goods.

The factory orders report is more comprehensive than the durable goods report, where it examines the trend within industries. For example, the durable goods report may account for a broad category, such as industrial equipment. In contrast, the factory orders report will provide details about the hardware, software, semiconductors, and raw materials. This lack of information in a durable goods report is attributed to its release speed.

Impact on currency

Factory orders are an important economic indicator. When factory orders increase, the economy usually expands as consumers demand more goods and services. High demand, in turn, requires retailers and suppliers to order more things from factories. This is interpreted as positive for the economy by foreign investors who then invest in the country through the stock market or currency.

An increase in factory orders could also mean that inflation is just around the corner. When factory orders decrease, the economy is usually contracted, which means there is less demand for goods and services, so retailers will not place a lot of orders. When this is reflected in reports, investors tend to have a negative on the economy and think twice before investing in such economies.

Sources of information on Factory Orders 

The factory Orders data is closely watched by investors around the world, which is why the report is immediately available on most of the open-source economic websites and some of the broker’s websites. The official source of information is the U.S. Census Bureau, where it provides statistical information of all the information related to factory orders.

Links to ‘Factory Orders’ information sources

GBP (Sterling) – https://tradingeconomics.com/united-kingdom/factory-orders

USD – https://tradingeconomics.com/united-states/factory-orders

EUR – https://tradingeconomics.com/germany/factory-orders

Factory orders are a key economic indicator for investors and others monitoring the health of economies. It provides information on how busy factories may be in the future. Orders placed in the current month may provide work in factories for many months to come as they will have to work to fill the orders. Businesses and consumers generally place orders when they are confident about the economy.

An increase in factory orders signifies that the economy is trending upwards. It tells investors what to expect from the manufacturing sector, a major component of the economy. The factory orders data often tend to be volatile with revision in the methodology now and then. Hence, investors typically use several months of averages instead of relying too heavily on a single month’s data.

Impact of the ‘Factory Orders’ news release on the Forex market

In the previous section of the article, we understood the factory orders economic indicator and saw how important it is for foreign investors. As defined earlier, it is a report which shows the value of new factory orders for both durable goods and non-durable goods. The survey is usually released a week after durable goods orders report. The report tends to be predictable, with only non-durable goods appearing as the new component compared to the previous report. Thus, investors would have priced in most of the information even before the official release. Still, it causes some volatility in the currency pair during the news announcement.

In today’s lesson, we will analyze the impact of the factory orders news announcement on various currency pairs and witness the change in volatility due to the news release. The below image shows the latest factory orders data of the United States, where it can be seen that the orders were better than expectations but were lower than last time. A higher than expected reading is considered to be bullish for the currency, while a lower than expected reading is considered negative. But, let us find out how the market reacts to this data.

EUR/USD | Before the announcement

Let us start with the EUR/USD currency pair to observe the impact of factory orders on the U.S. dollar. The above image shows the 15 minutes time-frame chart of the currency pair where the market is in a strong uptrend before the news announcement. Recently the price has formed a ‘range,’ and the price is at the top of the ‘range’ at this moment. Technically, this is an ideal place for going ‘short’ in the market, but since a news announcement is due, it is advised not to take any portion before the announcement.

EUR/USD | After the announcement

After the news announcement, the price initially moves higher, but this is immediately sold, and the market erases all the gains. The ‘news candle’ finally closes at the price where it had opened. Therefore, the factory orders data brought about a great amount of volatility in the currency pair, which is evident from the wick on top of the ‘news candle.’ One should wait for the volatility to settle down before taking a position in the market.

USD/CAD | Before the announcement

USD/CAD | After the announcement

The above images represent the USD/CAD currency pair, where we see that the market is extremely volatile before the news announcement, and there is no clear direction of the market. As a point of a tip, it is not advisable to trade in currency pairs where the volatility is more than normal as there are a lot of risks associated with trading in trading such pairs.

After the news announcement, the currency pair gets exceedingly volatile where essentially the price drops greatly, but buyers pressure from the bottom takes the price back to its opening level. Therefore, the factory orders data had a major impact on the pair where the price continued to move lower a few minutes after the news release.

AUD/USD | Before the announcement

AUD/USD | After the announcement

The above images are that of the AUD/USD currency pair, where the price is retracing the overall uptrend of the market. In such market situations, we should be looking for trend continuation candlestick patterns to confirm that the market will continue moving up.

After the news announcement, the price sharply moves higher and leaves a wick on top of the ‘news candle.’ Since volatility is high on both sides of the market during the announcement, we cannot ascertain if the factory orders data was positive or negative for the currency. As the market continues to move higher after the close of the ‘news candle,’ one should look for going ‘long’ in the market a few hours after the news announcement.

This ends our discussion on the ‘Factory Orders’ Fundamental driver. It is crucial to know its impact on the Forex price charts before trading this market. Cheers!

Categories
Forex Price Action

Traders are to be Artists

In today’s lesson, we are going to demonstrate an example of the daily-H4 chart combination trading. The H4 chart offers a long entry. The chart’s breakout and level of support are to be spotted with some calculation. We try to learn those from today’s lesson.

This is the daily chart. The chart shows that the price makes a very strong bullish move. It then makes a bearish correction. At the correction, it produces a bullish engulfing candle once but continues its journey towards the South. The daily-H4 chart combination traders may have flipped over to the H4 chart upon having that bullish engulfing candle. Anyway, look at the last candle. It is a strong bullish reversal candle. The buyers may flip over to the H4 chart to go long in the pair.

This is how the H4 chart looks. The last candle comes out as a doji candle. The buyers are to wait for the price to consolidate and produce a bullish candle to trigger a long entry.

The chart shows that the price consolidates and produces a bullish engulfing candle. Let’s focus on those two drawn levels. We may not count the lower spike of that spinning top to draw the support line. We try to draw the line by using a flipped level that holds some candle’s wicks and bodies of all the candles. To draw the level of resistance, we count the spike of the spinning top (the last rejection) but skip some part of the upper shadow of a candle. Yes, it is not a bad idea to draw a breakout level by using spikes to some extent. In most cases, however, significant rejection, along with candles’ bodies, matters a lot. Let us assume that we trigger a long entry in this chart.

The price heads towards the North with good bullish momentum. The last candle does not hit the target of 1R, but the price is almost there. It seems that the buyers may not have to wait too long to achieve their target.

The last candle comes out as a bearish candle with a long upper shadow (the body is relatively thicker though). However, the upper shadow shows that the price hits the target. However, it is a bearish reversal candle because the body closes within the last bullish candle, suggesting that the price may continue its bullish move.

If we look back and study with the flipped H4 chart, we find that the buyers are to count some factors to draw consolidation support and resistance. They are to count some spikes and to skip some of those. As we know, trading is not science; it is an art. Thus, traders are to be artists. To be an artist (successful trader), one needs a lot of practice and experience.

Categories
Forex Options

FX Options Market Combined Volume Expiries for 24th June 2020

Thank you for visiting the Forex Academy FX Options market combined volume expiries section. Each day, where available, we will bring you notable maturities in FX Options of amounts of $100 million-plus, and where these large combined maturities at specified currency exchange rates often have a magnetic effect on price action, especially in the hours leading to their maturities, which happens daily at 10.00 AM Eastern time. This is because the big institutional players hedge their positions accordingly. Each option expiry should be considered ‘in-play’ with a good chance of a strike if labelled in red, still in play and a possible strike if labelled in orange and ‘out of play’ and an unlikely strike if labelled in blue, with regard to the likelihood of price action meeting the strike price at maturity.

…………………………………………………………………………………………………………………..

FX option expiries for June 24 NY cut at 10:00 Eastern Time, via DTCC, can be found below.

– EUR/USD: EUR amounts

  • 1.1300 665m

EURUSD pair is in a tight consolidation phase pre-German IFO’s due out during today’s European session. The pair has so far failed to get any traction above 1.1310. The option maturity remains in play.

– USD/JPY: USD amounts

  • 105.50 415m
  • 106.00 355m
  • 107.00 655m

The USDJPY found support at 106.06 and 106.37 during yesterdays sell-off. Profit-taking and a Dollar revival are currently pushing the pair higher. The 107.00 option maturity looks reachable.

– USD/CAD: USD amounts

  • 1.3600 640m

USDCAD is looking to break out of a consolidation phase with price action fading to the upside on our one hour chart. The overbought indicator is being ignored. Price action is bullish. 1.3600 is in play.

……………………………………………………………………………………………………………………..

As you can see on the charts we have also plotted the expiration levels at the various exchange rate maturities and we have also labelled in red, orange and blue. Therefore, if you see option expiry exchange rates labelled in red these should be considered in-play, because we believe there is a greater chance of the expiry maturing at these levels based on technical analysis at the time of writing. There is still a lesser possibility of a strike if they are in orange and so these are ‘in-play’ too. However, if we have labelled them in blue, they should be considered ‘not in-play’ and therefore price action would be unlikely to reach these levels, which are often referred to as Strikes, at the time of the 10 AM New York cut.

Our technical analysis is based on exchange rates which may be several hours earlier in the day and may not reflect price action at the time of the maturities. Also, we have not factored in economic data releases or keynote speeches by policymakers, or potential market volatility leading up to the cut.

Although we have added some technical analysis we suggest you take the levels and plot them onto your own trading charts and incorporate the information into your own trading methodology in order to use the information to your advantage. Remember the higher the amount, the larger the gravitational pull towards the exchange rate maturity at 10:00 AM Eastern time.

If you want to learn how forex option expiries affect price action in the spot FX market see our educational article by clicking here: https://bit.ly/2VR2Nji

DISCLAIMER: Please note that this information is for educational purposes. Also, the maturities will look more or less likely to become a strike at 10 AM NY time due to exchange rate fluctuations resulting in a different perspective with regard to technical analysis, and also due to upcoming economic data releases for the associated pairs.

Categories
Forex Market Analysis

Daily F.X. Analysis, June 24 – Top Trade Setups In Forex – Focus on Technical Side!

On the news front, the market will be focusing on the German Business Climate figures along with Crude Oil Inventories. Overall the impact of these events is expected to be muted; therefore, our focus should be on the technical side of the market.

Economic Events to Watch Today 


EUR/USD – Daily Analysis

The EUR/USD pair was closed at 1.13085 after placing a high of 1.13484 and a low of 1.12329. Overall the movement of the EUR/USD pair remained bullish throughout the day. On Tuesday, the EUR/USD currency pair spiked above 1.13400 level, highest since June 16. The pair was up with 155 pips from the previous day’s low on the broad-based U.S. dollar weakness.

The U.S. dollar index, which measures the value of the U.S. dollar against the basket of six currencies, lost the gains of the previous five days in only two days and was down to 96.39 level, the lowest since June 11.

The U.S. dollar’s weakness came in after a new stimulus package from U.S. congress was announced by the U.S. Treasury Secretary Steve Mnuchin on Tuesday. Mnuchin also said that despite the rising number of coronavirus cases in some states of America, renewed lockdown would not be imposed.

Another reason behind the EUR/USD pair’s uptick was better than expected and robust macroeconomic data from the Eurozone about PMI.

 At 12:15 GMT, the French Flash Services PMI for June exceeded the expectations of 44.9 and came in as 50.3 and supported Euro. The French flash manufacturing PMI for June also surged to 52.1 against the expected 46.1 and supported Euro on Tuesday. At 12:30 GMT, the German Flash Manufacturing PMI increased to 44.6 from the forecasted 41.5 in June. The German Flash Services PMI exceeded expectations of 41.7 for June and came in as 45.8 and supported Euro.

At 13:00 GMT, the Flash Manufacturing PMI for the whole Eurozone came in better than expected as 46.9 against 43.8. The Flash Services PMI for whole bloc also supported the Euro when it was reported as 47.3 against the forecast of 40.5 and supported single currency Euro. The PMI from the Manufacturing and Services sector boosted in Europe and provided strength to the single currency Euro, which added gains in the EUR/USD pair.

On the other hand, from the American side, the Flash Manufacturing PMI from the United States was released at 18:45 GMT, which showed that Manufacturing activity in the U.S. dropped in June, and index came in as 49.6 against the expected 50.0 and hence, weighed on U.S. dollar.

The weak U.S. dollar added further in the gains of EUR/USD on Tuesday and pushed the pair above the 1.3400 level.

Daily Support and Resistance

  • R3 1.1479
  • R2 1.1414
  • R1 1.1361

Pivot Point 1.1297

  • S1 1.1244
  • S2 1.118
  • S3 1.1127

EUR/USD– Trading Tip

The EUR/USD pair is facing double top resistance at 1.1345 level, and below this, the EUR/USD has solid odds of staying bearish until 1.1266 level. Conversely, a bullish breakout of the 1.1345 level can extend buying until the next target level of 1.1415 level. While the bearish breakout of 1.12500 can lead EUR/USD prices towards 1.1230 and 1.1205. Besides, the leading indicators are mixed; for example, the RSI is suggesting a selling bias, while the MACD is indicating a bullish bias. Let us look for buying trades over the 1.1297 level today. 


GBP/USD – Daily Analysis

The GBP/USD pair was closed at 1.25209 after placing a high of 1.25317 and a low of 1.24317. Overall the movement of GBP/USD pair remained bullish throughout the day. GBP/USD pair rose above 1.2500 level and posted gains for 2nd consecutive day on Tuesday on the back of weak USD and strong British Pound after the release of PMI data. Another factor involved in the surge of GBP/USD pair was the plan set out by Britain on how it will regulate the city after Brexit.

On Tuesday, the finance minister of the U.K., Rishi Sunak, said that Britain’s government intends to regulate Europe’s biggest financial sector by making reforms to maintain the soundness of capital markets and managing future risks.

The U.K. left E.U. in January, and it will no longer be required to follow Europe’s financial rules after December when the transition period will end. Sunak said that Britain’s government would tailor the E.U. Capital rules for insurers known as Solvency II after Brexit. The U.K. lawmakers have long criticized the Solvency II rules as too inflexible, and the government intends to start to review it in autumn.

Besides tailoring the rules for the insurance sector, Britain will also make existing retail customer disclosure rules. Sunak showed concern and said that Britain would come under more pressure outside the E.U. to lee pots financial sector globally competitive. The EU is the biggest export customer of the U.K.’s financial services, and an enduring future relationship with the E.U. will help the U.K. maintain its role globally.

Furthermore, the negotiators of Britain and the E.U. have hit by a new obstacle to secure a trade deal after clashing over 70 billion euros worth of subsidies to E.U. farmers by Brussels. The E.U. negotiating team led by Michel Barnier was accused in the latest round of talks of trying to stop the U.K. government from defending British farmers from cut-price European imports.

On the data front, at 13:30 GMT, the Flash Manufacturing PMI from Great Britain for June came in as 50.1 against the expected 45.2 and supported British Pound. The Flash Services PMI for June from the U.K. also surged to 47.0 from the forecasted 39.1 and helped British Pound to gain traction.

The better than expected U.K. Preliminary Manufacturing & Services PMI data provided strength to British Pound on Tuesday, which lifted GBP/USD pair above 1.2500 level. On the other hand, from the U.S. Side, the Flash Manufacturing PMI for June was dropped to 49.6 from the expected 50.0 and weighed on the U.S. dollar. The weak U.S. dollar added in the gains of GBP/USD on Tuesday.

Daily Support and Resistance

  • R3 1.2378
  • R2 1.2369
  • R1 1.2357

Pivot Point 1.2348

  • S1 1.2337
  • S2 1.2327
  • S3 1.2316

GBP/USD– Trading Tip

The GBP/USD is trading bullish at a level of 1.2512, holding right above 50 periods of EMA, which is likely to extend support at a level of 1.2510. On the downside, the GBP/USD may find support around the value of around 1.2445, and the continuation of a selling trade can lead Sterling prices to be further lower until 1.2378 level. The MACD and RSI are expending a mixed bias, as the MACD is holding in a selling zone, while the RSI holds in a buy zone. The recent formation of neutral candles over 1.2510 support level is suggesting indecision among traders. Therefore, we should look for selling trades below 1.2470 and buying trades 


USD/JPY – Daily Analysis

The USD/JPY pair was closed at 106.534 after placing a high of 107.220 and a low of 106.071. Overall the movement of USD/JPY remained bearish throughout the day. The USD/JPY pair in early trading hours in Asian session surged above 107.200 level after White House advisor Peter Navarro clarified his statement that the phase one deal was over. Navarro issued a clarification stating that his comments had been taken widely out of context.

On Monday, Navarro said that the trade deal was over, and markets went on a roller coaster after this statement; however, right afterward, he issued a clarified statement which was then backed by the U.S. President himself. U.S. President also provided further assurance after his clarification that the phase-one deal was still intact to avoid any confusion.

U.S. dollar gained after that clarification but failed to post gains in the European session after the strong PMI data from Europe, which made the U.S. dollar weak. U.S. dollar came under pressure, and the pair USD/JPY starting to move in a downward trend. The U.S. Dollar Index was down 0.45% near 96.56 level on Tuesday, which exerted more pressure on the U.S. dollar. Greenback seemed to face high selling pressure after the release of U.S. economic data.

At 5:30 GMT, the Flash Manufacturing PMI from Japan for June dropped to 37.8 against the forecasted 39.5 and weighed on Japanese Yen. However, at 10:00 GMT, the Bank of Japan Core CPI for the year came in as 0.0% against the expected -0.1% and supported the Japanese Yen.

On the U.S. side, at 18:45 GMT, the Flash manufacturing PMI for June came in as 49.6 against the expected 50.0 and weighed on the U.S. dollar. The Flash Services PMI came in line with the expectations of 46.7.

At 18:59 GMT, the Richmond Manufacturing Index for June was up to 0 from expectations of -3 and supported the U.S. dollar. At 19:00 GMT, the New Home Sales in May were recorded as 676K against the expected 637K and supported the U.S. dollar.

The poor than expected PMI data, even after the reopening of economies from all states of America, gave a high selling pressure on the U.S. dollar.

The U.S. dollar’s selling bias was further supported by the latest comments from U.S. Treasury Secretary Steve Mnuchin, who said on Tuesday that U.S. Congress would issue more stimulus in July to overcome the pandemic crisis. This depicted the U.S. economy’s weakness, and hence, the U.S. dollar suffered and dragged the USD/JPY pair with itself below 106.100 level on Tuesday.

Daily Support and Resistance    

  • R3 107.13
  • R2 107.05
  • R1 106.94

Pivot Point 106.85

  • S1 106.74
  • S2 106.65
  • S3 106.54

USD/JPY – Trading Tips

The USD/JPY traded bearishly to break out of the descending triangle pattern, supporting the pair around 106.800 level. On the lower side, the support level can be seen at 106.400, and violation of this could trigger sell-off until 106 level. The breach of the descending triangle pattern suggests selling bias, but before this, we can expect upward movement in the market until 106.800. Let’s consider taking sell trades below 106.800 level today. 

Good luck! 

Categories
Forex Videos

Fundamental Analysis For Novices – Average Hourly Earnings

Fundamental Analysis For Novices – Average Hourly Earnings

Thank you for joining the fundamental analysis for novices’ educational video. This time we will be looking at.

Hopefully, you will be reviewing all the fundamental analysis for novices videos in this series of educational videos.


Professional traders regularly refer to an economic calendar, such as this one, which is provided by most brokers. Use it as a tool to plan your trades, and most importantly, use it as a facility to tell you when not to trade via expected volatile periods in the market, which potentially follow high impact or high importance regarded data releases.


The key information that you need to take particular attention to is the time of the event, the economic event itself, the day and date, the impact level, which typically comes as low, medium, and high, the actual economic data release as listed at the time of the event, which is usually subject to an embargo, and before this, pay particular attention to the general consensus of what the actual figure might be. This is put together by leading economists and market analysis. Also, pay attention to the previous release of this data.


In this video, we are looking at average hourly earnings, year on year, for May 2020. This data is typically more important within the United States and has a maximum impact value. It is always released on the first Friday of each month, along with the non-farm payrolls.
This particular session of releases he’s very widely anticipated by the markets because it gives a clear picture of the economic conditions for the United States, which is one of the biggest economies in the world.
The data is released by the US Bureau of Labor Statistics. It reflects labour cost inflation and throws light on the conditions of the Labour market. The board of the Federal Reserve uses this as a leading indicator when setting interest rates, along with the unemployment figures.


Here we can see that the average hourly earnings figure for May came in at 6.7%, which was below the consensus value of 8.5% and below the previous figure of 8% for April. The deviation is also shown as -0.98%.
A higher reading would have been positive or bullish for the USD, while this reading is negative or bearish for the USD.

This is why it is always imperative to wait until the market has analysed all of the data, including average hourly earnings before you jump in and start trading purely on the non-farm payrolls figure only.

Tread cautiously and wait for a trend to begin and then join that in either direction. When trading this data always expect the unexpected because the market can become extremely volatile post data release.

Categories
Forex Videos

Fundamental Analysis For Novices – House Price Index

Fundamental Analysis For Novices – House Price Index

Welcome to the educational video for Fundamental Analysis For Novices. In this session, we will be looking at the House Price Index.


If you are not already doing so, we strongly recommend that you regularly check a reliable economic calendar each day to be forewarned about economic data releases from countries that might affect your open or planned trades.


Economic data releases impact the market in various degrees, and you should pay particular attention to the date of the event, the time, and most importantly, the likely impact it will have, which usually is in 3 degrees, low, medium, and high.


Most calendars will also provide you with the previous data release in each category, the consensus, or the expected data release as analysed by economists and analysts who have come to an average consensus value, and the actual figure which is updated with the data upon release.

Each country releases similar titled economic data into the market, mostly on an embargoed basis, in order not to give traders an advantage and to avoid market manipulation.

Today we are looking at House Price Index!


Here we can see there are two releases due for the 15th June 2020; one has been collated by Rightmove property website for the UK where the numbers are a sample only and are reflected of the period for May and are devised on a month by month basis and the second which is updated on year by year basis. and the other
The impact level for this type of indicator is typically low and does not usually cause market volatility.


So what is the House Price Index, and how do you trade it?

The house price index or HPI, as it is also known, measures the price change in the value of residential houses. The data is typically released into the market on a month-by-month basis or updated on an annual basis.


The data, in all cases, is calculated as a percentage figure from a specific start date. In most cases, the statistical method to calculate price swings is called a hedonic regression model.

In the UK, the HPI is released by the Office for National Statistics. In the United States, the HPI is published by The US Federal Housing Finance Agency, where it measures those family homes that have been sold or refinanced in 363 metropolises. Not to be confused with the FNC Residential price index as published by FNC Incorporated, which records value in non-distressed home sales and is widely used by the mortgage sector as a tool to gauge price movements.

The basic rule of thumb is that house prices that are falling in value are reflective of an economy that is struggling and whereby perhaps unemployment is high, wages are low, and the growth of an economy is slowing, stalled, or in recession. This would have a negative impact on the currency of a particular country. Therefore you might find the value of a local currency falling in value in terms of exchange

rates.
On the flip side, a higher than expected HPI number might be reflective of an improving economy, in which case it is better for the local currency, and you might find it increasing in value on exchange rates.
Always compare the actual HPI release number to the consensus value and the previous release and remember that markets do not like shocks. Deviations from the consensus and previous releases can cause market instability.

Categories
Forex Signals

EUR/USD Bullish Bias Continues – Upward Trendline Support!

The EUR/USD currency pair extended its previous day winning streak and took bids around the 1.1311 level, mainly due to the fresh risk-on market sentiment, which undermined the broad-based US dollar and contributed to the currency pair gains. The reason for the upticks in the currency pair could also be attributed to the report that the Spanish government officials are considering pledging as much as EUR50 billion in additional loan guarantee, which underpinned the shared currency and provided support to the major. 

Introducing Manufacturing Purchasing Managers Index (PMI), this data released by the Markit Economics captures business conditions in the manufacturing sector. As the manufacturing industry controls a large part of total GDP, the manufacturing PMI is considered as an essential indicator of business conditions and the overall economic condition in the Euro Zone. Usually, a result above 50 signals is seen as bullish for the shared currency. Likewise, a result below 50 is seen as bearish.

As per the current condition, the Eurozone PMIs came out to be robust as easier lockdown restrictions bolstering business activity. Moving on, the big beat on expectations could boost the gains in the shared currency. From the technical perspective, the falling wedge breakout seen on the pair’s hourly chart suggests a rise above the psychological resistance of 1.13. 

At the coronavirus front, the number of reported coronavirus cases increased to 190,862, with a total of 8,895 deaths. As well as, the cases increased by 503 in Germany on Tuesday against Monday’s +537. On Tuesday, the death count rose by ten as per the German disease and epidemic control center, Robert Koch Institute (RKI).

At the USD front, the broad-based US dollar failed to maintain its early day bullish moves and edged lower at least for now, mainly due to the fresh risk-on wave in the market sentiment after Navarro clarified that his comments were taken wrongly by the market and the phase-one pact was on track which gave a boost to the risk market and contributed to the greenback’s decline. However, the reductions in the US dollar kept the currency higher. Whereas, the dollar index, which tracks the greenback against a basket of six other currencies, was largely flat at 96.993, having climbed as high as 97.207 earlier in the session. 

The market traders will keep their eyes on the flash manufacturing PMI for Germany, which is scheduled to be released at 0730 GM. The USD price dynamics will also be essential to watch for some short-term trading impetus ahead.


On the technical side, the EUR/USD is trading sharply bullish in our favor as our forex signal makes around 30 pips. The idea is to move SL at the breakeven level and enjoy the bullish run, but I suspect the EUR/USD will take a bearish recovery below 1.1345 level. Here’s a quick update on the trade signal. 

Entry Price – Buy 1.12914    

Stop Loss – 1.12514    

Take Profit – 1.13314

Risk to Reward – 1

Profit & Loss Per Standard Lot = -$400 / +$400

Profit & Loss Per Micro Lot = -$400/ +$40

Categories
Forex Assets

Asset Analysis – Trading The ‘CHF/PLN’ Forex Exotic Pair

Introduction

CHF/PLN is the abbreviation for the Swiss Franc alongside the Poland złoty. It is categorized as an exotic currency pair that usually has high volatility and low trading volume. Here, the CHF is the base currency, and the PLN is the quote currency. CHF is the official currency of Switzerland, whereas PLN is the national currency of Poland.

Understanding CHF/PLN

The current value of the pair represents the value of PLN that is corresponding to one CHF. It is quoted as 1 CHF per X PLN. For example, if the value of this pair is 4.1627, these many units of PLN are required to buy one Swiss Franc.

CHF/PLN Specification

Spread

In trading, the difference between the bid-ask price is described as the spread. Spread normally fluctuates from broker to broker. The estimated spread on ECN and STP accounts is given below.

ECN: 49 | STP: 54

Fees

There is a small fee or payment charged by the broker for each trade a trader does. This varies on both types of accounts and broker. There are zero fees charged on STP accounts, but a few extra pips are charged on ECN accounts.

Slippage

The difference between the cost at which the trader executed the trade and the cost he received from the broker is termed as Slippage. Fundamentally, Slippage hangs on two factors – Broker’s execution & market’s volatility

Trading Range in CHF/PLN

The trading range is a tabular interpretation of the minimum, average, and maximum pip movement in a different timeframe. Having expertise about this is necessary because it helps in handling risk as well as determine the appropriate times of the day to enter and exit a trade with marginal costs. Below is a table that illustrates the minimum, average, and maximum volatility (pip movement) on several timeframes.

Procedure to assess Pip Ranges

  1. Add the ATR indicator to your chart
  2. Set the period to 1
  3. Add a 200-period SMA to this indicator
  4. Shrink the chart so you can assess a large time period
  5. Select your desired timeframe
  6. Measure the floor level and set this value as the min
  7. Measure the level of the 200-period SMA and set this as the average
  8. Measure the peak levels and set this as Max.

CHF/PLN Cost as a Percent of the Trading Range

The number of pips the currency pair change in various timeframes is demonstrated in the table above. With this, we apply these values to get the cost percentage when the volatility is minimum, average, and maximum. This cost percentage will help us sort out an ideal time of the day to enter trades.

The understanding of the cost percentage is easy. If the percentage is above average, then the cost is higher for that specific timeframe and range. If the percentage is at a low level, then the cost is comparatively low for that timeframe and range. Note that, the total cost on a particular trade is calculated by combining the spread, Slippage, and trading fee.

ECN Model Account

Spread = 49 | Slippage = 5 | Trading fee = 8

Total cost = Slippage + Spread + Trading Fee = 5 + 49 + 8= 62 

STP Model Account

Spread = 54 | Slippage = 5 | Trading fee = 0

Total cost = Slippage + Spread + Trading Fee = 5 + 54 + 0 = 59

The Ideal way to trade the CHF/PLN

There are specific times a trader must deal with their trade to decrease both hazard and cost on the trade. This can be made feasible by understanding the above tables. Entering and exiting trades during any time of the day is highly not advised.

The percentages are most elevated in the min column. This means the cost is fairly high when the volatility of the market is low. For instance, on the 1H timeframe, when the volatility is 27 pips, the cost percentage is 218.5%. Meaning, one must bear high costs if they open or close trades when the volatility is around 27 pips. So, ideally, it is proposed to trade when the market volatility is above the average mark.

Categories
Forex Market Analysis

AUD/USD Exhabits Bullish MACD & RSI Crossover – Quick Update on Signal! 

During Tuesday’s European trading session, the AUD/USD currency pair took a U-turn from early-day losses and drew some fresh bids around well above 0.6900 level mainly due to the risk-on market sentiment triggered after the uncertainty between the US-China over trade deal decreased which eventually underpinned the perceived risker Australian dollar and contributed to the currency pair gains. On the other hand, the gains in the currency pair were further bolstered by the broad-based US dollar selling bias in the wake of risk-on market sentiment. At the press time, the AUD/USD currency pair is currently trading at 0.6928 and consolidating in the range between 0.6858 and 0.6938.

It is worth recalling that the currency pair was dropped by over 60 pips in the earlier session and hit session’s low near 0.6860 mainly after White House advisor announced the end of US-China trade deal which initially triggered the risk-off market sentiment and pushed the currency pair lower.

Later, the Navarro explained properly that his comments were taken wrongly by the market and the phase-one agreement was on track. At the same time, the US President Donald Trump also tweeted that the agreement was “fully intact” which eventually turned out to be one of the key factors that kept a lid on any additional downbeat sentiment in the market and exerted some positive impact on the AUD/USD currency pair.

At the USD front, the broad-based US dollar failed to maintain its early day bullish moves and edged lower at least for now, mainly due to the fresh risk-on wave in the market sentiment triggered by the multiple reasons which gave a boost to the risk market and contributed to the greenback’s decline. However, the declines in the US dollar kept the currency higher. From a technical perspective, the currency AUD/USD pair now broke the hurdle above the 0.6900 round-figure marks and seems poised to build on the overnight strong recovery move from the 0.6800 neighborhood. 


Looking forward, the market traders will keep their eyes on the flash version of the US Manufacturing and Services PMI for June. Let me remind, this data will be followed by the release of New Home Sales data and the Richmond Manufacturing Index, which will leave an impact on the USD price dynamics and produce some short-term trading opportunities around the AUD/USD pair.

The AUD/USD is on a bullish run, heading toward 0.6978 level. The MACD and RSI both are exhibiting bullish crossover, and these are expected to lead the Aussie to a higher level until the level of 0.6975. Bullish trend continuation can lead to AUD/USD further higher until 0.7030 level. For now, here’s a quick trade idea.


Entry Price – Buy 0.6934

Stop Loss – 0.6894    

Take Profit – 0.6974

Risk to Reward – 1

Profit & Loss Per Standard Lot = -$400 / +$400

Profit & Loss Per Micro Lot = -$400/ +$40

Categories
Forex Course

131. Timing Your Entry While Trading Divergence

Introduction

Divergence is a powerful tool in trading. It works like a charm when used correctly. However, traders enter right after they spot a divergence, which is an incorrect method to trade it. Early entry can lead to spikes or wrong comprehension; as a result, executing your stop loss. Thus, precise entries are as crucial as understanding divergence. This shall go over some tips and tricks to not enter early in a trade.

The Double Confirmation Rule

When we spot a regular divergence, the market does not reverse immediately. The majority of the time, it goes through a consolidation phase. And patiently waiting through the price action is necessary. Here is an example that explains how long a trader must wait before taking the trade.

Below is the chart of GBP against CAD on the 15mins time frame. Reading from the left, the market was in a downtrend, making lower lows and lower highs. In the second lower low, we see that the indicator failed to make a lower low but made a higher low instead. There are several ways through which the market can reverse its direction. The double confirmation rule is for the situations when the market holds above the S&R level (purple ray).

According to the rule, the price must successfully hold above the S&R level two times. This is a confirmation that the S&R level has potentially turned into Support. So, when the rule is satisfied, you can place a buy order right at the S&R level. A logical Stop Loss must be maintained a few pips below the start of the buyer who broke above the S&R. Whereas a safe Take Profit can be at a strong Supply area.

The Spike confirmation

The previous case dealt when the scenario when the market held above the S&R level. Conversely, this is a scenario when the market holds below the S&R. Let us understand the spike confirmation entry with an example from real charts. Below is the chart of EUR against USD on the 15mins time frame. Initially, the market was trending down with lower lows. From the most recent low, we see that the price moved down, but the MACD indicator is faced up, indicating divergence.

When the buyers began to pull back, they were unable to pass through the S&R level (purple line), unlike the previous example. Thus, we cannot apply the double confirmation rule. Instead, the spike confirmation is applied. The spike confirmation is applied for scenarios when the market holds below the S&R level. According to it, one must wait until the market attempts to make a lower low and fails. After the failure, one can prepare to go long.

The Logic

When the market holds below the S&R level, it means that the sellers are not done with their business. The job of a seller is to make lower lows by holding below the S&R. So, though there is divergence, we cannot ignore the fact that the sellers are still in the game. Thus, we must wait for the sellers to attempt to make a lower low. And if the price shoots right back up, it signifies that the sellers are done with their business, and the buyers have taken over the market.

Once the buyers come up strong, you can trigger a buy at the most recent S&R (dotted line). The Stop Loss will go right below the area where the sellers had failed. Take Profit can be at a potential supply area. But in this case, we see a divergence when the price made a higher high. Thus, the positions must be liquidated in the area shown in the chart.

Note that the same principles can be applied to an uptrend as well. These were only a couple of effective ways to enter using divergence. As you gain experience, you come with your own rules too.

[wp_quiz id=”78246″]

Categories
Forex Daily Topic Forex Fundamental Analysis

Understanding ‘Industrial Production Index’ & Its Relative Impact On The Forex Market

What is the Industrial Production Index?

Industrial Production Index or IPI, as it is commonly called, is an index that tracks manufacturing activity in different sectors of the economy. The IPI number measures the industrial production for the period under consideration, usually a month. IPI is a key economic indicator of the manufacturing sector of the economy. It measures the real output in the mining, electric, and gas industries, relative to the base year.

How is IPI calculated? 

Industrial Production is expressed as an index relative to the base year, which is 2012. They do not express absolute production numbers or volume, but the percentage change in production relative to 2012. The parameter taken into account is often varied, including physical inputs and outputs such as tons of iron, or inflation-adjusted sales figures, and when these parameters are not available, hours logged in by production workers is considered. This data is obtained from industry associations and government agencies, and the index value figure is obtained after incorporating these numbers in the Fisher-Ideal formula.

Within the IPI index, several sub-indices provide a detailed look at the production levels of highly specific industries. One can find the monthly production data of residential gas sales, ice cream, carpet and rug mills, spring and wire products, audio and video equipment, and paper in these sub-indices. The indices are seasonally adjusted, and sometimes the format is unadjusted.

Limitations of the IPI

While GDP estimates show that the manufacturing sector has picked up, the IPI doesn’t. In such cases, the question arises, which of the two should we believe. The selection of items for measuring the production output has remained the same for many years. This will have implications on the index value. IPI growth will have a certain directional bias. The recommendation has always been to make it more dynamic. All they are saying is to revise it more frequently. But the officials have been only pushing the dates forward.

Another limitation is in the selection of the base year. The 2011-2012 base year series shows faster growth than the previous one, 2004-2005 base year. Therefore, it is suggested to use the old methodology alongside the new method.

Analyzing the IPI 

The IPI data is particularly useful for money managers and investors who are a part of the business. At the same time, the composite index is an important macroeconomic indicator for economists who analyze the impact of the numbers on the economy and industry. Fluctuations within the industrial sector account for variation in the overall economic growth. The monthly metric keep investors informed about the shifts in the production levels.

At the same time, IPI ignores the most popular economic output measure, the Gross Domestic Product (GDP). GDP calculates the price paid by the end-user, so it includes the value-added in the retail sector. This is ignored by IPI. Another observation is that the industrial sector is losing its share in the GDP of a country; for instance, it made up less than 20% of the GDP of the U.S. economy as of 2016.

Along with IPI, capacity utilization is another useful indicator that investors analyze to assess the demand scenario. Low capacity utilization or overcapacity, in other words, signals weak demand. Policymakers read it as a need for fiscal or monetary stimulus in the economy. Investors read it as a sign of coming downtrend for the currency and the stock market. High capacity utilization, on the other hand, acts as a warning signal that the economy is overheating, suggesting the risk of price hikes and asset bubbles. Policymakers react to such threats with interest rate hikes or fiscal austerity. There is also a possibility that this could ultimately result in a recession.

Impact on Currency

Industrial production figures are directly proportional to the value of a currency. When Industrial Production is high, it means economic activity is improving in the country that directly contributes to the GDP. A rate of GDP leads to an appreciation in the currency value. However, an effect on the overall economy is felt when industrial production is increasing each month. An improvement in the production output for one month has no impact on the currency; the average value of at least three months makes a difference. The IPI is an early indication of growth in the manufacturing sector, which is why it is closely watched by investors and traders.

Sources of information on Industrial Production Index

The Federal Reserve Board publishes the industrial production index (IPI) every month, which is released approximately in the 2nd week of the month. The revisions in the method of calculation, if any, are released at the end of every March. As it is an important indicator of growth in the manufacturing sector, most open-source economic websites keep track of their respective countries’ data.

GBP (Sterling) – https://tradingeconomics.com/united-kingdom/industrial-production

AUD – https://tradingeconomics.com/australia/industrial-production

USD – https://tradingeconomics.com/united-states/industrial-production

CAD – https://tradingeconomics.com/canada/industrial-production

EUR – https://tradingeconomics.com/european-union/industrial-production

JPY – https://tradingeconomics.com/japan/industrial-production

The Industrial Production Index (IPI) is an important economic indicator published by the Federal Reserve Board (FRB) of the United States that measures manufacturing, mining, and utilities’ real production output. The indices are computed mainly as fisher indices with more weightage on the annual estimates of value-added. The fisher methodology only preserves the growth information, which is why the value of the base year, i.e., 2012, is randomly set to 100. This index, along with other industrial output indexes and construction, accounts for the bulk of the total output variation throughout the business cycle.

Impact of the ‘Industrial Production Index’ news release on the Forex market

In the previous part of the article, we understood the significance of Industrial production fundamental indicators in an economy. Now let’s discuss the impact of the Industrial Production Index news announcement on the value of a currency and witness the change in volatility due to the news release. As discussed previously, Industrial Production measures the change in the total inflation-adjusted value of output produced by manufacturers, mines, and utilities.

For instance, Industrial Production measures the output of businesses in the industrial sector of the United States economy, where the manufacturing sector accounts for 78 percent of total production. Some of the biggest segments of this sector are Chemicals, food, drinks and tobacco, machinery, computer and electronics, motor vehicles, and others.

Now let’s analyze the Industrial Production data of the United States released in June. As we can see in the below image, Industrial Production in the United States increased to 1.4% percent in May, which was much higher than the previous month. The Industrial Production numbers in April and May are largely influenced by COVID-19. Let us find out the reaction of the market to this data.

EUR/USD | Before the announcement

Let us start with the EUR/USD currency pair witness the change in volatility due to the news announcement. The above image shows the state of the chart before the news announcement, where we see that the market was in an uptrend and recently has laid out signs of reversal.

EUR/USD | After the announcement

After the news announcement, the price moves higher, and volatility slightly increases to the upside. However, the price does not go much higher, and the major trend to the downside continues. Thus, it would be right to say that the news announcement had a positive impact on the U.S. dollar.

USD/JPY | Before the announcement

USD/JPY | After the announcement

The above images represent the USD/JPY currency pair, where we see that the market is moving within a ‘range’ before the news announcement. Just when the Industrial production numbers are to be released, the price is at the top of the ‘range,’ and volatility is high. Depending on the impact of the news release, we take a suitable position in the currency pair.

After the news announcement, the market moves lower by a couple of candles, as seen in the above image, and gets retraced by strong buyers who take the price above the ‘news candle.’ But since the price is again at resistance, it eventually moves lower and reaches the support. By this price action, we can say that the currency pair becomes highly volatile after the news announcement.

NZD/USD | Before the news announcement

NZD/USD | After the news announcement

The above price charts belong to NZD/USD currency pair, where we see that before the news announcement, the price was moving higher, and now it has displayed a strong reversal pattern in the market, indicating a reversal to the downside. If the news release does not change the underlying price action pattern, one can take a risk-free ‘short’ position in the currency pair. This is how technical analysis is used in conjunction with fundamental analysis.

After the news announcement, the price moves higher by a little, and ultimately the reversal pattern dominates the market, and price makes a ‘lower low.’ Therefore, the slight bullishness that was witnessed due to the news announcement was of significance, and the market crashed.

We hope you got the gist on what the ‘Industrial Production Index’ is and its impact on the Forex price charts after its news release. In case of any questions, let us know in the comments section below. Cheers!

Categories
Forex Market Analysis

Daily F.X. Analysis, June 23 – Top Trade Setups In Forex – PMI Figures in Highlights! 

On the news front, we need to keep an eye on Manufacturing and Services PMI figures, which are expected to drive movement in the EUR/USD and EUR/CHF pairs. Besides, the U.S. Flash Manufacturing PMI will be in focus for the precious metal gold.

Economic Events to Watch Today 


EUR/USD – Daily Analysis

The EUR/USD prices were closed at 1.12612 after placing a high of 1.12697 and a low of 1.11684. Overall the movement of EUR/USD remained bullish throughout the day. The EUR/USD pair rose on Monday and broke the bearish streak of the previous four days on the back of U.S. dollar broad-based weakness.

The U.S. 10-year Treasury yield fell to 0.676%, its lowest since June 15, this exerted a negative impact on the U.S. dollar and rose EUR/USD pair on Monday. The Wall Street Journal’s main indexes, Dow Jones rose by 0.45%, and Nasdaq rose by 0.80% on increased risk appetite, which eventually weakened the greenback.

The safe-haven demand rose after an increased number of reported infection cases throughout the world, failed to hit EUR/USD pair. The safe-haven rallies were too short-lived that it failed to raise the U.S. dollar; hence, the EUR/USD pair followed its direction.

The EUR/USD gained traction on Monday on the back of E.U. coronavirus measures because Eurozone has been perceived as a region that handled the coronavirus pandemic relatively well than the U.K. and the U.S. as the methods to control the economy from falling by the U.K. and the U.S. have been criticized. Despite the delayed decision on the distribution of the latest fiscal policy of the Eurozone, the pair EUR/USD managed to find its demand based on the fact that the policy will be agreed on by member states eventually.

On the data front, from Eurozone, the Consumer Confidence over the Eurozone economy remained flat with the expectations at -15 for June. From America, the Existing Home Sales in May dropped to 3.91M from the expected 4.15M and weighed on the U.S. dollar. The weak U.S. dollar against the Euro also helped the pair EUR/USD to post gains. The dollar was stronger last week, but due to concerns over the impact of coronavirus over the U.S. economy, the U.S. dollar struggled to hold its ground.

The optimism over the Eurozone handling of the coronavirus pandemic kept the pair EUR/USD pair higher. This also means that if Eurozone outlook became gloomy, then the pair EUR/USD could lose its traction.

On Tuesday, the PMI projections from Eurozone will be released, giving a better idea to investors how well the Eurozone economy was performing in the given pandemic circumstances. If data came disappointing, then the pair EUR/USD would suffer on the back of the Eurozone’s weak outlook, which would eventually raise the appeal for the U.S. dollar as well.

Daily Support and Resistance

  • R3 1.1224
  • R2 1.1211
  • R1 1.1193

Pivot Point 1.1181

  • S1 1.1163
  • S2 1.1151
  • S3 1.1133

EUR/USD– Trading Tip

The EUR/USD is trading in a sideways range of 1.1278 – 1.1250 level. On the higher side, a bullish breakout of 1.1278 can lead EUR/USD prices towards 1.1300 and 1.1325 level. While the bearish breakout of 1.12500 can lead EUR/USD prices towards 1.1230 and 1.1205. Besides, the leading indicators are mixed; for example, the RSI is suggesting a selling bias, while the MACD is indicating a bullish bias. Let us look for buying trades over the 1.1245 level today. 


GBP/USD – Daily Analysis

The GBP/USD closed at 1.24699 after placing a high of 1.24768 and a low of 1.23346. Overall the movement of GBP/USD pair remained bullish throughout the day. After posting losses for four consecutive days, GBP/USD pair rose on Monday and recovered all of its previous day’s losses amid U.S. dollar weakness and Brexit hopes.

The latest meeting of PM Boris Johnson with French PM Emmanuel Macron and E.C. President Ursula von der Leyen last week gave some hope to Brexit when the E.U. agreed that the U.K. would not extend the transition period. Both sides reported that the UK-EU trade deal was possible as they pledged to prioritize the Brexit-trade deal.

The optimism after that meeting concerning Brexit has eased the selling pressure on the British Pound. Furthermore, the U.K. government has planned to ease the restrictions concerning COVID-19 included social distancing; it will allow the restaurants and puns to reopen and increase their capacities.

This report also helped the British pound gain traction as reopening restaurants will help the economy get back on track. On the data front, at 15:00 GMT, the CBI Industrial Order Expectations for June came in as -58 against the expected -50 and weighed on British Pound, which eventually exerted pressure on GBP/USD.

On the other hand, at 19:00 GMT, the Existing Home Sales in May were reported as 3.91M against the forecasted 4.15M and weighed on the U.S. dollar, which gave a push to GBP/USD prices on Monday. U.S. dollar opened this week with a softer tone due to decreased hopes of quick U.S. economic recovery after the renewed cases of coronavirus. The market has shifted its viewpoint from the fears of the second wave of coronavirus to the concerns about economic recovery, and this made the U.S. dollar weaker on Monday.

Meanwhile, Japan gave the U.K. just six weeks to strike a post-Brexit deal, if accomplished, it would be one of the fastest trade negotiations in history, along with Britain’s first trade deal in more than 40 years.  

Daily Support and Resistance

  • R3 1.2378
  • R2 1.2369
  • R1 1.2357

Pivot Point 1.2348

  • S1 1.2337
  • S2 1.2327
  • S3 1.2316

GBP/USD– Trading Tip

The GBP/USD is trading bullish at a level of 1.2479, holding right above 50 periods of EMA, which is likely to extend support at a level of 1.2445. On the downside, the GBP/USD may find support around the value of around 1.2440, and the continuation of a selling trade can lead Sterling prices to be further lower until 1.2378 level. The MACD and RSI are holding around in a buying zone right now, and the recent formation of a bullish engulfing candle can lead to GBP/USD prices further higher until 1.2511 level.


USD/JPY – Daily Analysis

The USD/JPY was closed at 106.899 after placing a high of 107.009 and a low of 106.728. Overall the movement of USD/JPY remained bullish throughout the day. After falling for three consecutive days, USD/JPY pair surged on Monday and posted gains on the back of decreased U.S. dollar strength against Japanese Yen.

The safe-haven currency Japanese Yen was stable due to the rising fears of coronavirus second wave and renewed restrictions in some countries to prevent the virus from spread again. World Health Organization said that 183,000 new cases of coronavirus were reported on Sunday, which indicated the renewed spread of the virus throughout the world. The organization said that the virus was deadly, and there were no signs of virus losing its potency.

This statement gave a surge to safe-haven demand amid rising fears of the second wave of coronavirus, and hence, Japanese Yen gained traction and weighed on USD/JPY pair, and the pair lost some of its daily gains. A large number of increased cases were reported by North & South America, which exerted negative pressure over the outlook of the U.S. economy, and hence, the U.S. dollar remained consolidated on the day. The Federal Reserve officials had already warned that if a pandemic was not brought under control, then the jobless rate could rise again.

However, despite the U.S. dollar weakness and Japanese Yen’s strength, USD/JPY barely moved and remained consolidated mostly in the day. The U.S. Dollar Index, which measures the value of the U.S. Dollar against the basket of six currencies, fell by 0.1% on the day.

On the other hand, E.U. leaders were aiming to reach an agreement before summer break on the attest stimulus package distribution, which they were failed to reach in the last virtual meeting. This time hopefully, they will conduct a physical meeting in July or early August. 

The latest stimulus package from E.U. commission in aid to fight against coronavirus pandemic crisis to E.U. members has already given strength to Euro, the rival of the U.S. dollar. It has also weighed on the U.S. dollar a bit, which is why the agreeability of E.U. member states on this package holds importance over the U.S. dollar movement.

However, given the fundamentals & news, everything was against the U.S. dollar, and despite this, USD/JPY pair moved in an upward direction, which indicated that investors took profit from their positions, which caused a surge in USD/JPY prices.

Moreover, some good news from China that it wanted to comply with phase one deal requirements and showed a willingness to buy more U.S. farm products also helped the U.S. dollar to gain its strength back.

Adding to the optimism and USD/JPY gains was the news that Donald Trump held the sanctions on Chinese officials over Uighurs only to pursue a trade deal. He said that a great deal means that he could not impose further sanctions on China as he wanted the phase one deal to complete.

Daily Support and Resistance    

  • R3 107.13
  • R2 107.05
  • R1 106.94

Pivot Point 106.85

  • S1 106.74
  • S2 106.65
  • S3 106.54

USD/JPY – Trading Tips

The USD/JPY is trading with a bullish bias at 107.220 level, but the overall trading range of 107.620 – 106.630 remains intact. It failed to break above an immediate resistance level of 107.580. This level is working as resistance for USD/JPY, and the 50 periods EMA is also prolonging strong resistance at 107.200 zones while immediate support lingers nearby 106.600. The USDJPY bearish trend can trigger a sell-off unto the next support level of the 106.017 level today. Let’s wait for the USD/JPY to test the 107.650 level before entering a sell in the USD/JPY. 

Good luck! 

Categories
Forex Options

FX Options Market Combined Volume Expiries for 23rd June 2020

Thank you for visiting the Forex Academy FX Options market combined volume expiries section. Each day, where available, we will bring you notable maturities in FX Options of amounts of $100 million-plus, and where these large combined maturities at specified currency exchange rates often have a magnetic effect on price action, especially in the hours leading to their maturities, which happens daily at 10.00 AM Eastern time. This is because the big institutional players hedge their positions accordingly. Each option expiry should be considered ‘in-play’ with a good chance of a strike if labelled in red, still in play and a possible strike if labelled in orange and ‘out of play’ and an unlikely strike if labelled in blue, with regard to the likelihood of price action meeting the strike price at maturity.

…………………………………………………………………………………………………………………..

FX option expiries for June 23 NY cut at 10:00 Eastern Time, via DTCC, can be found below.

– USD/JPY: USD amounts

  • 106.73 500m

USDJPY had a recent break out from a wedge formation, but the upside break was limited to a mere 26 pips, suggesting a lack of buying power. The pair is overbought on the one hour chart and ripe for a pullback. The 106.75 option maturity remains in play with possible further downside price action on the cards.

– EUR/GBP: EUR amounts

  • 0.9010 447m

EURGBP is in a consolidation phase with a downside bias. The pair is overbought on the one-hour chart. Price action is tilted to the downside and a test of the key 0.90 level looks to be on the cards, thus leaving our option maturity in play.

Watch out for PMIs form the Eurozone, UK and USA later which could affect both of the above.

……………………………………………………………………………………………………………………..

As you can see on the charts we have also plotted the expiration levels at the various exchange rate maturities and we have also labelled in red, orange and blue. Therefore, if you see option expiry exchange rates labelled in red these should be considered in-play, because we believe there is a greater chance of the expiry maturing at these levels based on technical analysis at the time of writing. There is still a lesser possibility of a strike if they are in orange and so these are ‘in-play’ too. However, if we have labelled them in blue, they should be considered ‘not in-play’ and therefore price action would be unlikely to reach these levels, which are often referred to as Strikes, at the time of the 10 AM New York cut.

Our technical analysis is based on exchange rates which may be several hours earlier in the day and may not reflect price action at the time of the maturities. Also, we have not factored in economic data releases or keynote speeches by policymakers, or potential market volatility leading up to the cut.

Although we have added some technical analysis we suggest you take the levels and plot them onto your own trading charts and incorporate the information into your own trading methodology in order to use the information to your advantage. Remember the higher the amount, the larger the gravitational pull towards the exchange rate maturity at 10:00 AM Eastern time.

If you want to learn how forex option expiries affect price action in the spot FX market see our educational article by clicking here: https://bit.ly/2VR2Nji

DISCLAIMER: Please note that this information is for educational purposes. Also, the maturities will look more or less likely to become a strike at 10 AM NY time due to exchange rate fluctuations resulting in a different perspective with regard to technical analysis, and also due to upcoming economic data releases for the associated pairs.

Categories
Forex Price Action

Make Full Use of a Strong Reversal Candle

An engulfing candle makes a strong statement about the price reversal. The longer the body, the stronger the statement is. In today’s article, we are going to demonstrate an example of the daily-H4 chart combination trading, where the daily chart produces a bearish engulfing candle with a long bearish body. We find out what it has to offer to the sellers in the end.

The chart shows that the price produces a bearish engulfing candle having a tiny lower spike. The body of the candle is a long one closing well below the last bullish candle. This is one good-looking bearish engulfing candle. Since it is the daily chart, the daily-H4 chart combination traders may flip over to the H4 chart to look for short entries.

The above figure shows the H4 chart. We can see that the last candle comes out as a bullish inside bar. It means the price in the H4 chart may consolidate. The sellers are going to wait to get a bearish reversal candle to go short in the pair.

The last candle comes out as a bearish engulfing candle closing well below consolidation support. The sellers may trigger a short entry right after the last candle closes by setting stop-loss above consolidation resistance and by setting take profit with 1R. Let us now find out how the entry goes.

The next two candles come out as bearish candles. However, the price does not head towards the South as expected. Moreover, the last candle comes out as a doji candle having a long upper shadow. The sellers are to wait for the price to hit the target. The last candle does not convey a good message to the sellers.

Here it comes. The last candle hits the target of 1R. The reversal candle in the daily chart is a very strong one. Do the sellers get anything extra out of it? Let us proceed to the next chart to see what the price does in the chart.

The price makes a long bearish move. It heads towards the South upon having consolidation. The sellers can make a handful of pips by eying in the chart. One of the reasons may be the bearish reversal candle in the daily chart. As far as a candlestick pattern is concerned, an engulfing candle is the most reliable reversal pattern. When you get an engulfing candle like the one we have seen here, it does have a lot to offer. Okay, here is a question. What do you see in the H4 chart here? Yes, the last candle comes out as a strong bullish engulfing candle. This has a lot to offer to the H4-H1 chart combination traders. Therefore, if you are an H4-H1 combination trader, flip over to the H1 chart and make full use of it.

Categories
Forex Education

Setting up a Trading Strategy using Candlesticks

Introduction

Candlestick Analysis is likely the most popular analysis method to read the market and allow the market analyst to understand the traders’ sentiment over time.

In this educational article, we will review some candlestick patterns, which could be used as technical formations to spot market turn, recognize and enter early in the new trend.

Candlesticks Basics

Candlesticks use the same information that OHLC bars; however, candlestick charts show the market information differently. The components of candlesticks are the open price, high, low, and close in a specific range of time, such as weekly, daily, and intraday. The following figure represents the structure of a candlestick in a bullish and bearish context.

In the previous figure, we observe that the range between the open and close prices of the candlestick forms the body of the candle. If the close of the session is higher than the open, then the candle is bullish (white). If the close price level is lower than the open price level, then the candle will be bearish (Black).

The range of the prices that moves above and below the body of the candle is called the shadow or wick, whose length can be from very short to quite long. The span between the high and low of the candle reveals how volatile it has been the trading session or intraday period.

Candlesticks Formations to Trade

Candlesticks formations provide a variety of information concerning the market movements. For instance, it can reveal when the price is in a slowdown, in trend, or soon to reverse in the next trading sessions. The understanding of these formations is essential to chart analysis because candlesticks charts can be analyzed without lag.

Hammer and Hanging Man

A Hammer is a candlestick pattern that shows a small body and a long shadow, with its close is near the high of the day. When the Hammer is located at the end of a bearish trend, the Hammer is considered a bullish reversal signal.

The Hanging Man is similar to the Hammer, but it appears at the end of an uptrend; this pattern reveals the possibility of a reversion of the uptrend.

Both Hammer and Hanging Man should have a large shadow compared to its body. The shadow extension will be indicative of the volatility of a trading session where the price plummeted and then recovered to close the session at the top of the trading range.

Belt-Hold Pattern

The Bullish Belt-Hold pattern is a formation in which the opening price is at the low of the session. Prices start to rally and close near the top of the session’s range with higher momentum. The opposite occurs on the bearish pattern, where the price opens at the high of the range and closes near the low.

If the next open is higher than the close of the bearish belt-hold candle, then it is likely that the price will continue moving higher. If the price opens below the bullish belt-hold close, then it is likely the market will continue moving bearish.

Engulfing Pattern

The engulfing pattern is a formation that requires a pair of candlesticks to complete the formation. The bullish engulfing pattern is a formation that suggests the reversion of the downtrend and surges at the end of a bearish trend. The opposite case occurs when the market moves in an uptrend. An engulfing pattern is one of the most powerful of the candlestick reversal signals.

The formation is completed once that large bullish candlestick body completely covers the body of a smaller candle of the previous trading session. The larger is the timeframe where the engulfing pattern appears, the more significative will be the reversal. The following figure represents the bullish and bearish engulfing pattern.

Harami Pattern & Harami Cross

The harami pattern, also known as an inside bar, requires two candlesticks to complete the formation—however, the harami pattern, or inside bar, the weakest of the reversal patterns.

The harami pattern is a formation with a small body that fits entirely into a large body candle. This pattern is indicative of the reversion of the trend, and its importance grows if the formation appears after a prolonged trend. The harami cross is a particular case of the harami pattern; the pattern consists of almost identical opening and closing levels.

The Doji Pattern

The doji pattern appears when the trend moves in an exhaustion stage. This pattern is characterized by a vanishing body, where the session’s open and close prices are almost identical.

The importance of a doji grows after an extended uptrend or downtrend. If following a doji, it appears an engulfing pattern, the possibility of a potential reversal move will increase.

Piercing Pattern and Dark-Cloud Cover

The piercing formation has similarities with the bullish engulfing pattern and is characterized by its appearance at the bottom of a downtrend. The main difference from the bullish engulfing pattern is that the bullish candle on the Piercing Pattern does not fully cover the previous candlestick. Instead, it closes above the 50% level.

The dark cloud cover is a bearish reversal formation. In this case, the bearish candle is a big body candlestick that covers at least 50% of the previous trading session’s candle. The strength of the reversal signal will be stronger, as more extension is covered.

Morning Star and Evening Star

The star candlestick pattern is a formation where a price gap separates a small body candle from the body of the previous candlestick. The star could be a doji or a narrow range candle. This formation warns the market analyst of an imminent reversion of the trend.

A Morning Star pattern is a bullish reversal formation that appears in the bottom of a downtrend and requires three candlesticks. The first candle is a powerful bearish candle with a body of wide range. The second candle corresponds to the star, and it is a candlestick of a narrow range, separated by a gap with the previous candle. The third candle is a bullish candle with upward momentum. The body of this candle should surpass 50% of the first candlestick.

The Evening Star pattern is a bearish reversal formation that appears at the end of a bullish trend. similarly to a morning star pattern, the range of the third candle will be indicative of the strength of the reversal movement

Conclusions

In this educational article, we reviewed seven candlesticks patterns that show trend reversals in a specific range of time. One of the pros of these candlestick patterns is that it is not a lagging indicator, and its analysis could provide the information the market sentiment without delay.

However, although the candlestick analysis could provide an entry setup, they can not provide a target level by itself. This type of study should be accompanied by complementary techniques to improve the odds of success and determine potential profit targets.

In the following article, we will review the use of chart patterns to determine the trend.

Suggested Readings

  • Fischer, R., Fischer J.; Candlesticks, Fibonacci, and Chart Patterns Trading Tools; John Wiley & Sons; 1st Edition (2003).
Categories
Forex Assets

How Best To Trade The ‘CHF/AUD’ Forex Currency Pair?

Introduction

CHF/AUD is the acronym for the Swiss Franc against the Australian Dollar, and it is an exotic Forex currency pair. Here, the CHF is the base currency, and the AUD is the quote currency. Both CHF and AUD are major currencies and are vastly traded in the foreign exchange market. CHF is the official currency of Switzerland, while AUD is the national currency of Australia.

Understanding CHF/AUD

The price of this pair in the trade market defines the value of AUD equivalent to one Swiss Franc. It is quoted as 1 CHF per X AUD. For instance, if the value of this pair is 1.5318, these many Australian Dollars are required to acquire one CHF. 

Spread

The difference between the ask-bid price is referred to as Spread, which is charged by the broker. This value is different in the ECN and STP accounts. The estimated Spreads for CHF/AUD pair is given below.

ECN: 17 pips | STP: 22 pips

Fees & Slippage

A fee is a price that one pays for the trade. There are zero fees charged on STP accounts, but a few pips are charged on ECN accounts. Slippage is the difference calculated between the price by the trader and the price the trader received from the broker.

Trading Range in CHF/AUD

The trading range is represented in the tabular format to showcase the pip movement of a currency pair in various timeframes. These values are useful in ascertaining the profit that can be generated from trade in advance. To discover the trading costs, we must multiply the below volatility value with the pip value of this pair.

Procedure to assess Pip Ranges

  1. Add the ATR indicator to your chart
  2. Set the period to 1
  3. Add a 200-period SMA to this indicator
  4. Shrink the chart so you can assess a large time period
  5. Select your desired timeframe
  6. Measure the floor level and set this value as the min
  7. Measure the level of the 200-period SMA and set this as the average
  8. Measure the peak levels and set this as Max.

CHF/AUD Cost as a Percent of the Trading Range

The trading range is obtained by identifying the ratio between total cost and volatility; it expressed in terms of percentage. Below is the representation of the cost differences of traders in various timeframes and volatilities.

ECN Model Account

Spread = 17 | Slippage = 5 |Trading fee = 8

Total cost = Slippage + Spread + Trading Fee = 5 + 17 + 8 = 30

STP Model Account

Spread = 22 | Slippage = 5 | Trading fee = 0

Total cost = Slippage + Spread + Trading Fee = 5 + 22 + 0 = 27

Trading the CHF/AUD

When the percentage value is higher, the cost of the trade gets more expensive. From the above tables, we can conclude the values are significant in the min column and relatively less significant in the max column. It means that the costs are high when the market’s volatility is low. It is not advisable to trade when both the volatility and cost of trading is high. Balancing both these factors is ideal to trade when the pair’s volatility is in the range of the average values.

Additionally, to lower your costs even further, you can place trades using limit orders instead of market orders. By executing limit orders, the slippage will not be involved in the calculation of the total costs. And this will set the cost of the trades low by a decent number. An example of the same is given below.

STP Model Account (Using Limit Orders)

Spread = 22 | Slippage = 0 |Trading fee = 0

Total cost = Slippage + Spread + Trading Fee = 0 + 22 + 0 = 22

Categories
Forex Course

130. How to Effectively Trade Regular Divergence?

Introduction

The occurrence of divergence is considered by all types of traders, including traders who do not analyze charts without indicators. This is because divergence gives an edge to their trading strategy. In the previous lessons, we interpreted the meaning of divergence and also its different types. In this lesson, we shall put this knowledge into action, where an effective strategy will be discussed.

Trading a regular divergence

To recap a real quick, regular divergence is a type of divergence which indicates a reversal in the market. If it indicates a reversal to the upside, it is referred to as bullish divergence and bearish divergence for a reversal to the downside.

Spotting regular divergence

  1. Find the overall trend of the market.
  2. Mark the lower lows for a downtrend and higher highs for an uptrend on the price charts.
  3. Draw the corresponding movement on your choice of oscillator indicator.
  4. Determine if both prices and indicators are making the same sequences. If they are moving apart from each other, then we conclude that divergence has occurred.

Trade Example

Consider the below chart of AUD/JPY on the 15mins time frame. We can see that the market is in a downtrend making lower lows. For the first lower low in the price, the MACD had a lower low as well. But, for the second lower low in price, the indicator made a higher low. Thus, showing divergence in the market.

Since this is a regular bullish divergence, it indicates a reversal in the market. But, note that divergence does not give a trading signal to buy the security. An indication of a reversal must be based on the strategy. Here are some compelling points to confirm the legitimacy of a divergence.

When divergence occurs in a pair, the first factor is to measure the length and momentum of the down pushes. Comparing the first down push to the second, it is observed that the latter is smaller in length and also took a greater number of candlesticks than the former. This is a considerable indication that the downtrend is weakening.

Secondly, observe what the price does when it reaches the Support & Resistance level (purple ray). We can see that the price touched the purple ray, tried to go below the recent low, but failed to do so. This is another indication of the sellers’ weakening.

Now that the sellers are losing strength, we wait for the other party (buyers) to kick in. In the below chart, we can see the entry of the buyers with one massive bullish candlestick. This becomes our first confirmation that the big buyers are in the market.

However, it is not ideal to buy right when the buyers show up because, at times, the sellers could take over and continue to make lower lows. Thus, to confirm the reversal, the buyers must hold above the S&R level (purple ray). In the below chart, we see that the price came down, tried to go lower the S&R, didn’t succeed, and held above it. Hence, this confirms that the market has prepared for a reversal, and we can go long when the candlestick closes above the purple ray, as shown by the black arrow.

As a result, we see that the market successfully reversed its direction and began to make higher highs.

[wp_quiz id=”77943″]
Categories
Forex Options

FX Options Market Combined Volume Expiries for 22ND June 2020

Thank you for visiting the Forex Academy FX Options market combined volume expiries section. Each day, where available, we will bring you notable maturities in FX Options of amounts of $100 million-plus, and where these large combined maturities at specified currency exchange rates often have a magnetic effect on price action, especially in the hours leading to their maturities, which happens daily at 10.00 AM Eastern time. This is because the big institutional players hedge their positions accordingly. Each option expiry should be considered ‘in-play’ with a good chance of a strike if labelled in red, still in play and a possible strike if labelled in orange and ‘out of play’ and an unlikely strike if labelled in blue, with regard to the likelihood of price action meeting the strike price at maturity.

…………………………………………………………………………………………………………………..

FX option expiries for Monday, June 22 at the 10am NY cut

–  EUR/USD (Euro amounts)

  •  1.1200 870m
  •  1.1205 873m
  •  1.1250 858m
  •  1.1300 926m

EURUSD pair is in a bear channel and hovering near the key 1.12 level while overbought on the one hour chart. The economic calendar is light, but watch out for German Buba President Weidmann speech and Chicago Fed before the New York cut.

USD/JPY (US $ amounts)

  •  108.00 853m

USDJPY pair is testing the resistance line of a wedge shape formation, but the large expiry at 108.00 is out of play.

 USD/CAD (US $ amounts)

  •  1.3600 685m

USDCAD pair faltered to the upside of an ascending channel on the one hour chart and is testing the support line having not conformed to the recent oversold indicator. If the support line holds our option maturity at 1.36 will remain in play.

……………………………………………………………………………………………………………………..

As you can see on the charts we have also plotted the expiration levels at the various exchange rate maturities and we have also labelled in red, orange and blue. Therefore, if you see option expiry exchange rates labelled in red these should be considered in-play, because we believe there is a greater chance of the expiry maturing at these levels based on technical analysis at the time of writing. There is still a lesser possibility of a strike if they are in orange and so these are ‘in-play’ too. However, if we have labelled them in blue, they should be considered ‘not in-play’ and therefore price action would be unlikely to reach these levels, which are often referred to as Strikes, at the time of the 10 AM New York cut.

Our technical analysis is based on exchange rates which may be several hours earlier in the day and may not reflect price action at the time of the maturities. Also, we have not factored in economic data releases or keynote speeches by policymakers, or potential market volatility leading up to the cut.

Although we have added some technical analysis we suggest you take the levels and plot them onto your own trading charts and incorporate the information into your own trading methodology in order to use the information to your advantage. Remember the higher the amount, the larger the gravitational pull towards the exchange rate maturity at 10:00 AM Eastern time.

If you want to learn how forex option expiries affect price action in the spot FX market see our educational article by clicking here: https://bit.ly/2VR2Nji

DISCLAIMER: Please note that this information is for educational purposes. Also, the maturities will look more or less likely to become a strike at 10 AM NY time due to exchange rate fluctuations resulting in a different perspective with regard to technical analysis, and also due to upcoming economic data releases for the associated pairs.

Categories
Forex Price Action

H1-15M Chart Combination Trading: Mind the Weekend

In today’s lesson, we are going to demonstrate an example of H1-15M chart combination trading. Usually, the H1-15M chart combination trading offers 1:2 risk-reward. However, in this example, the buyers may need to come out with their profit with 1:1 risk-reward. We find out why they shall do that so.

This is the H1 chart. The price heads towards the North with good bullish momentum. The price breaches the last swing high and continues its journey towards the North upon confirming the breakout. Look at the last candle. It comes out as a strong bearish candle. The buyers are to keep their eyes on the pair to get a bullish reversal candle to go long.

The price makes a long bearish correction. Look at the last candle in the chart. It comes out as a bullish candle. The combination of the previous three candles is not a morning star since the last candle does not close above the bearish candle. Nevertheless, the last candle comes out as a bullish engulfing candle. It is a strong bullish reversal candle. It is time for the buyers to flip over to the 15M chart.

This is how the 15M chart looks like. A bullish candle closing above the last candle’s body would be a good signal to go long in the pair. The buyers must keep their eyes in the chart. Let us proceed to the next chart to find out how it comes out.

Look at the last candle. This is one beautiful bullish engulfing candle closing well above the last candle’s wick. A signal candle like this attracts more buyers and usually brings good liquidity. The H1-15 chart combination traders may trigger a long entry right after the last candle closes by setting stop loss below the support level and by setting take profit with 2R. Let us now flip over to the H1 chart again to see how the trade goes.

The price heads towards the North with good bullish momentum. It hits 1R in a hurry. The last candle comes out as an inside bar, which is the weakest bearish reversal candle. In most cases, H1-15 chart combination trading offers 1:2 risk-reward. The question is whether the buyers keep holding the trade or not. I may mention that it is Friday and only three/four hours to go to shut down the market. I think now you know what buyers should do here. Yes, they should close the trade and come out with the 1R profit. The H1-15M chart combination traders should not keep holding their trade during the weekend. In some cases, it may bring them some extra pips. However, in many cases, it may hurt them badly.


Categories
Forex Fundamental Analysis

Significance Of ‘Composite PMI’ As A Forex Fundamental Driver

Introduction

Composite Purchasing Manufacturing’s Index (PMI) is one of the major indicators of the country’s economic health. It is mainly concerned with the manufacturing and service sectors. The PMI provides information about the current business conditions from the data gathered from the company’s decision-makers, such as analysts and purchasing managers.

The PMI survey of each country consists of a questionnaire for the manufacturing or service sector, which collects the responses from the panel of senior purchasing executives at over 400 companies. The Composite PMI is basically a number that ranges between 0 to 100. The number above 50 represents an expansion compared to the previous reading. A PMI reading below 50 represents a contraction, and a reading at 50 indicates no change.

Calculation of the PMI

As mentioned in the above paragraph, the PMI is a number from 0 to 100, but we need to understand how one arrives at those numbers. The PMI is calculated using the below formula.

PMI = (P1 * 1) + (P2 * 0.5) + (P3 * 0)

Where:

P1 = percentage of answers stating an improvement

P2 = percentage of answers stating no change

P3 = percentage of answers stating a deterioration

The percentage stating deterioration has a zero multiplier; thus, it is always zero, but the larger the value of P3, the fewer the weight of the first two factors, thus lowering the total PMI value. in the case of P3=100% PMI = 0.

Use of Composite PMI

The PMI data is a critical decision-making tool for money managers that influences their investment across sectors to a great extent. Let us take the case of an automobile manufacturer, where the production decisions are based on the new orders it expects from the customers in future months. This will make them buy dozens of parts and raw materials, such as tires and plastics. The inventory rules also drive the amount of production the manufacturer needs to finish to fill new orders and to keep some inventory at the end of the month.

From the supplier’s point of view, the PMI data matter to him the most as well. The parts supplier to a manufacturing company will estimate the amount of demand it might get from these companies based on the PMI. Due to this, the suppliers charge more for their parts. The new orders data is closely related to the Composite PMI. For instance, if the new orders are growing, the manufacturing company may raise the prices of its products and accept the high cost of the parts. A company also uses the Composite PMI to plan its annual budget, supervise staffing levels, and manage cash flow.

The Economic Reports 

The Economic Reports of Composite PMI and related data are published monthly by the Institute for Supply Management (ISM) that is extremely useful for manufacturers and the investment managers. The ISM monitors changes in production levels from month to month and is at the core of the Manufacturing report. This is one of the earliest indicators of economic activity and that investors and economists get regularly. The institute also releases a Semi-annual report in May and December. When the number is rising, investors anticipate a bullish reaction from the market to the data that is seen in the currency and stock market.

Analyzing the data

The PMI data is very easy to analyze, where we only have to look at the number and compare it with the previous readings. A PMI reading above 50 indicates growth or expansion of the manufacturing sector. A reading of 50 indicates that the number of manufacturers reporting good business is equal to those stating business is not good. Another key number to look for is 43.2. If the PMI index has been above this number for a period of time, it indicates an expansion of the overall economy. Any number under 50 indicates a contraction in the manufacturing sector and that most businesses are not expecting good business in the near future.

Impact on the currency 

The composite PMI is closely watched by traders and investors around the world that greatly influences their investment decision. They mainly if the number is below or above the 50 levels, which shows potential contraction or expansion in the economy. If the number is greater than 50 over the last few quarters, it indicates growth in the economy, which drives the currency higher. If the number remains below the 50 mark, it means the economy has entered into a recession. Investors will not be interested in investing in countries where the economy is in a recession, which leads to a depreciation of the currency.

Sources of information on Composite PMI

Composite PMI is available on the official website of the Institute for Supply Management (ISM), which also provides a comprehensive analysis of the same. The data can also be found on some open-source economic websites and financial magazines.

Links to Composite PMI information sources

GBP (Sterling) – https://tradingeconomics.com/united-kingdom/composite-pmi

AUD – https://tradingeconomics.com/australia/composite-pmi

USD – https://tradingeconomics.com/united-states/composite-pmi

EUR – https://tradingeconomics.com/euro-area/composite-pmi

NZD – https://tradingeconomics.com/new-zealand/composite-pmi

JPY – https://tradingeconomics.com/japan/composite-pmi

The Composite PMI is a monthly survey sent to senior executives at more than 400 companies in 19 primary industries. The industries and companies are selected based on their contribution to the GDP and the sector, respectively. The surveys include questions about business conditions and any changes, whether it be improving, no change, or deteriorating. Hence, traders must keep an eye on this data and watch for its official releases.

Impact of the ‘Composite PMI’ news release on the Forex market 

Investors consider Composite PMI as a leading indicator of the economic health of a country. It is extremely for international investors looking to form an opinion on a country. The PMI is also a leading indicator of the growth in the gross domestic product (GDP). When formulating monetary policy, central banks use PMI surveys, which is reflected in the fixing of interest rates.

When it comes to predicting the GDP growth, a reading above 42 is considered a benchmark for economic expansion. In contrast, a reading below 42 indicates that the economy is heading into a recession. Since it is an important indicator for most of the people related to the economy and financial sector, it is bound to have a major impact on the value of a currency.

In today’s lesson, we will analyze the impact of composite PMI on different currency pairs and identify the change in volatility due to the news announcement. We will be looking at the PMI data in the Eurozone that was released in June (May as the reference month). The below image shows the previous, predicted, and latest PMI reading, where we see a big increase in the number compared to the previous month. Let us find out if the market receives the data positively or negatively.

EUR/USD | Before the announcement

Let us start with the EUR/USD currency pair to observe the change in volatility due to the news release. The above image shows the price’s behavior before the news announcement, where we see that the market is a strong uptrend. We will be looking to buy the currency pair after a price retracement to a support or demand level. At this point, we shouldn’t be taking any position in the currency pair.

EUR/USD | After the announcement

After the news announcement, volatility expands to the upside, and the market moves higher. As the PMI data was extremely positive for the economy, traders bought the currency and took the price higher. The PMI data had a positive impact on the currency pair, and the market makes new ‘high.’ One has to be cautious here by not jumping into the market for a ‘buy’ as it is against risk management rules.

EUR/JPY | Before the announcement

EUR/USD | After the announcement

The above images represent the EUR/JPY currency pair, where we see that the price is continuously moving higher with minimum retracements before the news announcement. It means the uptrend is very strong. From a ‘trade’ point of view, a similar approach will be followed here as well as we had in the previous currency pair, where we will be looking to buy the currency pair only a price retracement.

Right after the news is released, the price initially moves higher, but later selling pressure makes the ‘news candle’ to close near the opening. Therefore, we witness volatility in both the directions of the market in this currency pair. We can say that the PMI data did not have a major impact on the currency where the market remains sideways a few minutes after the news release as well.

EUR/AUD | Before the announcement

EUR/AUD | After the announcement

The above charts are that of the EUR/AUD currency pair, where the market shows a strong downtrend signifying a great amount of weakness in the Euro. Recently, the price has shown signs of retracement, and so we can expect a continuation of the down move after noticing trend continuation patterns. Until then, we will see what impact the PMI data makes on the currency pair.

After the news announcement, the price does not move adversely in any direction and remains almost at the same place as it was before. The PMI data has a neutral effect on the currency pair where ‘news candle’ forms a ‘Doji’ candlestick pattern. However, the Euro becomes bullish a few minutes after the news release and markets move higher, nearly reversing the downtrend.

This ends our discussion on ‘Composite PMI,’ and its relative impact on the Forex market post its news release. In case of any questions, please let us know in the comments below. All the best!

Categories
Forex Market Analysis

Daily F.X. Analysis, June 22 – Top Trade Setups In Forex – Mixed Market Sentiments Plays! 

On Monday, the market continues to trade sideways due to a lack of high impact economic events. Last week, the current account balance from the U.S. showed a deficit of 104B against the expected 101B deficit and weighed on the U.S. dollar, which dragged the currency pair USD/JPY on the downside. In his speech on Friday, Fed Chair Jerome Powell suggested and demanded from Congress to ramp up the federal relief spending program. According to Powell, the government should aid the states and provide more unemployment benefits along with the public health measures to keep the economy afloat.

Economic Events to Watch Today


EUR/USD – Daily Analysis

The EUR/USD closed at 1.11766 after placing a high of 1.12541 and a low of 1.11679. Overall the movement of EUR/USD remained bearish throughout the day. On Friday, the EUR/USD pair extended its losses and followed its previous day’s bearish trend for the 4th consecutive day and posted losses for the second consecutive week. The pair’s prices moved to 13th day lowest level on the back of risk-off market sentiment after the increased fears of the second wave of coronavirus and intensified US-China tussles.

The risk-off market sentiment was caused by the rising fears of renewed lockdown restrictions throughout the world after several reported infectious cases continuously increased. As well as, the US-China conflicts showed signs of cooling down and weighed on risk sentiment, which ultimately dragged the EUR/USD pair downward.

Meanwhile, E.U. leaders held a virtual summit via video conference on Friday to discuss and finalize the coronavirus recovery plan. However, the video summit failed to strike a compromise on the proposed rescue fund, and the decision remained pending until the next budgetary talks in July.

The European Commission President, Ursula von der Leyen, said that member states had severe differences on many items but agreed on the desire to strike a deal ASAP. This weighed severely on the single currency Euro; hence, the pair EUR/USD moved downward.

Friday’s summit was just the starting point for the talks on European Commission’s $2 trillion (1.85 T euros) budget proposal. The new 750 billion euros plan was also included in the budget, which was launched to help the European economy after COVID 19 crisis. The scheme was set to provide loans of worth 250 B euros and grants to E.U. member states worth 500 B euros. A credit would finance this all that the European Commission would take from international financial markets.

Furthermore, Leyen also urged rich nations to share any future coronavirus vaccine with the poorer neighbors. She said as she launched the Brussels pandemic strategy that member states would work together to find a vaccine without competition and also suggested other world powers to do the same.

On the data front, the German Purchasing Price Index (PPI) for May was released at 11:00 GMT, which showed a decline of 0.4% against the expected decline by 0.3% and weighed on Euro. At 13:00 GMT, the Current Account Balance from the European Union showed a surplus of 14.4B in April. The weaker than expected data from the Eurozone weighed on EUR and dragged the pair EUR/USD further on the down track on Friday. On the other hand, China and E.U. top leaders are set to hold an annual summit on Monday, which will be a crucial factor to look at next week.

Daily Support and Resistance

  • R3 1.1224
  • R2 1.1211
  • R1 1.1193

Pivot Point 1.1181

  • S1 1.1163
  • S2 1.1151
  • S3 1.1133

EUR/USD– Trading Tip

The EUR/USD pair is trading with a slightly bullish bias at 1.1207, but the overall trend still seems bearish. On the hourly chart, the 50 periods EMA is likely to weigh on the EUR/USD pair and may keep it in a selling zone below 1.1209 today. The support is likely to be found around the 1.1170 level. Besides, the leading indicators are mixed; for example, the RSI is suggesting a selling bias, while the MACD is indicating a bullish bias. On the higher side, a bullish breakout of the 1.1208 level can extend bullish bias until 1.1254 level today. Let us look for buying trades over 1.1170 and selling below the same today. 


GBP/USD – Daily Analysis

The GBP/USD closed at 1.23511 after placing a high of 1.24559 and a low of 1.23439. Overall the movement of GBP/USD pair continued to be bearish throughout the day. The GBP/USD pair dropped for the 4th consecutive day on Friday and posted losses on the back of the increased risk-off market sentiment, insufficient BoE support, and rising coronavirus concerns. The Pound suffered back-to-back weekly losses as the risks of no-deal Brexit and the potential second wave of coronavirus will eventually offset the monetary stimulus of BoE.

Investors start selling British Pound on the view that the recent stimulus of Bank of England might not be sufficient to overcome the economic crisis as the number of infected cases increased day by day in an environment of potential no-deal Brexit. After an uptick in the reported coronavirus cases from the U.S. & China, the U.S. dollar gained and exerted a negative impact on GBP/USD pair on Friday. However, risks to no-deal Brexit played an essential role in the downward movement of the GBP/USD pair.

The PM Boris Johnson has repeatedly ruled out the extension to the Brexit transition period despite the coronavirus crisis. The talks between Brussels & London have been compromised due to the pandemic, and this fact cannot be denied. However, Johnson has still denied calling for an extension in the transition period. This has left only two options on the table, either strike a deal with possible compromises or go for a no-deal Brexit on December 31. Both parties have been disputing over two basis points, one is fishing access, and the other is the level playing field.

Meanwhile, at 11:00 GMT, the Retail Sales in May from Great Britain surged to 12.0% from the forecasted 6.3% and supported British Pound. The Public Sector Net Borrowing was increased to 54.5B from the expected 49.3B and weighed on British Pound that also dragged the GBP/USD pair further.

Daily Support and Resistance

  • R3 1.2378
  • R2 1.2369
  • R1 1.2357

Pivot Point 1.2348

  • S1 1.2337
  • S2 1.2327
  • S3 1.2316

GBP/USD– Trading Tip

On Monday, the GBP/USD is trading is showing a slight bullish correction to trade at 1.2409 level. However, it is holding right below 50 periods EMA which is likely to extend resistance around 1.2415 level. On the downside, the GBP/USD may find support around the value of around 1.2340, and the continuation of a selling trade can lead Sterling prices to be further lower until 1.2278 level. The MACD and RSI are holding around in a buying zone right now. Therefore, we cannot simply open a sell trade here. Let us wait for taking sell trades below 1.2348 level. 


USD/JPY – Daily Analysis

The USD/JPY pair was closed at 106.863 after placing a high of 107.056 and a low 106.764. Overall the movement of USD/JPY remained bearish throughout the day. The USD/JPY posted losses for the 3rd consecutive day of Friday Bank of Japan kept policy steady this week after increasing stimulus in March & April. The bank also issued its April’s monetary policy meeting minutes on Friday. According to the latest minutes issued by Bank of Japan, the governor Haruhiko Kuroda said that inflation would persist well below its 2% target for years to come.

At 4:30 GMT, the National Core Consumer Price Index for the year showed that nationwide CPI, which includes oil but excludes volatile fresh food prices, fell 0.2% in May from the expected fall of 0.1% and weighed on Japanese Yen. The Core Consumer prices from Japan fell for the second straight month during May, reinforced deflation expectations. It also raised challenges for policymakers who were battling the coronavirus pandemic to revive the economy.

Decreased CPI will make the job of BoJ more complicated in respect of restoring growth and inflation during the pandemic as the nation had seen the worst economic slowdown since the war. Many board members of BoJ warned that monetary support from banks in coordination with the government was needed to prevent Japan from returning to deflation. On Friday, in its meeting of April 27, BOJ eased policy further and informed a rise in buying corporate bonds and commercial paper. BoJ also promises to buy an unlimited JCBs. Japan also lifted all coronavirus related restrictions on domestic travel on Friday as the PM Shinzo Abe called people to go for sightseen and attend events to help Japan’s economy to recover.

On the other hand, the current account balance from the U.S. showed a deficit of 104B against the expected 101B deficit and weighed on the U.S. dollar, which dragged the currency pair USD/JPY on the downside.

In his speech on Friday, Fed Chair Jerome Powell suggested and demanded from Congress to ramp up the federal relief spending program. According to Powell, the government should aid the states and provide more unemployment benefits along with the public health measures to keep the economy afloat.

Powell stressed that the economic recovery from the pandemic crisis will be challenging and that there would be no quick fix. He provided a cautionary stance over the U.S. economic outlook, which exerted a negative impact on the U.S. dollar and dragged the pair further.

Daily Support and Resistance    

  • R3 107.13
  • R2 107.05
  • R1 106.94

Pivot Point 106.85

  • S1 106.74
  • S2 106.65
  • S3 106.54

USD/JPY – Trading Tips

On Monday, the USD/JPY is trading at 106.914 level as it continues trading sideways in a wide trading range of 107.620 – 106.630. It failed to break above an immediate resistance level of 107.580. This level is working as resistance for USD/JPY, and the 50 periods EMA is also prolonging strong resistance at 107.580 zones while immediate support lingers nearby 106.600. The USDJPY bearish trend can trigger a sell-off unto the next support level of the 106.017 level today. Let’s wait for the USD/JPY to test the 107.650 level before entering a sell in the USD/JPY. 

Good luck! 

Categories
Forex Signals

USD/CAD Bearish Engulfing Continues to Drive Selling! 

During the early European trading session, the USD/CAD currency pair failed to stop its previous day bearish run-up and dropped to 1.3570 from the 1.3617 level, mainly due to the broad-based U.S. dollar weakness backed by the risk-on market sentiment. As well as, the reason for the pair declined could also be attributed to the upticks in crude oil, which underpinned the commodity-linked currency the loonie and contributed to the pairs declines. 

On the other hand, the losses of the currency pair were further bolstered by the positive comments from the Canadian Finance Minister Bill Morneau about (not considering a tax hike), which initially gave additional support to the loonie. Despite the increasing coronavirus cases in China and some U.S. states, the Asian stocks flashed green backed by optimism about the monetary and fiscal support programs from across the globe in the wake of the coronavirus outbreak. 

On the contrary, the fresh optimism between the United States and China triggered by China’s decision to increase purchases of U.S. farm goods to respect the Phase One trade deal after the talks in Hawaii overshadowed their other concerns and gave additional support to the risk sentiment.

As a result, the broad-based U.S. dollar reported losses that played a key role in the decline of the currency pair. The latest upbeat U.S. jobless claims also suggested a further economic recovery, which also boosted the risk-on market sentiment and pushed the USD lower. In the meantime, the intensifying coronavirus cases will keep a lid on any further losses in the U.S. dollar. 

At the crude oil front, the WTI crude oil prices rose around 3% on the day and hit the 3-month high around the $40.00/barrel mark, mainly due to the reports that Iraq and Kazakhstan have promised to agree with oil cuts. The sign of gradual recovery across the globe was triggered after easing government lockdowns imposed to control the coronavirus, which eventually boosted the oil prices.

However, the oil price gain underpinned demand for the commodity-linked currency – the loonie which kept the currency pair under pressure. The traders will keep their focus on Friday’s Canadian economic docket, which will show the release of monthly retail sales data for a fresh impetus. As well as, the Fed Chair Jerome Powell’s comments at a panel discussion will likely influence the USD price dynamics and further contribute to producing some trading opportunities.


Technically, the USD/CAD is on a bearish mode, as we can see, the pair has crossover below 50 EMA support level of 1.3568. Below this, the market has an opportunity to drop until the next support level of 1.3530 level. The MACD also just had a bearish crossover, which is supporting the selling trend in the USD/CAD pair. Here’s a trading signal on USD/CAD for today.

Entry Price – Sell 1.3587    

Stop Loss – 1.35738    

Take Profit – 1.34938

Risk to Reward – 7.06

Profit & Loss Per Standard Lot = +$130 (SL in Positive Zone) / +$930 

Profit & Loss Per Micro Lot = -$13/ +$93

Categories
Forex Videos

The Golden Rules Of Trading Part 2! Becoming A Full Time Trader…

The Golden Rules of Trading -II


In part I of the Golden Rules of trading, we have developed the rules to accomplish the well-known rule of “cut your losses short and let your profits run.” In part II, we will discuss the next rule.

5.- Understand your trading strategy or system in terms of average, standard deviation, and Drawdown.

Any system or strategy produces a stream of results. These results can be expressed in terms of Multiples of a standard measure of risk, R. The denominator of the Reward/risk ratio. By applying statistical computations to these results, we will be able to obtain its average and standard deviation.

The Average

The average, when obtained from R-based results, is the mathematical expectation (E), and it will tell the expected gain (on average) for every trade in terms of R.
For example, if your E is 0.25, it tells you that your system delivers an average of 0.25 cents on every dollar risked. If your risk is $100 on each trade, your system will produce an average of $25 on every trade. Thus, if your system gives you six signals daily, 120 signals monthly, you will know that your monthly results will be $3,000 on average. But this result was made using $100 risk on all trades. If you were able to raise the risk to $200, you would double the results to $6,000 monthly. Thus, knowing the expectancy E of your strategy is key to define your profit objectives as a trader.

Variability of Results:

The Standard Deviation

The standard deviation (SD) is the other side of the knowledge. It tells you how much your results vary. It tells the risk side of your system. A small standard deviation tells you that the results do not vary much. A large figure will tell you that your results can be substantially different.

Let’s suppose a trader has a system with 0.25R E, but the SD is 4. After 30 trades, the expected gain will be 7.5R, but since it has a huge variability, that trader will have less than 50 percent probability of being profitable.


Drawdown

Drawdown is a metric that will tell the trader how much of its trading capital is risked in, long term. Drawdown is related to position sizing, but if we create risk-based statistics, it can be normalized.
To compute an approximation to the max Drawdown, we need just one value: the average loss, which, as said, is normalized to R.
Drawdown is closely related to losing streaks; thus, an approximation to it is to compute max losing streaks. We can define a max losing streak for a trading system as streak with a probability of occurrence of no more than one percent. That will catch 99% of all streaks.
The probability if a repeated event is an individual probability multiplied by itself n times, being n the number of the repetitions.

For example, the probability of obtaining two tails on a coin toss (50% chance each) is 0.5×0.5 = 25%. The probability of getting four tails is 0.5×0.5×0.5×0.5 = 6.2%.
In a 50% chance game, a streak of six repeated events is 1.56%, and the probability of seven repeated events is 0.78%. If this was a trading system, I’d set my max losing streak to seven to ensure it will cover over 99% of my trading situations.
That means I would need to plan my position sizing for a 7-streak event.
That will cover 7xR Drawdown.

Position size

How is this related to Position size? A max drawdown figure is a key decision for a trader. How much of your capital are you willing to lose before quitting? The answer is directly linked to the ideal position size.
Let’s assume Angie is not willing to lose more than ten percent of her capital, while Bob is willing to accept 50 percent. And let’s assume both are using the same 50% winner system with 1,000 USD in his trading account.
For Angie 7R = 10%, then her risk per trade should be 10%/7 = 1.43% of her account balance.
For Bob 7R = 50%, thus his risk per trade will be 50%/7 = 7.14% of his account balance.
We see that this will define the results, as well. The same system, when using different position sizes, will deliver quite different results.
If the system gives 120R monthly, on a trading account balance of $1,000, Angie will get about $1,714 while Bob will get $8,571.

Now we understand the importance of knowing our system and its parameters. This knowledge will provide us with the needed information to make important decisions and plan our trading objectives.

Categories
Forex Videos

The Golden Rules Of Trading Part 1! Becoming A Full Time Trader…

The Golden Rules of Trading -I

In this series of videos, we will deal with two subjects not much appreciated, less understood, and less valued topics: Evaluating the quality of a trading strategy, and position sizing strategy. We will also discuss the relation between these two important topics.


The Golden Rules of Trading -I

Van K Tharp, in his “Definitive Guide to Position Sizing Second Edition,” states the ten rules of trading. In this article, we will discuss the first four rules, as these should be the basis to succeed in the trading profession, especially when working in a leveraged environment such as in Forex.

1.- Never open a position in any market if you don’t know your dollar risk.

By dollar risk, we mean the dollar amount a trader would lose if the trade goes against him and the stop-loss gets hit. Thus, with this, we assume ALL TRADES will have a stop-loss level. That is mandatory in a leveraged environment.
In Forex, the dollar risk is easily computed with the following formula:

Dollar risk = (Pip distance from entry to stop-loss) * Pip-Lot-value * Position size in lots.

As an example, let’s assume we are going to trade the EURSD, and we have 55 pip distance from entry to stop, and our position size is 15 mini lots. We know that the pip-lot-value = $10, and that 15 mini lots are equal to 0.15 lots. Thus:

Dollar risk = 55 * 10 * 0.15 = $82.5

Knowing the risk of a trade should be vital to any trader.

2.- Define your profit in terms of your risk.

That seems a silly rule, but in fact, it is essential because it helps a trader think in terms of reward/risk ratios. It is easier to know if the trade is a good business or a bad one. A good business is a trade in which the potential loss is smaller than the potential gain. A businessman does not sell below cost. A trader must not accept a trade on which the profit is lower than the cost.

3.- Limit your losses to 1R or less.

This rule is a consequence of the first two. Traders must respect the settings of the trade. Moving or disregarding the stops shows a lack of discipline and also creates random effects in the trading system. This, in turn, makes the system random. That means it is wrong since a random system tends to have zero mean profitability.
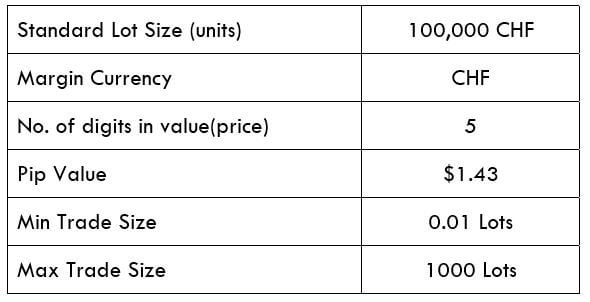
4.- make sure your profits, on average, are higher than your risk.

As stated in point two, it is good business to have profits larger than the assumed risk. Also, thinking about trades with over 2xRisk is a mind state that helps traders to keep their portfolio healthy. Imagine a trader with 10XRisk trades. He can be wrong nine out of ten times and still be break-even. That is the power of the is philosophy. You cannot control the market, but you can control the Reward/risk ratio of your trades.


These four rules can be summarized as the famous golden rule of trading:
Cut your losses short and let your profits run. But even though this is a well-known adage in the trading world, traders usually forget it. That was well studied by Daniel Kahneman and his colleague Dr. Amos Tversky. They called it “prospect theory.” They showed that the natural bias of people under uncertainty conditions is just the opposite: cut gains short and let losses grow.

Categories
Forex Signals

GBP/USD Sideways Channel Breakout – Quick Update on Signal! 

Earlier today, the GBP/USD flashed green and rose from three-week lows to just below mid-1.2400 level following Friday’s upbeat U.K. retail sales figures, which underpinned the British Pound and contributed to the currency pair gains. The broad-based U.S. dollar weakness triggered by the risk-on market sentiment also played a key role in the pair’s bullish trend. The GBP/USD is currently trading at 1.2380, as it has violated the consolidation range of 1.2405 and 1.2456.

At the data front, the U.K. retail sales arrived at +12.0% over the month in May against +5.7% expected and -18.1% previous. The core retail sales stripped the auto motor fuel sales, stood at +10.2% MoM vs. +4.5% expected, and -15.2% prior. Annually, the U.K. retail sales stood at -13.1% in May agianst-17.1% expected and -22.6% previous while the core retail sales also decreased -9.8% in the reported month versus -14.4% expectations and -18.4% previous.

Despite heightened worries about a potential second wave, the broad-based U.S. dollar reported losses on the day, possibly due to optimism about the stimulus packages of most countries. As well as, the latest U.S. jobless claims suggested a further economic recovery, which also boosted the risk-on market sentiment and pushed the USD lower. However, the losses in the U.S. dollar turned out to be one of the key factors that kept the currency pair higher. Whereas, the U.S. Dollar Index that tracks the greenback against a basket of other currencies slipped 0.03% to 97.373 by 12:41 AM ET (5:41 AM GMT).

However, the investors seemed cautious to place any strong position due to the rise in new coronavirus cases as well as geopolitical tensions in Asia, which overshadowed the recent optimism about a sharp V-shaped recovery. It is worth recalling that the previous gain in the currency pair could be associated with the Bank of England’s decision to keep interest rates unchanged at 0.1% and a 100 billion pound increase in the purchase program (Q.E.) line with market expectations.

Looking forward, the traders will keep their eyes on the U.S. Federal Reserve (Fed) Chair J. Powell’s speech due to the lack of significant U.S. economic news. As well as, the virus headlines and US-China updates will be key to watch.


The GBP/USD is trading at a level of 1.2390 as the pair has violated the support level of the level of 1.2410. The odds of selling were pretty solid, and it can lead Sterling to lower towards the next support area of 1.2350 level. The RSI and 50 periods of EMA are suggesting a selling bias today. Therefore, we decided to take a selling position below 1.24092 today.

Entry Price – Sell 1.24092    

Stop Loss – 1.24492    

Take Profit – 1.23692    

Risk to Reward – 1

Profit & Loss Per Standard Lot = -$400/ +$400

Profit & Loss Per Micro Lot = -$40/ +$40

Categories
Forex Course

129. Learning The Concept Of Hidden Divergence

Introduction

In the previous lesson, we discussed regular divergence and its types. In this lesson, we shall continue with the second type of divergence – hidden divergence. The concept of divergence in this type remains the same but differs in the indication it provides.

What is the Hidden Divergence?

In a trending market, the prices make higher highs or lower lows. In addition to that, it sets in higher lows or lower highs as well. When the market prepares to reverse, the lower low or higher high turns to equal high or equal low.  The higher lows or lower highs become the other way round. And in the new leg of the trend, if there is divergence, it is referred to as hidden divergence.

In simple terms, hidden divergence is used to indicate trend continuation in the middle of a trend or typically at the beginning of a new trend.

Types of Hidden Divergence

There are two types of Hidden divergence based on the direction it indicates:

  • Hidden Bullish Divergence
  • Hidden Bearish Divergence

Let’s understand how each of them is formed with examples as well.

Hidden Bullish Divergence

In a downtrend, the market makes lower lows and lower highs. In preparation for a reversal, it leaves a higher low instead of a lower low. Also, there could be a higher high or equal high. In this price action, if there is a lower low in the oscillator, it indicates a hidden bullish divergence. It signals that the price could continue to go north.

In the above chart of AUD/USD, we can see that the market is coming from a downtrend. Later, the market does not hold at S&R to make a new lower low but makes a higher low. Looking at the indicator, it leaves a lower low. Hence, showing divergence and indicating that the market has turned into an uptrend and will possibly continue its move up.

Hidden Bearish Divergence

In the market goes into a transition from an uptrend to a downtrend, the price which was making higher highs now starts to make lower highs. In addition, the oscillator puts in a higher high for the lower high in the price chart. Thus, showing a hidden bearish divergence. It is an indication that the market is going to continue in a downtrend.

In the above chart of AUD/USD, the market was initially coming from an uptrend making higher highs. Later, it turned directions and made a higher low instead of a higher high. But the RSI made a higher high for the same move. Thus, indicating divergence and most probable continuation of the downtrend.

[wp_quiz id=”77847″]
Categories
Forex Assets

Costs Involved While Trading The XBR/USD Asset Class

Introduction

BCO is an acronym for Brent Crude Oil, which is one of the two types of crude oil and is a benchmark for determining the price of oil, along with West Texas Intermediate (WTI) crude oil. BCO is also known by Brent Blend, Brent Oil, and London Brent. It is the benchmark for the majority of the crude oil from the Atlantic basin, which marks for two-thirds of the crude oil price traded internationally. In the market, it is traded with the ticker XBR/USD.

Understanding XBR/USD

Brent Crude is a commodity traded in barrels. The price of XBR/USD depicts the value of the US Dollar for 1 barrel of crude oil. It is quoted as 1 XBR per X USD. For example, if the market price of XBR/USD is 41.42, then it means that each barrel of crude oil is worth $41.42.

XBR/USD Specification

Spread

It is the basic difference between the bid price and the ask price. The spread on ECN and STP account model is as follows:

ECN: 11 | STP: 15

Fee

There is a fee (commission) for every position a trader opens. However, this fee is only on the ECN account, not the STP account.

Slippage

Slippage is the difference between the price intended by the trader and the price given by the broker. It occurs due to two factors:

  • Broker’s execution price
  • The volatility of the market

 Trading Range in XBR/USD

It is the representation of the volatility of the market in different time frames. The table values represent the minimum, average, and maximum pip movements in various time frames. 

Procedure to assess Pip Ranges

  1. Add the ATR indicator to your chart
  2. Set the period to 1
  3. Add a 200-period SMA to this indicator
  4. Shrink the chart so you can assess a large time period
  5. Select your desired timeframe
  6. Measure the floor level and set this value as the min
  7. Measure the level of the 200-period SMA and set this as the average
  8. Measure the peak levels and set this as Max.

XBR/USD Cost as a Percent of the Trading Range

The following are two tables that represent the variation in the fee in terms of a percentage for different time frames. The percentage values are calculated by finding the ratio between the total cost and the volatility values.

ECN Model Account

Spread = 11 | Slippage = 5 | Trading fee = 5

Total fee = Spread + Slippage + Trading fee

Total fee = 11 + 5 + 5 = 21 (pips)

STP Model Account

Spread = 15 | Slippage = 5 | Trading fee = 0

Total fee = Spread + Slippage + Trading fee

Total fee = 15 + 5 + 0 = 20 (pips)

Trading the XBR/USD

Crude oil is a commodity that is rigorously traded in the market. Its volatility and liquidity are comparable to major and minor currency pairs, providing good opportunities for traders to participate in the market. The crude oil prices are driven by various fundamental factors and its Demand and Supply. The reflection of the same is seen on the charts. Thus, traders can apply technical analysis as well to forecast the price movements.

There is a fee on every trade you take with a forex broker. This fee is the same irrespective of the time frame you trade on. So, traders must place themselves in a position that will have a reasonable cost for a sufficient P/L. The trading range and the cost percentage table are the tools for it.

The larger the percentage value, the higher is the relative fee on the trade and vice versa. For example, let’s there are two traders – 1D and 4H trading with the same lot size. The 1D trader places a take profit to 200 pips, while the 4H trader places it at 100 pips. But the fee paid by both the traders is the same. But, seeing the relative fee, the 4H trader pays a higher fee than the 1D trader because his take profit is only 100 pips. Thus, the percentage values are higher in the 1D time frame than the 4H time frame.

There is another scenario where the relative cost changes based on the volatility of the market. In simple terms, the relative fee can vary even if a trader trades in the same time frame. Precisely, the relative fee is higher when the volatility of the market is around the minimum values. Therefore, to balance between the total fee and the P/L, one must trade when the market volatility is above the average volatility, irrespective of the time frame traded.

Categories
Forex Daily Topic Forex Fundamental Analysis

Understanding ‘Electricity Production’ & Its Importance As A Forex Fundamental Driver

Introduction

Electricity is the most versatile and controlled form of energy. It is non-polluting and loss-free. It can be produced entirely using renewable methods, such as wind, water, and sunlight. Electricity is weightless, more comfortable to transport and distribute, and represents the most efficient way of consuming energy. Strategies are being developed to generate and use electricity in the most efficient way. It must be produced in the least damaging way, without inhibiting economic development.

Net power generation

The total worldwide production of electricity in 2016 was 25,082 TWh. Sources of electricity were coal 38.2%, natural gas 23.1%, hydroelectric 16.6%, nuclear power 10.4%, oil 3.7%, solar 5.6%, biomass and waste 2.3%.

Choosing the mode of production 

The selection of electricity production mode and their economic viability is linked with the demand and supply in that region. The dynamics vary considerably around the world, resulting in different selling prices across the globe; for example, the price in Iceland is 5.54 cents per kWh while in island nations, it is 40 cents per kWh. Hydroelectric plants, thermal power plants, nuclear power plants, and renewable sources have their pros and cons, and selection is based on the local power requirement and fluctuations in demand. All power plants have varying loads on them, but the daily minimum is baseload, often supplied by plants that run continuously. Nuclear, coal, gas, oil, and some hydro plants can supply baseload.

Due to the advancement in technology, renewable sources other than hydroelectricity experienced decreases the cost of production, and the energy in many cases is cost-comparative with fossil fuels. Many governments around the world are allocating funds to offset the higher cost of new power production and make the installation of renewable energy systems economically feasible. However, their use is curtailed by their intermittent nature, less demand, and sometimes transmission constraints.

Economic development and electricity

Electricity is a major contributor to the economic development of a nation. It is the wheel that drives most aspects of everyday life in society. A nation is a compilation of activities and people whose progress is determined by the infrastructural components. Electricity is the source of fuel for almost all sectors of the economy. Most of our daily activities are dependent on electricity, our hospitals need electricity for various purposes, and airports need electricity for regular functioning and ensuring the safety of passengers.

When so many activities are dependent on electricity, production of the same is very important for every nation’s economic development because it brings investment opportunities for the country. In a country where electricity production is more, investors get interested because the cost of production in such a country is minimal compared to where there is no electricity. Running machines on electricity is cheaper compared to running them on generators. High electricity production helps to reduce the mortality rate in the country because the hospitals will be efficiently powered and is a key factor in service delivery at hospitals.
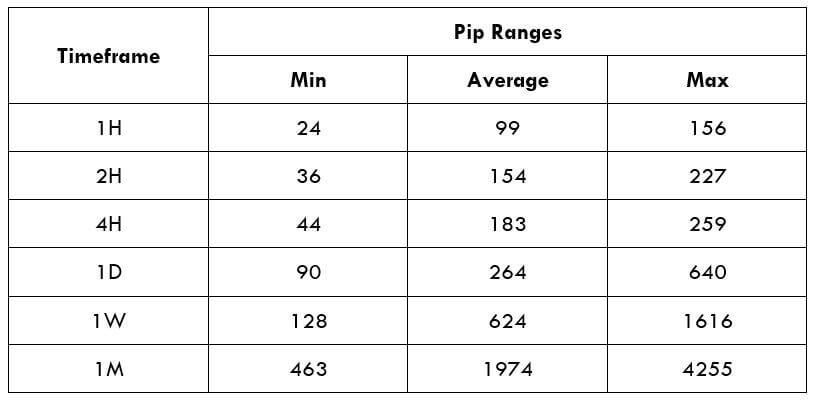
In countries with good electricity production, agricultural productivity is also high because electricity can help in powering irrigation, food preservation, and seed preservations. They enable the country to have fewer damages to agricultural products because they can be kept in storage facilities, and wastage can be avoided.

Impact on currency

Although electricity production is an important sector of the economy and a vital component, it may not have a direct impact on the value of a currency. The effect of shortage in electricity is first felt on the company, which will be reflected in its quarter-quarter data. If the results are bad, one can analyze the impact of electricity on the numbers and the stock price. If the industry itself is suffering, it primarily impacts the stock market and not the currency value. Hence, we can say that the impact of electricity is minimal on the value of a currency where investors, too, do not give much importance to this data.
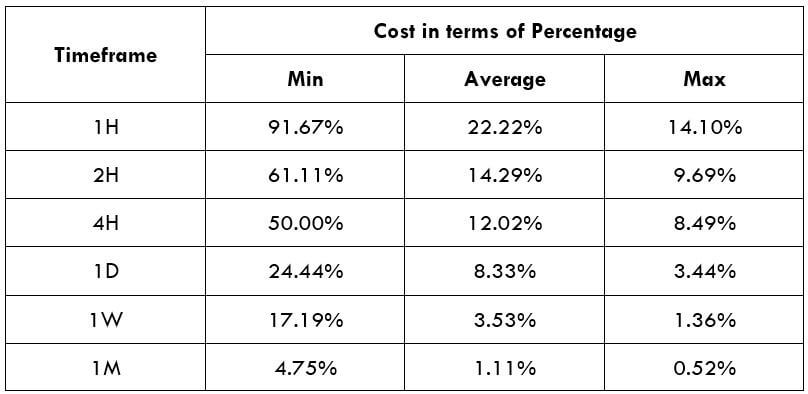
Sources of information on Electricity Production

Economists and investors have not keenly tracked the electricity production data, so not many economic websites and newspapers publish the data regularly. The country’s electricity board is the official source of the data from where reliable figures can be obtained. However, we were able to collect the data on the electricity production of a few countries that can be used for reference and comparison.
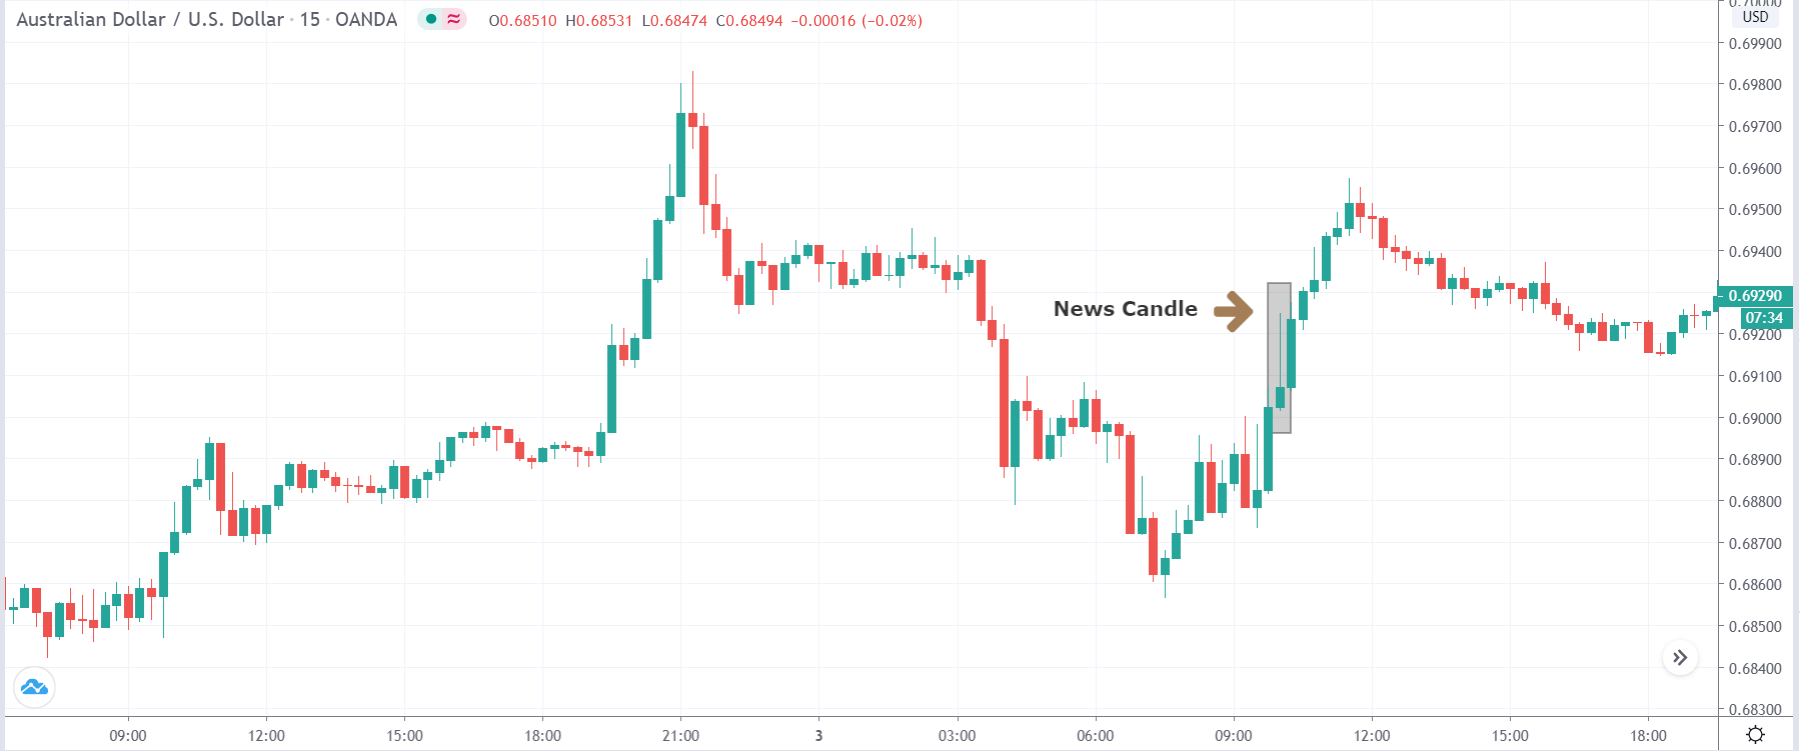
GBPAUDUSDCADNZDJPY

High levels of electricity production improve the standard of living of the people in the country. This is very important for the economic advancement of a country. If people live in better conditions, it has ripple effects on every aspect of the country. It reduces unnecessary expenditures for the government. It improves the security of the country and helps to create job opportunities for the entire country because the indirect sectors use electricity to power their businesses. Development can only be realized when the key drivers of the economy are unhindered by the country’s lack of infrastructural components.

Impact of Electricity Production’s News Release On The Forex Market

In the previous section of the article, we comprehended the Electricity Production economic indicator and saw it’s economic importance. We shall extend our discussion and understand the impact of the Electricity Production news announcement on various currency pairs.

It is important to note that although electricity is needed for the economic development and well-being of citizens, it is not a crucial fundamental indicator. Therefore, investors and traders do not invest based on Electricity Production data. However, let us find out the impact on a few currency pairs on the day of the announcement.

The below image shows total Electricity Production in the United Kingdom, where it increased to 29731 in Gigawatt-hour in December from 28902 Gigawatt-hour in November of 2019. Let us see how the market reacts to this data.

GBP/USD | Before the announcement

We will begin our analysis with the GBP/USD currency pair and observe the change in volatility due to the news announcement. The above image shows the daily time frame chart of the currency pair before the news announcement. We see that the market has been moving in a ‘range,’ and currently, the price is almost at the top of the ‘range.’ Aggressive traders can take ‘short’ positions with a large stop-loss, as there can be volatility in the pair during the news announcement.

GBP/USD | After the announcement

After the news announcement, the price hardly makes a move and stays at the same place as it was before. There is no change in the volatility, as indicated by the ‘news candle.’ The market continues to move higher on subsequent days and breaks out from the ‘range.’ The move should not be considered as a result of news but instead was a technically driven move. Now traders should trade this currency pair using their breakout strategy.

GBP/CAD | Before the announcement

GBP/CAD | After the announcement

The above images represent the GBP/CAD currency pair, where we see that the market is in a strong uptrend before the news announcement and recently has been sideways. We should not expect major volatility in the pair. Technically speaking, we will be looking to go ‘long’ in the market after a suitable price retracement to the nearest support or demand level.

After the news announcement, the market moves higher by little, and volatility expands to the upside. We could say that since the Electricity Production data was slightly positive for the British economy, traders bought the currency after the news announcement and raised its value. At this point, we cannot take any trade as there is no formation of an appropriate continuation pattern in the market.

GBP/CHF | Before the announcement

GBP/CHF | After the announcement

The previous images are of the GBP/CHF currency pair, where we see that before the news announcement, the market is in a strong uptrend, indicating a great amount of the strength in the British Pound. Here too, the idea is to go ‘long’ in the market after a price retracement to a key technical level. The price seems to have broken out a small ‘range.’ Thus, we cannot take any position in the market at this point.

After the news announcement, the market instantly drops, and the prices move lower. The news data had a negative impact on the currency pair, where volatility increases to the downside. As the Electricity Production data does not have a long-lasting effect on the currency, the fall in price due to the release of the news can be an opportunity for joining the uptrend.

We hope you find this article informative. Let us know if you have any questions in the comments below. All the best.