Fundamental Analysis For Novices – Average Hourly Earnings
Thank you for joining the fundamental analysis for novices’ educational video. This time we will be looking at.
Hopefully, you will be reviewing all the fundamental analysis for novices videos in this series of educational videos.

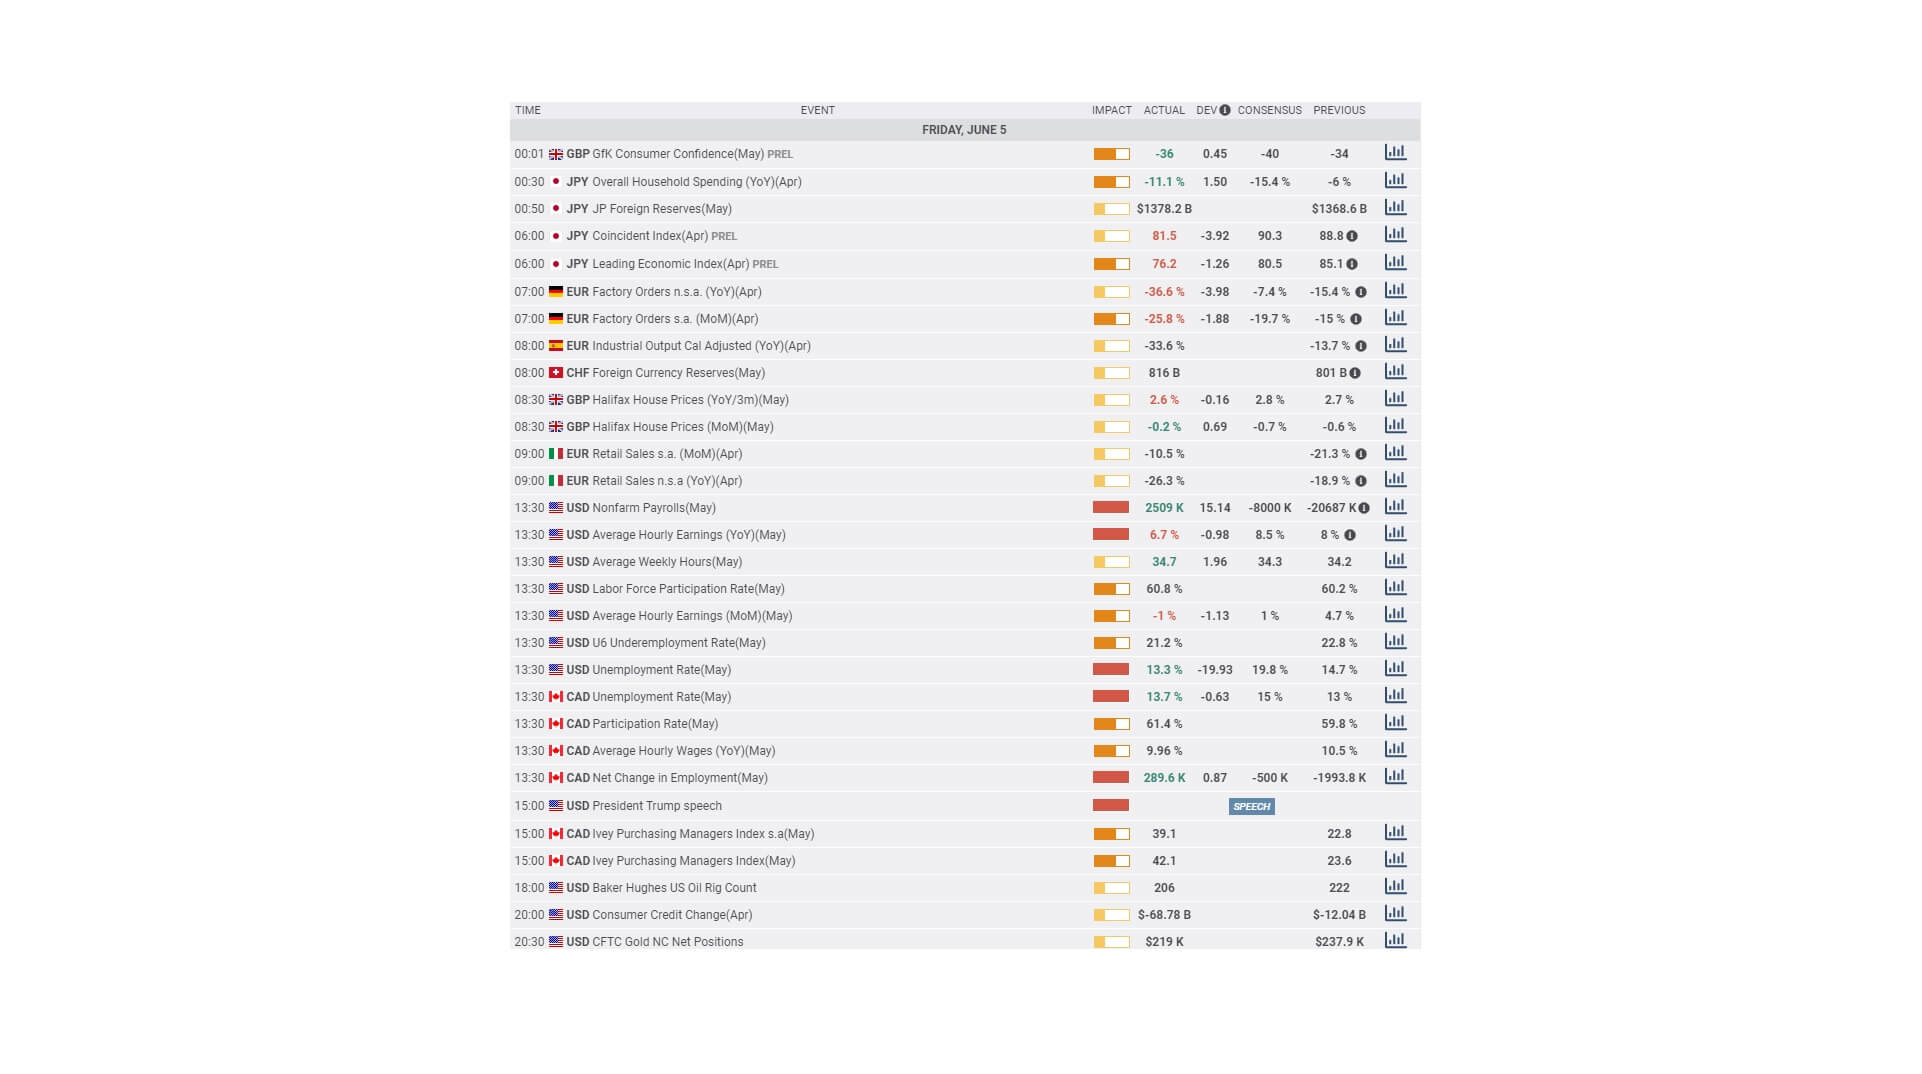
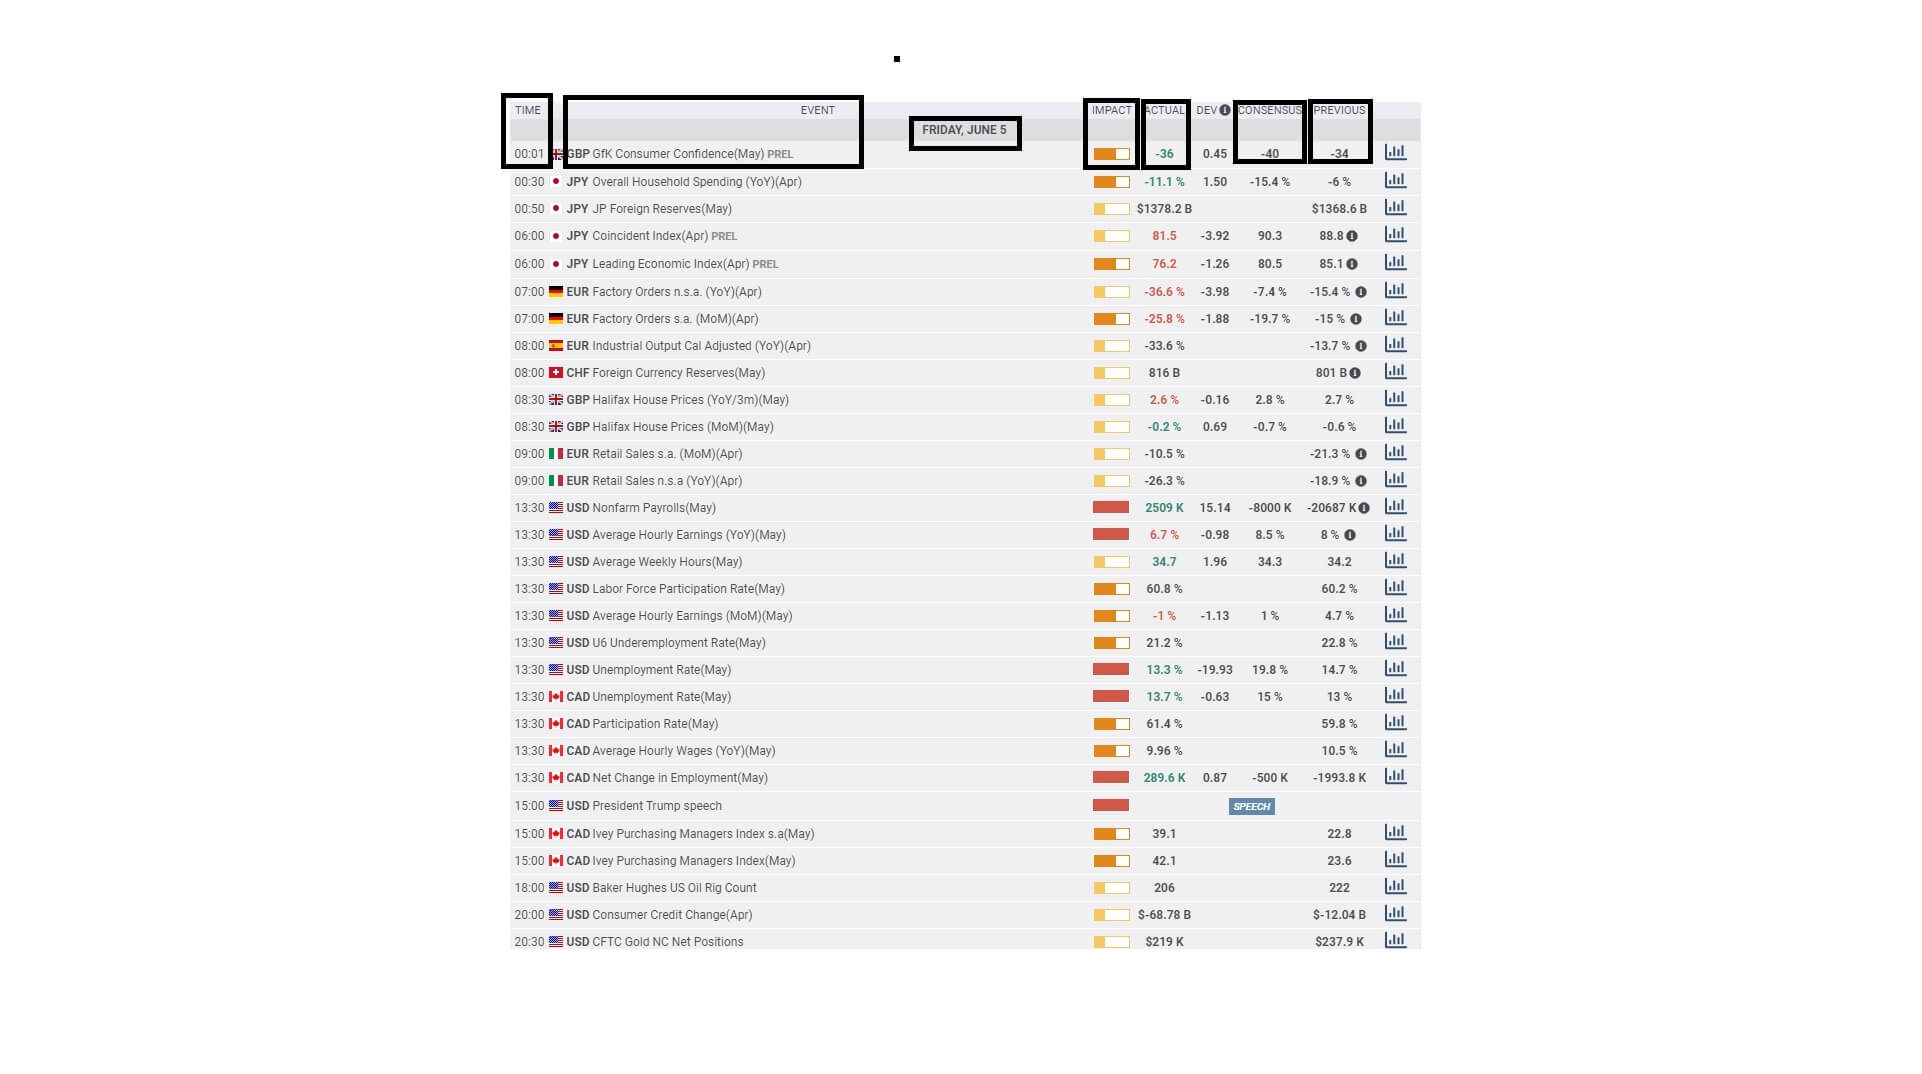
Professional traders regularly refer to an economic calendar, such as this one, which is provided by most brokers. Use it as a tool to plan your trades, and most importantly, use it as a facility to tell you when not to trade via expected volatile periods in the market, which potentially follow high impact or high importance regarded data releases.

The key information that you need to take particular attention to is the time of the event, the economic event itself, the day and date, the impact level, which typically comes as low, medium, and high, the actual economic data release as listed at the time of the event, which is usually subject to an embargo, and before this, pay particular attention to the general consensus of what the actual figure might be. This is put together by leading economists and market analysis. Also, pay attention to the previous release of this data.

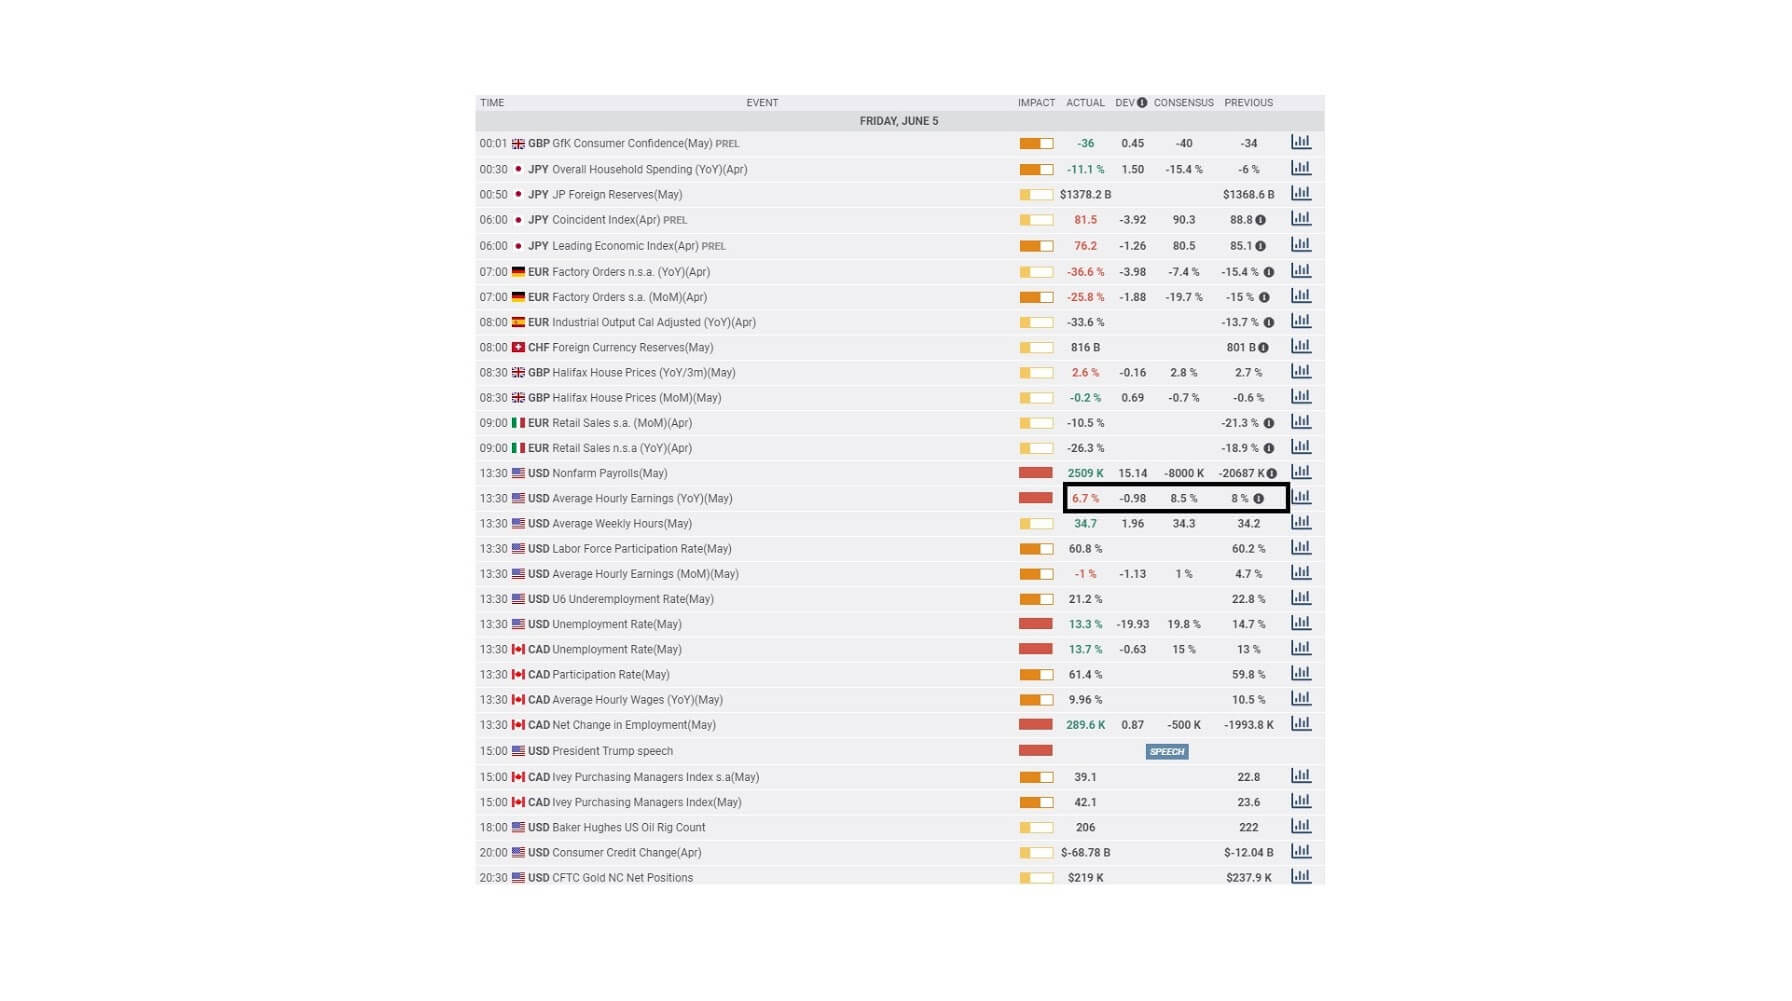
In this video, we are looking at average hourly earnings, year on year, for May 2020. This data is typically more important within the United States and has a maximum impact value. It is always released on the first Friday of each month, along with the non-farm payrolls.
This particular session of releases he’s very widely anticipated by the markets because it gives a clear picture of the economic conditions for the United States, which is one of the biggest economies in the world.
The data is released by the US Bureau of Labor Statistics. It reflects labour cost inflation and throws light on the conditions of the Labour market. The board of the Federal Reserve uses this as a leading indicator when setting interest rates, along with the unemployment figures.

Here we can see that the average hourly earnings figure for May came in at 6.7%, which was below the consensus value of 8.5% and below the previous figure of 8% for April. The deviation is also shown as -0.98%.
A higher reading would have been positive or bullish for the USD, while this reading is negative or bearish for the USD.
This is why it is always imperative to wait until the market has analysed all of the data, including average hourly earnings before you jump in and start trading purely on the non-farm payrolls figure only.
Tread cautiously and wait for a trend to begin and then join that in either direction. When trading this data always expect the unexpected because the market can become extremely volatile post data release.


