Categories
Forex Fundamental Analysis

What Is ‘Inflation Rate’ & Why Is It One Of The Most Important Fundamental Indicators?

Introduction

Based on the current inflation rate and future monetary policies, we can effectively gauge the current economic situation of a country. Using the Inflation rate data, we can also get an insight into the current currency’s value and in which direction the economy is heading towards. Hence we must look at this key indicator in its depth to solidify our fundamental analysis.

What is Inflation?

In Economics, Inflation is the increase in the prices of goods & services, and the resultant fall in the purchasing power of a currency. What this means, in general, is that when a country experiences Inflation, the prices of the most commonly used goods & services by the citizens of a country increase. Because of this, the average person has to spend more money to buy the same amount of goods which cost less in the previous period.

For instance, if John went to a grocery store to purchase his monthly groceries, and it cost him 100$ in 2018. Next year, i.e., in 2019, John goes to the same store to buy the same set of goods, and it had cost him 105$. Now John either has to remove some items or pay more to make the same purchase. Here John has experienced Inflation of 5%.

What is Inflation Rate?

The percentage increase in the price of goods & services over a period (usually monthly or yearly) is called the Inflation Rate. In our previous example of John, we see we have an inflation rate of 5%.

Inflation Rate is compounding in nature, i.e., it is always calculated with reference to the most recent statistic and not any particular base year or a base inflation rate. For example, if John were to buy the same goods in 2020, if it costs him 110$, then John has experienced 4.54% of Inflation and not 10% inflation.

Why is Inflation Rate important?

Inflation, in general, when kept in check, is good for an economy as it fuels growth. The increase in the prices of common goods and services means people have to compete and work better to earn more to meet their needs. But as in any case, excess or high Inflation can be crippling for an economy.

Because the citizens of the country get poorer when the purchasing power of the currency falls due to a high increase in prices, inflation Rates can be used to gauge the current financial health of an economy and what the citizens of a country are currently experiencing.

How does Inflation Occur?

A general view in the economic sector is that steady Inflation occurs when the money supply in the country outpaces economic growth. It means more currency is being circulated into the economy than its equivalent activity (revenue-generating practices). Inflation occurs mainly due to the rise in prices. But in brief, Inflation can occur due to the following situations:

Demand-Supply Gap: When the demand for a particular good is higher than the supply or production of the same, then there is a natural surge in the price of that good.

Increased Money Supply: When more money is in circulation in the economy, it means an individual has more disposable cash. This increases consumer spending due to a positive future sentiment resulting in increased demand, which ultimately increases the price of goods.

Cost-Push Effect: When the cost of inputs to the process of manufacturing good increases, it coherently increases the overall cost of the finished good. This results in a higher selling price of goods, which ultimately results in Inflation.

Built-In: Built-in inflation happens when there is a sort of feedback loop in the prices of goods and incomes of people. As people demand higher wages to meet the needs, it results in higher prices of goods and services to fund their demand and vice-versa. This adaptive price and wage adjustment automatically feed off each other and result in an increase in prices.

How is Inflation measured?

Based on different sectors, the costs of different sets of goods & services are used to calculate different inflation indexes. However, there are some most commonly used inflation indices in the market, like the Consumer Price Index (CPI) and Producer Price Index (PPI) in the United States.

Consumer Price Index (CPI): The Bureau of Labor Statistics (BLS) surveys the prices of 80,000 consumer items to create the Index and publishes it on a monthly basis. It is a measure of an aggregate price level of most commonly purchased goods and services like food, shelter, clothing, and transportation fares. Service fees like water and sewer service, sales taxes by the urban population, which represent 87% of the US population, are weighted into the percentage, based on their importance in terms of need.

Changes in CPI are used to ascertain the retail-price changes associated with the Cost of Living, and hence it is used widely to assess Inflation in the USA. In this Index, there are many subcategories wherein certain goods are either included or excluded to give a more accurate picture of Inflation in absolute or relative terms. For example, Core CPI strips away food, gas, and oil prices from the equation whose prices are volatile in nature.

Producer Price Index (PPI): It measures the average change in the selling prices received by domestic producers for their output over a period of time (usually monthly). Unlike CPI, which measures retail prices from the viewpoint of end customers who purchase the items, PPI measures the prices at which goods and services are sold to outlets from the manufacturer. PPI measures the first commercial transaction, and hence it does not include the various taxes and service costs that are associated and built into the CPI.

PPI vs. CPI

PPI measures the change in average prices that an initial-producer or manufacturer receives whilst CPI estimates the change in average prices that an end-consumer pays out. The prices received by the producers differ from the prices paid by the end-consumers, on the basis of a variety of factors like taxes, trade, transport cost, and distribution margin, etc.

Sources of Inflation Indexes

The US Bureau of Labor Statistics releases all the above-mentioned indexes here:

Consumer Price Index | Producer Price Index 

Inflation Rates of some of the major economies can be found below.

United Kingdom | Australia | United States | Switzerland | Euro Area | Canada | Japan 

How ”Inflation Rate” News Release Affects The Price Charts?

In this section of the article, we shall find out how the Inflation rate news announcement will impact the US Dollar and notice the change in volatility after the news is released. As discussed above, CPI is a well-known indicator of Inflation as it measures the change in the price of goods and services consumed by households. Therefore, the data which we should be paying attention to is the CPI values and analyze its numbers. We can see that the Inflation Rate does have a high impact on the currency of the respective country.

Below, we can see the month-on-month numbers of CPI, which is released by the US Bureau of Labor Statistics. The data shows that the CPI was increased by 0.1% compared to the previous month, which is exactly what the analysts forecasted.

Now, let’s see how this news release made an impact on the Forex price charts.

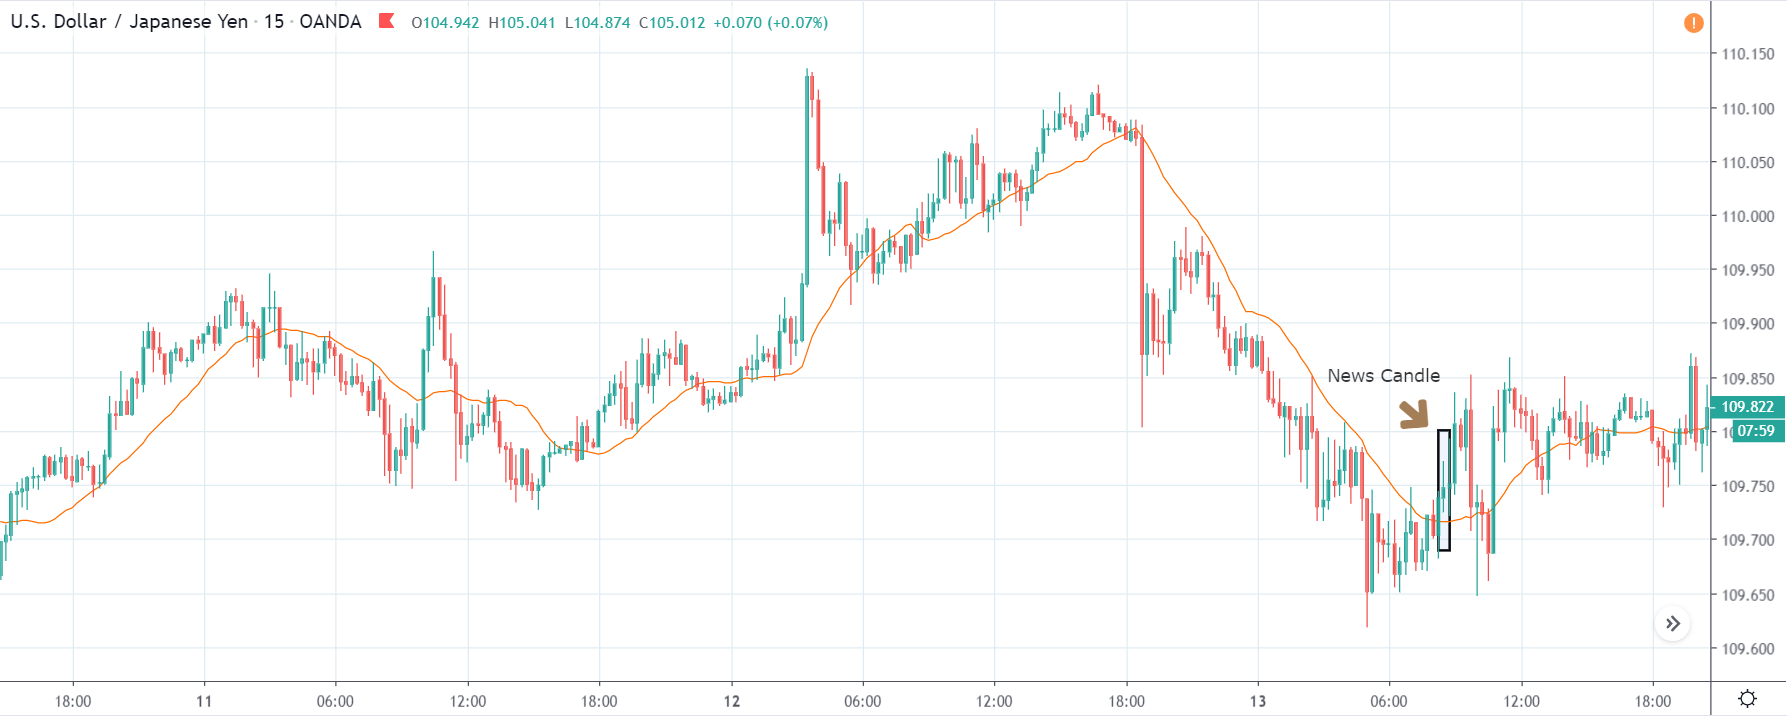
USD/JPY | Before The Announcement - (Feb 13th, 2020)

On the chart, we have plotted a 20 ”period” Moving Average to give us a clear direction of the market. From the above chart, it is clear that the US Dollar is in a strong downtrend, which is also evident from the fact that the price remains below the ”Moving Average” throughout. Just before the news announcement, we see a ranging action, which means the market is in a confused state.

Now we have two options with us, one, to ”long” in the market if there is a sudden large movement on the upside and, two, to take advantage of the volatility in either direction by trading in ”options.” We recommend to go with the first option only if you have a large risk appetite, else choose the second option by not having any directional bias. Let us see which of the above options will be suitable after the news announcement is made.

USD/JPY | After The Announcement - (Feb 13th, 2020)

After the CPI numbers are announced, we see that the price does not go up by a lot, and it creates a spike on the top and falls below the moving average. It is very apparent that the news did not create the expected volatility in the above currency pair. From the trading point of view, in the two options discussed above, the first one is completely ruled out as the market did not show a strong bullish sign, and if we had gone with the second option, we would land in no-loss/no-profit situation.

The reason for extremely low volatility after the news announcement can be explained by the fact that the CPI numbers were merely increased by 0.1%. Since an increase in CPI is positive for the US Dollar, the market does not fall much and continues to hover around the same price.

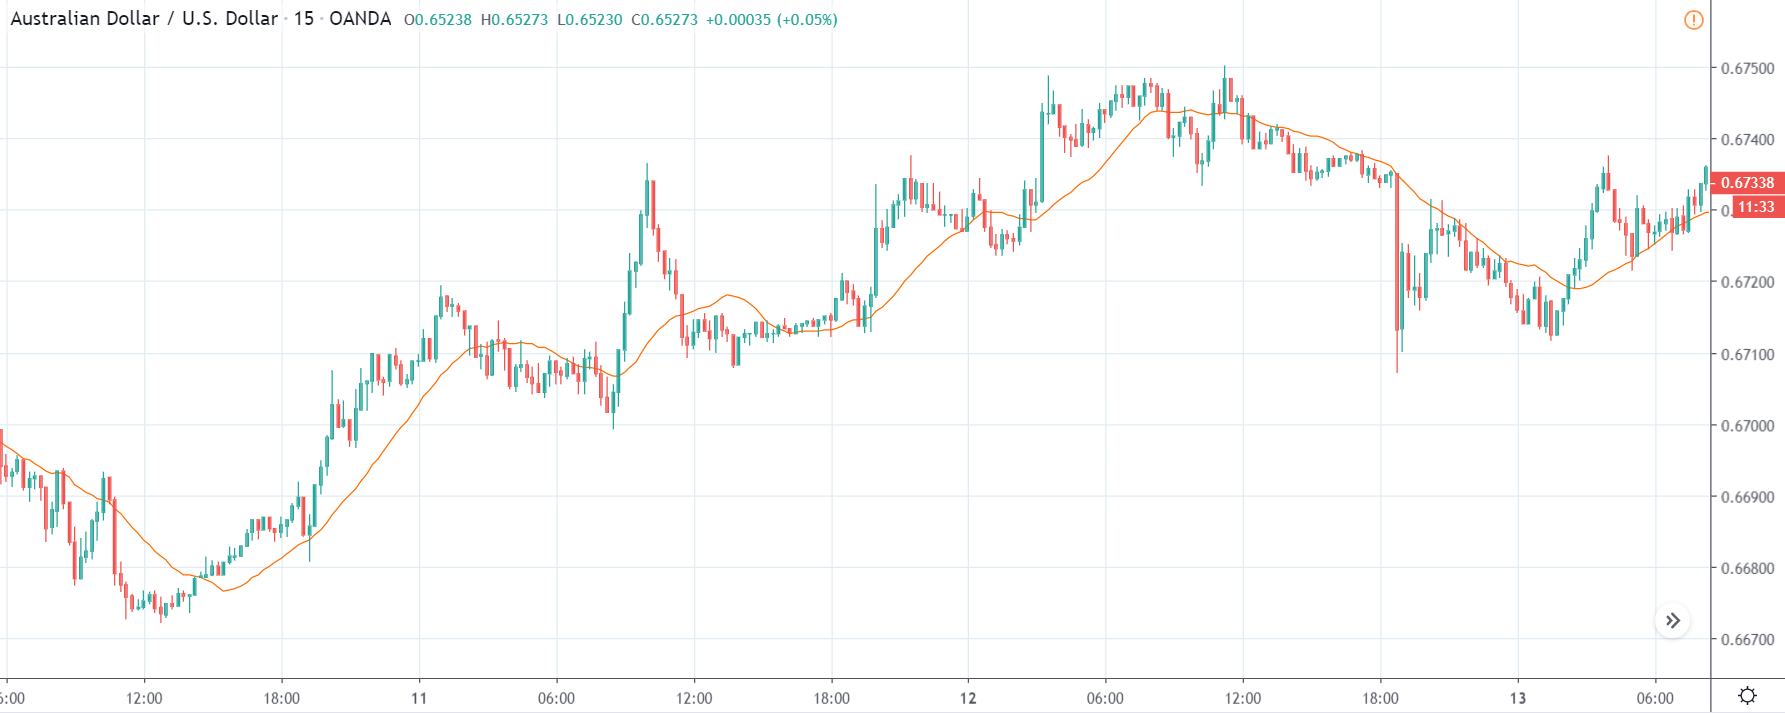
AUD/USD | Before The Announcement - (Feb 13th, 2020)

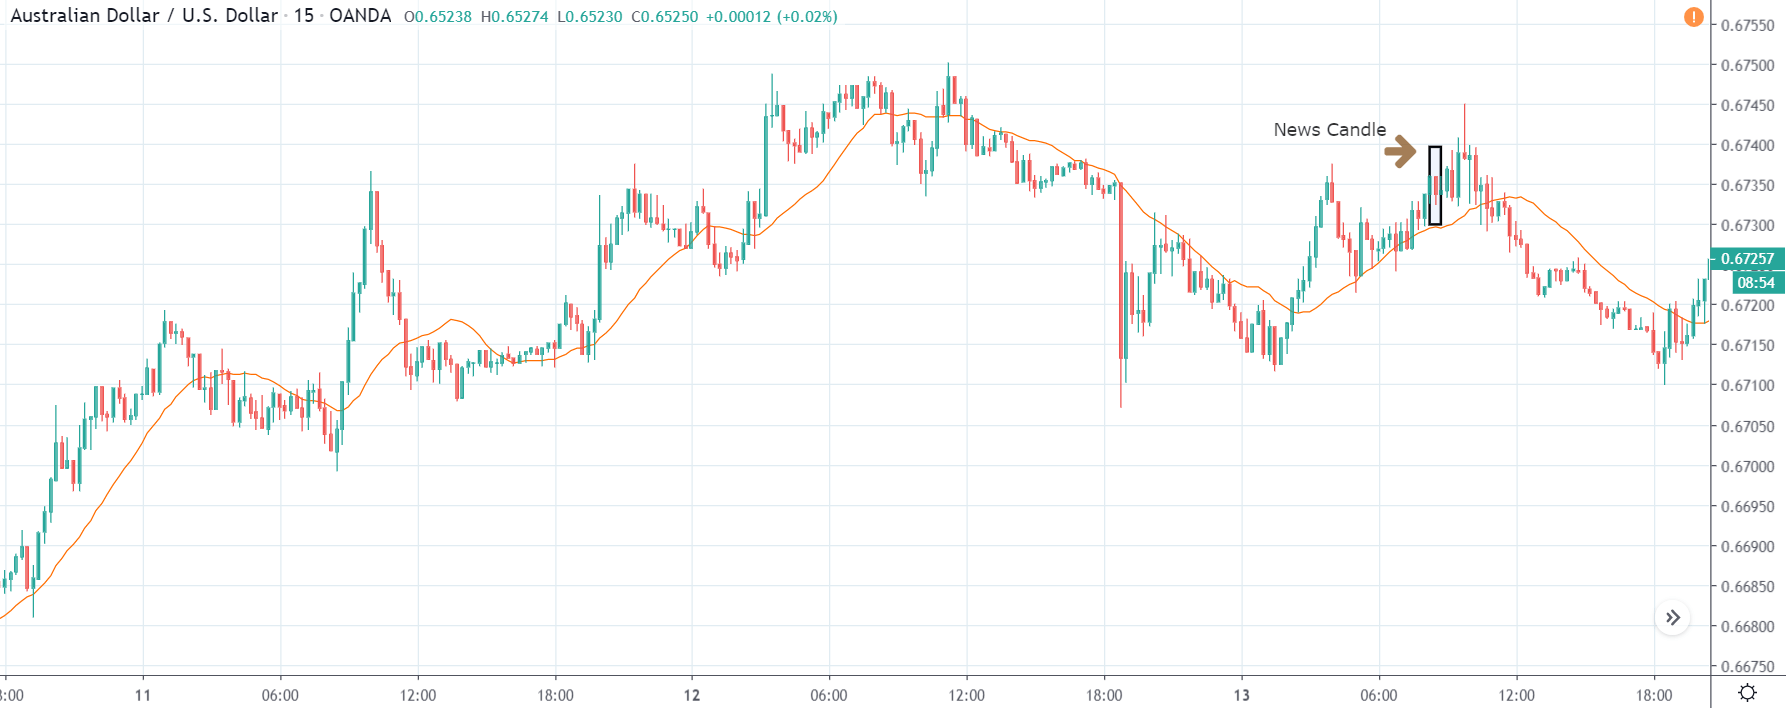
AUD/USD | After The Announcement - (Feb 13th, 2020)

The above charts represent the currency pair of AUD/USD. Here since the US dollar is on the right side, we should see a red candle after the news release since the CPI data was good for the US dollar. By looking at the reaction of the market, we can say that the volatility did increase after the news announcement, which means AUD/USD proved to be better compared to USD/JPY.

A mere rise in the CPI number was good enough for the currency pair to turn into a downtrend from an uptrend. One can also see that the price goes below the moving average indicator. This means that the Australian Dollar is a very weak pair compared to the US dollar, the reason why the US dollar became so strong after the news release. Hence one can take a ”short” trade in the currency pair after the price breaks the MA line.

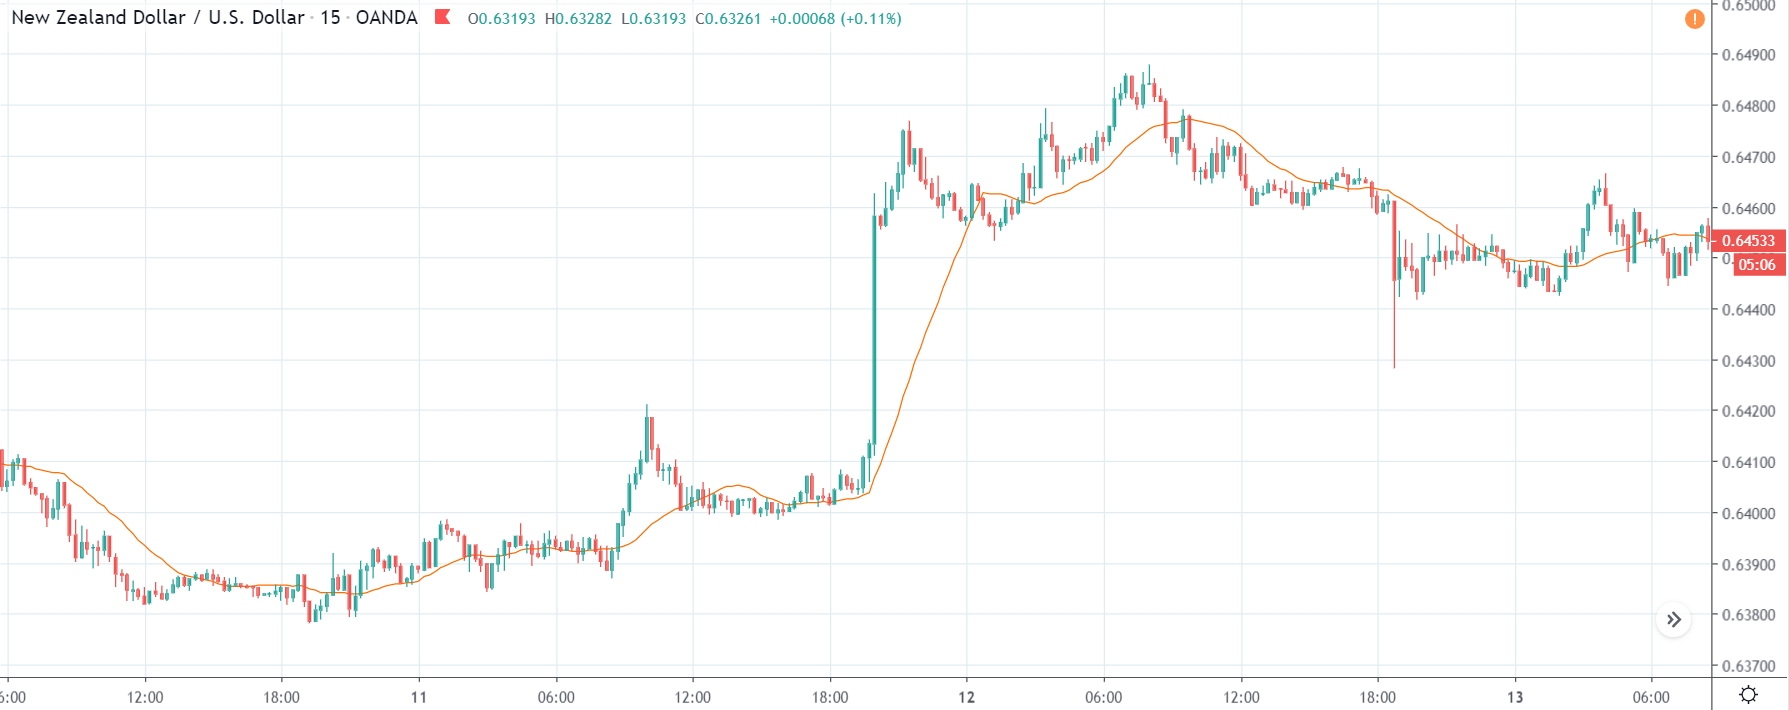
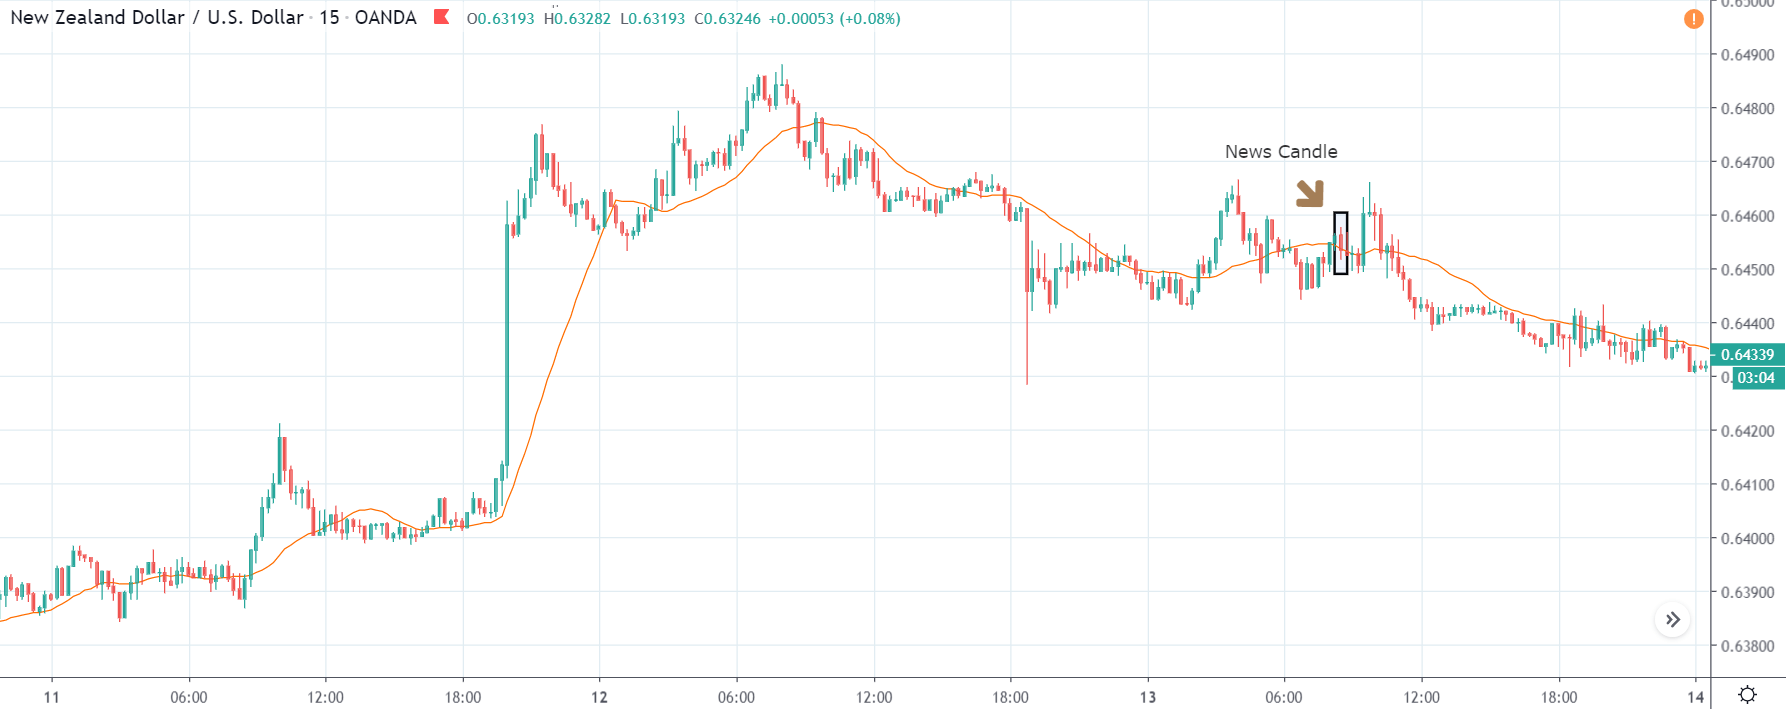
NZD/USD | Before The Announcement - (Feb 13th, 2020)

NZD/USD | After The Announcement - (Feb 13th, 2020)

The above charts represent the currency pair of NZD/USD. It shows similar characteristics as that of the AUD/USD pair before and after the news announcement. The CPI data caused the US dollar to strengthen against the New Zealand dollar, where the volatility change can be seen when the market turns into a downtrend.

The CPI data did have a positive impact on the currency pair, but the pair did not collapse. This means the data may not be very positive against the New Zealand dollar, where the price just remains on the MA line after news release and does point to a clear downtrend. Hence, all traders who went ”short” in this pair should look to take profits early in such market conditions as the market can reverse anytime.

That’s about Inflation Rates and its impact on some of the major Forex currency pairs. If you have any queries, please let us know in the comments below. Cheers.

Categories
Forex Psychology

Trading Psychology -Are you a Trader?

What defines you as a trader? What is the secret ingredient that makes an ordinary person a trader?

Dr. Van K. Tharp, in his first Peak Performance, tells the story of Jack, a wannabe trader that, after more than ten years losing money in the markets he discovered a trader who had made consistent profits in the markets for 30 years. This great trader was willing to teach him if he was committed to learning how to trade properly.

Jack told him he wanted to be a trader, and he understood he, the old trader, was willing to teach how to do it.

The trader said, “yes, I’ll teach anyone, but most people are not fit to learn. All I ask is to do what I tell them to. Many people say he will, but most of them don’t even finish his first assignment.”

Jack told him about his failures and his inability to follow supposedly successful systems that somehow it didn’t work for him. Then, he asked the old trader about his secret to success.

“I am a trader,” told Jack.

“I know it, said Jack, but what is the secret?”

“I have told you: I am a Trader. You are a game player. When you’re fully committed to becoming a trader, you’ll understand. Are you really entirely committed to become a trader?”

Commitment

Commitment means a person is focused on and putting all efforts to accomplish a goal. To show you the difference between commitment and lack of it lets us understand the following cases:

  • Case 1 A Trader made a profit in the market but did not follow his strategy rules.
  • Case 2 A trader entered a position with his system but is continually fearing the market will move against him
  • Case 3 A trader has subscribed to a signals service supplied by a successful trader but, somehow, he cannot trust them, so he cherry-pick them.

Contrast these cases with the following ones:

  •  Case 4 A trader made a profit strictly following his trading strategy.
  • Case 5 A trader entered a position not knowing the outcome of the trade, but being sure his system will make him money each month if he followed the rules of the strategy.
  • Case 6 A trader is entering all the trades the signal service provides, because he trusts the service, and records all trades for analysis purposes.

We can clearly see the contrast between cases 1-3 and cases 4-6. In the first case, the trader felt unsure, and we see there was an inner conflict between what he should do and that he felt. In the last cases, the trader was in sync with the method. There was no conflict between theory and practice.

According to Dr. Van K. Tharp, conflict is the result of people being fragmented internally. The different parts that make the personality of a person trying to accomplish particular positive purposes by following certain primary behaviors. Not all of these responses are congruent; thus, they push the person towards different directions. For instance, a role that supports a trade decision might be in conflict with the inner part of the trader that tries to avoid risk.

Obstacles to Success

Traders think that to trade successfully is as simple as knowing when to enter and exit. The issue is, when they realize that having always winning trades is not possible, they find two main obstacles: 

  • Not reaching the profits they wish, or 
  • Try to avoid losses. In fact, both issues are related. 

When a person tries to avoid losses, she holds into the loss hoping it the price will reverse and come to his favor. Then when a small paper profit shows, she closes it at once on fear the price would reverse and become a loss. Finally, she is cutting profits short and let losses run, which is a recipe for disaster.

The truth is in there

The real problem lies inside the trader’s head. People tend to avoid working on themselves, as it’s too uncomfortable, so they shift their problems and blame the market. For example, people seldom record their trades for later analysis. Therefore, they are not sure if the system fails or is himself. Then, they have second thoughts about every trade, so they cherry-pick the trades.

Also, they don’t use predefined targets or stop-loss levels, so they decide to stay or get out of the trade solely based on his inner feelings. Thus, in the end, they succumb to their biases. What’s worse, his system is totally random on entries and exits. Finally, since they do not register their trades, there is no way to know the properties of his system or devise ways to optimize it on entries, take-profits, and stop-loss settings.

The end of it is, the trader will doubt or quit the system after a perfectly normal losing streak because he lacks the information needed to verify if the current performance of the strategy is normal or not.

Winning and losing

Many people that are attracted to the markets by their huge potential profits don’t accept losing. But, the reality is there is no sure system to trade the markets. There is an element of chance or risk; thus, some trades will inevitably be losers, and traders have to accept losing. If a person wants to only win, the markets are not the place to be. To be successful, there is no need to be right all the time. Not even 50% of the time. A scientist may spend five years in the lab doing unsuccessful experiments until the last one pays and discovers something worth all the effort and time. A trader may be successful just one every five trades and be entirely successful. In the trading job, a winning rate and Reward-to-risk ratio combination is the key to success. 

Developing Commitment

According to Dr. Van K. Tharp, developing commitment is a three-step process.

 Step 1

Determine your own obstacles. List them on a document. If you’re not sure about them, keep a diary of your trades, reviewing it every week. Look for the obstacles you are encountering.

Step 2

Analyze every obstacle and try to see what is going on in your mind, what is the common element. Not taking losses? Cherrypicking trades? Taking profits too early? Not keeping your diary properly?. Do some inner research, try to find out what’s inside your head. Doubt, fear, unsure about your strategy?

Step 3

This step has to do with dealing with whatever is inside you that is sabotaging your trades. You must make peace with your obstacles. One way to deal with them, says Dr. Tharp, is to go to the extremes. For instance, if your problem is with losses, imagine taking a huge loss. As you keep doing this exercise, you will find it easier to cut your losses soon.

You should find the parts of your mind that are key to the conflict and negotiate between the parts, to spot behaviors that could fit both parts in conflict.


Further reading: Peak Performance Course Book 1 – How to use Risk, Van K. Tharp


Categories
Forex Assets

Analyzing The Costs Involved While Trading The EUR/DKK Forex Pair

Introduction

The Euro Area’s euro against the Danish Krone, in short, is written as EURDKK. This is an exotic pair in the forex market. Typically, this pair is traded with low volumes. Here, EUR is the base currency, and DKK is the quote currency.

Understanding EUR/DKK

The current market price in the exchange of this pair depicts the value of Danish Krone equivalent to one euro. It is simply quoted as 1 EUR per X DKK. For example, if the current value of EURDKK is 7.4702, then about 7.5 DKK are required to buy one euro.

EUR/DKK Specification

Spread

In the foreign exchange market, spreads are the primary source through which brokers make money. They set a different price for buying and a different price for selling the same currency pair. This difference is referred to as the spread. This spread varies from broker to broker and also from the type of execution model used.

Spread on ECN: 40 pips | Spread on STP: 42 pips

Fee

This fee is the same fee is paid to the stockbrokers. In other terms, this is the commission that is paid to the broker. The fee on ECN accounts is between 5-10 pips, while it is nil on STP accounts.

Slippage

The difference between the price at which the trader executed the trade and actual executed price is called the slippage on the trade. This happens only on market orders, due to two reasons – Market volatility & Broker’s execution speed

Trading Range in EUR/DKK

As the name partially suggests, the trading range is a range of pip movements in a currency pair in different timeframes. Pip movement is also referred to as the volatility values. These values are extremely helpful in figuring the gain/loss that can be made on a trade.

Procedure to assess Pip Ranges

  1. Add the ATR indicator to your chart
  2. Set the period to 1
  3. Add a 200-period SMA to this indicator
  4. Shrink the chart so you can assess a large time period
  5. Select your desired timeframe
  6. Measure the floor level and set this value as the min
  7. Measure the level of the 200-period SMA and set this as the average
  8. Measure the peak levels and set this as Max.

EUR/DKK Cost as a Percent of the Trading Range

The total cost of the trade is determined by summing up the slippage, spread, and the trading fee. And this cost is not fixed. It varies based on the volatility of the market. Below is the tabular representation of the cost variation, which is signified in percentages.

ECN Model Account

Spread = 40 | Slippage = 3 | Trading fee = 3

Total cost = Spread + Slippage + Trading Fee = 40 + 3 + 3 = 46

STP Model Account

Spread = 42 | Slippage = 3 | Trading fee = 0

Total cost = Spread + Slippage + Trading Fee = 42 + 3 + 0 = 45

Note: The costs may seem significantly high because of the Spreads. As we know, these Spreads keep changing from time to time. At times we have seen the spreads for this pair being as low as 12. But we have considered maximum spread to give you the maximum cost percentages.

The Ideal way to trade the EUR/DKK

Trading the EURDKK is different from trading the major/minor currency pairs. And this can be easily figured out from the percentage values.

From the table, we can infer that the percentage values are extremely high on the 1H, 2H, and 4H timeframes. This means that the costs in these timeframes are super-high. Hence, trading this pair on these lower timeframes is a bad decision.

However, if we look at the next three rows (1D, 1W, and 1M), we can see that the percentage values are significantly lower than the above values. Hence, this makes this pair tradable on the daily, weekly, and monthly timeframes.

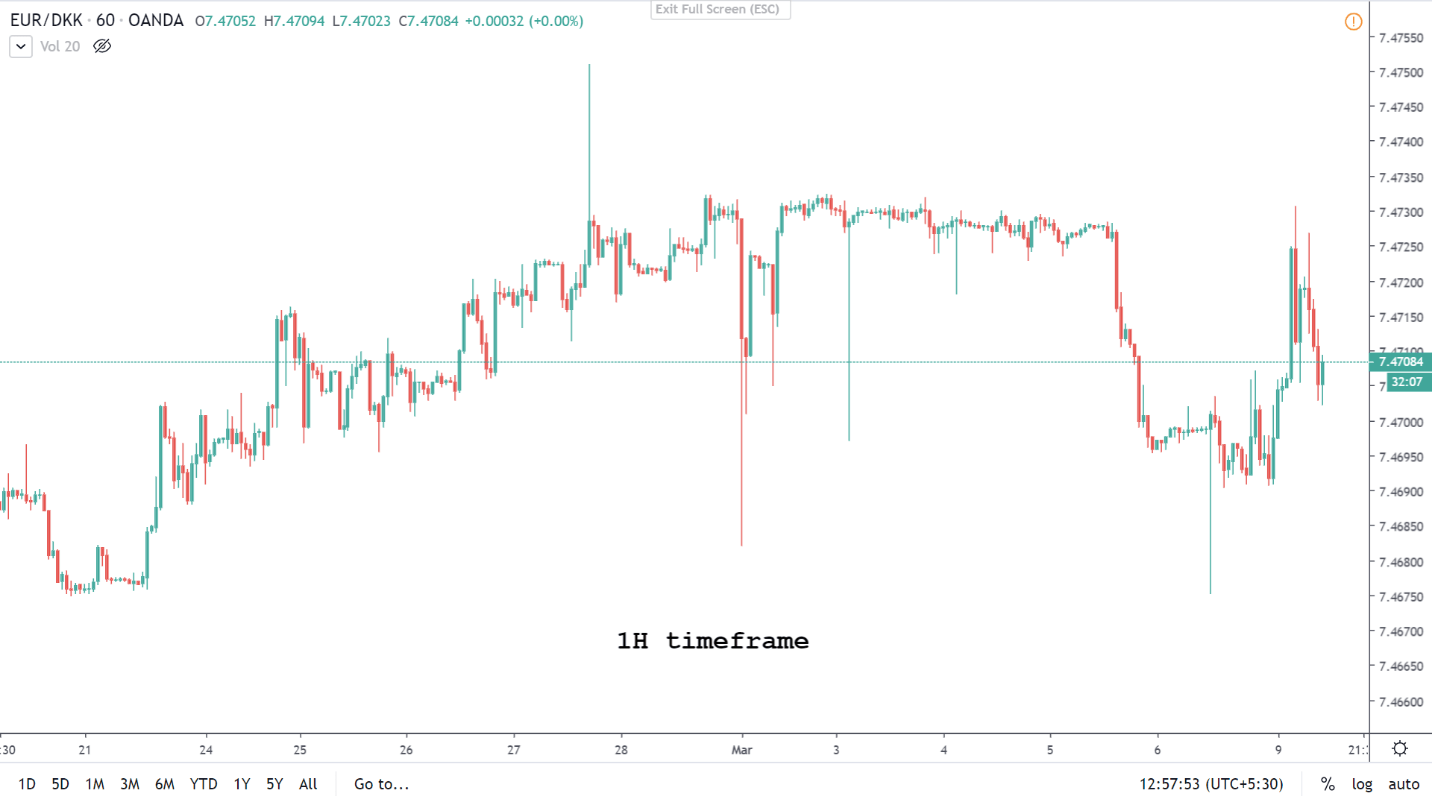
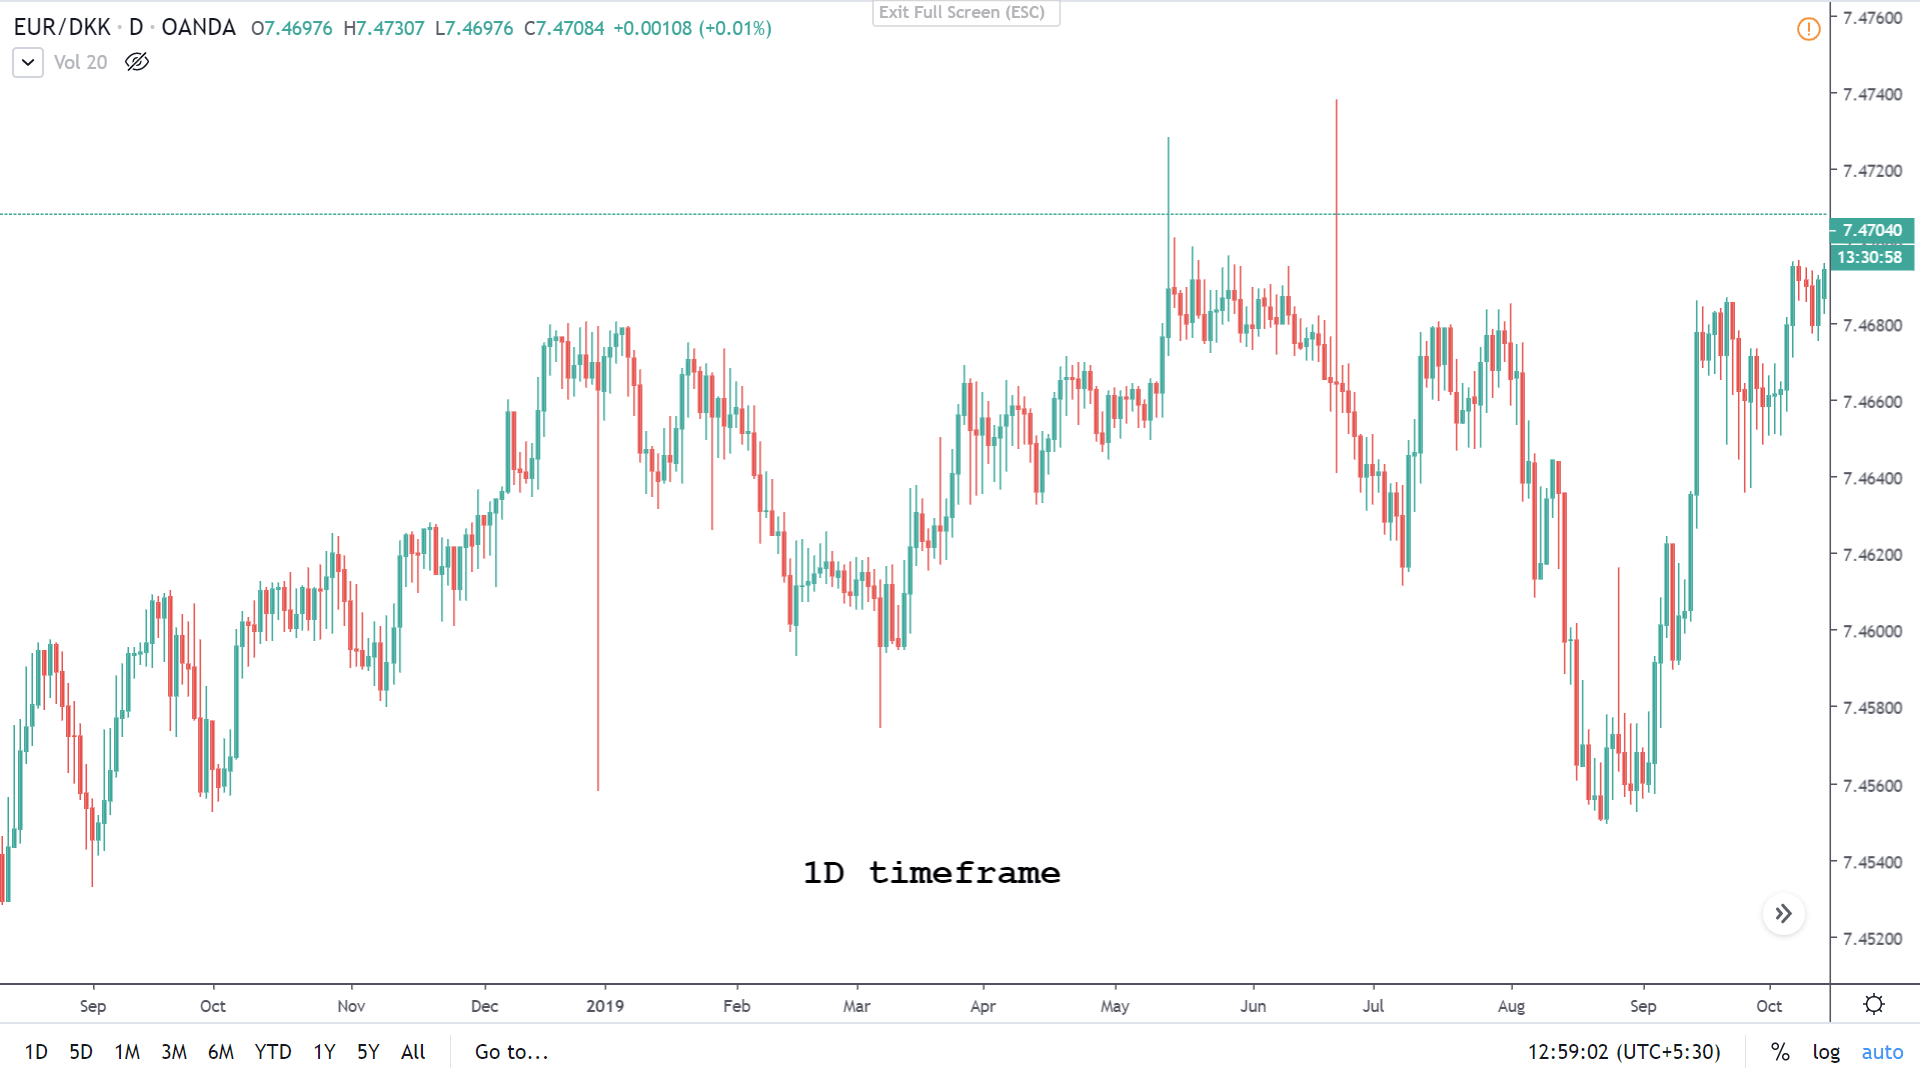
Consider the charts of EURDKK on the 1H and the 1D timeframe. On the 1H timeframe chart, we can see that there is barely any movement in the price. Also, volatility is high here.

On the other hand, on the 1D timeframe, there is enough movement in the prices, and the volatility is not very high as well. Hence, making it the ideal timeframe to trade.

Moreover, a simple and effective way to reduce costs is by trading using limit and stop orders instead of market orders. In doing so, the slippage will be completely nullified. Hence, the total cost will significantly reduce.

Categories
Forex Daily Topic Forex Price-Action Strategies

Price Action Trading: Support/Resistance and Breakout

Support and Resistance are the two most important things as far as price action trading is concerned. We often see that too many support levels/resistance levels are nearby being too close to each other. It may confuse us to be sure whether a breakout takes place or not. In today’s lesson, we try to find an answer to that. Let us get started.

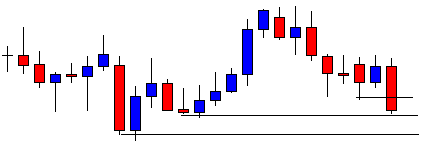
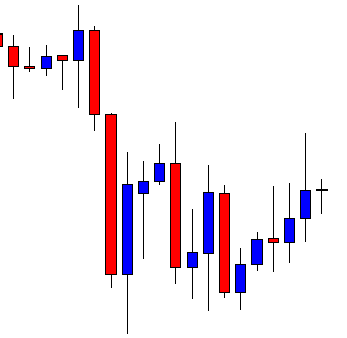
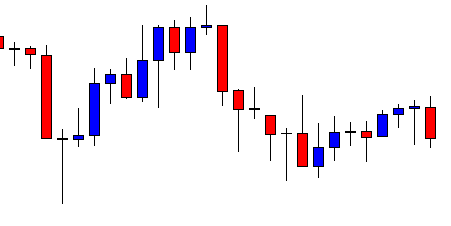
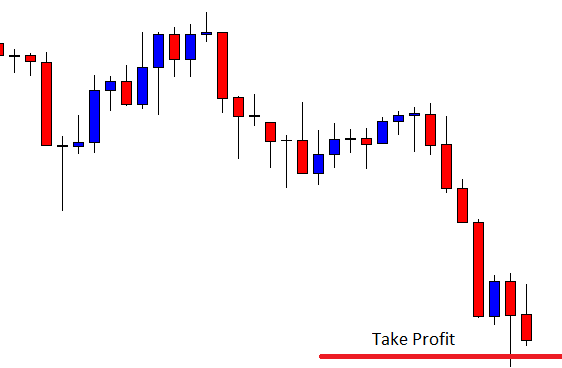
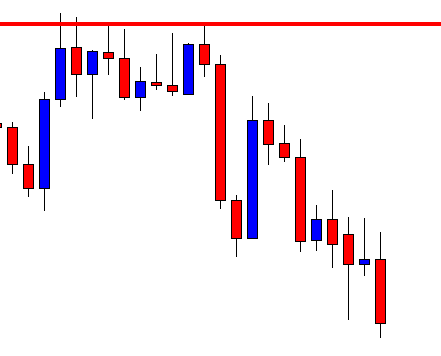
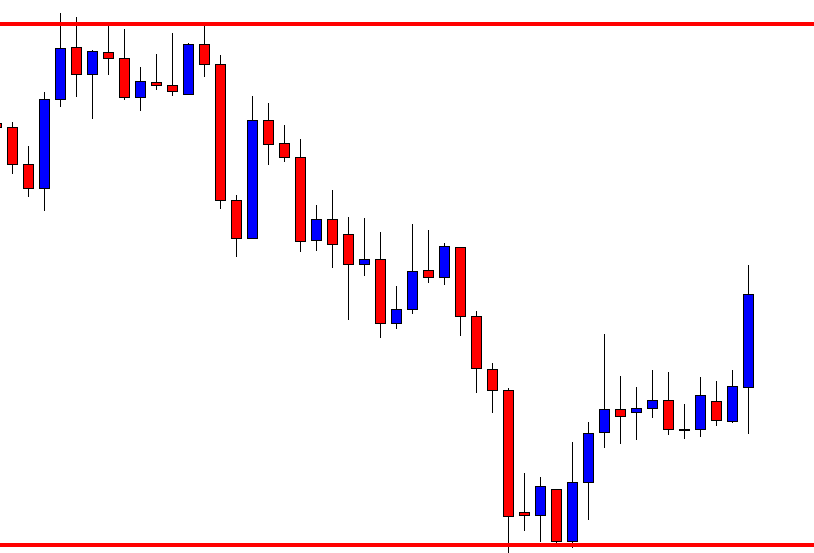
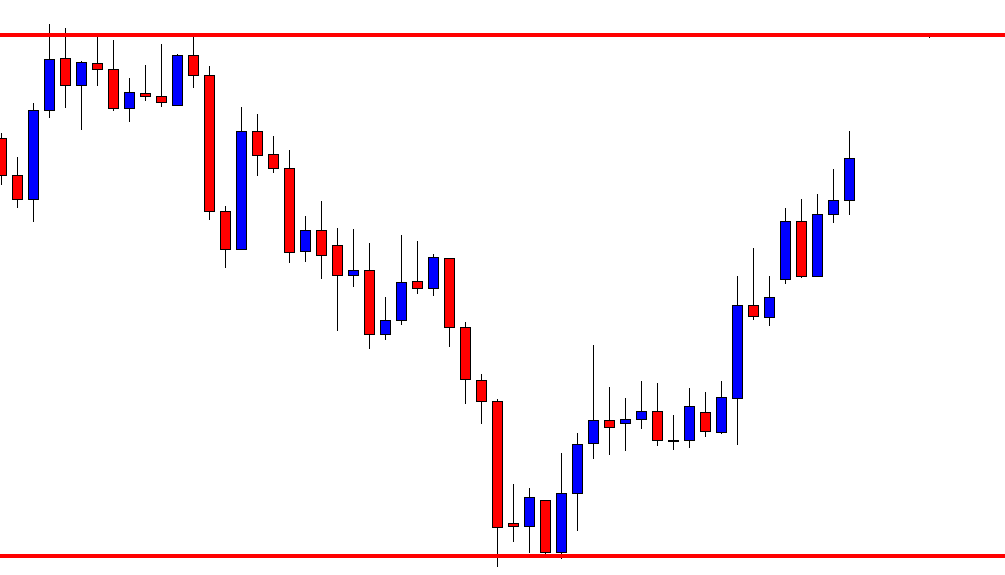
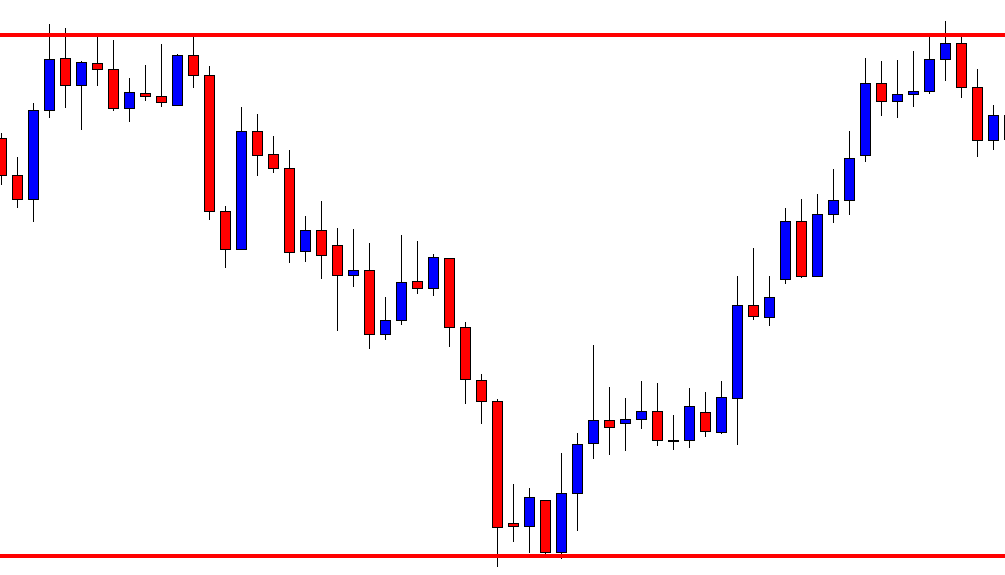
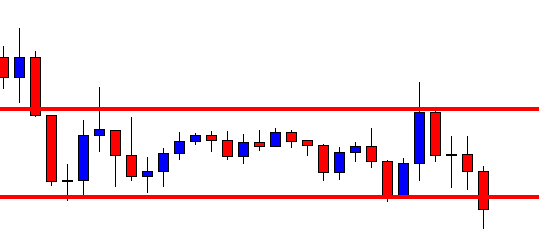
This is a daily chart. The chart shows that the price heads towards the South after producing a bearish engulfing candle. Look at the last candle, which comes out as a bullish corrective candle. If the next candle comes out as a bearish engulfing candle closing below consolidation support, the sellers may trigger a short entry.

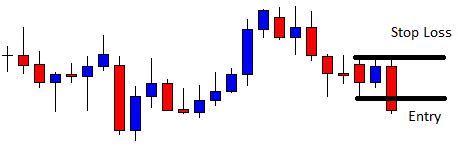
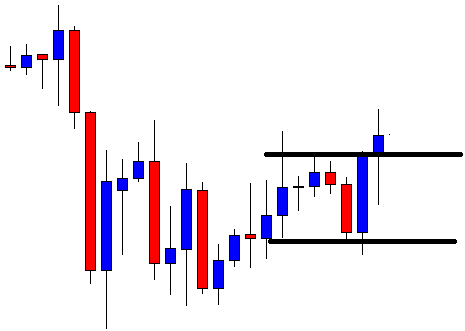
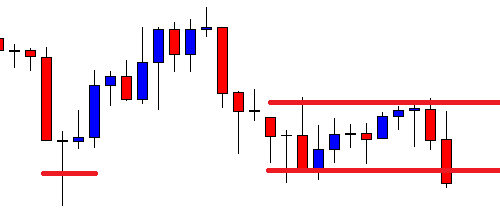
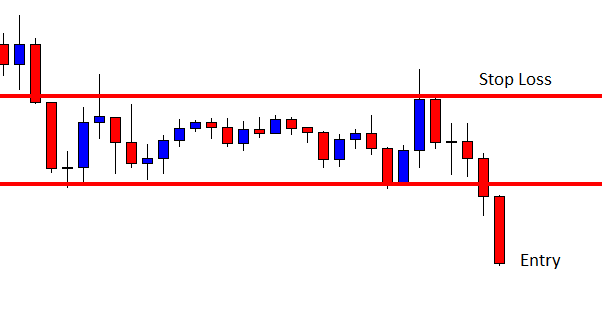
The last candle comes out as a bearish engulfing candle closing below consolidation support. The question is whether the sellers may trigger the entry or not. Look at those two drawn levels. The price reacts to those levels. Usually, price action traders count such levels to determine risk-reward or to set take profit level. Let us assume a trader takes the entry.

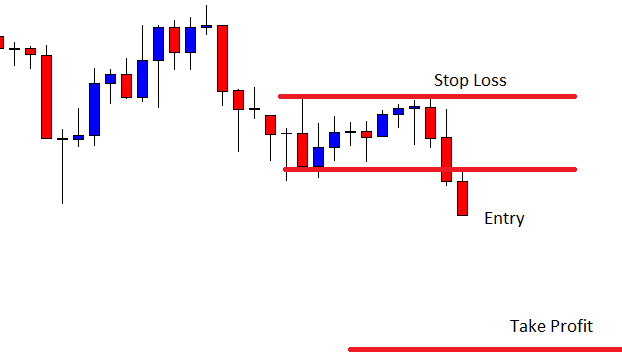
Typically, he should trigger the entry right after the last candle closes with 1R. Do not forget this is a daily chart. The daily chart usually offers more than 1R. Let us proceed to the next chart.

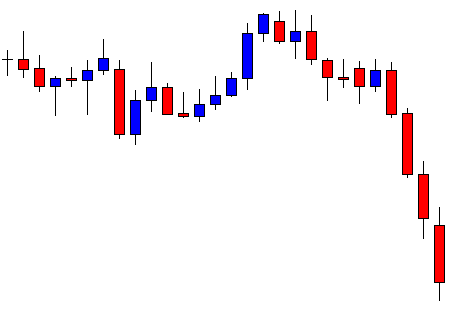
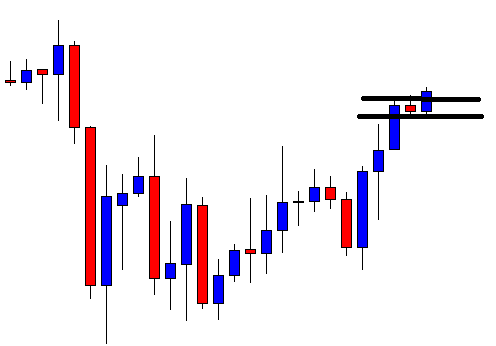
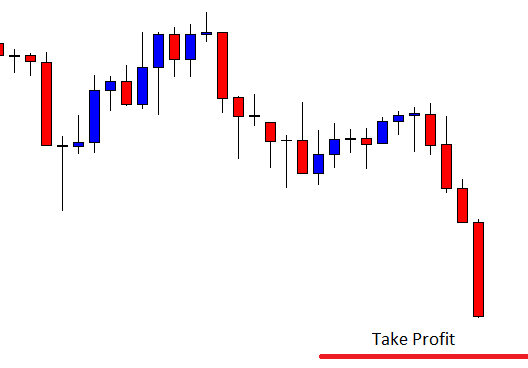
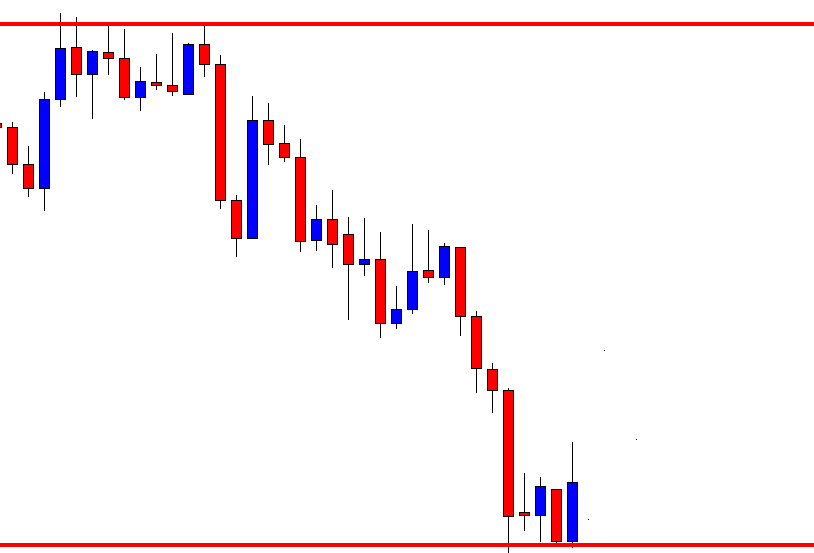
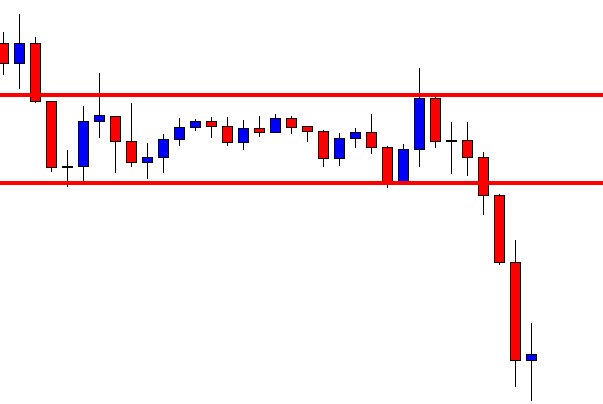
The price heads towards the South with extreme bearish pressure. As mentioned, it gets him more than 1R. It seems it may continue its bearish journey. At least the seller may hold his position until it produces a bullish reversal candle.

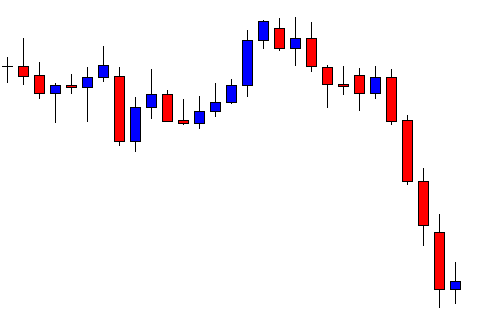
Here it comes. It produces a bullish inside bar. This is not a strong bullish reversal candle. However, some traders may consider come out with their profit or at least some part of it. Some sellers may still hold it until it produces a strong bullish reversal candle.

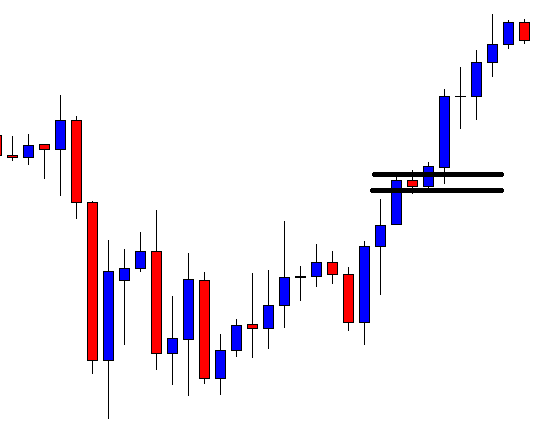
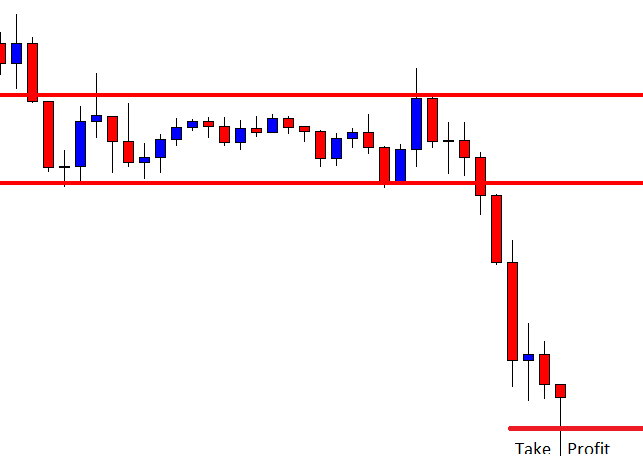
The last candle comes out as a bullish engulfing candle. This time the sellers are to think twice whether they should hold the entry. Many price action traders close their entry here. The trade setup works excellently well here. However, do you remember those two more support levels? The price does not seem to react to those levels at all. You may notice this next time. When support/resistance levels stand too close to each other, the last level and the last breakout gets the priority (in 80% cases). However, if they have enough space in between, then they must be counted by the traders to calculate risk-reward or to set take profit.

Categories
Forex Market Analysis

Daily F.X. Analysis, March 11 – Top Trade Setups In Forex – Who’s Up for U.S. Inflation Rate? 

On the forex front, the ICE U.S. Dollar Index rebounded 1.7% on the day to 96.45, snapping a three-day losing streak, as investors anticipated that fiscal stimulus from the U.S. government would limit the scope for interest rates cut. The U.S. Labor Department will report February CPI (+2.2% expected). The Treasury will post the February monthly budget statement (236.8 billion dollars deficit expected). Here’s an update on the technical side of the market. 

Economic Events to Watch Today   


EUR/USD – Daily Analysis

The EUR/USD retreated 1.2% to 1.1312. Most of the movement in the EUR/USD is triggered in the wake of low impact economic events. Regarding the U.S. economic data, the Small Business Optimism Index by the National Federation of Independent Business (NFIB) rose to 104.5 in February (102.8 expected).

Euro also slipped in the wake of the bearish stock market. The European stocks were broadly lower, with the Stoxx Europe 600 Index declining 1.1%. Germany’s DAX slid 1.4%, France’s CAC lost 1.5%, and the U.K.’s U.K.’s FTSE 100 was down 0.1%.

Overall, the level of uncertainty rose in Italy, where 16 million people in Lombardy and different sections of the north are presently below quarantine, there were 133 life losses announced on Sunday, drawing the sum to 366. More than 7,000 people in the country have been verified to have the disease. 

There are so high chances of a slowdown in the Eurozone, especially in Germany, in the wake of dangerous coronavirus. So, possibly the European Central Bank will go with another stimulus measure on Thursday in order to soften the economic fallout, which may hurt the shared currency very well. 

Looking forward, the traders will keep their eyes on the incoming virus updates and its impact on the risk sentiment and dollar trades ahead of the US CPI data, which is scheduled to release later today at 1230 GMT.

Daily Support and Resistance

  • S1 1.107
  • S2 1.1197
  • S3 1.1245

Pivot Point 1.1323

  • R1 1.1371
  • R2 1.145
  • R3 1.1576

EUR/USD– Trading Tips

On Wednesday, the EUR/USD is trading with a mixed bias around 1.1315. The EUR/USD seems to extend the bearish trend in the wake of completing the 38.2%% and 50% Fibonacci extension level, out of which 38.2% has already been achieved until 1.1280. 

At the moment, the EUR/USD is trading at 1.1315, and a bullish breakout of 1.1350 resistance level can extend buying until 1.1458 level. On the lower side, the EUR/USD may find support around 1.1280, and bearish breakout of 1.1280 can extend sell-off until 1.1238. The RSI and MACD are in the buying zone as the MACD’s histograms are over zero, the bullish zone. Consider taking buy trades above 1.1280.


GBP/USD– Daily Analysis

The GBP/USD fell 1.7% at 1.2907. Later today, the U.K.’s U.K.’s January GDP data (+0.2% on month expected) and February industrial production (+0.3% on month estimated) will be released. The U.S. official data revealed that the economy added 273,000 non-farm payrolls in February (+175,000 expected), and the jobless rate dropped to 3.5% (3.6% expected). Average hourly earnings were up 0.3% on the month (as expected). 

January trade deficit was posted at US$45.3 billion (US$46.2 billion expected), and wholesale inventories (final reading) fell 0.4% on the month (-0.2% expected). Despite mixed economic events, the U.S. dollar is getting weaker and driving the GBP/USD pair higher. 

Whereas, the U.S. 10-year Treasury yields failed to continue the previous day’s run-up, current down by 8-basis points (bps) to 0.67%.

The U.K. Office for National Statistics will report January monthly GDP (+0.2% on month expected), industrial production (+0.3% on month expected), manufacturing production (+0.2% on month expected) and trade balance (356 million pounds deficit expected).

Whereas, Chancellor Rishi Sunak is scheduled to announce a significant relief to the U.K. business houses and will try his hands to keep entrepreneurs attached to Britain after the actual Brexit (which may lose the London’s powerhouse status). 

Daily Support and Resistance

  • S1 1.252
  • S2 1.2733
  • S3 1.281

Pivot Point 1.2945

  • R1 1.3023
  • R2 1.3158
  • R3 1.337

GBP/USD– Trading Tip

The GBP/USD has triggered a dramatic sell-off in the wake of stronger dollar and weakness in Sterling as the pair slipped to test 1.2850. Continuation of a selling trend can lead the GBP/USD prices towards 1.2740, but the way Cable has closed a Doji candle above 1.2850, it seems to trigger a bullish reversal. 

On the higher side, the GBP/USD is likely to trade bullish until 1.3020 level, and breakout of which may drive further buying until 1.3100 level. The MACD is consistently forming bearish histograms below zero, supporting the selling trend in the GBP/USD pair. Let’s consider buying over 1.2925. 


USD/JPY – Daily Analysis

The USD/JPY currency pair flashing red and dropped below the 105.00 level, mainly due to equity markets, which turned lower. At the press time, the USD/JPY is trading at 104.90 and consolidates in the range between the 104.11 – 105.67.

The hopes of fiscal stimulus by the Trump administration boosted investors’ appetite for riskier assets on Tuesday, which allowed the U.S. Treasury bond yields to recover sharply from historic lows and helped revive the USD demand. But as of now, the delay in the incentive package offered by U.S. President Donald Trump to diminish the economic influence of the coronavirus epidemic, which he had promised on Tuesday also weighing on the greenback and risk-tone.

The safe-haven flows were further strengthened by a fresh drop in the U.S. equity futures and the U.S. bond yields, which kept the USD bulls on the defensive and turned out to be one of the key factors exerting some pressure on the pair.

Whereas the bearish bias remained cushioned for now, because investors now seemed unwilling to place any aggressive bets, instead preferred to wait on the sidelines ahead of the latest U.S. inflation figures and the U.S. budget for fiscal 2021.

The U.S. Treasury Secretary Steven Mnuchin will testify on the Proposed the Fiscal Year 2021 Budget, which might provide fresh details about the administration’s new policies.

Daily Support and Resistance

  • S1 99.41
  • S2 102.11
  • S3 103.7

Pivot Point 104.81

  • R1 106.4
  • R2 107.51
  • R3 110.21

USD/JPY – Trading Tips

The USD/JPY is trading at 104.800, testing the bearish trendline resistance level at 105.600. The increased reduced demand for safe-haven assets is driving strong bullish correction in the USD/JPY currency pairs. The USD/JPY has closed two consecutive selling candles, which are followed by the bullish engulfing candle on the 4-hour timeframe, and these are suggesting odds of selling in the USD/JPY currency pair. Below 104.250, the selling trend continuation can lead the USD/JPY prices towards 101.670, whereas, further buying over 104.250 can lead the USD/JPY to 106.250 area.

All the best for today!  

Categories
Crypto Market Analysis

Daily Crypto Review, Mar 11 – Youtube crypto ban; XRP’s price rises

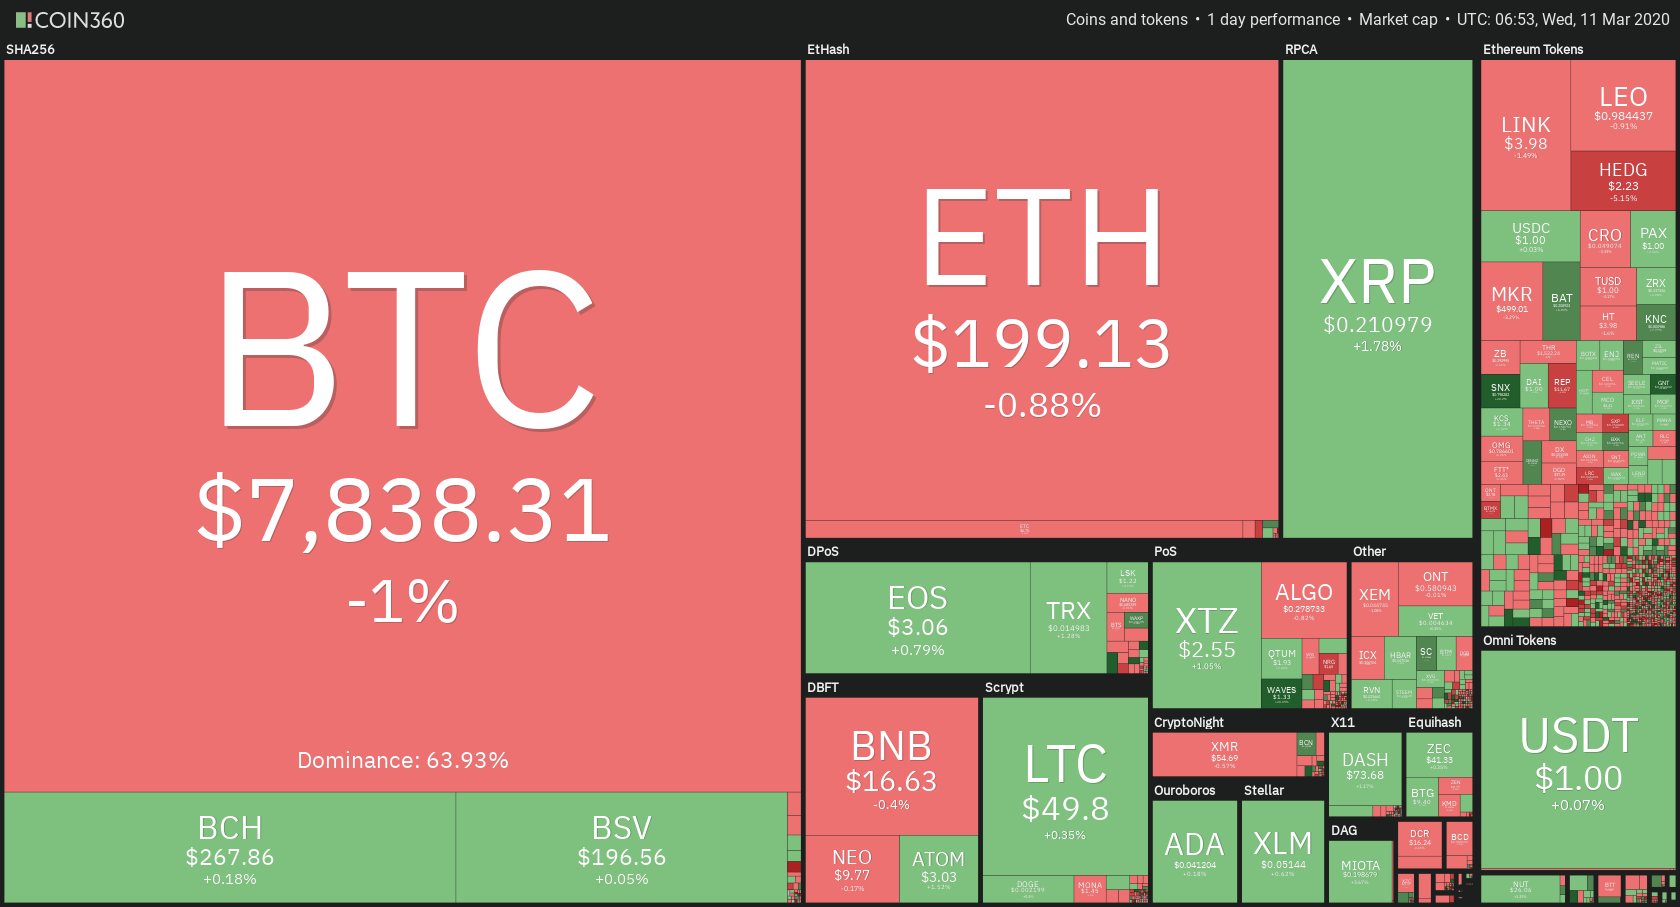
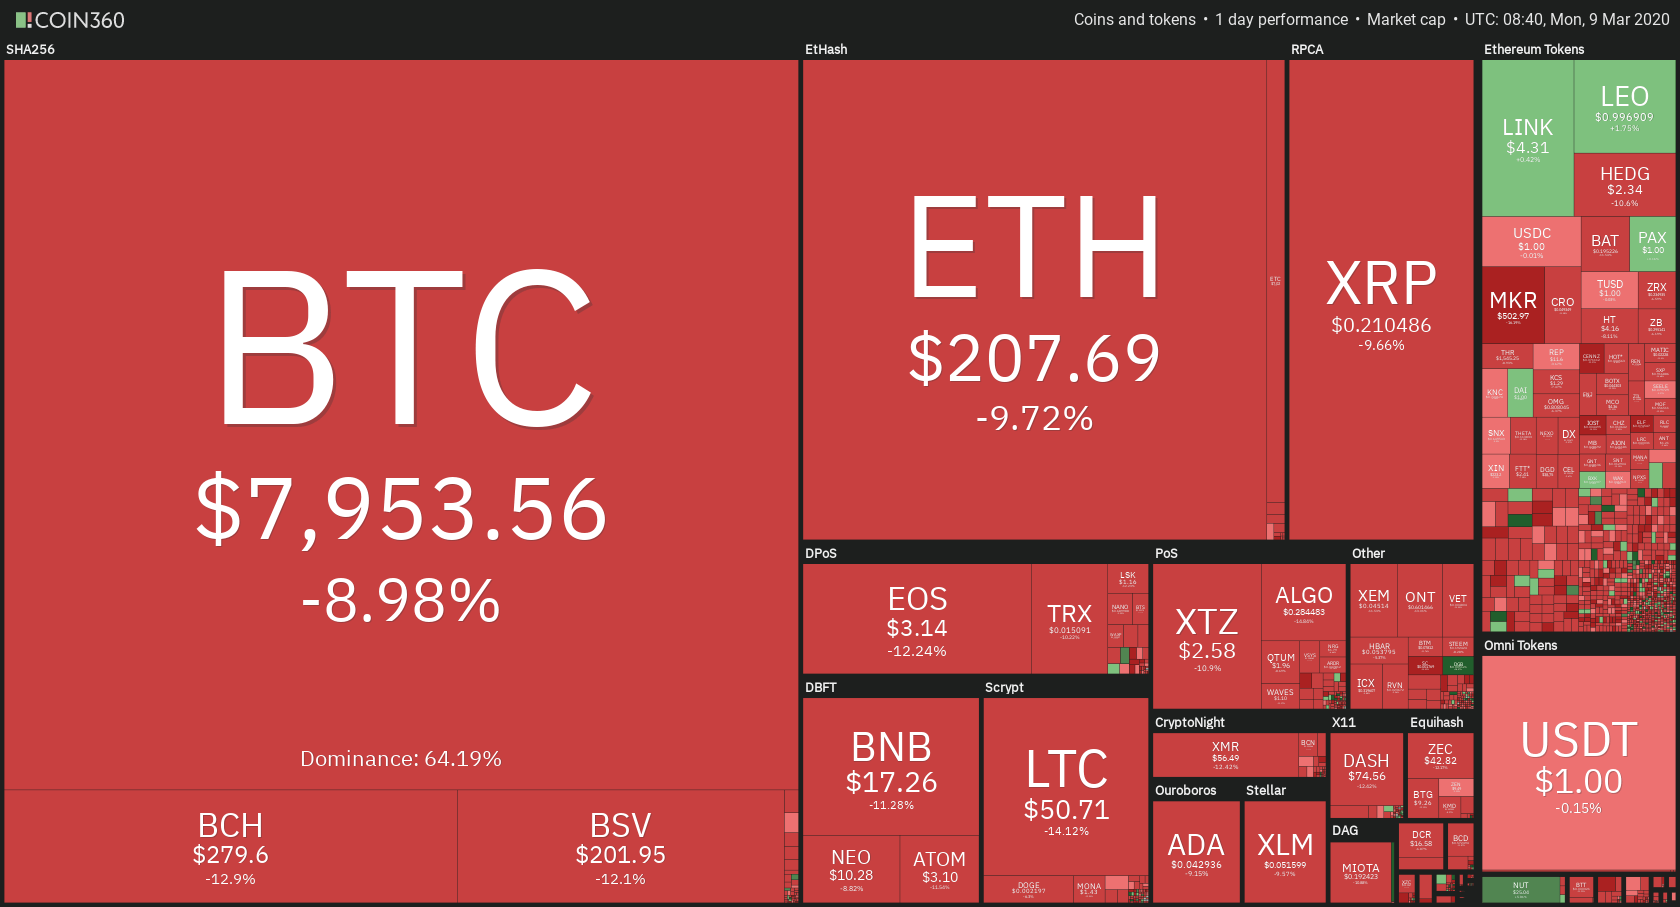
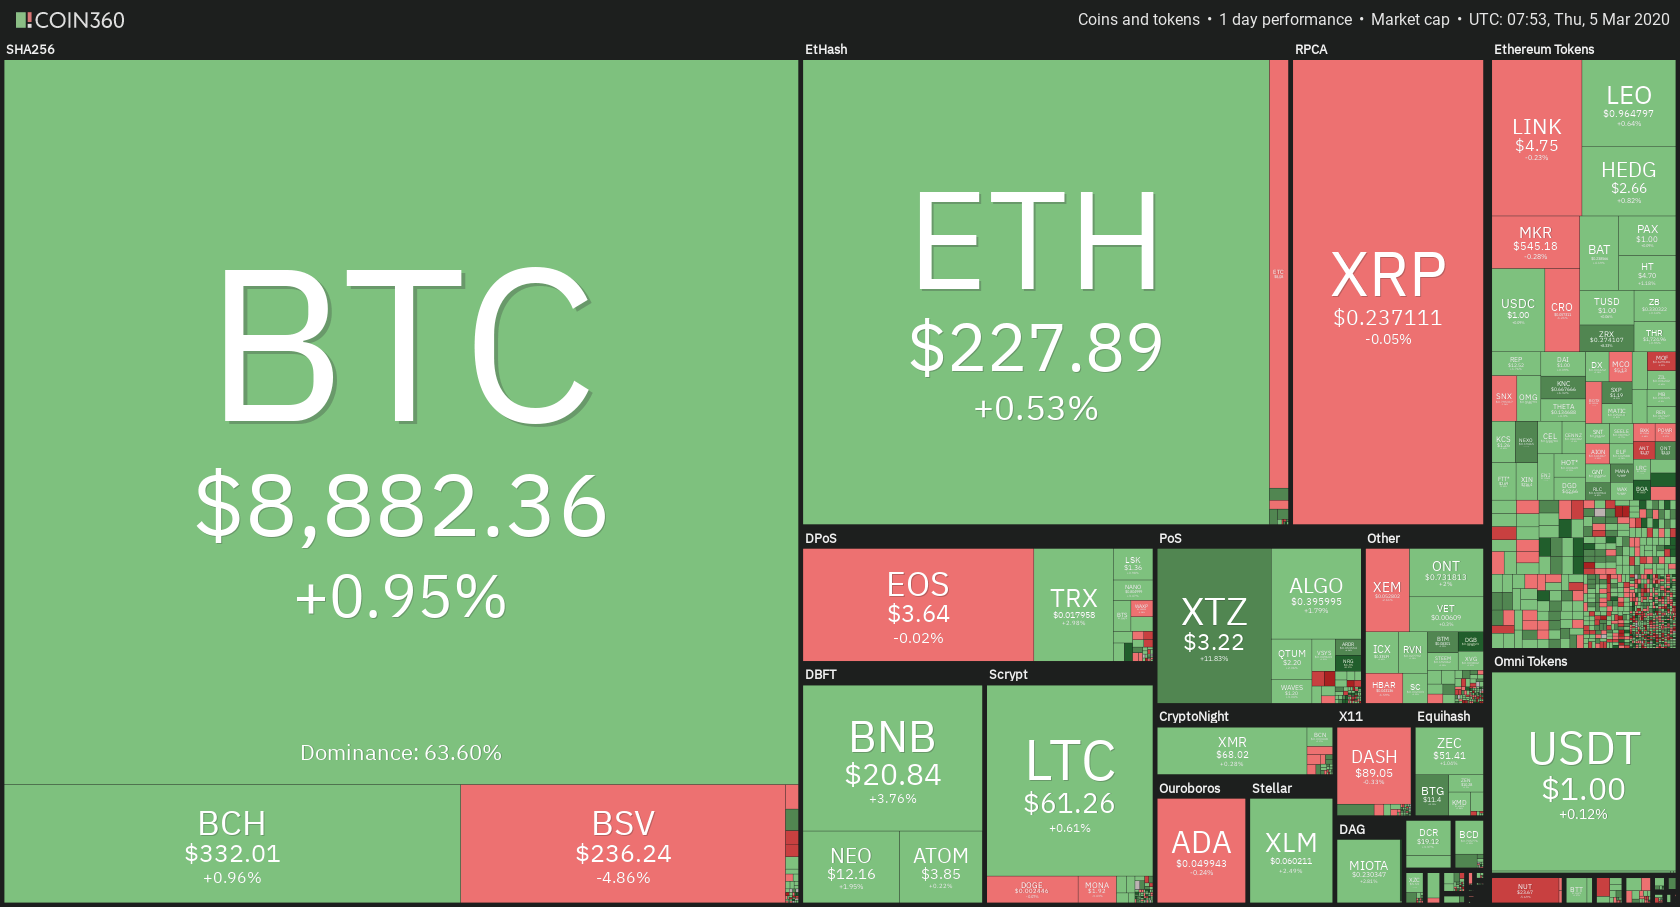
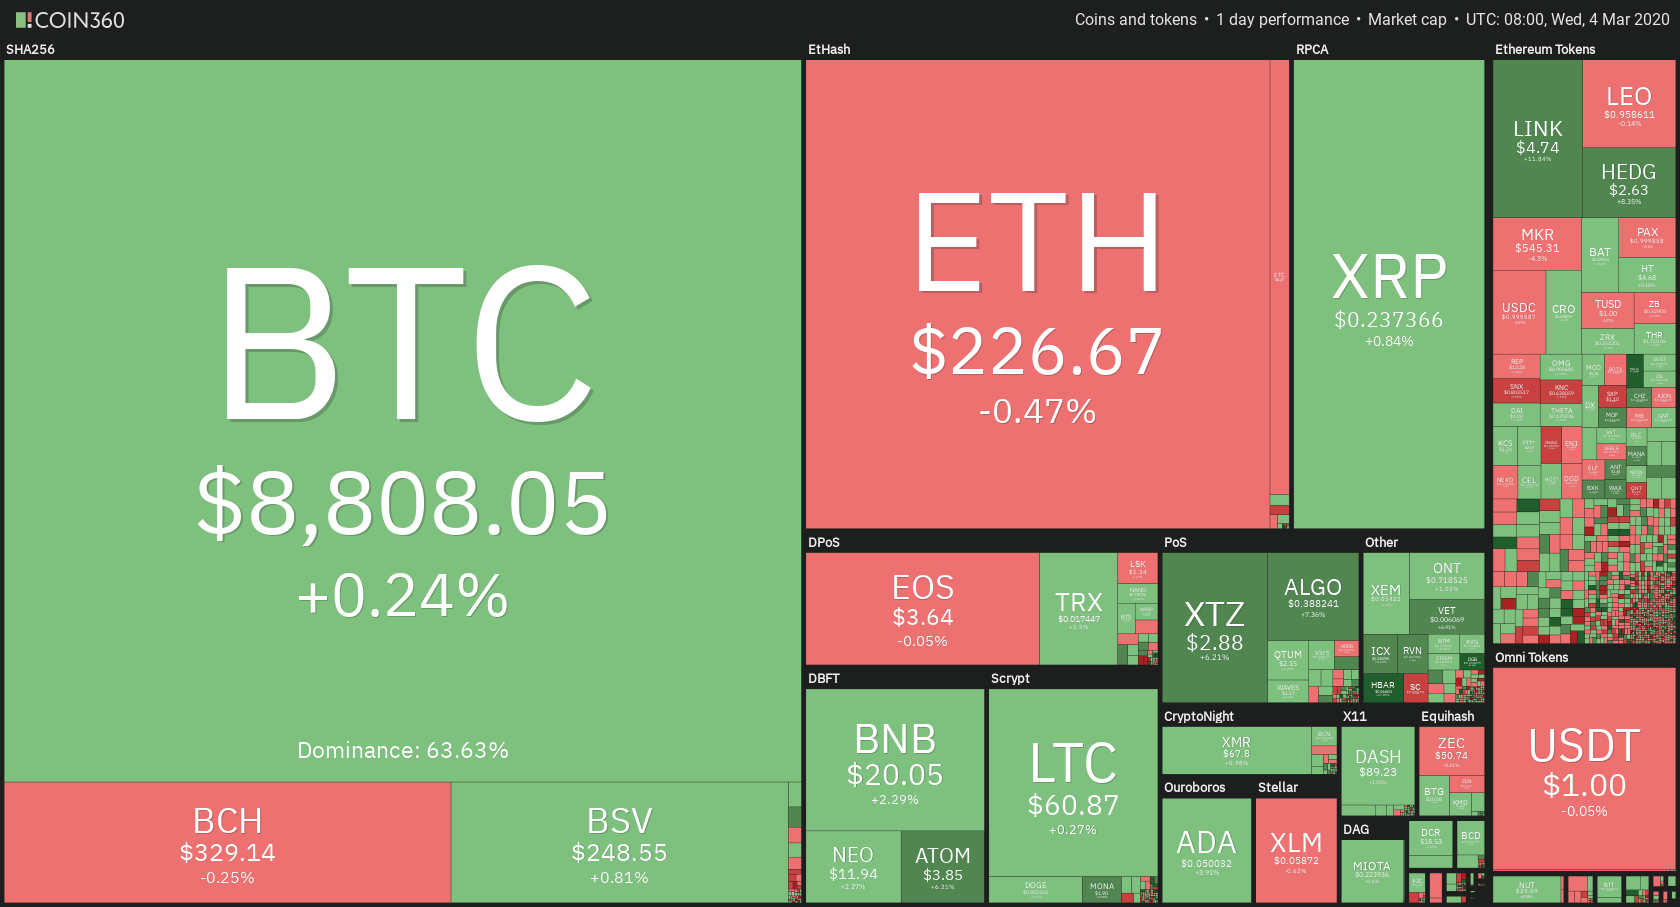
The cryptocurrency market had a pretty slow day when compared to the past couple of days. Bitcoin is currently trading for $7,838, which represents a 1% decrease on the day. Meanwhile, Ethereum lost 0.88 % on the day, while XRP managed to gain 1.78%.

Contentos took the position of today’s most prominent daily gainer, with whopping gains of 330.4%. On the other side, Swipe lost 6.49% on the day, making it the most prominent daily loser.

Bitcoin’s dominance managed to decrease slightly over the past 24 hours. Its value is now 63.93%, which represents a 0.63% difference to the downside when compared to yesterday’s value.

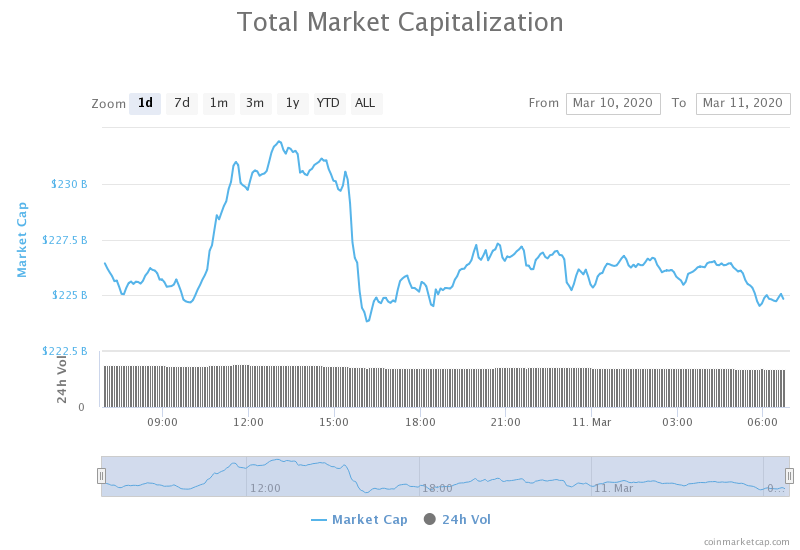
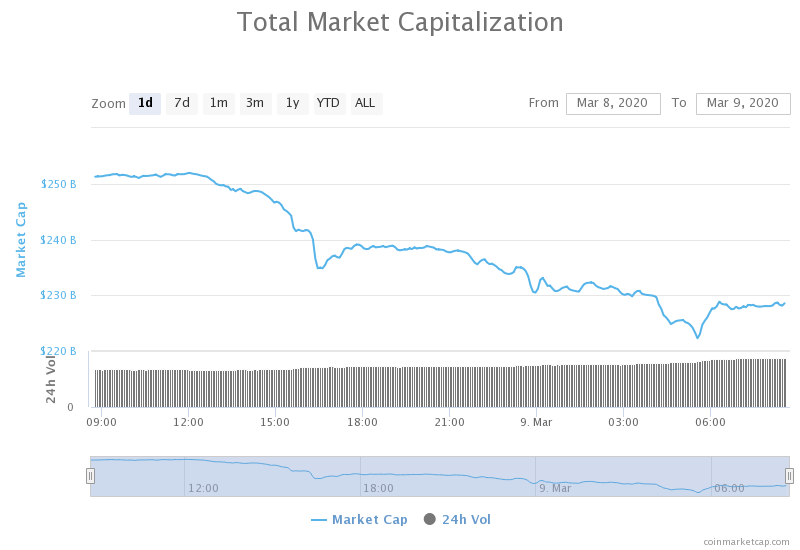
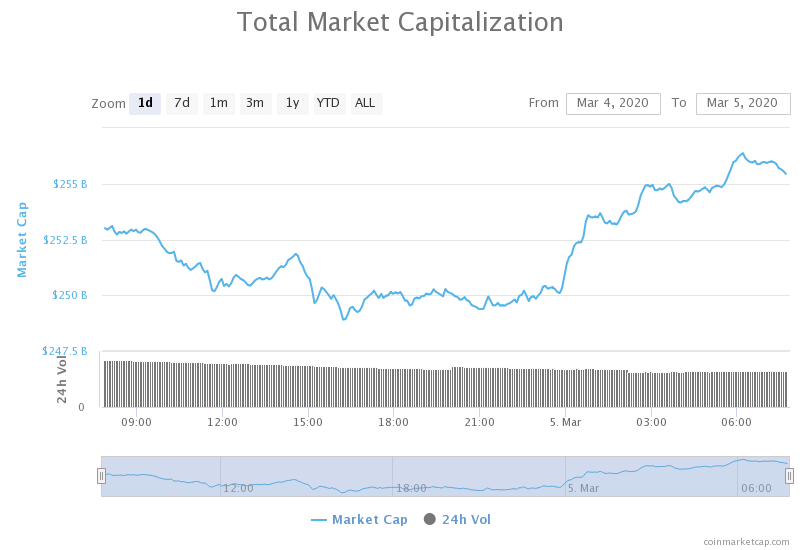
The cryptocurrency market capitalization maintained its levels over the past 24 hours. It is currently valued at $225.06 billion, which represents a decrease of $0.47 billion when its value is compared to the value it had yesterday.

What happened in the past 24 hours

In another attempt of censorship, social media giant YouTube has deleted two posted videos form two crypto channels.

Ivan on Tech, a crypto reporter and programmer, posted a tweet about YouTube deleting one of his videos on Mar 9. The Moon, a (mostly) cryptocurrency technical analyst and news reporter, also told that the content platform deleted one of his videos on Mar 10.

Honorable mention

Ethereum (Synthetix)

Ethereum-based asset issuance platform is currently adding new features, which even include derivatives trading.

In a Mar 10 blog post, the Synthetix platform announced plans for trading binary options in Q3 of this year. Binary options are a form of derivatives where the buyer is down to two outcomes: they either receive a payout or they lose their investment.

_______________________________________________________________________

Technical analysis

_______________________________________________________________________

Bitcoin

Bitcoin’s spent the day mainly trading between the support of $7,760 and $8,000. The price managed to break $8,000 at one point, even reaching $8,150, but quickly dwindling back below $8,000. The $7,760 level has proven to be quite stable and the bears are not able to break it at the moment.


Bitcoin’s volume is slowly declining while its RSI level has risen above oversold levels.

Key levels to the upside                    Key levels to the downside

1: $8,000                                           1: $7,760

2: $8,650                                           2: $7,420

3: $8,825                                            3: $7,085


Ethereum

Ethereum, just like Bitcoin, had a pretty slow day. The second-largest cryptocurrency found a strong support near the$198 level, which held up quite well. Its current price moves are narrowing down and might form a triangle pattern in the near future.


Ethereum’s volume is quite low at the moment, while its RSI level is just below the oversold line.

Key levels to the upside                    Key levels to the downside

1: $217.7                                             1: $198

2: $225.5                                            2: $193.6  

3: $240                                                3: $185


Ripple

Unlike Bitcoin and Ethereum, who mostly consolidated, XRP ended up gaining some value in the past 24 hours. The third-largest cryptocurrency bounced off of the $0.2 support and tried to move its price up, which it succeeded. The price slowly moved up over the past day and reached $0.216, where it stopped and started consolidating. XRP is currently trading near the $0.21 level.


XRP’s volume is extremely low, while its RSI level is in the 40’s range.

Key levels to the upside                    Key levels to the downside

1: $0.221                                            1: $0.2

2: $0.227                                            2: $0.1985

3: $0.235                                             3: $0.19

Categories
Forex Market Analysis

WTI Crude Oil Recovered Slightly From Yesterday’s Historical Fall – Trade Plan! 

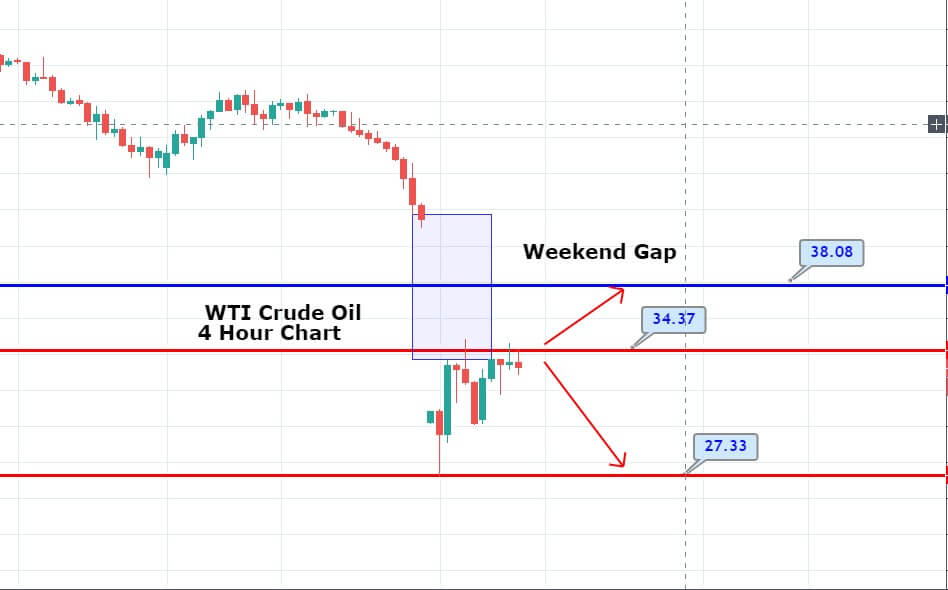
The WTI crude oil prices recovered on the day, representing an 8% gain after yesterday’s historical drop, having hit a multi-year low of $27.40 on Monday. The U.S. Crude Oil WTI Futures gained 6.2% to $33.05. 

The WTI Crude Oil prices marked a historical 30% fall yesterday because tensions between Saudi Arabia and Russia escalated, whereas intensifying fears about the spread of the new coronavirus continued to affect investor sentiment.

After a failure in talks between OPEC and its allies last week, Saudi Arabia cut its April official selling prices by $6 to $8 to grab market share. It also plans to increase its crude output above 10 million barrels per day in April from 9.7 million BPD in recent months.

On the other hand, Russia also said that it might raise output and said that it could manage with low oil prices for six to ten years. It is worth to mention that possibly 50% of the public exploration and production companies will become bankrupt during the next two years as per the report that came from the Pioneer Natural Resources Co. Chief Executive Scott Sheffield. 

The risk-sentiment was also recovered after Chinese President Xi Jinping visited Wuhan, the epicenter of the coronavirus outbreak, for the first time since the disease started, and because of the spread of the virus in mainland China sharply decreases.

At the demand side, the International Energy Agency said oil demand was set to contract in 2020 for the first time since 2009.

Daily Support and Resistance

  • S1 16.27
  • S2 23.67
  • S3 27.07

Pivot Point 31.07

  • R1 34.47
  • R2 38.47
  • R3 45.87

Technically, crude oil is trading at $34 per barrel, mostly maintaining sideways trading range of 34.40 – 27.33. At the moment, 34.35 resistance is very, very crucial for crude oil as the MACD is extremely oversold, and traders need a reason to long on crude oil. Breakout of 34.35/40 can be that reason which may attract some buying in crude oil and may lead its prices towards 38. Let’s look to stay bearish below 34 and bullish above 34.40 area today. Good luck! 

Categories
Forex Fundamental Analysis

Understanding ‘Interest Rate’ & It’s Impact On Various Currency Pairs

Introduction

Economic indicators measure how strong the economy of a country is. They `can measure specific sectors of the economy, such as housing or manufacturing sector, or they give measurements of the country as a whole, such as GDP or Unemployment. The following article will explain one such crucial economic indicator that drives the value of the currency – Interest Rate.

What is Interest Rate?

The interest rate is a fee we are supposed to pay for the money we borrow from the bank. It is generally expressed in terms of a percentage on the principal amount borrowed. The Bank’s primary source of income comes from the difference in the interest rate they charge to the borrowers and the lenders. They operate and profit from the difference between these rates.

When interest rates are high in a country, banks find it difficult to pass on such rates to consumers as it corresponds to fewer loans and more savings. This reduces spending in people, which will have an impact on the economy. Also, raising the interest rates curbs inflation and thus improves the economy.

Types of Interest Rates

The interest rate is frequently used by money managers while making investment decisions, and they look at different types of rates. The different kinds of Rates are Nominal, Real, and Effective interest rates. These are classified on the basis of critical economic factors that can help investors become smarter consumers and better investors. Let’s understand each of these types below.

Nominal Interest Rate

Nominal Interest Rate is the rate that is stated on a loan or bond. It signifies the actual price which the borrowers need to pay lenders in order to use their money. For example, if the nominal rate on loan is 10%, borrowers can expect to pay $10 of interest for every $100 they borrow from the lenders. This is referred to as the coupon rate because it used to be stamped on coupons that were redeemed by bondholders.

Real Interest Rate

It is named this way because, unlike the Nominal Interest Rate, it considers Inflation to give investors an appropriate measure of the consumer’s buying power. If an annually compounding bond gives an 8% Nominal yield and the inflation rate is 4%, the real rate of interest is only 4%. This can be put in the form of an equation as:

Real Interest Rate = Nominal Interest Rate – Inflation Rate

There are other pieces of information that the above formula provides in addition to the Real Rate. Borrowers and investors make use of this info to make informed financial decisions. They are:

  • When the Inflation Rates are negative, Real Rates exceed Nominal Rates, and the opposite is true when Inflation Rates are favorable.
  • There is one theory that suggests that Inflation Rate moves alongside the Nominal Interest Rate over time. Therefore, investors who have a long time horizon will be able to get investment returns on an Inflation-adjusted basis.
Effective Interest Rate

This type of Interest Rate takes the concept of compounding into account that the investors and borrowers need to be aware of. Let us understand how Effective Interest rate works with an example. If a bond pays 8% annually and compounds semi-annually, an investor who invests $1000 in this bond will receive $40 of interest payments for the first six months and $41.6 of interest for the next six months. In total, the investor gets $81.6 for the year. In this example, the Nominal Rate is 8%, and the Effective Interest Rate is 8.16%.

Economic reports & Frequency of the release 

Federal Open Market Committee (FOMC) members vote on where to set the Target Interest Rate. Later, they release the reports on the same with the actual rate and analysis. The policies of Central Banks also have an impact on the Interest Rates of a country. The Reserve Bank members hold meetings eight times a year and once every six weeks to evaluate the Interest Rates. These economic reports are published on a monthly and quarterly basis, and investors can compare the previous Interest Rates to Current Rates and analyze how they changed over time.

Impact on Currency

Investors are always interested in countries that have the highest Interest Rate, and they are more likely to invest in that economy. The demand for local currency is expected to increase, which leads to an increase in value.

High-Interest Rate means residents of that country get a higher rate of return on the deposit they made in banks and on capital investments. So obviously, investors will invest their capital in countries where they get a higher rate of return for holding their money.

Under normal economic circumstances, when investments increase in a country, the value of the currency appreciates and thus attracting the traders across the world.

Sources of information on Interest Rate

The Interest Rate data of some of the major economies can be found in the below references. The Rates of the respective countries are also available on the Reserve Bank website. However, the FOMC makes an annual report on the Interest rate that can be found here.

Authentic Sources To Find The Info On Interest Rates 

GBP – https://tradingeconomics.com/united-kingdom/interest-rate

AUD – https://tradingeconomics.com/australia/interest-rate

USD – https://tradingeconomics.com/united-states/interest-rate

CHF – https://tradingeconomics.com/switzerland/interest-rate

EUR – https://tradingeconomics.com/euro-area/interest-rate

CAD – https://tradingeconomics.com/canada/interest-rate

NZD – https://tradingeconomics.com/new-zealand/interest-rate

JPY – https://tradingeconomics.com/japan/interest-rate  

Interest Rate is one of the crucial factors that impact the currency of a country. It is especially crucial for traders who prefer taking trades on Fundamental analysis. But it is advised not to trade just based on this fundamental indicator alone. It is always better to combine the fundamental factors with proper technical analysis to get an edge over the market.

How ‘Interest Rate’ News Release Affects The Price Charts?

It is important to understand how the new releases of macroeconomic indicators like interest rates have an impact on the price charts. Below, we have provided some of the examples to demonstrate the impact of Interest Rates news release on various Forex markets. There is a reliable forum where all the government news release date is published, and it is known as Forex Factory.  Here, we can find all the present and historical information regarding most of the fundamental indicators like GDP, Interest Rates, Inflation Rate, etc.

Below we can see a snapshot taken from the Forex Factory website. FOMC (Federal Open Market Committee) is a branch of the Federal Reserve Board that releases the Interest Rate data according to the predetermined frequency. On the right, we can see a legend that indicates the level of impact the Fundamental Indicator has on the corresponding currency.

Below, we can see the latest figures for Interest Rate data released by FOMC. We can see that the rate hasn’t changed from the previous release (both Actual and Previous being 1.75%)


Now, let’s see how this news release made an impact on the Forex price charts.

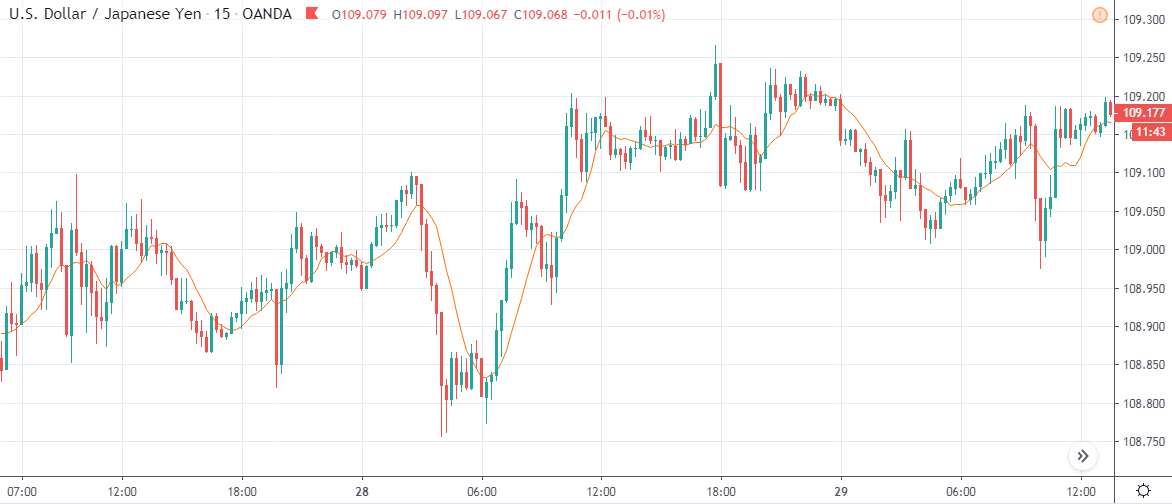
USD/JPY | Before The Announcement - (Jan 29th, 2020 | Just Before 2:00 PM) 

From the above chart, it is clear that before the news releases, the market was in a consolidation state (observe the last few candles.) Most of the Fundamental traders and investors must be waiting for the latest Interest Rate numbers. We have also plotted an MA on the chart to identify the market direction, and we can see the MA also being flat before the news release.

USD/JPY | After The Announcement - (Jan 29th, 2020 | Just After 2:00 PM)

Right after the release, we can observe a Bullish candle, which shows the initial reaction to the Interest Rate. It seemed to be positive for the US dollar, but later the market collapsed. The Interest Rates remained unchanged and were maintained the same as before, which should be positive for the US dollar. Hence, we see that initial reaction.

But why did the market collapse after a few minutes? This is because the market was expecting a rise in the interest rates, but FOMC kept a neutral stance and did not raise the rates. This explains the reason why the market fell after the announcement. The MA, too, does not rise exponentially, which shows the weakness of the buyers.

Since the market moved quite violently, later, the news release could prove to be profitable for the option traders who did not have any directional bias. There will be many traders who would want to take advantage of the market volatility right after the news release. So, even before the news is out, they employ various options strategies and make a profit. This requires a high amount of experience and knowledge of options and is not recommended for beginners. Now, let’s quickly see how this new release has impacted some of the other major Forex currency pairs.

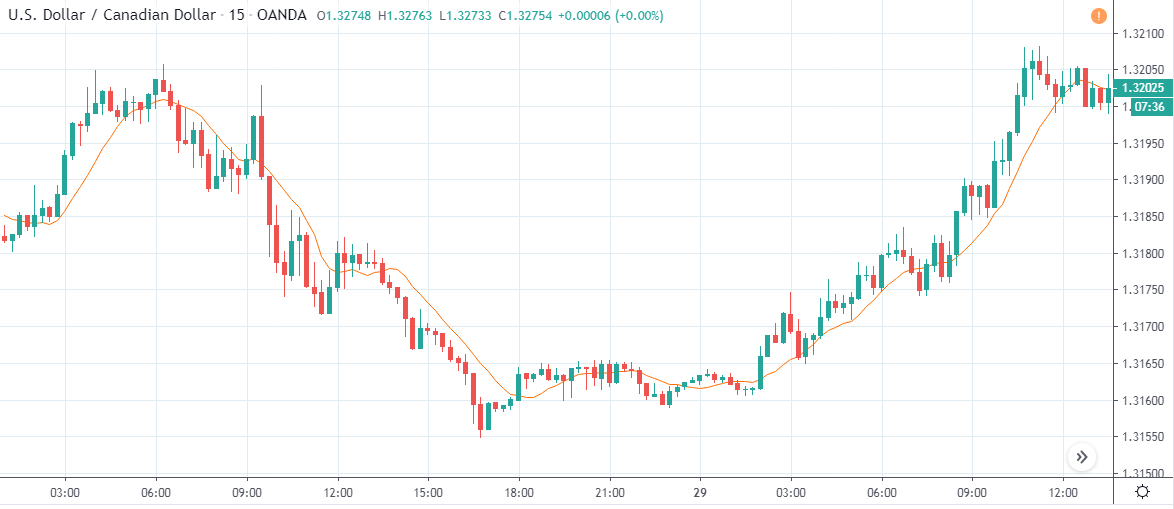
USD/CAD | Before The Announcement - (Jan 29th, 2020 | Just Before 2:00 PM)

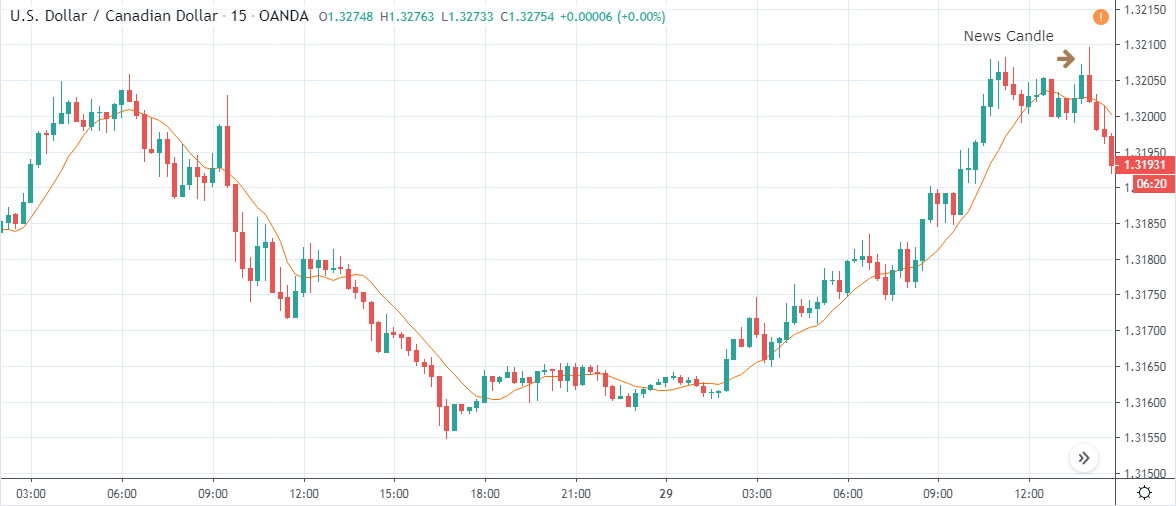
USD/CAD | After The Announcement - (Jan 29th, 2020 | Just After 2:00 PM)

From the above charts, it is clear that the USD/CAD pair shows similar characteristics as that of our USD/JPY example. The last few candles before the news release portray a bit of consolidation prior to the news release, followed by a spike during the news announcement and then finally a collapse. One can take short trade in this pair and make a profit on the downside. Make sure to combine this with technical analysis for extra confirmation.

 AUD/USD | Before The Announcement - (Jan 29th, 2020 | Just Before 2:00 PM)

AUD/USD | After The Announcement - (Jan 29th, 2020 | Just After 2:00 PM)

Since the US dollar is on the right side in this pair, ideally, we should see a bullish momentum after the news release. We can see that right after the release, the market prints a spike on the downside and forms a ‘hanging man’ pattern, which could be a sign of trend reversal. It can be clearly observed that the news had a significant impact on this pair as it reversed the trend almost completely.

Bottom Line

All we wanted to say is that the major Fundamental Indicators do have a significant impact on the price charts. At times we can see that these news releases can increase the market volatility significantly and even change the direction of the underlying trend. When we combine these Fundamental Factors with the Technical Analysis, we will be able to predict the market accurately and take trades with at most accuracy. Cheers!

We hope you find this article informative. If you have any questions, let us know in the comments below. Cheers!

Categories
Forex Assets

Trading Costs Involved While Trading The EUR/SGD Exotic pair

Introduction

EUR/SGD is the abbreviation for the Euro area’s euro against the Singapore Dollar. This is one of the most traded exotic currency pairs in the world. In this pair, EUR is the base currency, and SGD is the quote currency.

Understanding EUR/SGD

The price of this pair represents the value of SGD, which is equal to one EUR. It is quoted as 1 EUR per X SGD. For example, if the value of this pair is 1.5552, then about 1.5 Singapore Dollars are required to purchase one euro.

EUR/SGD Specification

Spread

The spread is the difference between the bid and the ask price in the market. These two prices are set by the brokers. And it depends on the type of execution model used by the brokers.

Spread on ECN: 10 pips | Spread on STP: 11 pips

Fees

On ECN accounts, for every position you open, there is some fee involved with it. This is different for different brokers. However, on STP accounts, there is no fee as such.

Slippage

To put it in simple words, slippage is the difference between the trader’s demanded price and price given by the broker. The trader does not get his intended price due to two reasons – Broker’s execution speed & Market volatility

Trading Range in EUR/SGD

With the trading range table, we can assess our gain/loss on a trade in a given timeframe even before we open positions for it. This is done by considering the past volatility of the market.

Now, to determine the profit/loss on a trade, all you must do is, multiply the volatility value with the pip value ($7.25).

Procedure to assess Pip Ranges

  1. Add the ATR indicator to your chart
  2. Set the period to 1
  3. Add a 200-period SMA to this indicator
  4. Shrink the chart so you can assess a large time period
  5. Select your desired timeframe
  6. Measure the floor level and set this value as the min
  7. Measure the level of the 200-period SMA and set this as the average
  8. Measure the peak levels and set this as Max.

EUR/SGD Cost as a Percent of the Trading Range

This is an excellent application to the above volatility table. By considering the pip movement values, we can determine the cost variation of a trade as well. To do so, we find the ratio between the total cost and volatility value and convert it into percentages. Below are the cost variations for ECN and STP accounts models.

ECN Model Account 

Spread = 10 | Slippage = 3 | Trading fee = 3

Total cost = Slippage + Spread + Trading Fee = 3 + 10 + 3

Total cost = 16

STP Model Account

Spread = 11 | Slippage = 3 | Trading fee = 0

Total cost = Slippage + Spread + Trading Fee = 3 + 11 + 0

Total cost = 14

The Ideal way to trade the EUR/SGD

Comprehending the costs : Large/Small percentage -> High/Low costs

From the above the tables and the implications, we can conclude that costs are high when the volatility of the low and high when the volatility is low. And when it comes to the ideal way to trade this pair, conservative traders may trade it during those times when the volatility values are at or above the average values. This will ensure enough volatility as well as affordable costs. And other aggressive traders may trade during any of the extremes.

Also, traders can reduce their total costs by trading using limit orders and stop orders. Unlike the market orders, limit and stop orders do not include slippage on the trade. Hence, this will reduce costs considerably.

Categories
Forex Price-Action Strategies

Price Action Trading: Be Psychologically Strong

Today, we are going to demonstrate an example, which has several lessons. Forex price action traders need to concentrate hard on the trading charts. They must have ‘never give up’ attitude, must not make decisions emotionally. In a word, they need to be psychologically strong. Let us now proceed to our lessons with examples.

This is a daily chart. After being bearish, the chart produces a bullish reversal candle. The combination of the last two candles is called Track Rail. It is a strong bullish reversal pattern. The daily- H4 combination traders may flip over to the H4 chart to go long on the pair.


The H4 chart does not look that promising. The price heads towards the North, but the momentum has not been strong. However, the buyers have their first signal to keep an eye on this chart. They are to wait for the price to consolidate and produce a bullish engulfing candle to offer them a long entry.

The price makes a deep consolidation and produces a bullish engulfing candle. However, it closes within a level where the price gets rejection twice. The engulfing candle does not close above the level of resistance, but the next one does. This is not an A+ entry. The buyers may skip taking the entry.

The price continues to go towards the North. Some traders may think an opportunity is missed. Do not forget that we shall only go with A+ trade setups. Here is a question. Look at the last consolidation and the bullish reversal candle. The candle closes well above the level of resistance. However, it is not a deep consolidation. Would you trigger a long entry here? Do not miss the point that it is not a deep consolidation. Thus, this is not an A+ entry either. Let us skip it and concentrate on the next chart.


Again, the price heads towards the North. This is where we must not panic and think we keep losing opportunities. It is always better to be safe than sorry. What do you think about the last bearish candle? This seems to be a deep consolidation. If the chart produces a bullish engulfing candle, the buyers may trigger a long entry.


The last candle comes out as a bullish engulfing candle closing well above the level of resistance. The price makes a deep consolidation. This is an A + trade setup. We may trigger a long entry right after the last candle closes. Let us proceed to the next chart to find out how the entry goes.


The price heads towards the North with good bullish momentum. It gets us more than 1R. At last, our patience has paid off. Do you notice how strong we need to be psychologically? This may seem easy, but it never is when we trade and make a decision in the live market. It is tough to restrain ourselves from taking bad entries. Sometimes they may make a profit and make us upset if we do not take the entry. To be consistent, we must not be upset but wait for the best setup (A+ trade setup) to offer us entry.

Categories
Forex Videos

Forex Hacking – Hedging Trades To Make Money No Matter Which Way The Market Moves

Hedging – Making money no matter which way the market moves


In this video, we are going to show you how to make money by using a hedging strategy that will take advantage of a breakout move in the market, no matter what direction. There are many different styles of hedging, and while some are implemented to protect profit and loss, The following strategy has been developed to maximize opportunities increase the chance of profitability know matter which way the market moves, and hence to create more money-making opportunities with your trading.
If used correctly you will be able to regularly make money using this strategy. Hedging sounds like a strategy that is too good to be true, however, we back up this strategy with a clear and precise methodology, while looking for breakout strategies that professional traders use every day in the Forex market.

Therefore the basis of this ageing strategy is that it should be implemented at such points that markets have consolidated, or has reached high or low peaks which are right for a reversal in price action. With the correct implication you will be able to make money even if you have a short position and the market goes against you, or if you have a long position and the market goes short.

This strategy consists of two parts, the initial trade and a backup trade.
First of all let’s look at a potential set up before we implement this strategy.

Example A

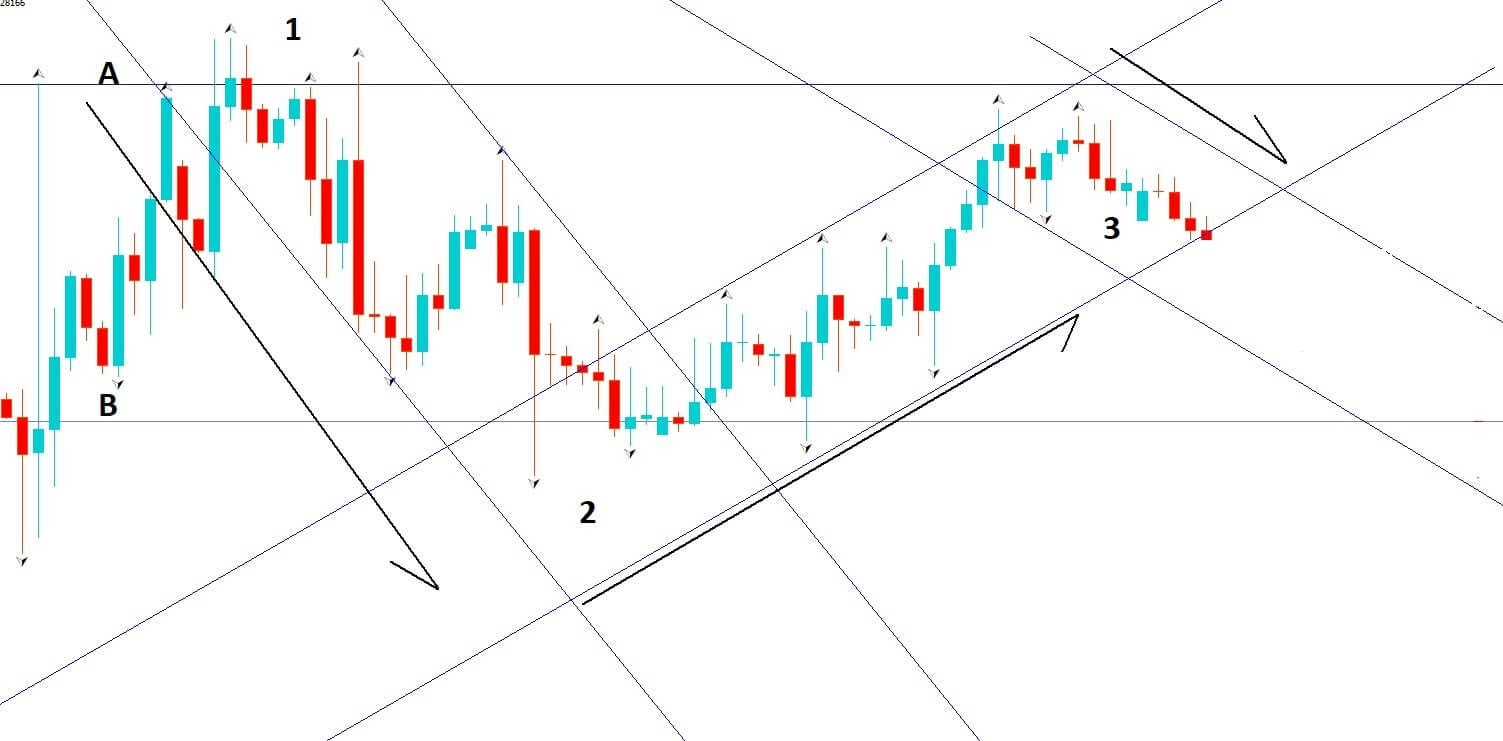
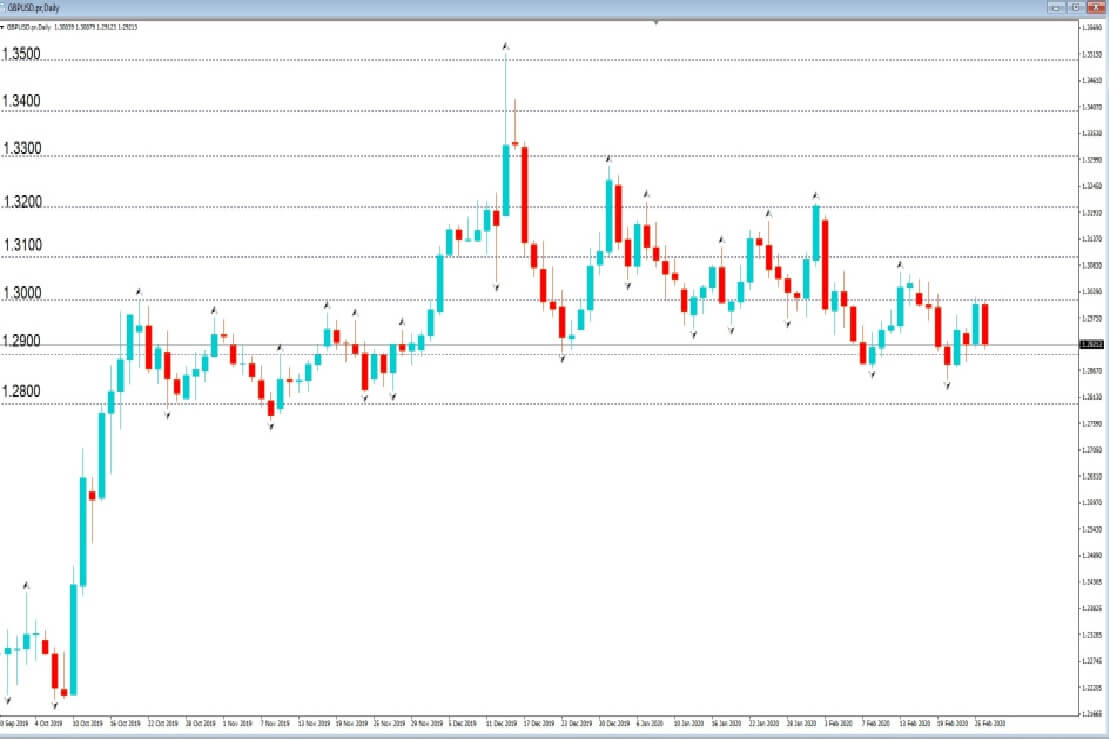
Example A is a pretty standard screenshot that you will see on any of the forex pairs. We have two key horizontal lines A&B and where they would typically be a big figure, or whole numbers, such as 1.2800, which you might see in cable currently, or 1.100, which you might see in EURUSD.
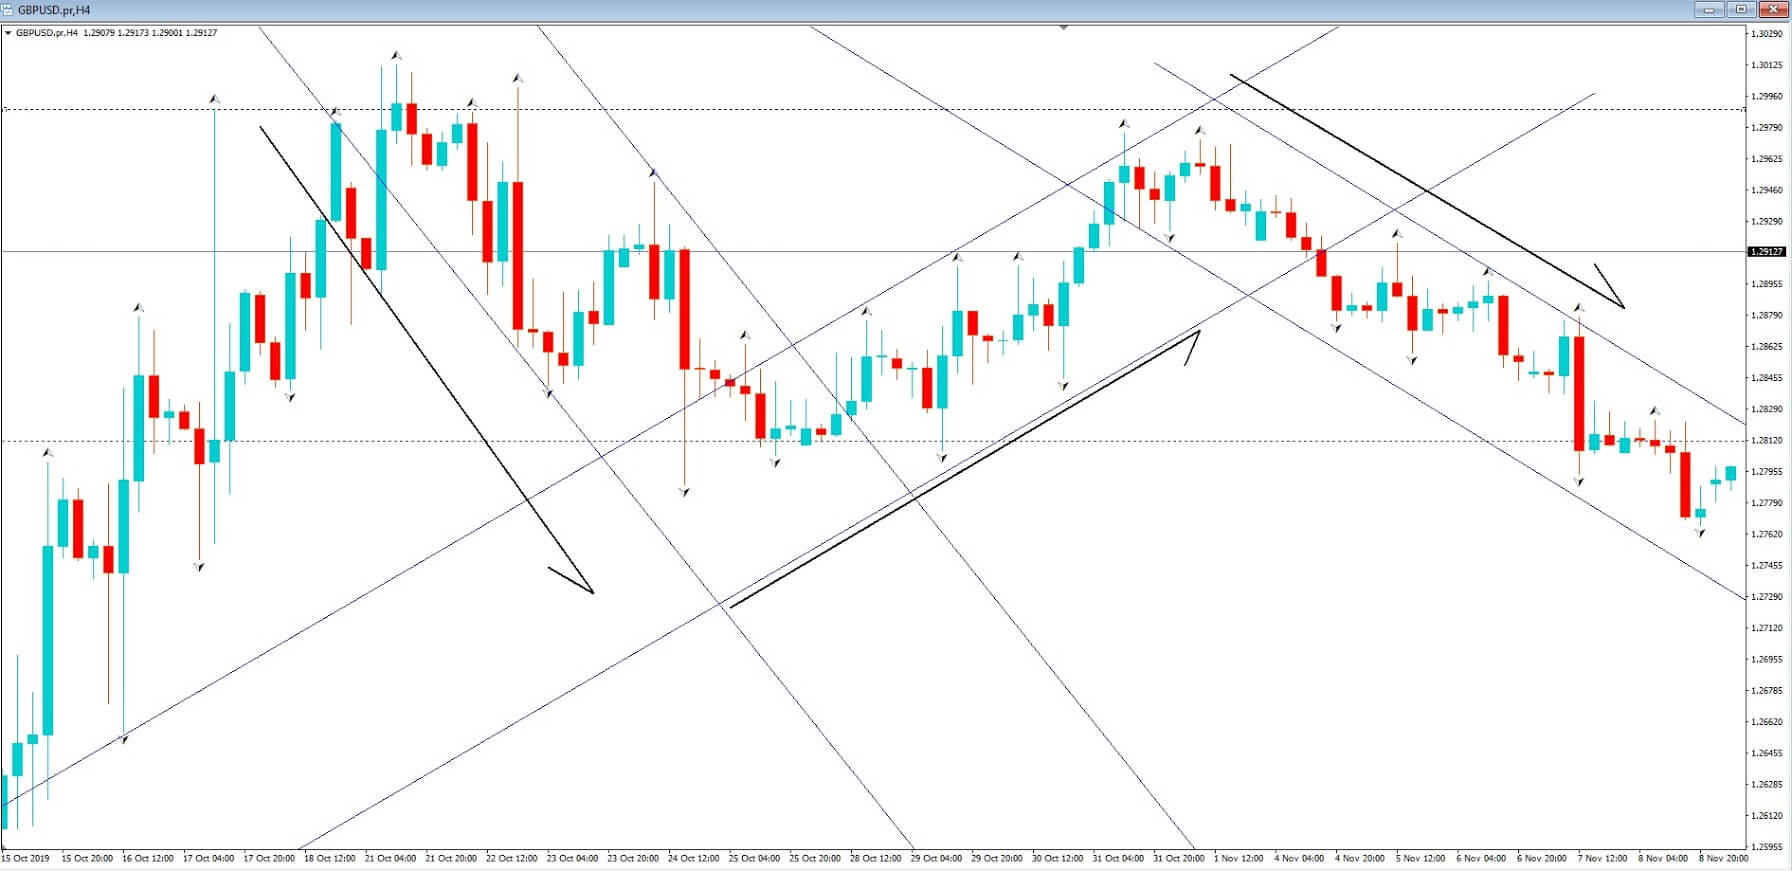
In our chart, we can see that price action has been moving between the two key levels in a series of channels. At position 1, price is rejected and moves lower to position 2 in a channel, and is rejected by the lower key level and moves higher in our second channel from position 2 to position 3.
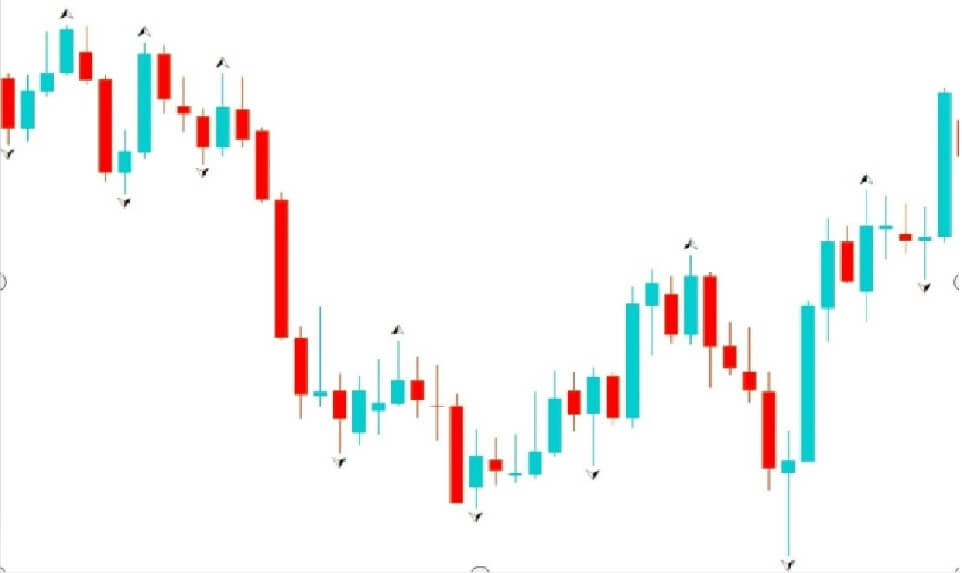
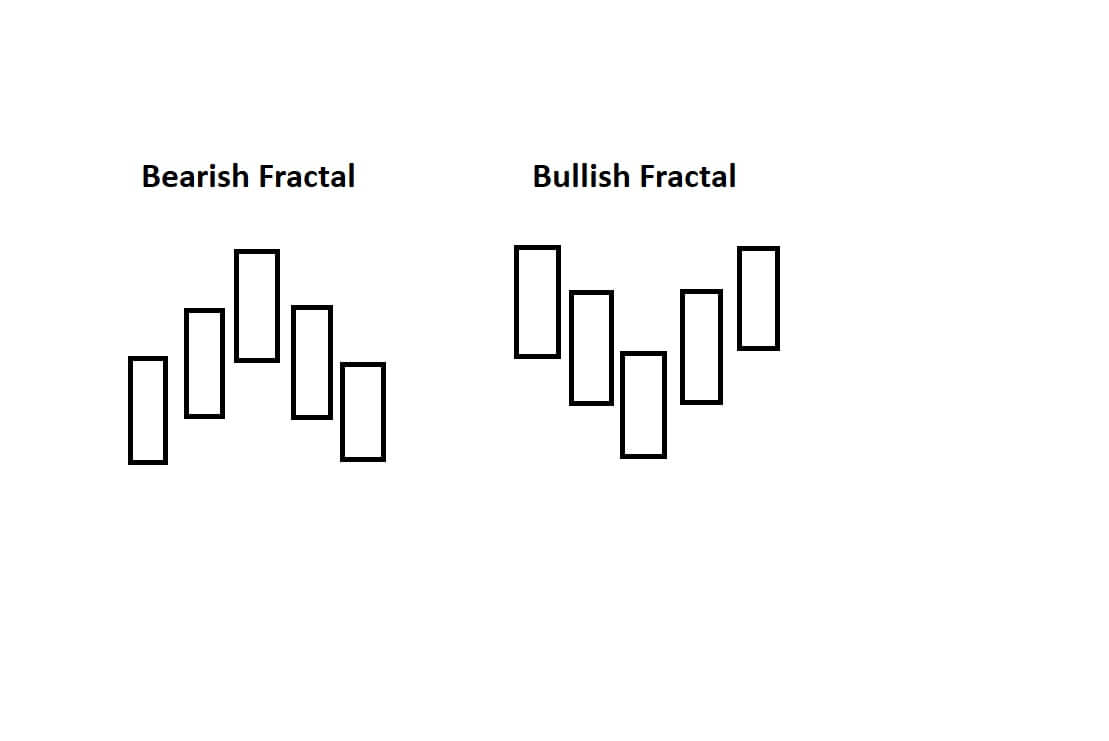
Critically, price fails to reach the key level or line A. Secondly, we have a Fractal reversal signal suggesting price will move lower and we have what appears to be a third lower channel forming to the downside and where the line of support between move 2 to 3 has been breached by our last bearish candlestick on the chart.
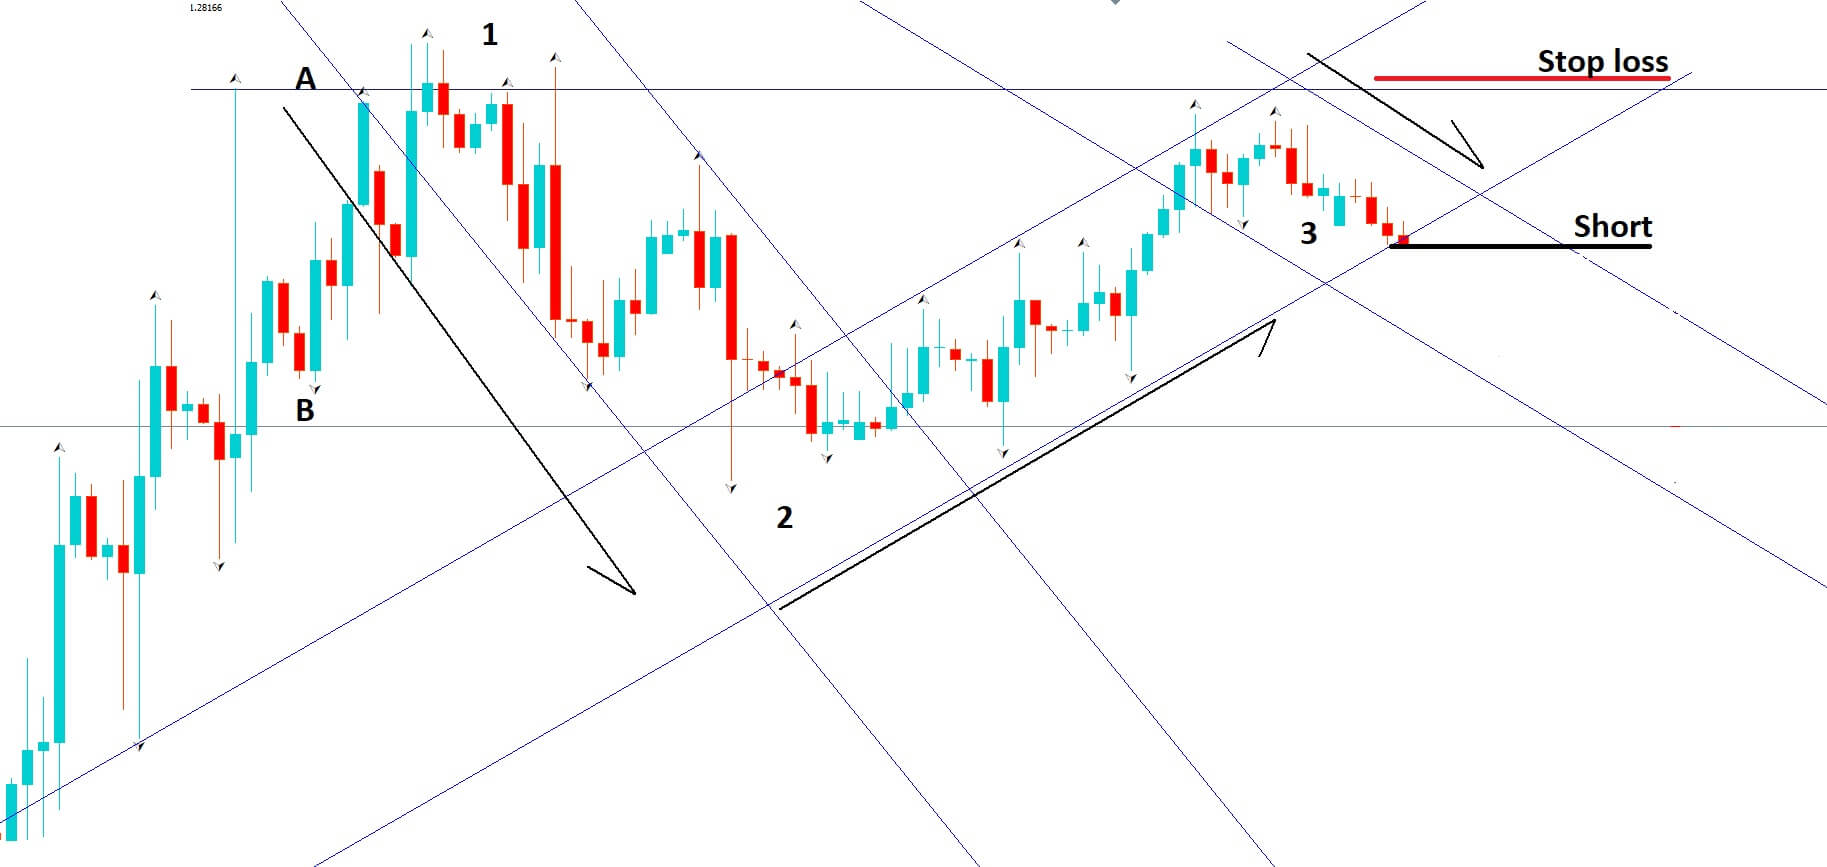
We are going to implement our strategy at this point. The first and immediate thing that we need to do do is to enter a short position, as shown in example B.

Example B


We will need to put our stop loss a couple of pics above our key level, as defined by line A, which has proven to be an area of resistance.
So at this stage, we believe that we have done everything humanly possible to analyze the comings and goings of this trade, and we believe we have taken all necessary steps to pick the correct trade and gone short. However, as we know, anything is possible in the forex market. And that is why we intend two support our trade with a secondary back up or insurance policy trade if you will, and we can show you how that is set up now in example C.

Example C

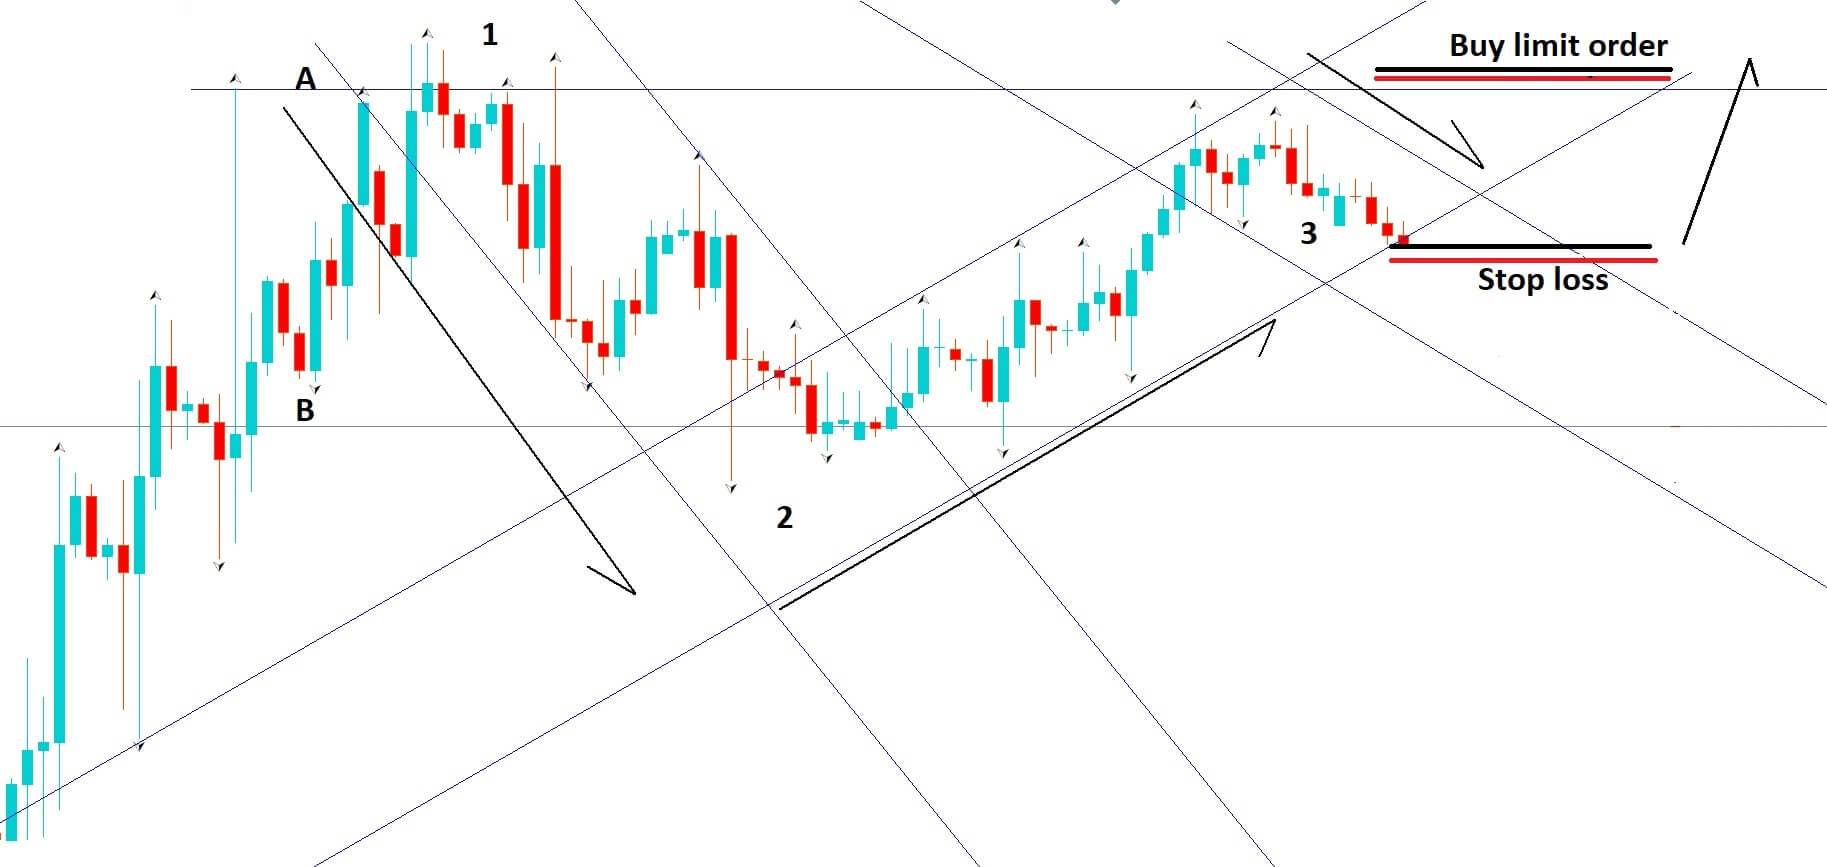
Should price action reverse and trigger our stop loss we will enter a buy limit order, at, or slightly above the same point as our stop loss on the sell trade, in order to try and capture the reversal in price action and possible continuation upwards in the original trend line between position 2 and 3.

We will also enter a stop loss a couple of pips below our entry-level of the original short trade. Because if the price does move higher, our line of support between positions 2 and 3 will have been confirmed as a line of support. We must also place a take profit level with an aim to at the very least break even from our first losing trade.
No strategy is without risk. The forex market, like every other market, can turn direction in an instant, and never more so than in the current climate, where markets are tiptoeing nervously around the Coronavirus epidemic. As such, we suggest you try and adapt the methodology to your own trading style, or practice the above strategies on a demo account until you have honed your skills before trying it on a real money account.

Categories
Forex Daily Topic

Adapt yourself to the FX Market!

From its very inception. the FX market was devised to guarantee that market insiders had an important advantage over retail traders. Because of the nature and lack of regulation, the FX market is, essentially, an unfair market for retail and non-pro players.

The Playing Field

Agustin Silvani, the author of Beat the Forex Dealer, explains in his book that since information is vital to succeeding in this market, “A player’s positioning on the FX food chain depends on his/her access to information and speed, and with no central clearing exchange, it can be difficult for nonprofessionals to gain access to this information and come up with an accurate view of the market.  

He also states that practices deemed illegal in traditional financial markets are regarded in the FX field as part of the game. Practices such as insider trading, front running, and price shading (adding pips to the current price if in an uptrend or subtracting them on a descending move) are commonly seen in FX with no legal repercussions.

There is no government or central trade book to compare trades, so large institutions are free to do whatever they want to their customers. An FX broker or dealer can quote any price it wishes.

The Dealers

If big banks were a car factory, an FX Dealer would be the salesman, selling the banks’ production. Hence, you need to understand how FX dealers make money to adapt and succeed. 

The dealer’s primary axiom is markets rarely move one-way only, especially in intraday timeframes, which are ranging 80 percent of the time. That means dealers, having bug pockets, will fade strong move, knowing that the price will eventually come back and make a profit. Sometimes they can lose money, but having deep pockets will help them stand considerably more than customers that are deep in the margin. That means that most of the time, the dealer takes the other side of its customer.

The Stones on the Road 

Non-transparent pricing

The FX market is not a centralized market on which the traders have direct access to a general order book. Therefore quotes are subject to manipulation, and traders trusting just the price shown on its MT4 chart cannot be sure if the price is fair or sharded.

Over-leveraging 

Many retail brokers boast about their leveraging ratios as if it were an advantage to traders. Instead, overleverage is the main reason for the blowoff of traders’ accounts.

 Trading against its clients

This practice is widespread among unscrupulous retail dealers. Retail trade sizes are small to be directly sent to the FX mainstream flow. Thus the broker takes the other side of the trade. The broker may wait for enough flow to send it out or simply hold the position and effectively trade against their customers. No dealing desks are the same, but dealers replaced by computers.

Unfair practices

Some retail brokers not only do sharding, encourage overleverage and trade against their customers, but also deny services, complicate trade executions, and finally throw our successful traders since they feel they lose money against them. Cases of denial of withdrawal after successful growth of an account were common on the binary options broker business, but also some examples of allegedly Australian-regulated FX brokers happened. Fortunately, these cases are not the general rule, and there are plenty of fair brokers to choose from.

How to Fight Back

Different price feeds

  • Use a backup feed service such as Tradingview, which is free, fast, and unbiased. Your second feed is like a second eye to the market that confirms your broker’s prices. 

Keep detailed records of your activity

If a trader finds the order is not rightly filled, it must show evidence to the broker. The lack of evidence can defeat a legitimate claim.

Take screenshots of all your trading actions, entries, exits, and any important market activity like strange price spikes not seen in your second data feed.

Check the costs of trading

Sometimes, in some trading pairs, the costs of trading are so high that it takes for hours of activity just to cover the costs. Be smart and don’t trade illiquid and high-spread pairs. 

Use your trading platform only to enter and exit your positions

  • Use limit orders and mental stop-loss levels. Do not give any information about your strategy away.

Money Management

Do not overleverage. We have already said it in our past articles. Don’t be impatient and limit your risk to a percent of your account. Start by 0.5 percent on each trade. After you have the feeling about what that means in terms of drawdown, move it up to 1 percent and, again, see what does it feel, especially on losing positions. If, after some time, you feel you can withstand more drawdown, go on and move it to 1.5 percent and repeat the process.

How much drawdown can be expected?

That depends very much on the percent of losers of your system and the risk size. As an example, if your system is right 60 percent of the time, it is wrong 40 percent of the trades. Typically, there is a 0.01 percent chance of ten consecutive losses. Thus, if we consider ten times the usual risk our max drawdown, we see that 0.5 percent risk on each trade would result in a 5 percent max drawdown, whereas, 1.5 percent risk would mean a trader will sometimes withstand 15 percent drawdown.

Overleveraging

Consider leverage as a tool to adjust your position, but also is the leading cause of failure on FX. Thus limit your trades to 5X leverage on any position.

Diversification

Trade multiple uncorrelated pairs, so losses in one lot can offset the risk in another one. 

Trading

Use technical charts as a guide to where the price goes, but take into account what we have said at the beginning of this article: learn how your broker makes money. Think. 80 percent of the time, the intraday market move in ranges, so look for overbought and oversold prices and fade.

Follow the flow of the market

Let the market tell you the way. Use mental stop points and follow the volatility direction, but don’t chase the trade. Let the price come to your desired levels.

Reward-to-risk of two or more

Use reward to risk ratios over 2 as a way to protect your system of a drop on the percent of winners. A RR higher than 2 guarantees you’re profitable if one over three trades succeed.


Further reading: Beat the Forex Dealer – Agustin Silvani 

 John Wiley & Sons Ltd.

Categories
Forex Market Analysis

Daily F.X. Analysis, March 10 – Top Trade Setups In Forex – Choppy Trading In Play! 

The U.S. Dollar Index sank 0.9% on the day to 95.07, down for a third straight session. Investors were speculating a steep cut in U.S. interest rates, though the expectations retreated as President Donald Trump announced that he would announce “very dramatic” actions to support the economy. The Dollar Index rebounded to 95.33. The European Commission will post final readings of 4Q GDP (+0.9% on-year expected).

France’s INSEE will report January industrial production (+1.8% on month expected) and manufacturing production (+1.7% on month expected).

Economic Events to Watch Today  


EUR/USD – Daily Analysis

The EUR/USD rose 1.1% to 1.1410. Official data showed that German industrial production grew 3.0% on month in January (+1.7% expected). The coronavirus breaks in China and South Korea seem to be lagging, as countries outside in the world embrace drastic steps to try and stamp out the virus. 

In Italy, where 16 million people in Lombardy and different sections of the north are presently below quarantine, there were 133 life losses announced on Sunday, drawing the sum to 366. More than 7,000 people in the country have been verified to have the disease. 

In Iran, there were 49 new deaths. Some 194 people have now expired from COVID-19 there. Although the latest numbers from China and South Korea suggest, the virus seems to be diminishing in northeast Asia.

The ECB is expecting to deliver a rate cut to control the economic fallout from the deadly coronavirus outbreak. Moreover, an unexpectedly bigger decline in the Eurozone Sentix Investor Confidence for March, a lead indicator, also continues to burdening the EUR currency.

Looking forward, the trader’s eyes remain on the Eurozone final GDP while the general market bias and USD dynamics will proceed to play a pivotal role.

Daily Support and Resistance

  • S1 1.1196
  • S2 1.1315
  • S3 1.1384

Pivot Point 1.1434

  • R1 1.1503
  • R2 1.1553
  • R3 1.1672

EUR/USD– Trading Tips

The EUR/USD is trading with a bullish bias around 1.1445. The EUR/USD seems to extend the bullish trend in the wake of completing the 161.8% and 261.8% Fibonacci extension level, out of which 161.8% has already been achieved until 1.1258. 

At the moment, the EUR/USD is trading at 1.1458, and bullish breakout of this level can extend buying until 1.1610 level. On the lower side, the EUR/USD may find support around 1.1400 and 1.1296. The RSI and MACD are in the buying zone as the MACD’s histograms are over zero, the bullish zone. Consider taking buy trades above 1.1380.


GBP/USD– Daily Analysis

The GBP/USD gained 0.3% at 1.3083.to hit its highest mark in a week to the greenback. This came after the forecasts waned for an urgent Bank of England rate cut to follow this week’s emergency movement from the U.S. Federal Reserve to accommodate coronavirus damage. 

The U.S. official data revealed that the economy added 273,000 non-farm payrolls in February (+175,000 expected), and the jobless rate dropped to 3.5% (3.6% expected). Average hourly earnings were up 0.3% on the month (as expected). 

January trade deficit was posted at US$45.3 billion (US$46.2 billion expected), and wholesale inventories (final reading) fell 0.4% on the month (-0.2% expected). Despite mixed economic events, the U.S. dollar is getting weaker and driving the GBP/USD pair higher. 

The GBP/USD currency pair buyers are still hopeful because the BBC reports a bumper £5billion boost for British exports by the first post-Brexit budget, which is scheduled to release on Wednesday. Chancellor Rishi Sunak will also announce supportive news for salaried employees in his first budget.

Looking ahead, due to the few economic data/events on the economic calendar, all traders keep their eyes on COVID-19/Brexit headlines for taking fresh directions.

Daily Support and Resistance

  • S1 1.278
  • S2 1.2946
  • S3 1.3023

Pivot Point 1.3111

  • R1 1.3188
  • R2 1.3277
  • R3 1.3443

GBP/USD– Trading Tip

The GBP/USD is showing some severe bullish moves in the wake of a weaker dollar and strong Sterling. The GBP/USD soars to trade around 1.3060 and continuation of a bullish trend can extend buying until 1.3160 and even higher. The GBP/USD has formed a solid green candle on the 4-hour timeframe, which may help drive further buying in the Sterling. 

The MACD is consistently forming bullish histograms over zero points, supporting the buying trend in the GBP/USD pair. Let’s consider buying over 1.3025. 


USD/JPY – Daily Analysis

The USD/JPY currency pair stops its bearish rally and hit the high of 105.00 mainly due to risk sentiment improved in the wake of U.S. stimulus expectations. The hopes of the U.S. stimulus put a bid on the U.S. equity futures, treasury yields. 

At the press time, the USD/JPY currency pair is currently trading at 104.78 and consolidates in the range between the 102.02 – 105.05. The U.S. Vice President Mike Pence took U-turn from his Friday’s comments and signaling a lack of enough testing kits in the labs.

The USD/JPY currency pair recovered from the lowest since late-2016 mainly because U.S. President Donald Trump’s suggested to ‘major’ economic measures in order to control coronavirus (COVID-19) triggered the risk-on.

Looking forward, traders are now keeping their eyes on the U.S. President Trump’s real means to tame the adverse implications of the virus. However, the significant risk recovery could only occur if there is news of any cures.

Daily Support and Resistance

  • S1 98.73
  • S2 100.42
  • S3 101.35

Pivot Point 102.12

  • R1 103.05
  • R2 103.81
  • R3 105.5

USD/JPY – Trading Tips

The USD/JPY is trading at 104.200, testing the bearish channel, which supported the Japanese yen at 104.400. The increased reduced demand for safe-haven assets is driving strong bullish correction in the USD/JPY currency pairs. 

The USD/JPY has closed two consecutive bullish candles, which are followed by the bearish breakout setup and suggesting odds of further bullish bias until 104.650. 

Below 104.550, the selling trend continuation can lead the USD/JPY prices towards 101.670 whereas, further buying over 104.550 can lead the USD/JPY to 106.250 area

All the best for today!  

Categories
Crypto Market Analysis

Daily Crypto Review, Mar 10 – Crypto markets consolidating, Bitcoin still under $8,000

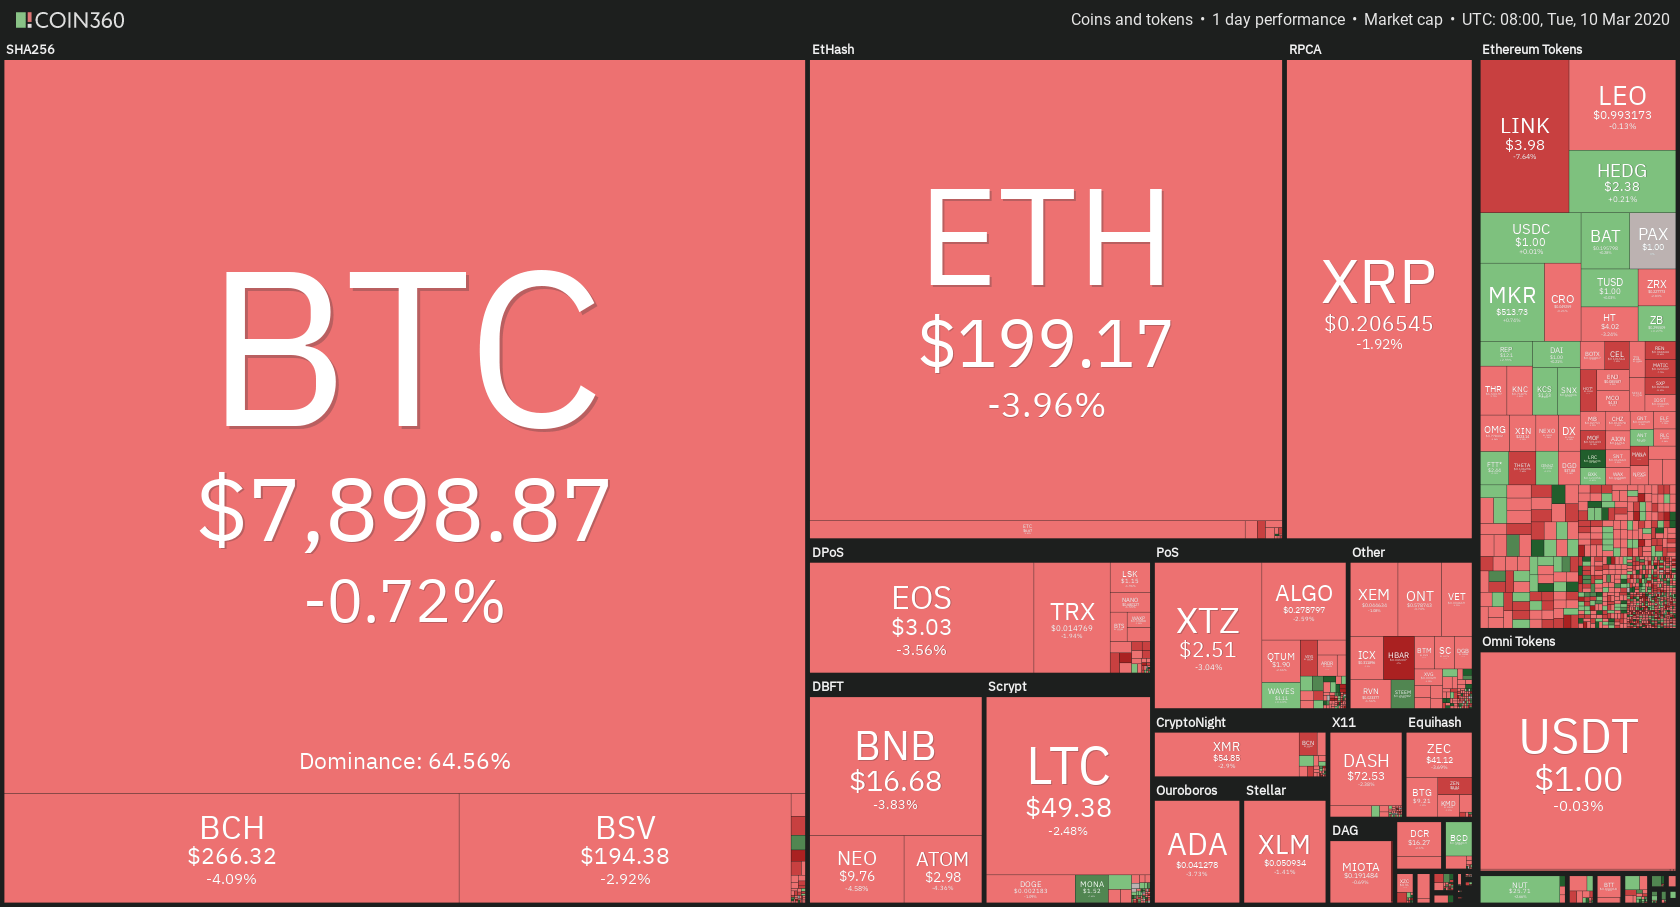
The cryptocurrency market spent the past 24 hours consolidating after a severe price drop. Bitcoin is currently trading for $7,898, which represents an 0.72% decrease on the day. Meanwhile, Ethereum lost 3.96 % on the day, while XRP lost 1.92%.

Loopring took the position of today’s most prominent daily gainer, with gains of 16.05%. On the other side, Swipe lost 12.25% on the day, making it the most prominent daily loser.

Bitcoin’s dominance managed to increase slightly over the past 24 hours. Its value is now 64.56%, which represents a 0.37% difference to the upside when compared to yesterday’s value.

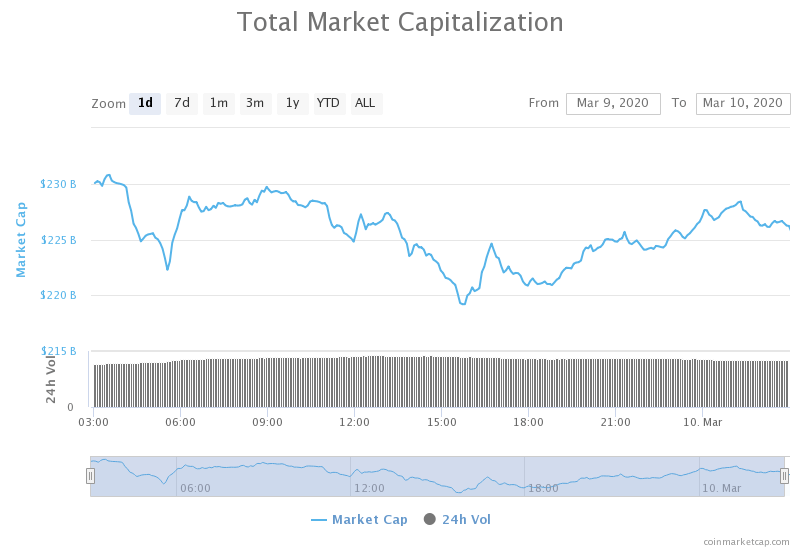
The cryptocurrency market capitalization maintained its levels over the past 24 hours. It is currently valued at $225.53 billion, which represents a decrease of $7.18 billion when its value is compared to the value it had yesterday.

What happened in the past 24 hours

The VIX volatility index, one of the stock market’s main risk indicators, showed a value of 55 on March 9. This is the highest level it was on since 2009. In the meantime, the international oil price went all the way down to $36.20, down 20% from the previous session.

The Dow Jones tanked 6.9% as it was heading for its biggest daily loss ever to be recorded. On the other side, the UK’s FTSE went down 7.7%. Japan’s Nikkei ended up 5.1% below Friday’s close.

Honorable mention

Libra

Marc Bhargava, the co-founder of Tagomi, a company that has recently joined the Libra Association, spoke about the current market cryptocurrency downturn. Since Tagomi is well connected with some of the biggest exchanges as well as some of the biggest crypto traders, he may see the market movement from another perspective.

Bhargava believes that cryptocurrency is not a safe haven asset. This goes against the beliefs of other analysts. “BTC as well as crypto are currently a risk-on asset, more alike tech and VC rather than gold.”

_______________________________________________________________________

Technical analysis

_______________________________________________________________________

Bitcoin

Bitcoin’s price got destroyed over the weekend. After falling to the $8,000 levels, many analysts thought that this price level would hold up. However, Bitcoin continued its drop and ended up stopping at the $7,760 support level. The price bounced there and Bitcoin is now trading in a range between the support of $7,760 and the $8,000 resistance level.


Bitcoin’s volume decreased as the price began to rise, while its RSI level is still in the oversold area.

Key levels to the upside                    Key levels to the downside

1: $8,000                                           1: $7,760

2: $8,650                                           2: $7,420

3: $8,825                                            3: $7,085


Ethereum

Ethereum, just like Bitcoin, went into consolidation mode. Its price started to recover a bit earlier than Bitcoin’s but suffered another bear move, which ended at the $193.6 support level. Ethereum has recovered since and is currently trading above the $198 support level.


Ethereum’s volume decreased greatly since it stopped the downturn, while its RSI level left the oversold area.

Key levels to the upside                    Key levels to the downside

1: $217.7                                             1: $198

2: $225.5                                            2: $193.6  

3: $240                                                3: $185


Ripple

XRP ended up consolidating and finding anchor points as well in the past 24 hours. The third-largest cryptocurrency found a bottom to the downturn at the $0.1985 level and quickly recovered to above $0.2 levels. It is currently stable and trading just above this support line.


XRP’s volume decreased greatly once the move to the downside stopped, while its RSI level just left the oversold area and is hovering around 34.

Key levels to the upside                    Key levels to the downside

1: $0.221                                            1: $0.2

2: $0.227                                            2: $0.1985

3: $0.235                                             3: $0.19

Categories
Forex Videos

How To Achieve Free Trades & No Risk Double Up Trades In Forex

Free trade and a no-risk double up trade

In a perfect trading world, we would have no risk trades and be able to double up on those trades if we were 100% confident that price would continue in the direction that our technical charts said they should. Of course, there is no perfect world in trading, and absolutely anything can happen at any time, and we have to guard against those eventualities. However, with some careful preparation, we can protect winning trades from loss, and even double up on those trades, with little or no risk, if we prepare carefully.

Example A


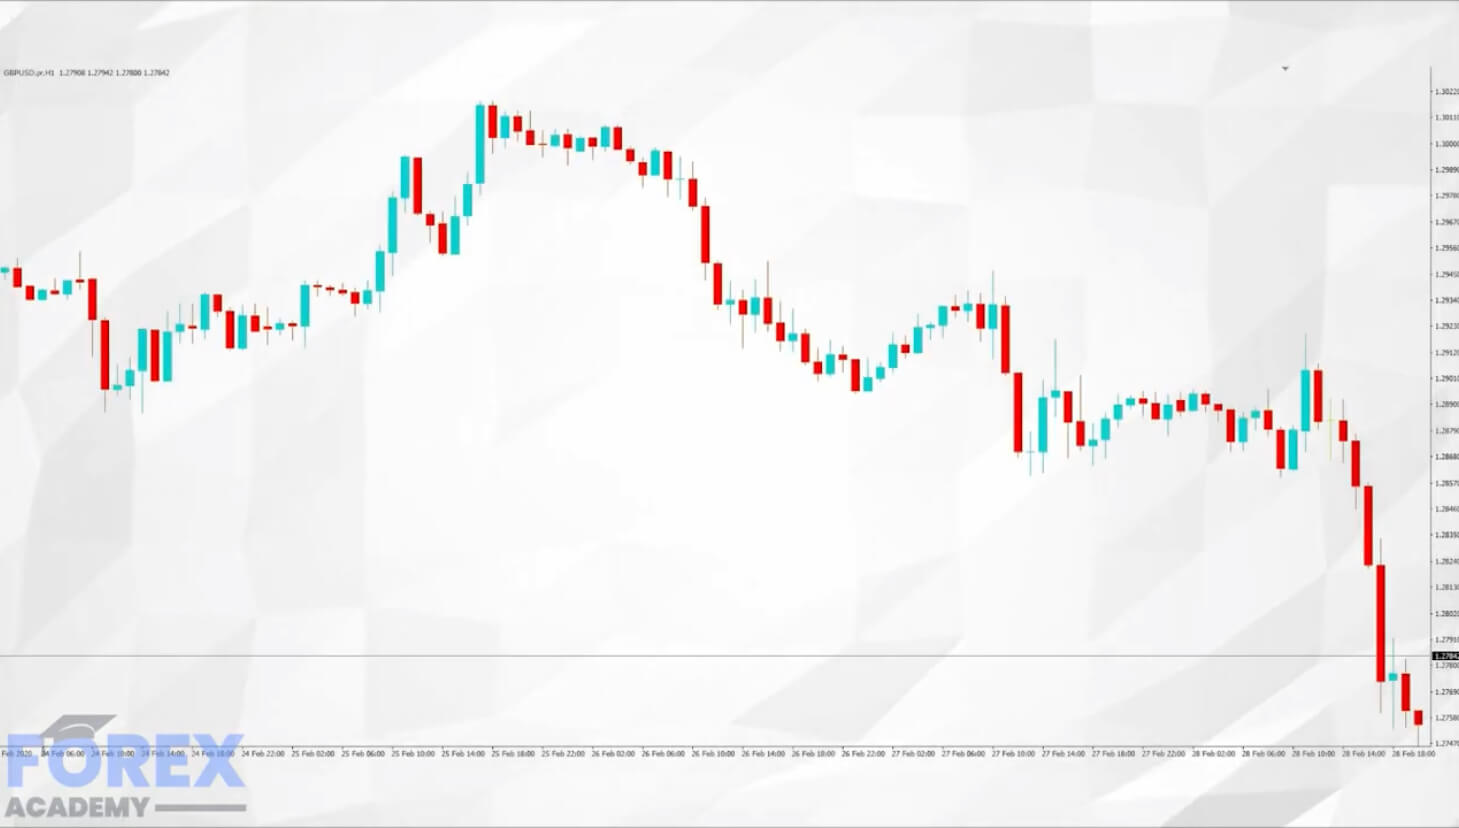
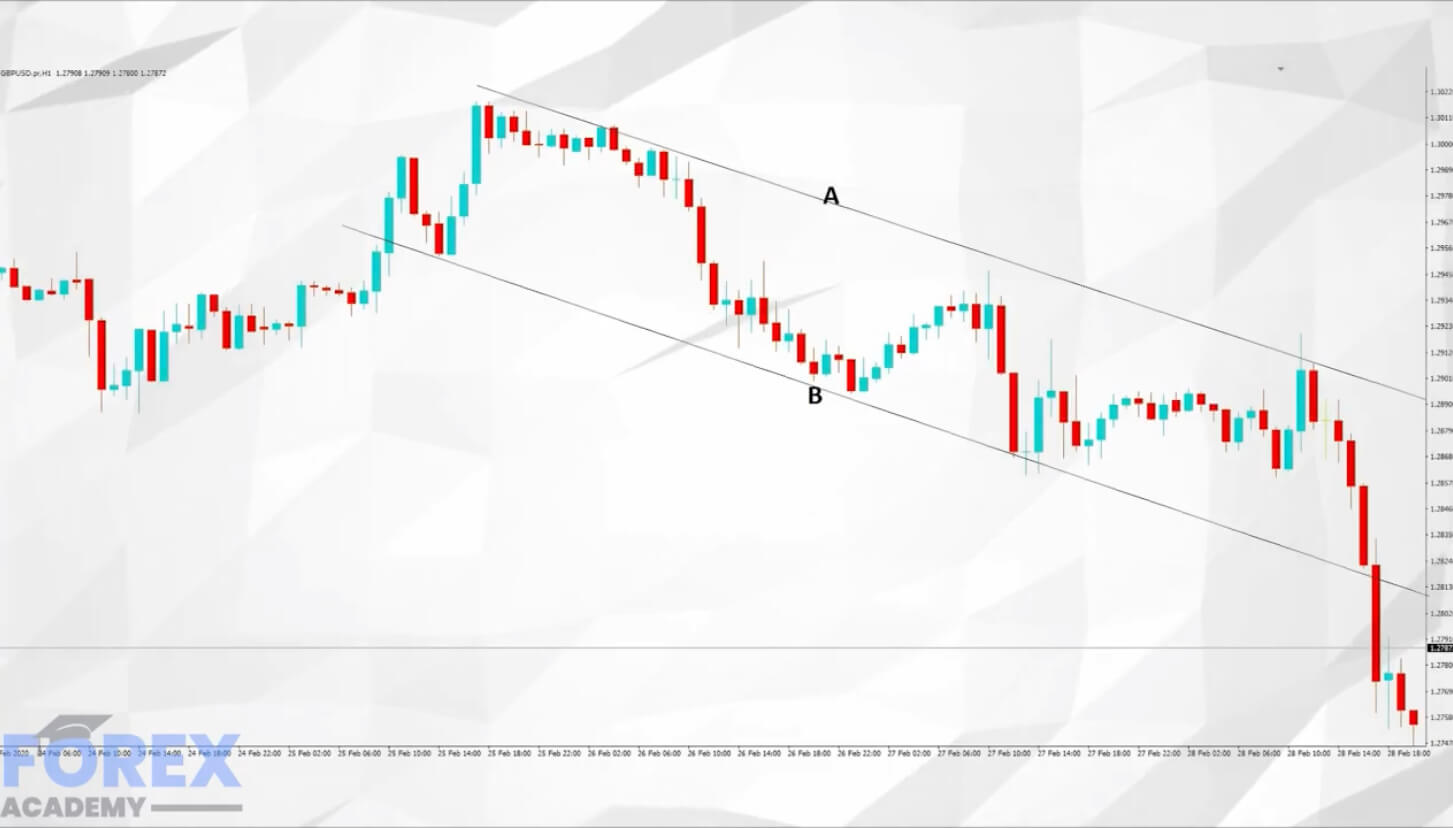
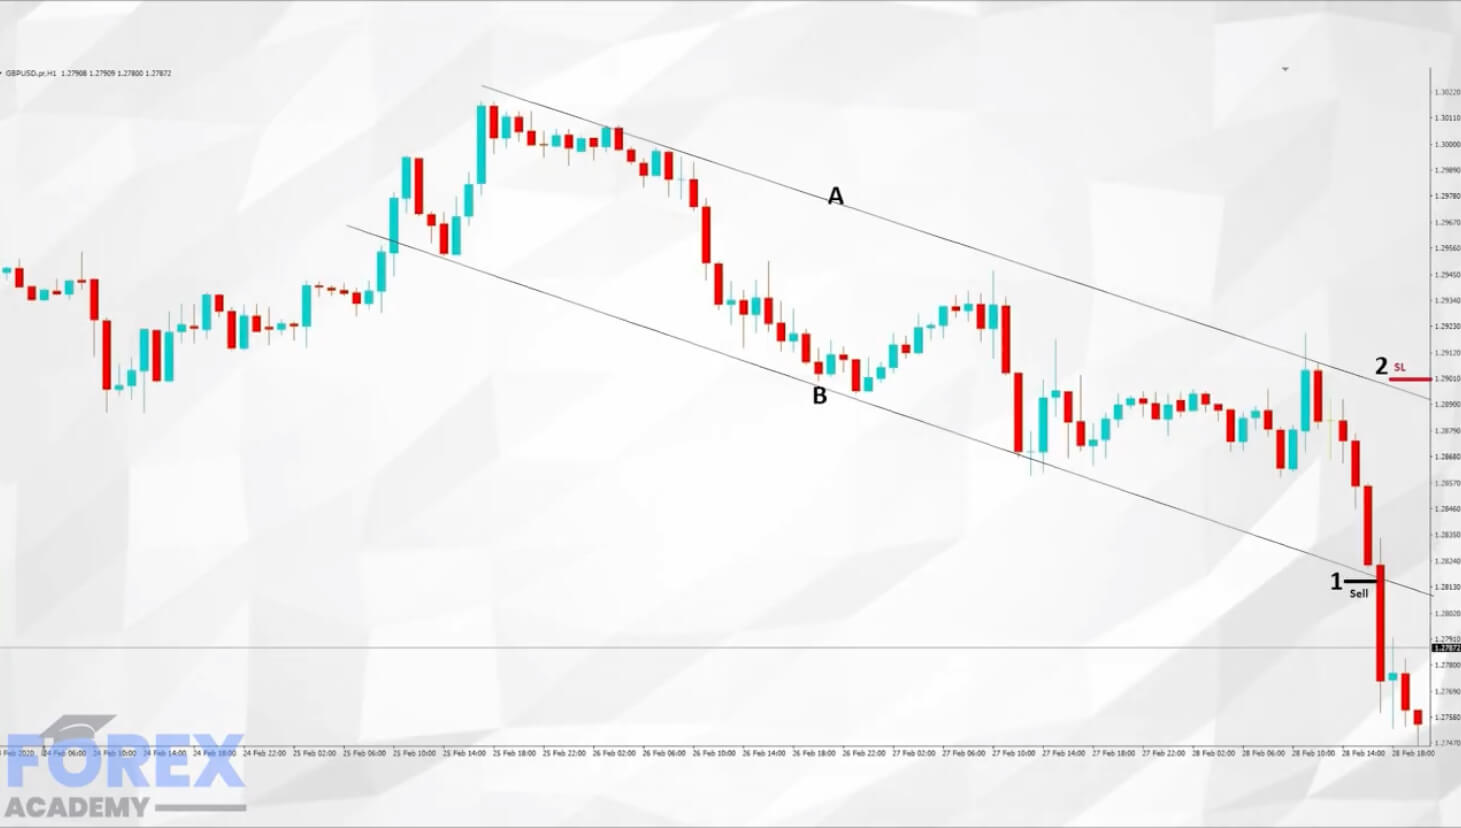
Example A is a 1-hour chart of the GBPUSD the pair. On the face of it, it looks like price action reached a plateau in the middle of the chart and then gradually begins to fall. We are in a bearish descending channel.

Example B


Example B, backs up this theory with two simple descending trend lines. The trend lines A and B are acting as an area of resistance and support for price action and where lower highs and lower lows are clearly evident. Therefore a breach higher than trend line A would be considered a bullish move, and a more likely breach of trend line B would be considered as a bearish move.

Example C


In example C price action has breached trend line B, and this move is associated with bearish candlesticks just before the breach. We have chosen to sell at position 1 with a stop loss at position 2 in case price action reverts higher. Should it do so, we would need to adjust our stop loss lower along the descending line of resistance.

Example D


In example D, and in line with our free trade promise, price action has moved lower, and so we have put a protective stop (PSL) just below the entry point of this trade by a couple of pips. No matter what happens now, we cannot lose money on this trade. It is effectively a free trade.

Example E


In example E, price action has continued to fall. Let’s say by 20 pips from our original sell entry. We can sell this position again using the same amount of leverage as trade 1, with a stop loss of 10 pips; and by bringing our protective stop from trade 1 lower and placing it in the same position as our second trade stop-loss, we have effectively doubled up on this trade with no risk of loss. So if trade two is stopped out at minus 10 pips, it will be netted out by trade one which gained 10 pips, minus your spreads.

As price action continues to fall lower, we simply bring our protective stops lower in order to maximize our profit.

Categories
Forex Basic Strategies

Trading The New York Breakout Forex Strategy

Introduction

Forex is a 24 hours market, and it is open five days a week. So there are a hell lot of opportunities this market offers to the traders across the world. However, to make more profits and be successful in this market, we don’t have to trade 24 hours on all the days it is open. On any given day, the Forex market shuts down in some continents and opens in some other continents. This leads to the opening and closing of different Forex sessions.

The two most essential sessions are the New York session and the London session. Most of the traders across the globe prefer trading the New York session because, in this session, instruments often have less spread. Also, the markets are quite volatile during this session, and prominent players prefer making most of the significant trades in this session only. In this article, let’s understand different trading techniques to catch the more notable moves that occur during the opening of the New York Session.

We will also be trading the Forex market when the New York session overlaps with the London session. At this point, the volatility will increase furthermore as it is an overlap of the two biggest Forex sessions. The idea is to trade in the direction of the larger players. For each country, the New York session opens at different times. For instance, if you are trading the Forex market from England, the US Session opens for you at around 13:00 GMT. Likewise, if you are trading the market from India, the US session begins at 18:30 IST.

If you are not sure of the exact time of the opening and closing of different trading sessions, you can follow the below link to accurately identify the opening and closing of the New York session according to your local time.

|Forex Time Zone Converter|

Breakout Trading Strategy

During the New York session, all the major, minor, & exotic currency pairs move very fast. Some traders believe that we must trade the currency pairs according to the corresponding session. For example, in the Asian session, we must trade only AUD, NZD, and JPY. In the London and Frankfurt session, we must only trade GBP, EUR, & CHF. Finally, in the New York session, go for USD and CAD currency pairs.

There might be a valid reason behind this, but this shouldn’t be taken seriously. Currency pairs do not move according to the session. Instead, they move according to market circumstances. So in the New York session, we can choose any pair, but we must follow the below rules in order to trade this session profitably.

  1. Before the opening of the New York session, find a currency pair that is in a strong uptrend.
  2. Price action must be held at the major resistance area.
  3. Wait for the breakout to happen in the New York Session.
  4. Let the price action hold above the breakout.
  5. Go long.
  6. Stop-loss below the breakout line.
  7. Take-profit must be at the next major resistance area.

The same is vice-versa for a currency pair if the market is in a strong downtrend.

Buy Example

In the below image, we can clearly see that the EUR/AUD Forex pair is in a strong uptrend.

We can see the price breaking out at the opening of the US session. This indicates that the big players are ready to take over the market. The price action then holds above the breakout line, and this suggests that the breakout is real. Hence we can anticipate buy trades in this Forex pair.

Entry, Stop-loss & Take-profit

We have gone long in this pair as soon as the prices started to hold above the breakout line. The stop-loss is placed just below the support line. We can go for smaller stops when the price action respects the breakout line as it essentially indicates the opposite party giving up. Overall, it was swing trade, and we book the whole profit at the higher timeframe’s resistance area. This entire trade resulted in 150+ pip profit.

Most of the traders believe if they activate the trade in the New York session, they must close the trade in the New York session only no matter what. That’s just another myth. It is always advisable to milk the markets when there’s an opportunity to do so.

Breakout Trading Using Bollinger Bands

In this strategy, we are going to use the Bollinger Bands to trade the New York session. Bollinger Bands, as most of us know, is a quite popular indicator created by John Bollinger. This indicator consists of three lines, which are named as middle, upper, and lower band. These bands expand and contract according to market volatility. Most importantly, this indicator works very well in all types of market conditions.

The below image represents the NZD/CAD Forex pair, which was in an overall uptrend. The price action breaks the major resistance level at the opening of the New York session on the 11th of February 2020. After the breakout, prices started to hold above the breakout line, which tells that the breakout is real, and any long trade anticipated from here will lead to a fruitful result.

Entry, Stop-loss & Take-profit

In the below image, you can see that we have taken a buy entry in the 2nd half of the New York session. Sometimes, the price action breaks the major S&R level in the morning, and it goes sideways for a while before blasting out in the evening. As professional technical traders, we must trust our analysis and be patient enough even when the market is not going in the anticipated direction. We must always let the price action to tell us what is going to happen next and act accordingly.

So right after the breakout, the momentum of sellers is very weak (can be seen in the above chart). So the stop-loss can be placed just below the breakout line. The take-profit was at the higher timeframe resistance area. At first, prices failed to break the resistance line, and during the second try, prices again failed to go higher. The failed second attempt is a clear indicator to close our winning position. Overall it was a good trade, which gave us nearly 90+ pips in just a couple of hours.

Conclusion

Both of the strategies mentioned above are simple and straightforward. Did you observe that in both of our examples, we didn’t choose USD pairs? Instead, we went for minor pairs, and both of the pairs performed really well in the New York session. This proves that it is not about the currency pair of that particular session. It is about what is happening in that pair. It is critical to follow all the rules first and then make a trading decision. It is always advisable to try these strategies on a Demo account and then use it in the live markets. Happy Trading.

Categories
Forex Assets

Analyzing The USD/BND Forex Currency Pair

Introduction

USD/BND is the abbreviation for the US Dollar against the Brunei Dollar. Brunei is located on the Asian continent, and this pair is classified as an emerging currency pair. In the USD/BND, USD is the base currency, and BND is the quote currency.

Understanding USD/BND

The market price of this currency pair specifies the value of BND equivalent to one USD. It is quoted as 1 USD per X BND. For example, if the value of this pair is 1.3711, then these many units of the quote currency (BND) are required to purchase one unit of the base currency (USD).

Spread

The difference between the bid and the ask price is called the spread. The spread varies from broker to broker and also by execution model used.

ECN: 5 pips | STP: 8 pips

Fees

A fee is a synonym for commission. This is similar to the one that is paid to the stockbrokers. Below is the fee on ECN and STP brokers.

Fee on ECN – 0 pips | Fee on STP – 5-10 pips

Slippage

The difference between the price requested by you and the price you actually received from the broker is called slippage. There are two reasons for slippage to place:

  • Market volatility
  • Broker’s execution speed

Trading Range in USD/BND

A trading range is a tabular representation of the minimum, average, and the maximum volatility of this currency pair. And these values help in determining the profit/loss of a trade in a given timeframe. Hence, this is a great risk management tool for traders.

Procedure to assess Pip Ranges

  1. Add the ATR indicator to your chart
  2. Set the period to 1
  3. Add a 200-period SMA to this indicator
  4. Shrink the chart so you can assess a large time period
  5. Select your desired timeframe
  6. Measure the floor level and set this value as the min
  7. Measure the level of the 200-period SMA and set this as the average
  8. Measure the peak levels and set this as Max.

USD/BND Cost as a Percent of the Trading Range

The cost as a percent of the trading range is the representation of the cost variation in a trade for different volatilities are timeframes. This variation is represented as a percentage. The magnitude of these percentages depicts the highness and lowness of a trade.

ECN Model Account

Spread = 5 | Slippage = 3 |Trading fee = 3

Total cost = Slippage + Spread + Trading Fee = 3 + 5 + 3 = 11

STP Model Account

Spread = 8 | Slippage = 3 | Trading fee = 0

Total cost = Slippage + Spread + Trading Fee = 3 + 8 + 0 = 11

The Ideal way to trade the USD/BND

Trading the USD/BND is simple. This pair is not so volatile, like the other emerging pairs. Moreover, the spreads are low too.

From the above tables, we can see that the percentage values are pretty high in the minimum column, and comparatively lower in the max column. This means that the costs are high for low volatile markets and low for high volatile markets. So, traders who need high volatility may enjoy low costs. And trades who want to minimize their risk and trade low volatile markets will have to bear higher costs. Finally, traders who need a balance between the two may trade when the volatility of the market is around the average values. This will ensure the equilibrium between volatility and costs.

Moreover, there is a way through which you can cut off the slippage on your trade. Placing orders as limit orders instead of market orders will take away the slippage and bring down the total cost on the trade. So, in our example, the total cost would reduce by three pips.

We hope this article will change the way you trade this currency pair. Happy trading!

Categories
Forex Daily Topic Forex Price-Action Strategies

Forex Traders: Get Patience, Optimism, and Never Give Up Attitude

In today’s lesson, we are going to demonstrate an example of the daily-H4 combination trading, which makes traders wait for a long time. Usually, if the daily chart produces a daily reversal, it creates an H4 entry within a day or two. In today’s lesson, the H4 chart takes four days after creating a daily reversal to produce the signal candle. Let us find out how it offers us entry.

This is a daily chart. The chart shows that it produces a bearish inside bar at a strong resistance zone. An inside bar is not a strong reversal candle, but a strong resistance zone may attract the sellers to look for short opportunities. The daily-H4 combination traders are to flip over to the H4 chart for the price to consolidate and produce a bearish reversal candle to offer a short entry. We flip over to the H4 chart later. Let us now have a look at the daily chart with four more daily candles.

The chart produces four more candles that are bearish. However, the daily-H4 combination traders do not get any A+ entry to go short. Should they skip eyeing on this pair? Never, they need to perform the same duty. As long as the last daily candle is bearish, they are to flip over to the H4 chart. The last candle on this chart is bearish. Let us flip over to the H4 chart this time.

You may notice that the H4 chart does not make deep consolidation followed by a bearish engulfing candle to offer them a short entry so far. Traders are to flip over to the H4 chart every day with no luck. Let us proceed to the next H4 chart.

The chart shows that it is having a deep consolidation. The last candle comes out as a bullish engulfing candle. However, the chart is still bearish biased unless it produces a bullish daily reversal candle. The sellers are to wait for an H4 bearish engulfing candle closing below consolidation support to offer them a short entry.

Here it is. The last candle comes out as a bearish engulfing candle closing well below consolidation support. The sellers may trigger a short entry right after the last candle closes with 1R.

The price heads towards the South with extreme bearish pressure. The price hits 1R with ease. Some traders may even make much more than 1R by taking a partial profit. In the end, it ends up being a prolific entry.

It does not come easily, though. The daily-H4 combination traders are to keep eying on the charts for four consecutive days. The H4 chart produces the signal on the fifth day after producing the daily bearish reversal candle. This is why Forex traders need to have patience, optimism, and never give up attitude.

Categories
Crypto Market Analysis

Daily Crypto Review, Mar 9 – Blood on the streets, BTC under $8,000

It is quite a good statement when we say that the crypto market is bleeding over the weekend. Cryptocurrencies dropped in price a great amount as bears took over the market. Bitcoin is currently trading for $7,953, which represents an 8.98% decrease on the day. Meanwhile, Ethereum lost 9.72 % on the day, while XRP lost 9.66%.

UNUS SED LEO took the position of today’s most prominent daily gainer, with gains of 3.08%. On the other side, Swipe lost 26% on the day, making it the most prominent daily loser.

Bitcoin’s dominance managed to increase slightly over the weekend. Its value is now 64.19%, which represents a 0.4% difference to the upside when compared to yesterday’s value.

The cryptocurrency market capitalization dropped severely over the weekend. It is currently valued at $232.71 billion, which represents a decrease of $26.49 billion when its value is compared to the value it had on Friday.

What happened in the past 24 hours

Boeing has partnered with a multinational aerospace conglomerate Honeywell in order to use its GoDirect blockchain-based platform to track and sell $1 billion worth of airplane parts that they don’t need.

The partnership got revealed at the Hyperledger Global Forum 2020, which took place in Arizona. All the airplane parts were uploaded to the GoDirect Trade marketplace over the last weekend.

Honorable mention

Bitcoin (start of the bear trend)

Bitcoin began its sudden crash (which, in turn, brought all other cryptos down as well) due to another giant selloff coming from the PlusToken pyramid scheme.

According to various online Blockchain data sources, participants in the $2.9 billion pyramid scheme are attempting to sell their BTC holdings again. Ergo, the Twitter account that tracks PlusToken’s activities, showed that 13,000 BTC or roughly $210 million were involved in this sale.

_______________________________________________________________________

Technical analysis

_______________________________________________________________________

Bitcoin

Bitcoin’s price got destroyed over the weekend. Many analysts said that the sharp move to the downside will end at above $8,000. However, BTC dropped under it and can not get above again. This price drop was, as we mentioned above, caused by a pyramid scheme PlusToken giant attempting to get rid of its Bitcoin holdings.


Bitcoin’s volume increased as the price-drop occurred. Its RSI level is currently deep into the oversold territory.

Key levels to the upside                    Key levels to the downside

1: $8,000                                           1: $7,760

2: $8,650                                           2: $7,420

3: $8,825                                            3: $7,085


Ethereum

Ethereum also lost a great deal of its value but managed to spring back a bit (sooner and a bit more than Bitcoin). Its price went from $253 all the way down to $196.5. However, bulls took over and brought the price above the $198 support and slightly above (to around $208 at the moment of writing).


Ethereum’s volume increased greatly during this bear trend, while it is dropping at bulls took over. Its RSI level is just above the oversold territory on the 4-hour trading chart.

Key levels to the upside                    Key levels to the downside

1: $217.7                                             1: $198

2: $225.5                                            2: $193.6  

3: $240                                                3: $185


Ripple

XRP was no exception to the bleeding market. Its price dropped severely as well. The third-largest cryptocurrency dropped from $0.2454 all the way down to $0.2, where bulls took over. The price is currently rising at a slow pace, with XRP being traded for around $0.211 at the time of writing.


XRP’s volume increased immensely during the selloff but dropped down closer to normal when the bulls took over. Its RSI level is currently just slightly in the oversold territory.

Key levels to the upside                    Key levels to the downside

1: $0.221                                            1: $0.2

2: $0.227                                            2: $0.1985

3: $0.235                                             3: $0.19

Categories
Forex Market Analysis

Daily F.X. Analysis, March 09 – Top Trade Setups In Forex – Risk Sentiment Keeps the Market in Action! 

The U.S. Dollar Index plunged 0.9% on the day to 95.95 on Friday, as treasury yields slumped amid sinking investors’ risk appetite. The Eurozone Sentix Investor Confidence Index for March will be released (-11.4 expected). The German Federal Statistical Office will announce January industrial production (+1.6% on month expected) and trade balance (15.3 billion euros surplus expected).

The Bank of France will post February Industry Sentiment Indicator (95 expected).

Economic Events to Watch Today  


EUR/USD – Daily Analysis

The EUR/USD climbed 0.4% to 1.1286. Official data showed that German factory orders grew 5.5% on month in January (+1.3% expected). The coronavirus breaks in China and South Korea seem to be lagging, as countries outside in the world embrace drastic steps to try and stamp out the virus. 

In Italy, where 16 million people in Lombardy and different sections of the north are presently below quarantine, there were 133 life losses announced on Sunday, drawing the sum to 366. More than 7,000 people in the country have been verified to have the disease. 

In Iran, there were 49 new deaths. Some 194 people have now expired from COVID-19 there. Although the latest numbers from China and South Korea suggest, the virus seems to be diminishing in northeast Asia.

At the data front, the German Industrial Production and the Current Account data are scheduled to release at 07:00 GMT, followed by the Eurozone Sentix Investor Confidence at 09:30 GMT. The German Federal Statistical Office will report January industrial production (+1.6% on month expected) and trade balance (15.3 billion euros surplus expected).

Daily Support and Resistance

  • S1 1.1016
  • S2 1.1152
  • S3 1.1221

Pivot Point 1.1288

  • R1 1.1356
  • R2 1.1424
  • R3 1.1559

EUR/USD– Trading Tips

The EUR/USD is trading with a bullish bias around 1.1445. The EUR/USD seems to extend the bullish trend in the wake of completing the 161.8% and 261.8% Fibonacci extension level, out of which 161.8% has already been achieved until 1.1258. At the moment, the EUR/USD is trading at 1.1458, and bullish breakout of this level can extend buying until 1.1610 level. On the lower side, the EUR/USD may find support around 1.1400 and 1.1296. The RSI and MACD are in the buying zone as the MACD’s histograms are over zero, the bullish zone. Consider taking buy trades above 1.1380.


GBP/USD– Daily Analysis

The GBP/USD climbed 0.6% at 1.2951 to hit its highest mark in a week to the greenback. This came after the forecasts waned for an urgent Bank of England rate cut to follow this week’s emergency movement from the U.S. Federal Reserve to accommodate coronavirus damage. 

The U.S. official data showed that the economy added 273,000 non-farm payrolls in February (+175,000 expected), and the jobless rate dropped to 3.5% (3.6% expected). Average hourly earnings were up 0.3% on the month (as expected). 

January trade deficit was posted at US$45.3 billion (US$46.2 billion expected), and wholesale inventories (final reading) fell 0.4% on the month (-0.2% expected). Despite mixed economic events, the U.S. dollar is getting weaker and driving the GBP/USD pair higher. 

On Monday, the Sterling languished to a five-month low against the Euro, amidst a fresh market panic about the coronavirus outbreak that has prompted significant falls in stocks and oil.

Daily Support and Resistance    

  • S1 1.281
  • S2 1.2913
  • S3 1.2981

Pivot Point 1.3017

  • R1 1.3084
  • R2 1.312
  • R3 1.3224

GBP/USD– Trading Tip

On Monday, the GBP/USD is showing some severe bullish moves in the wake of a weaker dollar and strong Sterling. The GBP/USD soars to trade around 1.3180 and continuation of a bullish trend can extend buying until 1.3200 and even higher. 

During the start of the day, the GBP/USD opened with a dramatic gap, but it soon recovered to fill the gap around 1.3032. Right now, the GBP/USD has formed a solid green candle on the 240 minutes timeframe, which may help drive further buying in the Sterling. The MACD is consistently forming bullish histograms over zero points, supporting the buying trend in the GBP/USD pair. Let’s consider buying over 1.3145. 


USD/JPY – Daily Analysis

The USD/JPY currency pair flashing red and dropped to multi-year lows mainly due to the early-Asian risk-off market sentiment in the wake of coronavirus fears and fall in oil prices. However, the pair is struggled to gain its recovery of over 100 pips from the 3-year lows after downbeat GDP data and trading above mid-102.00s. The USD/JPY currency pair is currently trading at 102.64 and consolidates in the range between the 101.59 – 104.58 on the day.

Moreover, the U.S. yields have recovered slightly from the lows seen after the U.S. Fed’s rate cut. The 2-year yield is currently trading at 0.68%, representing a seven basis point gain on the overnight low of 0.61%, and the 10-year yield has recovered to 0.98% from $0.91%. The currency pair continued to its recent heavy losses and still trading under some heavy selling pressure for the 2nd-consecutive session on Friday.  

On the fundamental side, the headlines growth figure confirms the -1.7% market consensus versus -1.6% initial forecast. The GDP data confirms further challenges to the Asian economy due to coronavirus (COVID-19) fears that have been pushing to the quote downwards.

Daily Support and Resistance

  • R3: 109.46
  • R2: 107.99
  • R1: 107.08

Pivot Point 106.52

  • S1: 105.61
  • S2: 105.06
  • S3: 103.59

USD/JPY – Trading Tips

The USD/JPY is trading at 102.200, breaking below the bearish channel, which supports the Japanese yen at 104.400. The increased demand for safe-haven assets is driving strong bearish trends in the USD/JPY currency pairs. Recently, the USD/JPY has closed two consecutive selling candles, which are followed by the bearish breakout setup and suggesting odds of further bearish bias until 101.650. 

Selling trend continuation can lead the USD/JPY prices towards 101.670 whereas, further selling can lead the USD/JPY to 100.450 area

All the best for today!  

Categories
Forex Elliott Wave

Intermediate Wave Analysis – Motive Waves – Part 2

In our previous article, we covered the main rules of impulsive waves. In this educational post, we’ll present a complimentary set of rules of the impulsive waves.

The Alternation Rule

The alternation rule, as defined by R.N. Elliott, is not an author’s invention, alternation exists from the beginning of the universe, and this is a principle that governs nature. In the same way that the day alternates with the night, bullish market alternates with the bearish.

This rule is the foundation of wave theory; without the alternation, the wave theory would not exist. This rule states, “when two consecutive waves are compared, one must be different from the other and both must also be unique in form.

The essential element that distinguishes the alternation in the wave analysis is time. In other words, this means that if a movement on one wave occurs a reduced time span, the next move should take place in an extensive period compared with the previous move.

In wave theory, we observe the alternation in the following characteristics:

  1. Price: it is the vertical distance that the market advances.
  2. Time: it is the horizontal distance elapsed in the market progress.
  3. Severity: this corresponds to the percentage that price retraces an impulsive movement.
  4. Complexity: corresponds to the number of segments that conforms to the wave sequence.
  5. Construction: corresponds to the type of formation that market develops, for example, flat, zigzag, triangle, etc.

The Equality Rule

  1. The extension rule says that in an impulsive sequence, one of three motive waves must be the most extended. When the wave analyst has identified the extended wave, then, can apply the equality rule that refers to the other two waves that are as follows:1. If wave 1 is extended, then the rule applies to waves 3 and 5.
  2. If wave 3 is extended, then the rule applies to waves 1 and 5.
  3. If wave 5 is extended, then the rule applies to waves 1 and 3.

The equality rule establishes that two of non-extended waves tends to be equal in terms of price, time, or both.

This rule is useful, especially when the third wave is the extended wave, and the fifth fails. However, it is not helpful when the first wave is extended or is a terminal formation.

Superposition Rule

The superposition principle can be used in two different ways depending on the kind of impulsive structure; it means if the motive wave corresponds to a trend movement or a terminal sequence.

If the price action develops a trend movement, then waves two and four will never overlap. In terms of its internal sequence, the motive wave will have a 5-3-5-3-5 sequence.

If the price action follows a terminal move, then wave four will penetrate the second wave area partially. The internal subdivision of this find of waves will follow a 3-3-3-3-3 sequence.

GBPUSD Pair Follows the Elliott Wave Principle

The GBPUSD pair in its 12-hour chart illustrates the Elliott wave principle in the real market.

In the figure, we observe how the GBPUSD pair follows the Elliott wave principle. Firstly, the motive wave has five internal segments that create an upward trend; the third wave is not the shortest, and as shown in the chart, the third move corresponds to the extended wave.

Once finished the five-wave sequence, it starts a corrective move in the opposite direction of the trend following a three-wave structure, which still seems in progress.

Following the alternation rule, we observe that the first wave advanced 625 pips in 17 days, while the third jumped 817 pips in 11 days. Finally, the fifth wave ran 691 pips in 16 days. These measurements enable us to observe that the GBPUSD comply with the extension, equality, and superposition rules.

At the same time, we observe that corrective waves also alternates between themselves. The second wave retraced the movement formed by the first wave in 16 days, while the fourth wave retraced the advances of the third wave during 36 days.

Conclusion

In this article, we extended the toolbox for the wave analysis process, from where rules as the alternation, equality, and superposition, add to the seven basic rules and extension defined in our previous educational post.

In our next educational post, we will present the canalization process, which will allow the wave analyst to understand the price action from the Elliott wave perspective.

Suggested Readings

  • Neely, G.; Mastering Elliott Wave: Presenting the Neely Method; Windsor Books; 2nd Edition (1990).
  • Prechter, R.; The Major Works of R. N. Elliott; New Classics Library; 2nd Edition (1990).
Categories
Forex Videos

Forex Fractals Can Spot Reversals So You Can Break The Brokers!

Fractals


Although, at times, the forex market seems to be unpredictable, candlesticks, as denoted by price action, and various technical indicators, create a series of patterns which repeat themselves time after time. And while to the untrained eye, these patterns may look completely confusing, by mastering technical analysis skills. Eventually these patterns tell you an awful lot about where the price is likely to go to in the future.

One such repeating indicator is called the fractal. The fractal indicator was invented by a trader called Bill Williams. It is calculated from a 5 bar reversal pattern and indicates a trend reversal.

Example A


Example A is a diagram of price action as shown by the Japanese candlesticks and whereby the arrows are fractal indicators denoting a potential reversal in price action. Confusingly the arrow points in one direction; it actually predicts a possible trend reversal in the opposite direction. So an up arrow denotes a bearish trend reversal, and a down arrow denotes a bullish trend reversal.

Example B


Example B: A fractal indicator consists of five or more price bars. And the set of rules which apply to them are as follows: A bearish pattern reversal point occurs when there is a bar with the highest high, set in the middle of two bars with lower highs on each side. A bullish fractal pattern reversal point occurs when there is a bar with the lowest low with two bars on either side with higher lows. The patterns shown here are typically what you would expect to see, with the fractal indicator printed above and below the middle bars.
Fractals tend to work better on higher time frames because on the lower time frames, they will throw up a lot of noise and be more confusing than they are worth.

Example C


Example C, However when used in combination with price action and also the key price action levels, such as whole round numbers such as the double 00’s, such as the 1.2800 or 1.2900 levels in our GBPUSD example, they help us to determine if price action is observing these key areas and therefore can be a second confirmation for entry and exit points, the first being price action itself.
Fractals are essentially a lagging indicator and provide us with a delayed signal to enter the market. However, Although it lags behind price action because it identifies trend reversals, it is particularly useful in longer time frames, especially above 15 minutes, where trends tend to continue for a period of time once the pattern has presented itself.
Find because the fractal indicator does tend to pop up on the chart quite often, it is best to use it in conjunction with other indicators as double confirmation.

Example D


In example D of a 4-hour chart of the GBPUSD pair, we can see the fractals are very often adhering to the resistance and support levels on our trend lines while price action is moving down, up and down again on the char, while also supporting the whole numbers.
Experiment with them on your particular trade setup, and we feel sure that you will find a useful way to incorporate them into your trading methodology.

Categories
Forex Videos

How To Trade Cryptocurrencies Using The MACD Indicator Part 2

Trading cryptocurrencies using the MACD indicator – part 2/2

MACD Overbought and Oversold conditions
The MACD indicator is great for identifying possible changes in a trend and spotting trend reversals. However, it can also identify overbought market conditions or oversold market conditions.
The overbought and oversold market conditions are presented on the indicator when the MACD line and the signal line are separated too far away from each other as well as from the zero-line.

BTC/USD Weekly Chart example


As can be seen in the picture, the MACD line started to stray noticeably far away from the indicator’s signal line in December 2017. On top of that, both the MACD line and Signal were well above the zero-line at that time.
The combination of the two warned careful investors that the price surge was causing the market to become overextended and that a pullback was becoming extremely likely.

Zero-line explained

The so-called zero line marks the midpoint of the MACD oscillator, splitting the value range in half. When the 12-period exponential moving average crosses above the 26-period EMA, the MACD will cross above the zero-line, therefore presenting a buy signal. On the other hand, when the 12-period EMA crosses below the 26-period EMA, the MACD will go below the zero-line and will present a sell signal.


The histogram, which are the pink bars shown on the oscillator, quantifies the distance that is currently between the MACD line and the signal line. The histogram will print a bar above the zero-line when the MACD line is above the signal line. On the other hand, it will print a bar below when the MACD line is below the signal line. The bigger the size of the bar, the larger the gap between the two lines is.
When the histogram reaches its highest level, it will show the MACD line at its farthest point above the signal line. This situation implies that the rally is becoming overstretched, as shown in the chart.

Conclusion
The MACD oscillator is a great tool for traders that like following trends and spotting trend reversals. It comes in handy to both beginners and professionals alike.

Categories
Forex Market Analysis

WTI Crude Oil Prices Came Under Pressure Despite OPEC Agreed To Cut Production! 

The WTI crude oil prices dropped despite the report that OPEC minister agreed to cut the oil output by 1.5 million barrels per day. It’s worth to mention that the cut is finalized after approval from Russia. A meeting of both OPEC and OPEC+ members later in the day is in focus. 

Russia’s willingness for deeper production cuts is still doubtful because recent reports suggested that Moscow was supporting an increase to the current level of cuts rather than a further reduction. The news failed to boost oil prices today because falling U.S. equities places a further burden on oil markets. 

Despite some improvement in prices this week, the WTI is still below 24% on the year, and the coronavirus is playing a major role. The coronavirus cases continue to rise in the world’s largest economy. Some time ago, the U.S. Vice President Mike Pence accepted that they have a shortage of virus testing kits for now. Moreover, New York officials also recently crossed wires while saying that the coronavirus infects nearly 2,733 people in the city, which is also putting bearish pressure on the crude oil prices.

Daily Support and Resistance

  • S1 42.01
  • S2 41.76
  • S3 41.42

Pivot Point 43.51

  • R1 43.72
  • R2 44.26
  • R3 45.01

On the technical front, the crude oil price has broken below the double bottom support level of 43.95, which opens up further room for selling until 40.95. Recently, the MACD of crude oil has also forming bigger histograms on the 4-hour chart, which are supporting the selling trend in the WTI prices. Closing of candles below 43.96 may confirm the chances of more bearish bias in the WTI prices today. Let’s consider staying bearish below 43 to target 42.25 and 41.75. Good luck! 

Categories
Crypto Videos

How To Trade Cryptocurrencies Using The MACD Indicator Part 1

Trading cryptocurrencies using the MACD indicator – part 1/2

While there are many technical indicators that can help with identifying changes in the strength, momentum, or the duration of a trend, none of them are simpler than the Moving Average Convergence Divergence, better known as MACD.

By definition, the MACD indicator turns two moving averages into a momentum oscillator. It does so by subtracting the longer period moving average from the shorter period moving average.
As the MACD indicator is a “lagging” or a “trend following” indicator, it actually trails pricing events that already took place in order to determine the strength of the current trend.
As with most indicators, though, you won’t make money just by understanding the indicator works, but rather by knowing how to use this indicator. However, it is still worth explaining what MACD is, so you have a better understanding of why it is such a widely used and loved indicator.

What is MACD

MACD is composed of three main components: the MACD line (which is the blue oscillator), the signal line (which is the orange oscillator), and the histogram.

MACD line is typically made up of the 12-period exponential moving average (EMA) minus the 26-period exponential moving average.
The signal line is typically the 9-period EMA of the MACD line.
The histogram represents the difference between the MACD line and the signal line.

How to interpret the MACD indicator
It might be hard to explain how MACD works, but it is actually one of the easiest indicators to interpret as everything is represented clearly and visually.

The MACD Cross

When the MACD line performs a cross above the signal line, it is interpreted by the traders as a bullish cross. On the other hand, when the MACD line crosses under, traders know that this is a bearish cross. These crosses indicate a shift in momentum, which can represent a buy or sell opportunity.

BTC/USD example

As seen in the picture, MACD crosses provide confirmation of a trend change. This is true, at least in the short term.

As an example, the MACD line crossed above the signal line on November 16, 2017, presenting a buy signal. The MACD line stayed above the signal line for over a month, which resulted in the price increasing more than 150% before the next bearish cross. The bear cross, which occurred on December 20, 2017, signaled a change of trend to bearish.

It’s recommended (and almost necessary) to use the MACD indicator in conjunction with some other indicators such as volume or RSI because MACD, just like any other indicator, is not 100% accurate and can give off false signals.
Check out part 2 of Trading cryptocurrencies using the MACD indicator to learn more about how this indicator shows overbought and oversold market conditions as well as about what zero-line represents.

Categories
Forex Assets

Analyzing The USD/MAD Forex Currency Pair

Introduction

USD/MAD is the abbreviation for the US dollar against the Moroccan Dirham. This pair is classified as an emerging currency pair in the forex market. In this pair, USD is the base currency, and MAD is the quote currency. Typically. It is seen that this pair has pretty low volatility and liquidity. However, it can still be traded under certain conditions.

Understanding USD/MAD

The market price of this currency pair determines the value of MAD that is equivalent to one USD. For instance, if the current market price of USD/MAD is 9.5867, then these many Moroccan Dirhams are required to purchase one USD.

Spread

The difference between the bid price and the ask price is referred to as the spread. This is the primary way through which brokers generate revenue. Spread is a variable and is different with different brokers. It also differs based on the execution model used by the broker.

ECN: 35 pips | STP: 40 pips

Fees

The commission paid on each trade is the fee on that trade. Note that, the concept of the fee is only ECN accounts and not STP accounts. The fee on ECN accounts is typically between 5-10 pips.

Slippage

Slippage is the difference between the price intended by the client and the price that is actually executed by the broker. There is this difference due to two reasons:

  • Market’s volatility
  • Broker’s execution speed

Trading Range in USD/MAD

The trading range is the tabular representation of the volatility of the market in different timeframes. These values help in assessing the minimum, average, and maximum profit/loss in six different timeframes.

Procedure to assess Pip Ranges

  1. Add the ATR indicator to your chart
  2. Set the period to 1
  3. Add a 200-period SMA to this indicator
  4. Shrink the chart so you can assess a large time period
  5. Select your desired timeframe
  6. Measure the floor level and set this value as the min
  7. Measure the level of the 200-period SMA and set this as the average
  8. Measure the peak levels and set this as Max.

USD/MAD Cost as a Percent of the Trading Range

The total cost of the trade is calculated by adding up the slippage, spread, and the trading fee. It is not constant but varies based on the volatility of the market. Below are tables that represent how costs vary for different timeframes and volatilities.

ECN Model Account

Spread = 35 | Slippage = 3 |Trading fee = 3

Total cost = Slippage + Spread + Trading Fee = 3 + 35 + 3 = 41

STP Model Account

Spread = 40 | Slippage = 3 | Trading fee = 0

Total cost = Slippage + Spread + Trading Fee = 3 + 40 + 0 = 43

The Ideal way to trade the USD/MAD

Starting off from the trading range table, we can see that the volatility of this pair is quite high. The spread, too, is higher than other emerging pairs. So, it is not really ideal to trade at any time in 24 hours.

When we have a look at the cost percentage tables, we can see that the percentages are high in the minimum column, and low in the max column. This implies that the costs are high during low volatilities, and costs are low during high volatilities. So, the best time to trade this pair is when the volatility is around the average values because this assures decent volatility as well as affordable costs.

Furthermore, the costs can be reduced by placing orders as ‘limit’ instead of ‘market’. In doing so, the slippage on the total costs will be made zero. So, spread and trading fee will be the only factors involved in calculating the total cost.

Categories
Forex Course

75. Using Moving Average Crossovers To Take Trades

Introduction

In the previous article, we learned how to use the moving average for determining the direction trend. The Moving Average lines not only helps us in identifying the direction of the market but also tells us when a trend is about to end and potentially reverse. In today’s lesson, we will see how the moving averages can be used to enter trades at the reversal of a trend.

The principle of the strategy is to discover the crossover of the two moving averages on the chart. When the moving averages crossover, it is a sign of market reversal halting the existing trend. So at this point, we need to find a suitable ‘entry.’

Moving Average Crossover Strategy

Let us consider an example to explain the above-discussed strategy. Below, we have a daily chart of USD/CHF on which we have plotted the two moving averages (10-Period & 20-period). We can see the market being in a strong downtrend, and it is also confirmed by the two moving averages, where the ‘faster’ MA is below the ‘slower’ MA.

The next step is to find the overlap of ‘faster’ MA with the ‘slower’ MA from above, which is also known as the crossover of MAs. Once the crossover happens, there is a higher chance of the trend reversing. The below chart shows precisely how the crossover takes place, which means the trend can potentially reverse anytime now.

But, we shouldn’t be directly going long soon after the crossover. We need to confirm the trend reversal. A ‘higher low’ after the crossover validates the trend reversal, and this could be the perfect setup for going ‘long’ in this currency pair.

The below chart shows the ‘higher low,’ which is formed exactly after the crossover. Therefore, we now have confirmation from the market, so we can take some risk-free positions.

As we can see, in the below chart, the trade goes in our favor and hits our initial target. However, aggressive traders can aim for a higher ‘take-profit‘ as the new uptrend can reverse the entire downtrend, which is seen on the left-hand side. The reversal is also confirmed by moving averages where the ‘faster’ MA is above the ‘slower’ MA. The stop-loss for this trade is placed below the identified ‘higher low’ with a take-profit at a new high or significant S&R area.

Conclusion

The crossover strategy works beautifully in both volatile and trending markets, but they do not work that well in ranging markets. This is because the crossover takes place multiple times in the ranging market, and this leads to confusion about the market direction. To find high probability trades, one can also combine the strategy with other technical indicators to get additional confirmation of the trend reversal. In the next article, we shall see how moving averages can act as key support and resistance levels.

[wp_quiz id=”65842″]
Categories
Forex Market Analysis

Daily F.X. Analysis, March 06 – Top Trade Setups In Forex – Who’s Up for the U.S. Nonfarm Payroll? 

On the forex front, the U.S. dollars weakened further against its major peers on Thursday, with the ICE Dollar Index dropping 0.8% on the day to a two-month low of 96.60. The German Federal Statistical Office will report January factory orders (+1.3% on month expected). France’s INSEE will post the January trade balance (4.8 billion euros deficit expected).

Economic Events to Watch Today  


EUR/USD – Daily Analysis

The EUR/USD jumped 0.8% to 1.1227. Later today, German factory orders for January will be released (+1.3% on month expected). The European Commission warned that France and Italy could fall into a technical recession, two-quarters of economic contraction, amid coronavirus impacts. On the other hand, official data showed that the eurozone’s retail sales grew 0.6% on month in January, and German retail sales were up 0.9%, both as expected.

If the risk-on sentiment continues to boost, the selling interest around the EUR could increase. If the OPEC meeting strengthens an oil price bounce, the risk sentiment will likely increase, pushing the EUR currency and other safe-haven currencies lower. The pair is currently sidelined just below 1.1140.

Besides this, the currency pair will likely take cues from the German Federal Statistical Office will report January factory orders (+1.3% on month expected). France’s INSEE will post the January trade balance (4.8 billion euros deficit expected). The doors remain open for EUR/USD to extend gains toward the next significant resistance near 1.1282 (July 19, 2019 high). 

Daily Support and Resistance

  • S1 1.0949
  • S2 1.1075
  • S3 1.1156

Pivot Point 1.12

  • R1 1.1281
  • R2 1.1326
  • R3 1.1451

EUR/USD– Trading Tips

On Friday, the EUR/USD is trading with a bullish bias around 1.1245. The EUR/USD may drop to complete the bearish retracement. On the lower side, the 38.2% Fibonacci retracement is likely to support the EUR/USD at 1.1180, and violation of this level can drive more selling until 1.1155 which marks the 61.8% Fibonacci level. On the higher side, the bullish breakout 1.1245 can lead EUR/USD prices further higher towards 1.1300 and 1.1335. The RSI and MACD are in the buying zone as the MACD’s histograms are over zero, the bullish zone. Consider taking buy trades above 1.1230.


GBP/USD– Daily Analysis

The GBP/USD climbed 0.6% at 1.2951 to hit its highest mark in a week to the greenback. This came after the forecasts waned for an urgent Bank of England rate cut to follow this week’s emergency movement from the U.S. Federal Reserve to accommodate coronavirus damage. 

The GBP/USD currency pair may come under pressure in Europe if the pair do not cross the key hurdle. On the data front, the focus will be on the U.K. Halifax House Prices and the U.S. Nonfarm Payrolls report. 

At the Brexit front, the EU-UK Brexit negotiators complete their first round of trade talks. However, no conclusion has been received so far, while fisheries and the E.U. jurisdiction continue to remain as the key hurdles.

At the coronavirus front, the deadly virus continues to spread outside China, with California recently declaring a state of emergency. However, the global policymakers struggle to control the same, and it seems to have helped the risk-tone sentiment. As in result, the U.S. 10-year Treasury yields remain positive above 1%, whereas stocks in Asia are also positive by the press time.

Daily Support and Resistance

  • S1 1.2631
  • S2 1.2734
  • S3 1.28

Pivot Point 1.2837

  • R1 1.2903
  • R2 1.294
  • R3 1.3043

GBP/USD– Trading Tip

On Friday, the GBP/USD is trading with bullish bias after having violated the horizontal resistance level of 1.2885, and it’s heading towards the next target level of 1.3000, which is also a psychological resistance level for GBP/USD. 

The GBP/USD’s immediate support is likely to be found around 1.2917, and below this level, the GBP/USD may aim for the 1.2860 area. The MACD and RSI are in the buying zone, supporting the bullish bias for the GBP/USD. Let’s look for long positions above 1.2937 today.  


USD/JPY – Daily Analysis

The USD/JPY currency pair flashing red and trading below the 106.00 level mainly due to the on-going risk-off market sentiment in the wake of Coronavirus intensifying fears. As well as, the currency pair hit the 6-months lows level. For now, the currency pair is currently trading at 105.94 and consolidates in the range between the 105.75 – 106.34.

Moreover, the U.S. yields have recovered slightly from the lows seen after the U.S. Fed’s rate cut. The 2-year yield is currently trading at 0.68%, representing a seven basis point gain on the overnight low of 0.61%, and the 10-year yield has recovered to 0.98% from $0.91%. 

The currency pair continued to its recent heavy losses and still trading under some heavy selling pressure for the 2nd-consecutive session on Friday.  

The reason behind all negative factors could be the market’s fear of coronavirus-led economic pessimism. Whereas, the latest numbers from the U.S., China, and South Korea suggested that the deadly virus continues to spread despite the governments’ struggles.

As in result, the safe-haven demand for the yen has weakened in Asia. As we already mentioned that the USD/JPY pair is currently trading at 107.27, representing a 0.17% gain on the day, having hit a high of 107.52 a few minutes before press time. 

Daily Support and Resistance

  • R3: 109.46
  • R2: 107.99
  • R1: 107.08

Pivot Point 106.52

  • S1: 105.61
  • S2: 105.06
  • S3: 103.59

USD/JPY – Trading Tips

The USD/JPY is trading at 105.900, breaking below the sideways trading range of 108.500 to 107.100 in the wake of safe-haven appeal. The pair is now in the oversold zone, but the market isn’t moving much as investors seem to wait for the NFP figures, which are coming out during the U.S. session.  

The USD/JPY has formed a Doji pattern near 105.613, and the violation of this could trigger further selling off until 104.300. We need to pay attention to the USD/JPY as the closing of candlesticks above 105.613 level can provide us with buying trade with a take profit of around 107. 

All the best for today! 

Categories
Crypto Market Analysis

Daily Crypto Review, Mar 6 – Bitcoin above $9,000; Steem performing a network takeover

The crypto market managed to push up once again, with Bitcoin leading the way as it crossed the $9,000 mark. Bitcoin is currently trading for $9,061, which represents a 2.15% increase on the day. Meanwhile, Ethereum gained 1.31% on the day, while XRP gained 1.92%.

ABBC coin took the position of today’s most prominent daily gainer, with gains of 24.58%. On the other side, v.systems lost 7.02% on the day, making it the most prominent daily loser.

Bitcoin’s dominance managed to increase slightly over the past 24 hours. Its value is now 63.79%, which represents a 0.19% difference to the upside when compared to yesterday’s value.

The cryptocurrency market capitalization increased slightly in the past 24 hours. It is currently valued at $259.2 billion, which represents an increase of $3.75 billion when its value is compared to the value it had yesterday.

What happened in the past 24 hours

While multiple countries are testing and theorizing about the validity of a central bank digital currency, the US dollar remains physical and still sits in a place of dominance. However, how long will the dollar be so dominant if it doesn’t get digital? ING economist Carlo Cocuzzo said that “The dollar is the dominant currency today,” on a panel at London Blockchain Week, but added that “90% of forex turnover is in dollars, so the US stands to lose in this game.”

Honorable mention

Steem

The Steem blockchain experienced some problems recently, where the blockchain’s entire governance system had a couple of disturbances. Tron founder Justin Sun, who now owns the Steemit social network which is based on the Steem token, seems to have successfully executed a takeover of Steem tokens by leveraging not only the tokens that were directly controlled but also the tokens held on several major exchanges. If this is true, then the customers of these exchanges most likely had their funds used without their consent.

_______________________________________________________________________

Technical analysis

_______________________________________________________________________

Bitcoin

Bitcoin bulls managed to gather up for another push, which brought BTC above the $9,000 psychological mark. Bitcoin broke the $8,980 resistance without much effort, and continued to push up on the way to $9,115. However, the move ended with bulls getting exhausted at the $9,170 mark.


Bitcoin’s volume increased slightly when compared to yesterday, while it’s still considered average when compared to the rest of the week. Its RSI level is currently near the higher end of the value range on the 4-hour chart.

Key levels to the upside                    Key levels to the downside

1: $9,115                                           1: $8,980

2: $9,250                                           2: $8,825

3: $9,580                                            3: $8,650


Ethereum

Ethereum gained some value as well in the past 24 hours but did not break any major resistance levels. Ethereum moved within the range bound by $225.5 to the downside and $240 to the upside. Its price did drop below $225.5 earlier during the day, but quickly got back above and increased to $235.


Ethereum’s volume is extremely low, while its RSI is near the middle of the value range, sitting at around 53 on the 4-hour chart. There were no changes in the upside or downside levels.

Key levels to the upside                    Key levels to the downside

1: $240                                                1: $225.5

2: $251.3                                            2: $217.7  

3: $259.5                                             3: $198


Ripple

XRP also made some gains today. Its price went from right below $0.235 to almost breaking $0.2454 at one point in time. However, the bull pressure was not as strong, and the price could not pass this resistance level. XRP is now trading at around $0.24.


XRP’s volume is currently far below average, while its RSI level is slightly above the value range, sitting at around 57 on the 4-hour chart. There were no changes in the upside or downside levels.

Key levels to the upside                    Key levels to the downside

1: $0.2454                                          1: $0.235

2: $0.266                                            2: $0.227

3: $0.285                                             3: $0.221

Categories
Forex Videos

Heikin Ashi – Forex Trading Like A Samurai Warrior!


Heikin Ashi – Forex Trading Like A Samurai Warrior!


The Heikin Ashi technical indicator means “average bar” in Japanese, by the people who invented the tool. Heikin Ashi is combined with the Japanese candlestick, with the basic principle being that when functioning together on a chart, they have the effect of smoothing out a lot of the noise you get in forex trading while making charts more readable and making trends easier to analyze.

The Heikin Ashi has the same four data points, open, low, high, and close and the ordinary candlestick, however, they have some unique maths behind them and differ from that of a normal candlestick.

The close is an average of the open, high, low, and close of the current period. The Open is the average price of the previous candlestick.

The low is the least one of these three numbers: the current period’s high, the current Heiken Ashi candlesticks open, or the current Heiken Ashi candlesticks close. Whichever one of these is the smallest number is the low for this candlestick.
As traders, we can use the tool to show us more clearly when to hold on to a trade while also identifying when a trend may have run its course and thus showing us when to exit a trade.
As most profits are gained when markets are trending, it is important to have any tool available to help us more clearly identify those trends and thus help us to maximize our profits.


Example A

Example A is a 5-minute chart of the USDCAD pair using only Japanese candlesticks and where price action appears to be quite choppy.

Example B

In example B, we have added the Heiken – Ashi indicator while setting up the colors of our bars to match those of our candlesticks. We can already see that there is a noticeable difference and where we previously might have expected some price action reversals, the Heiken Ashi averaged out some possible turns and would have kept us in the trade.
Let’s go back to Example A in case you missed them.

Example C

Now let’s revisit our Heiken Ashi chart one more time as per example C, where we can see three areas that filtered out the noise and would have kept us in those trades a little longer in order to bag extra pips.
So when we look for a smoother Identification in trends, the Heiken Ashi will definitely help us to filter out some of the noise associated with standard candlesticks. That’s because normal candlesticks tend to alternate color even if the price action is predominantly moving in one direction. However, Heiken Ashi trend to stay blue in up trends and red in downtrends, or depending on how you have your candle colors setup.

Example D

Anything that gives us an edge is welcomed, and a lot of traders prefer Heiken Ashi over Japanese candlesticks, especially when they are as effective in Example D at identifying overall trends, in this case, a sell-off of the USDCAD pair on a one hour chart showing a 700 pip sell-off.

Let’s take a look at some simple rules when trading Heiken Ashi:

Example E

1: Example E, Blue candles with no wicks to identify strong upward trends. These offer strong bullish signals, so let them run

Example F

2: Example F: Blue candles identify an uptrend; you might want to add to your bull position and close out short positions.

Example G

3: Example G, Candles with short bodies and long wicks show market indecision and possibilities for price action reversals. You might want to close your positions and wait for confirmation of a new trend direction.


Example H

4: Example H, Red candles identify a downward trend. You might want to look for opportunities to add to your short position. And exit long positions.

Example I

5: Example I, Red candlesticks with no wick signify strong downward price action. You might want to exit your long trades and add to your short positions as price action moves lower. And stay in the trade until there is an indication of price action reversals.
Therefore the Heiken Ashi can be a great technical tool in your armory.

Categories
Forex Course

74. Using Moving Averages To Identify The Trend

Introduction

In the previous lessons, we have understood the two types of Moving Averages and the difference between them. We have also seen which Moving Average should be used in different market conditions and the one that must be preferred most of the time. From this crouse lesson, let’s explore the real-time applications of Moving Averages and how we can find accurate trades using this indicator.

One of the simplest, yet important use of Moving Average is to determine the direction of the trend. This can be done by plotting the indicator on the chart and then deciding the position of candlesticks with respect to the line of Moving Average.

The ideal way of identifying a trend using MA is this – If the price action tends to stay above the moving average line, it usually signals an uptrend. Likewise, if the price action remains below the moving average line, it indicates a downtrend.

This approach of establishing the trend is too simplistic and also has a significant drawback. Let us understand that with the help of an example.

Below is the EUR/USD price chart, and we have added a 10-period MA line to it. According to the rules of MA, since the price is above the MA, we should be going ‘long’ in this currency pair.

Due to a news event, price drops suddenly and closes below the MA (in the below chart). So, this changes our plan, which means now we should be thinking of going ‘short’ in the currency pair. But before we do that, let us see what happens to the price in the next few candles.

The below image shows that the price fakes out and does not continue its downward trend. Hence, if we would have gone short, that would have resulted in the price hitting our stop-loss resulting in a loss. Let’s understand the problem with this setup.

The strategy mentioned above is right, but the problem is that we are using a single period MA line stand-alone and not combining it with any other indicator. The best way to use MA for determining a trend is by plotting an extra Moving Average line on the charts instead of just one. It will give us a clearer idea if the pair is trending up or down depending on the sequence of the MAs.

The best way is to check if the ‘faster’ moving average is above the ‘slower’ moving average for an uptrend, and vice versa for a downtrend. In the below chart, we can see that the ‘faster’ SMA is above the ‘slower’ SMA, and this shows the strength of the uptrend. Also, the fake-outs that happen because of news releases will also have less impact on the indication given by the Moving Averages. Combining this knowledge with trendlines can help us decide if we have to go ‘long’ or ‘short’ in the currency pair.

Conclusion

Moving Averages can be useful for establishing the direction of a trend, but it should never be used stand-alone. If not other indicators, additional moving averages itself can be combined with an existing moving average to decide the direction of the trend. In the next article, we will be discussing how we can enter a trade using moving averages and profit from this indicator.

[wp_quiz id=”65733″]
Categories
Forex Price-Action Strategies

A Thing You May Notice in the H1 Breakout Strategy

We are going to demonstrate an example of the H1 breakout strategy in today’s lesson. Usually, the H1 breakout strategy does not make traders wait too long to hit the target. However, if the breakout level is a double top or a double bottom level on the H4 chart, the price gets even more momentum to hit the target. Today’s breakout level is a double bottom level on the H4 chart. Let us now find out what happens after the breakout.

After making a bearish move, the price makes a correction. The last candle on the chart comes out as a bearish engulfing candle. This means the price finds its resistance. If it heads towards the swing low and makes a breakout, price action sellers may jump into this chart to make some green pips by going short in the pair.

The last candle makes a breakout at the level of support. This is an explicit breakout. Please note that the price bounces at the same level earlier. This means this is a double bottom support level on the bigger chart. This is an H1 chart. Thus, this must be a double bottom support level of the H4 chart.

The next candle closes below the breakout candle. It confirms the breakout. The sellers may trigger a short entry right after the last candle closes by setting stop-loss above the level where the trend starts and setting the take profit with 1R.

The price heads towards the South with extreme pressure. The price is about to hit the target on the next candle after triggering the entry. It does not, but the sellers get their message. A strong bearish candle like this suggests that the pair would remain bearish at least for two more candles. That would be enough to hit the target.

The chart produces a bullish inside bar before hitting the target. If we count, it takes only three candles to hit take profit level. As mentioned, the H1 breakout strategy hits take profit level in a hurry. So does this one. If we calculate the next candle after the signal candle, we see that the candle comes out as a very strong bearish candle and generates strong bearish momentum. This is often seen when the H1 chart makes a breakout at a level, which is a double top or double bottom level on the H4 chart too. We do not need to concentrate on this if we aim to trade on the H1 breakout strategy. However, noticing such things help us be better traders to some extent.


Categories
Forex Assets

Understanding The USD/TWD Forex Currency Pair

Introduction

USDTWD is the abbreviation for the US dollar against the New Taiwan Dollar. Due to the involvement of Taiwan in this pair, this pair is classified as an Asian emerging currency pair. Here, the US Dollar is the base currency, and the New Taiwan Dollar is the quote currency.

Understanding USD/TWD

The TWD required to purchase one USD is determined by the price on the exchange rate. It is simply quoted as 1 USD per X TWD. For example, if the price of this pair was 25.856, a rounded figure of 26 TW Dollars are needed to buy one US Dollar.

Spread

The spread is a type of fee that is paid to the broker on each trade. The amount to be paid depends on the lot size traded and also the volatility of the market. It is simply the difference between the bid price and the ask price on the exchange board. The bid and ask price is typically different from different brokers. It also varies based on the execution model implemented by the broker.

ECN: 27 pips | STP: 30 pips

Fees

The commission that a broker charges on each of your trade is the fee. This, too, depends on the type of execution model. Note that there is no fee on STP accounts. However, this is covered by higher spreads.

Slippage

In market orders, one does not get the exact price at which they triggered their buy/sell button. It varies due to the market volatility and the broker’s execution speed. This could be in favor of or against the client.

Trading Range in USD/TWD

The trading range is a range of pip movement values in different timeframes. In simple terms, it tells the number of pips the currency pair has moved in a given timeframe. For example, if the minimum volatility value on the 1H timeframe is five pips, then it means that this pair moves at least five pips in about an hour or so. These values can be helpful in figuring the approximate P/L on a trade, even before placing the trade.

Procedure to assess Pip Ranges

  1. Add the ATR indicator to your chart
  2. Set the period to 1
  3. Add a 200-period SMA to this indicator
  4. Shrink the chart so you can assess a large time period
  5. Select your desired timeframe
  6. Measure the floor level and set this value as the min
  7. Measure the level of the 200-period SMA and set this as the average
  8. Measure the peak levels and set this as Max.

USD/TWD Cost as a Percent of the Trading Range

From the above table, one may even determine the total cost variation in trade in different timeframes for different volatilities. With these values, we can, in turn, determine the ideal way to trade this currency pair.

ECN Model Account

Spread = 27 | Slippage = 3 |Trading fee = 3

Total cost = Slippage + Spread + Trading Fee = 3 + 27 + 3 = 33

STP Model Account

Spread = 30 | Slippage = 3 | Trading fee = 0

Total cost = Slippage + Spread + Trading Fee = 3 + 30 + 0 = 33

The Ideal way to trade the USD/TWD

The magnitude of the percentages in the table represents how high or low is the cost of the trade. It is proportional to the cost of the trade. In the below table, we can clearly see that the costs are high in the min column, depicting high costs for lower volatilities. Similarly, low costs for high volatilities.

Also, the costs are pretty high on lower timeframes compared to the higher timeframes. So, this definitely is not the best pair to trade for scalpers. With an investment point of view, it could prove to be the best pair irrespective of the timeframe you’re trading. Talking about a positional trader, it is ideal to trade during those times when the volatility of the market is around the average values.

Another simple way to bring your costs down is by placing limit or stop orders instead of market orders. This considerably brings down the cost of the trade as the slippage in such orders is nil.

Below is an example of the cost percentages when the slippage is made zero.

Spread = 30 | Slippage = 0 | Trading fee = 0

Total cost = Slippage + Spread + Trading Fee = 0 + 30 + 0 = 30

Categories
Forex Market Analysis

Daily F.X. Analysis, March 05 – Top Trade Setups In Forex – Traders Braces for Choppy Sessions! 

On the forex front, the U.S. Dollar Index rebounded 0.2% on the day to 97.37, snapping a four-day decline, supported by better-than-expected U.S. economic data. The Research firm Markit will publish February German Construction PMI.

The U.S. Commerce Department will post January factory orders (-0.1% on month expected) and final readings of durable goods orders (-0.2% on month expected). The Labor Department will report initial jobless claims in the week ended February 29 (215,000 expected).

Economic Events to Watch Today  


EUR/USD – Daily Analysis

The EUR/USD retreated 0.3% to 1.1138, halting a four-day rally. The European Commission warned that France and Italy could fall into a technical recession, two-quarters of economic contraction, amid coronavirus impacts. On the other hand, official data showed that the eurozone’s retail sales grew 0.6% on month in January, and German retail sales were up 0.9%, both as expected.

If the risk-on sentiment continues to boost, the selling interest around the EUR could increase. At press time, major Asian indices like Japan’s Nikkei, South Korea’s Kospi, Hong Kong’s Hang, and the Shanghai Composite index are reporting notable gains. The S&P 500 futures, however, are shedding 0.90%.

If the OPEC meeting strengthens an oil price bounce, the risk sentiment will likely increase, pushing the EUR currency and other safe-haven currencies lower. The pair is currently sidelined just below 1.1140.

Besides this, the currency pair will likely take cues from the U.S. weekly unemployment claims, Challenger Job Cuts data for February, and the 4th-quarter Unit Labor Costs figure scheduled for release during the North American trading hours. The European data docket is thin.

Daily Support and Resistance

  • S1 1.0955
  • S2 1.1047
  • S3 1.109

Pivot Point 1.1139

  • R1 1.1182
  • R2 1.1231
  • R3 1.1323

EUR/USD– Trading Tips

On Tuesday, the EUR/USD is trading sideways around 1.1179. The EUR/USD may drop to complete the bearish retracement. On the lower side, the 38.2% Fibonacci retracement is likely to support the EUR/USD at 1.1109, and violation of this level can drive more selling until 1.1085 which marks the 61.8% Fibonacci level. The RSI and MACD are in the buying zone but seems to take a bearish. The MACD’s histograms are becoming smaller on the buying side, which suggests the odds of selling in the EUR/USD. Consider taking buy trades above 1.1119.  


GBP/USD– Daily Analysis

The GBP/USD rose 0.5% at 1.2873. The officials from the European Union and the United Kingdom continue to oppose each other in every phase of post-Brexit trade deal talks. The Fisheries matter is the key factor for the British negotiators, and they have given a warning to the deploy Navy to safeguard the waters from the bloc’s ships if no deal is agreed by June.

It is worth to mention that the Sky News spots former business secretary Andrea Leadsom while saying that the government’s previous willingness for a possible no-deal Brexit. Which

Att he coronavirus front, the deadly virus continues to spread outside China with California recently declaring a state of emergency. However, the global policymakers struggle to control the same, and it seems to have helped the risk-tone sentiment. As in result, the U.S. 10-year Treasury yields remain positive above 1%, whereas stocks in Asia are also positive by the press time.

The BOE Governor Mark Carney is scheduled to speak at University College London and will be key to watch for the U.K. central bank’s actions to control COVID-19 implications. However, the incoming Governor Andrew Bailey has already said that the BOE should wait for more clarity about the economic slowdown from the coronavirus outbreak before making any decision to cut interest rates ahead.

Daily Support and Resistance

  • S1 1.2631
  • S2 1.2734
  • S3 1.28

Pivot Point 1.2837

  • R1 1.2903
  • R2 1.294
  • R3 1.3043

GBP/USD– Trading Tip

The GBP/USD is trading with bullish bias after having violated the horizontal resistance level of 1.2885. As suggested earlier, the GBP/USD overall trading bias remains bullish, and it’s pretty much likely to go after the next resistance level of 1.3019.

The GBP/USD’s immediate support is likely to be found around 1.2870, and below this level, the GBP/USD may aim for the 1.2760 area. The MACD and RSI are in the buying zone, supporting the bullish bias for the GBP/USD. Let’s look for long positions above 1.2837 today.  


USD/JPY – Daily Analysis

The USD/JPY currency pair failed to maintain its overnight bullish trend and reached the fresh lower end of its daily trading range near the 107.30 level because of the greenback weakness. The USD/JPY currency pair 107.34 and consolidates in the interval between 107.0 – 107.73.

As we already mentioned that the pair failed to maintain on the previous day’s recovery move from 5-month lows and faced some fresh supply near the 107.75 regions on Thursday in the wake of subdued U.S. dollar price action.

Moreover, the U.S. yields have recovered slightly from the lows seen after the U.S. Fed’s rate cut. The 2-year yield is currently trading at 0.68%, representing a seven basis point gain on the overnight low of 0.61%, and the 10-year yield has recovered to 0.98% from $0.91%. 

As in result, the safe-haven demand for the yen has weakened in Asia. As we already mentioned that the USD/JPY pair is currently trading at 107.27, representing a 0.17% gain on the day, having hit a high of 107.52 a few minutes before press time. 

Daily Support and Resistance

  • S1 105.75
  • S2 106.93
  • S3 107.63

Pivot Point 108.1

  • R1 108.8
  • R2 109.28
  • R3 110.46

USD/JPY – Trading Tips

The USD/JPY is trading at 107.250, staying mostly outside the tight trading range of 108.400 – 107.400. It’s mostly due to the weakness in the U.S. dollar and a slight safe-haven appeal, which is triggered in the wake of Coronavirus. The pair has recovered a bit to complete retracement until 107.650. 

For now, the USD/JPY has formed a bearish series of Doji pattern over 107.013, which could trigger further selling if the 107.013 level gets violated. We need to pay attention to the USD/JPY as the closing of candlesticks below 107.013 level can provide us selling trade with a take profit of around 106.500 and 105.860.  

All the best for today! 

Categories
Crypto Market Analysis

Daily Crypto Review, Mar 5 – Bitcoin uncertainty leading to a lack of buying or selling pressure

The crypto market had a green day, with only a few cryptocurrencies ending up in the red. Bitcoin is currently trading for $8,882, which represents a 0.95% increase on the day. Meanwhile, Ethereum gained 0.53% on the day, while XRP lost 0.05%.

Energi took the position of today’s most prominent daily gainer, with gains of 27.96%. On the other side, Bitcoin SV lost 4.56% on the day, making it the most prominent daily loser.

Bitcoin’s dominance managed to increase quite a lot over the past 24 hours. Its value is now 63.6%, which represents a 0.98% difference to the upside when compared to the value from when we last reported.

The cryptocurrency market capitalization increased slightly in the past 24 hours. It is currently valued at $255.45 billion, which represents an increase of $2.45 billion when its value is compared to the value it had yesterday.

What happened in the past 24 hours

Andrew Bailey, the next governor of Bank of England, expressed his sentiment towards crypto yesterday in London. He argued that anyone putting money into Bitcoin should prepare to lose everything.

Bailey shared his thoughts on Bitcoin to members of the U.K. Parliament at a Treasury Select Committee hearing, which happened on Mar 4. Bailey expressed his dislike towards Bitcoin and other cryptocurrencies as a whole before saying that:

“If you want to buy Bitcoin, be prepared to lose all your money… [Bitcoin] has no intrinsic value.”

Honorable mention

Cardano

The legal leader at Big Four’s PwC, Gunther Dobrauz, recently expressed his opinion about Cardano and showed open support to the people responsible for Cardano’s development.

Dobrauz claimed that decentralization is the future, and that the Cardano Foundation and the team surrounding the IOHK CEO and founder Charles Hoskinson are certainly a “huge part of this” future in a tweet on Mar 3. IOHK is the blockchain company behind Cardano as well as Ethereum Classic.

_______________________________________________________________________

Technical analysis

_______________________________________________________________________

Bitcoin

Bitcoin had a slow day with quite predictable price movements. Buyers and sellers bound its price between $8,400 and $9,000. Bitcoin has been staying in this range for some time now with no real pressure to go up or down. When compared to the yesterday’s price, Bitcoin did manage to gain some value, breaking the $8,825 line, but quickly stopping at the $8,980 one.


Bitcoin’s volume is slightly below average when compared to this week, while its RSI level is starting to increase slightly. It is currently sitting at a value of 58.

Key levels to the upside                    Key levels to the downside

1: $8,980                                           1: $8,825

2: $9,115                                           2: $$8,650

3: $9,250                                            3: $8,535


Ethereum

Ethereum is in the same position as Bitcoin, as its price has been ranging for some time now, as well. There has been no sign of pressure towards any side. Ethereum is currently trading above the $225.5 line, bound by it to the downside and the $240 resistance to the upside. However, all pressure to the upside seems to fade far before Ethereum’s price reaches $240.


Ethereum’s volume is quite low, while its RSI is near the middle of the value range, sitting at around 52.

Key levels to the upside                    Key levels to the downside

1: $240                                                1: $225.5

2: $251.3                                            2: $217.7  

3: $259.5                                             3: $198


Ripple

XRP is the only crypto out of the top3 that ended up in the red. Its price is also bound in a range, sitting between $227 and $2454. XRP’s price is not pressured to any side and is trading freely within this range. However, with fading volume, the volatility is fading as well, and the up and down movements seem smaller and smaller. XRP is now trading slightly above the $0.235 support line.


XRP’s volume is currently below average, while its RSI level is near the middle of the value range, sitting at around 53.

Key levels to the upside                    Key levels to the downside

1: $0.2454                                          1: $0.235

2: $0.266                                            2: $0.227

3: $0.285                                             3: $0.221

Categories
Forex Daily Topic Forex Psychology

Sentiment Analysis- An Introduction


Market Sentiment

The Market sentiment term is used in reference to the mood of the market traders. Sometimes most traders feel fear and pessimism, and at other times they feel overconfident positive and, even, greedy. Investors trade their beliefs about the market, and the beliefs are raised by its over-protective system one (Please, read https://www.forex.academy/know-the-two-systems-operating-inside-your-head/). Thus, they react emotionally to the market, and these reactions influence the market at the same time that the market is changing their emotions.

The two systems

In the mentioned article, we talked about the work of Dr. Daniel Kahneman and the Two-systems model to explain people’s behavior. System one is fast and closely related to the primal emotions and instinctive knowledge. In contrast, system two is slow and is the way people use in rational thinking, computations such as math operations such as counting. We also said that system two trust system one most of the time. That is the way we are programmed. System one is a warning system if danger appears. 

Market Sentiment is a Contrarian Indicator

But the marketplace behaves very differently from the real world where system one was trained. Thus, market sentiment is a contrarian indicator. That is because the majority of market participants are non-professional investors moved mainly by greed or fear. Therefore, when a large portion of traders shows expectations about the future curse of an asset pointing to one direction, the market tends to move in the opposite direction. That is logical. Let’s suppose that a large percentage of retail investors think the EURUSD is going to rise significantly. That means they are invested in or plan to do it right away. At the times when the crowd is the most bullish, it is when they are nearly fully invested. 

The market is fueled by the buyer side. When everyone has already invested in the EURUSD most of their funds, almost no fuel is left to lift it further, as they don’t have more financial capacity to continue investing. Thus the demand shrinks. Only the supply side is left, since professionals, who sold every available lot to the masses, are not willing to buy that high; therefore, the prices should fall.

The Market Players

There are three types of market participants: The informed, the uninformed, and the liquidity players. The informed players have insider information about the course of the fundamental drivers and can position themselves in the direction of the future trend. These are the institutional traders. They tend to sell at the top, when the crowd is mostly optimistic and buy at the bottom when the public sees no end to the drop.

 Uninformed traders are the majority of retail traders. They act moved by greed and fear. Their greed made them bet with disproportionate leverage at the wrong moments. Their fear made then close their positions at the worst possible time or close it with minimal gains so as not to lose. 

 Liquidity traders are professional traders interested in short-term plays, so they mostly do not affect the primary market trends. On the forex, Liquidity traders operate using technical analysis and price-action strategies, using money management schemes and systems that have been proved to be profitable.

Traders are their worst Enemies

  •  Everybody knows they should buy low and sell high, but the majority buy high and sell low.
  • Everybody thinks it is easy to be successful in trading and be rick
  • Anyone should know that panic selling is a bad idea, but nobody follows the advice.
  • The major part of market signals is worth less than a coin toss, but people still crave them and then overtrade and lose at the first slight market retracement.
  • Nobody takes seriously trading with reward to risk ratios over two. Instead, they prefer High percent winners with lousy RR ratios.
  • Everybody trades untested strategies. Thus, they ignore the statistical parameters of the system, and, even, they cherry-pick the signals.
  • Nobody knows about position sizing even when they want to trade at maximal leverage.

Advice for you

Market Sentiment is a contrarian indicator. If you consider yourself a uniformed trader ( and 85% of retail traders are), trade against yourself. A lot of brokers trade against you, and they are getting rich.

Instead of one impulsive trade based on greed, consider yourself direction agnostic by taking two opposing trades using 15-pip away stop orders and a 2:1 Reward: Risk ratio: 

Practical System Example:

Two simultaneous and opposing orders with a Reward/Risk Ratio of 2.

1 One LONG EURUSD position
  • Buy Pending Order: Current price + 15 pip buy stop order
  • Stop-loss: 20 pips below the entry price
  • Take profit: 40 pips away from the entry price
2 One SHORT EURUSD position
  • Sell-short Pending Order: Current Price – 15 pip Sell stop order
  • Stop-loss: 20 pips Above the entry price
  • Take profit: 40 pips below from the entry price

Using this kind of order, you let the price tell you its direction. One order gets filled the other not. Also, an RR ratio of 2:1 protects you against a decrease in the percent of the winners, since only one good trade every three is needed to be profitable. 

Money management

Finally, do not risk more than one percent of your total assets initially. On the EURUSD, we know that every pip is worth $10 on each lot. Thus a 20 pip stop-loss distance is worth $400. To trade a full lot risking one percent, your account balance should be $40,000. Therefore if you own just $4,000, do trade one mini lot, and if your account is only $400, you should use just one micro-lot.

Learning is hard. You will think that trading that way you won’t get rich quick, but just four things you must consider.

  1. Your initial purpose should be to learn your trading job and know how the system performs.
  2. The primary goal of a trader is to preserve the capital
  3.  Compounding is a powerful concept.
  4. You should know your risk and its characteristics.

References:

THE COMPLETE RESOURCE FOR FINANCIAL MARKET TECHNICIANS, THIRD EDITION, 2016. Charles D. Kirkpatrick II, CMT Julie Dahlquist, Ph.D., CMT

Thinking, Fast and Slow, Daniel Kahneman


Categories
Forex Market Analysis

Gold Soars Aimed Fed Rate Cut Decision – Quick Trade Plan! 

On Wednesday, the gold prices trade sideways after trading mostly on the higher side on Tuesday. The bullish trend was seen on expectations of interest rate reductions by central banks as influencing policymakers from the Group of Seven (G7) countries gathered to address how to embrace the economic shock from the global coronavirus break.

The Fed made an emergency interest-rate cut, the first one since the global financial crisis of 2008. The cut was of half a percentage point (to a range of 1.00%-1.25%) in response to mounting anxieties about the economic influence of the coronavirus. Fed Chair Jerome Powell pointed out: “The virus and the measures that are being taken to contain it will inevitably weigh on economic activity for some time, both here and abroad, however, we do consider that our work will contribute a meaningful addition to the economy.

Besides, the Reserve Bank of Australia lowered its benchmark interest rate by 25 basis points to a record low of 0.50%, saying that it is prepared to ease monetary policy further to support the economy amid the impact of the coronavirus.

The gold will probably trade higher further as traders seek to park their funds into safe-haven assets such as gold. It is mostly due to concerns over the global economic slowdown. 

The coronavirus is presently expanding faster outside China, and the US Fed’s emergency rate reduction disturbed financial markets; thus, the demand for safe assets like gold will grow.


Daily Support and Resistance

Support    Resistance 

1,606.47    1,662.39

1,572.03    1,683.87

1,516.11    1,739.79

Pivot Point 1,627.95

At the moment, gold is expected to gain a critical resistance near 1,651 level, and breach of this can stretch the bullish trend till 1,662. As we can see on the 4-hour chart above, the gold has formed a Doji candle followed by a strong bullish candle, which is suggesting that there are chances of a bearish retracement below 1,652 level. On the lower side, the immediate support stays around 1,632 and 1,613. Let’s consider staying bullish above 1627.95 and bearish below 1,652 today. Good luck! 

Categories
Crypto Videos

How To Make Money In Crypto Using Fibonacci Part 1

How to make money in crypto using Fibonacci retracements – part 1/2

The Fibonacci retracement level tool is one of the most popular and most effective tools in crypto trading (and trading in general). This tool is associated with helping traders determine the key levels to place buy and sell orders.
Traders who properly know how to utilize this tool can determine crucial levels of support and resistance with ease. However, to fully understand how and why this tool works, we have to go over how the Fib retracement tool has been created.

About Fibonacci


Leonardo Bonacci, widely known as Fibonacci, was an Italian mathematician born in 1170. Besides being a brilliant mathematician, Leonardo was also an avid traveler.
While traveling, he discovered a Hindu-Arabic numerical system that he explored. He saw that this system had some advantages over the current European system (at that time).
Bonacci published a book called “Liber Abaci.” The book included examples on how to use these calculations in every day uses such as bookkeeping, weight and measurement conversions, and human interest calculations, among other things.

Fibonacci Levels

An interesting proposal within Bonacci’s book was based on an observation of how the population of rabbits grew in ideal conditions. The solution to the rabbit problem was found within a mathematical sequence, which we now know as Fibonacci numbers.
What’s even more strange is that this was not the first time that this sequence of numbers was recorded. In fact, there were many more.
The ratio of numbers, which we know today as the Golden Ratio, was discovered by a Greek architect called Phidias between the years of 500BC and 432BC.
So, why are these levels important in trading?
The history and the research of many people showed that the Fibonacci sequence is found all over the geometry of nature. This sequence can be found in things like animal skin, DNA structure even spirals within a seashell.


Most financial markets (and the cryptocurrency market is no exception) will reveal this Golden Ratio on its time and price periods, where a retracement of 61.8% is typically found after a 100% gain or loss.

Conclusion

So to sum it up, Fibonacci retracement levels are referring to simple areas of support and resistance, and that is derived from the way nature works. These retracement levels are often used by traders to determine how much a move to one side will retrace once it stops. This way, they can have a better grasp on support and resistance levels as well as possible entry and exit points.

Check out part 2 of making money using Fibonacci retracements to see examples of how these levels work in real trading.

Categories
Forex Videos

We Told You So! Forex Black Swan Event – what Happens Next!

The Convid-19 Pandemic Black Swan Event

We hate to say I told you so, but we pretty much called this crisis out back in January, in our article about How to guard your financial assets against the Coronavirus Outbreak.
Those who heeded our warnings had a great opportunity to convert equities to cash, while stocks were at an all-time high, which would have safeguarded them against the biggest equities crash in market history. Other aspects pertaining to the crisis have been largely fluid, with the possibility of a virus outbreak in Japan, initially, USDJPY pair went to bid, targeting the 112.00 handle, and when that did not happen the yen currency reverted back to being a safe haven. And where just a day ago the pair found support at 110.0, it is now tumbling and currently trading at 108 70.


Similarly, the rhetoric from the Swiss National Bank that they were happy with negative interest rates and ready to intervene in the markets in support of a weaker Swiss franc, which has been ignored by the markets, while the USDCHF pair has moved lower and is currently training at 0.9650, flying in the face of the SNB’s threats.
Yesterday also saw the biggest daily move in almost seven months in an otherwise subdued performance of the EURUSD pair, which pushed 125 pips higher and where it hit a high of 1.1050. Amazing, bearing in mind that only yesterday, the German health minister warned of a high probability of the Convid-19 virus causing an epidemic in Germany.


This has led to the dollar coming off its highs above 99.00 on the dollar index to below 98.00 currently, while the market price in a 0.5% interest rate cut at next month’s Federal Reserve meeting. And of course, the possibility of supply chains being affected by the virus outbreak, and signs that the problem may cause more damage to the US and indeed the global economy than was previously predicted.

None of this has been helped by the fact that US equities, until last week, were at record highs, and one wonders why that was the case, especially as the levels were not supported by traditionally more modest earnings to value calculations. And the fact that the world may well have been fed false information from the Chinese Government regarding the contagiousness of the virus in the early days, and that they would get it under control. The proverbial stuff really hit the fan when the virus took hold in South Korea, Hong Kong, and Italy, and when that started to affect airlines, who restricted flight destinations and whose stocks suffered immediately, then the second contagion set in market panic selling.
So where do we go from here? The markets are going to be incredibly data-sensitive, and will also be focusing heavily on policymakers’ decisions with regard to what financial tools they will implement in the event of further escalation of the crisis. Overall, we expect further toing and froing of the dollar index, further flight to safe assets, including precious metals such as gold, yen, and Swiss franc. And further weakness in the Canadian loonie, which recently found resistance at 1:33 against the dollar, but which has now punched well above 1.34 area as oil prices continue to fall.


Cable is capped at the 1:3000 level due to its spat with the European Union and the continuing risk that it may not be able to complete a trade deal by December 2020, leaving the possibility of WTO trading rules needed to be applied and the obvious disarray confusion and the likelihood of a damaging fall out between the two sides. We expect the pair to find support at 1.2750.
AUDUSD and NZDUSD both remain southbound; such is their dependence on exporting to China.

Looking forward, canny traders and investors will be waiting on the sidelines for the virus to abate, supply Lines reinstated, and positive market data before confidently coming back into the equities space on a buying spree.
Until then, expect more market volatility, and thankfully, fewer tweets from President Trump, who has been noticeably quiet this week.

Categories
Forex Basic Strategies Forex Daily Topic Forex Price Action

Support, Resistance and Trade Management

-Support and Resistance are the two most important concepts in the financial market. Forex traders strongly rely on support and resistance, as well. Price action traders’ main weapon is support and resistance. In today’s article, we are going to demonstrate an example of how the price reacts to a major level of support and resistance. Let us get started.

Look at the chart. The price consolidates around the red-marked level, it finds its resistance there and makes a bearish move. After having a correction, it makes the new lowest low. This is now the sellers’ territory. Let us assume that there is no significant level, which may hold the price as support. Thus, we are not able to mark any level as support. The sellers are to wait for the price to consolidate and produce a bearish reversal candle to offer them short entry in this chart.

The price makes new lowest lows and heads towards the South with good bearish momentum. However, it seems that it may have found its support. It consolidates for a while around the red-marked level and produces a bullish engulfing candle. The buyers on the minor chart may get them engaged to keep an eye on the chart to go long above the highest high of the last candle. Let us find out what happens next.

The price heads towards the North. It consolidates and produces another bullish engulfing candle. It means the chart is now the buyers’ territory. This is where the game of support and resistance begins. You may have noticed that we have red-marked the level. This is the most significant level in this chart for the buyers. The price may consolidate and find its resistance in this chart before it reaches the red-marked level. However, this is where traders may make a decision concerning their long position. They may either close their whole trade or take partial profit.

The price keeps heading towards the North. It buyers are having a party here. They must not forget the red-marked level, though. Let us proceed to the next chart.

Look at the chart carefully. Do you notice that the price consolidates around the red-marked level, which is the swing high in this chart? It produces a bearish engulfing candle followed by another bearish one. The last candle on this chart comes out as a bullish inside bar. If the next candle comes out as a bearish engulfing candle, the sellers may drive the price towards the South. I am sure now you know where the sellers are to be careful with their trade management. Yes, they must take the red-marked support (swing low in this chart) into account to manage their short entries.

Categories
Crypto Market Analysis

Daily Crypto Review, Mar 4 – Bitcoin and Altcoins Recover, Look for Further Strength

The crypto market had a pretty quiet but effective day. Most cryptos that were going down yesterday ended that move and gained some value. Bitcoin is currently trading for $8,808, which represents a 0.24% increase on the day. Meanwhile, Ethereum lost 0.47% on the day, while XRP gained 0.84%.

Matic Network took the position of today’s most prominent daily gainer, with gains of 21.46%. On the other side, Kyber Network lost 9% on the day, making it the most prominent daily loser.

Bitcoin’s dominance managed to decrease slightly over the past 24 hours. Its value is now 62.62%, which represents a 1.12% difference to the downside when compared to the value from when we last reported.

The cryptocurrency market capitalization stayed at the pretty much same spot from when we last reported. It is currently valued at $253 billion, which represents a decrease of $1.43 billion when its value is compared to the value it had yesterday.

What happened in the past 24 hours

The tax bureau of Beijing made an official announcement that it will start implementing invoicing via blockchain within the city on March 2. Beijing wants to bring transparency, traceability as well as immutability by using blockchain invoicing.

The Beijing tax bureau will slowly and gradually carry out the promotion of the blockchain invoicing service throughout the city.

Honorable mention

MakerDAO

Major decentralized finance (or DeFi for short) player MakerDAO established a partnership with the payment processor Simplex. This partnership came to life to create a fiat on-ramp for MakerDAO’s Dai decentralized stablecoin.

The partnership allows people to buy Dai with the credit and debit cards that Simplex’s partner firms issued.

_______________________________________________________________________

Technical analysis

_______________________________________________________________________

Bitcoin

Bitcoin had a pretty slow day. However, the downtrend price movement that happened yesterday ended and Bitcoin moved up slightly. After the whole day of price going down, BTC bounced off of its $8,650 support and changed direction. Bitcoin is now right below the $8,825 which is did not manage to pass yet.


Bitcoin’s volume is slightly below average when compared to this week, while its RSI level is in the middle of the value range, sitting at around 51.

Key levels to the upside                    Key levels to the downside

1: $8,825                                           1: $8,650

2: $9,115                                           2: $$8,535

3: $9,250                                            3: $8,250


Ethereum

Ethereum had a slow day as well. However, its price movement did not make it to the green side when compared to the price of 24 hours ago. The slight downwards-facing move seems to have ended, and Ethereum stabilized right above the $225.5 support level.


Ethereum’s volume is quite low, while its RSI is in the middle of the value range, sitting at around 49.

Key levels to the upside                    Key levels to the downside

1: $240                                                1: $225.5

2: $251.3                                            2: $217.7  

3: $259.5                                             3: $198


Ripple

XRP also made a similar move as Bitcoin and Ethereum did. Once the bear pressure was weakened, bulls took over and brought the price above $0.235. XRP is now consolidating in the middle of the range, bound by $0.235 level to the downside and $0.2454 level to the upside.


XRP’s volume is slightly below average, while its RSI level is in the middle of the value range, sitting at around 50.

Key levels to the upside                    Key levels to the downside

1: $0.2454                                          1: $0.235

2: $0.266                                            2: $0.227

3: $0.285                                             3: $0.221

Categories
Forex Market Analysis

Daily F.X. Analysis, March 04 – Top Trade Setups In Forex!

On the forex front, the U.S. dollar weakened against other major currencies, dragged by the Fed’s emergency rate cut. The ICE U.S. Dollar Index fell 0.2% on the day to 97.14. Most of this came in response to the U.S. Fed fund rate cut on Tuesday

Later today, February Automatic Data Processing (ADP) jobs report (+170,000 private jobs expected) and the Fed’s Beige Book economic report will be released.

February Markit U.S. Service PMI (final reading, 49.4 expected) and Institute for Supply Management’s (ISM) Non-Manufacturing PMI (54.9 expected) will also be reported.

Economic Events to Watch Today  


EUR/USD – Daily Analysis

The EUR/USD rose 0.4% to 1.1179, posting a four-day rally. Official economic figures revealed that the eurozone’s jobless rate was steady at 7.4% in January, and CPI grew 1.2% on year in February, both as expected.

The EUR currency performed as a safe-haven currency during the recent periods of Coronavirus. This is evident from EUR/USD’s near 90-degree surge from 1.0788 to 1.12 seen in the last 8- trading days. Therefore, the EUR currency will likely decrease further if the risk sentiment improves, allowing a big decline in EUR/USD. As in result, the futures on the S&P 500 are reporting a 1.2% gain. 

Looking forward, German and Eurozone retail sales and final German and Eurozone PMI readings will be key to watch by traders. The US ISM non-manufacturing (Feb) will take center stage. The research firm Markit will report data of February Services PMI for the eurozone (52.8 expected), Germany (53.3 expected), France (52.6 expected), the U.K. (53.3 expected), and the U.S. (49.4 expected).

The European Commission will post January retail sales (+0.6% on month expected). The German Federal Statistical Office will report January retail sales (+0.9% on month expected).

Daily Support and Resistance

  • S1 1.0826
  • S2 1.0972
  • S3 1.1053

Pivot Point 1.1119

  • R1 1.1199
  • R2 1.1265
  • R3 1.1412

EUR/USD– Trading Tips

The EUR/USD is trading upward near 1.1179, as the pair seems to trade in the overbought zone. Bulls seem to get exhausted, and sooner or later, the EUR/USD may drop to complete the bearish retracement. On the lower side, the 38.2% Fibonacci retracement is likely to support the EUR/USD at 1.1109, and violation of this level can drive more selling until 1.1085 which marks the 61.8% Fibonacci level. 

The RSI and MACD are in the buying zone but seems to take a bearish. The MACD’s histograms are becoming smaller on the buying side, which suggests the odds of selling in the EUR/USD. Consider taking buy trades above 1.1119.  


GBP/USD– Daily Analysis

The GBP/USD rebounded 0.6% at 1.2823, snapping a four-day losing streak. The Markit U.K. Construction PMI climbed to 52.4 in February (49.0 expected) from 48.4 in January.

The Asian markets got supported by the decisions of the nation of fiscal measures that their Western counterparts, like the Federal Reserve, which recently delivered the rate cut. While portraying the risk-recovery, the MSCI’s gauge of Asia-Pacific shares outside Japan registers 0.80% gains with Japan’s NIKKEI marking 0.40% profits by the time of writing.

Moving on, the investors will now keep their eyes on the coronavirus headlines as well as the related actions from the global policymakers for fresh impulse. 

On the economic front, final readings of the U.K. Services PMI for February, expected 53.3, followed by the US ISM Non-Manufacturing PMI, forecast 54.9 against 55.5 prior, will be key to watch.


Daily Support and Resistance

  • S1 1.2559
  • S2 1.267
  • S3 1.2712

Pivot Point 1.2781

  • R1 1.2823
  • R2 1.2892
  • R3 1.3003

GBP/USD– Trading Tip

The GBP/USD is rangebound, mostly trading in between 1.2850 – 1.2750 area. However, the GBP/USD overall trading bias remains primarily bearish. So far, the pair is forming neutral candles within this range, as it seems like investors are waiting for a solid reason to determine the next trends.

The GBP/USD’s immediate support is likely to be found around 1.2755, and below this level, the GBP/USD may aim for the 1.2660 area. The MACD and RSI are in the selling zone, supporting the bearish bias for the GBP/USD. Let’s look for short-trades below 1.2781 and bull trades above the same level today. 


USD/JPY – Daily Analysis

The USD/JPY currency pair flashing green and hit the bullish track from the 5-month lows mainly due to the uptick in the Asian equities, although, the bullish trend has been capped nearby 107.50 recently. But for now, the currency pair is currently trading at 107.59 and consolidates in the range between the 106.86 – 107.69.

At the equities front, the Major Asian indices, except Australia’s S&P/ASX 200, are reporting modest gains at press time. Asian investors seem to have taken heart from the decision by the U.S. Federal Reserve (Fed) to cut rates by 50 basis points, the single biggest cut in over a decade. 

Currently, Japan’s Nikkei is scoring 0.37%, and South Korea’s Kospi is up 1.4%. The Shanghai Composite index is also adding 0.14% along with a 0.80% gain in the S&P 500 futures. 

Moreover, the U.S. yields have recovered slightly from the lows seen after the U.S. Fed’s rate cut. The 2-year yield is currently trading at 0.68%, representing a seven basis point gain on the overnight low of 0.61%, and the 10-year yield has recovered to 0.98% from $0.91%. 

As in result, the safe-haven demand for the yen has weakened in Asia. As we already mentioned that the USD/JPY pair is currently trading at 107.27, representing a 0.17% gain on the day, having hit a high of 107.52 a few minutes before press time. 

Daily Support and Resistance

  • S1 105.75
  • S2 106.93
  • S3 107.63

Pivot Point 108.1

  • R1 108.8
  • R2 109.28
  • R3 110.46

USD/JPY – Trading Tips

On Wednesday, the safe-haven currency pair USD/JPY is trading at 107.550, having violated a narrow trading range of 108.400 – 107.400 due to the weakness in the U.S. dollar. However, the pair has recovered a bit to complete retracement until 107.650. The USD/JPY pair is still trading with a mixed bias around 107.555, and it has a high probability of moving towards the next support level of 107 and 1o6.65p.

We see on the 4-hour chart, the USD/JPY has created a bearish engulfing pattern under 108.350, which could trigger further selling until 107.338. We need to pay attention to the USD/JPY as the closing of candlesticks above 108.338 level can provide us with a secure buy trade with a take profit of around 109.650.  

All the best for today! 

Categories
Forex Basic Strategies

Identifying And Trading The Bullish & Bearish ‘Crab’ Pattern

Introduction

We have learned the importance of harmonic patterns in our recent Forex strategy articles. Also, we have understood how to identify and trade many of the famous harmonic patterns like Butterfly, Bat, Gartley, etc. In this article, let’s explore one last pattern in the harmonic group – the Crab pattern.

H.M Gartley introduced the Crab pattern in 2001, and Scott Carney added the respective Fib ratios to it. Just like the other harmonic patterns, the ‘Crab’ is also a reversal pattern that is used to identify when the trend of an asset is going to end and potentially reverse. There are both bullish and bearish Crab patterns, and they indicate bullish and bearish reversals in the market, respectively.

Each leg of the Crab pattern is denoted by a letter, and in total, there are five swing points – X, A, B, C, and D. Just like other harmonic patterns, there are different rules to trade the Crab pattern. Only trade this pattern and take positions if all of these rules get validated.

Crab Pattern Rules

XA – In its bearish version, the first leg of the pattern forms when the price of an underlying asset decline sharply from point X to point A. It can be any random bearish move. (vice-versa in the case of bullish)

AB – The AB leg is the counter-trend move to the previous leg and must retrace from the 38.2% to 61.8% of the distance covered by the first leg.

BC – Concerning the BC leg, price action changes its direction and goes down to 38.2% or 88.6% Fibs ratio of the AB leg.

CD – The CD move is the last and most important leg of the Crab pattern. So for printing this leg, the price action again changes its direction and goes to counter-trend to XA. The CD leg reverses between the 161.8% of the XA leg.

To identify the Crab pattern, one must follow all the above rules. Take a long or short position at point D as this is where the Crab pattern completes. Below is the pictographic representation of bullish and bearish crab patterns.

Crab Pattern – Trading Strategies 

Trading The Bullish Crab Pattern

The Crab pattern is quite popular in the market, so the respective tool with embedded Fib ratios is widely available in most of the trading platforms. The images we are using in this article are taken from the TradingView tool. If you are also someone who uses TradingView software, you can find this pattern’s charting tool on a toolbar on the left side.

So, first of all, select the Crab pattern charting tool and follow all the above rules to identify the pattern. Keep in mind that the Fibonacci ratios are incredibly crucial to trade the Crab pattern. If you recognize the pattern on a price chart and if you find the Fibs ratios not matching with the pattern rules, it means that the pattern is invalid. So do not trade that pattern.

Identifying The Pattern

The below image is a four-hour chart of the GBP/USD Forex pair. Overall the market was in a downtrend, but when all the rules of the Crab pattern are met, price action changes direction. As you can see below, XA is any random bullish move. The price action then retraces to 61.8% of the AB leg. Furthermore, the price action goes up again and retraces close to the 38.2% Fib level of the AB leg.

At this stage, price action confirms the three moves of the pattern following all the rules. In the end, the last move of the pattern clears that the Crab pattern was genuine. This move of the pattern is the longest one, and it has reached the 161.8% Fib level of the AB leg.

Entry, Stop-Loss & Take-Profit

As the price action confirms the pattern, we have immediately entered for a buy. If you are a conservative trader, make sure to wait for a couple of bullish confirmation candles to enter the trade.

We have four targets (X, B, C, A) to place the take-profit order in the crab pattern. In the beginning, we planned to book full profit at point A, but when the price crosses point B, the market turned sideways. So we have booked half of our profit at point B and then closed our full positions at point A.

We have seen most of the traders placing their stop-loss way below point D. However, that’s a wrong way to do it because they are risking more because of this simple logic – If the price action breaks point D, it automatically invalidates the pattern. Makes sense? In the above image, we can see that we have placed the stop-loss just below the D point, and overall, it was an 8R trade.

Trading The Bearish Crab Pattern

The below Daily chart represents the EUR/USD Forex pair. We have identified the bearish Crab pattern and plotted the Fib ratios on to the chart. As you can see, the market was in an uptrend. The first leg, which is XA, can be considered as a random bearish move. The AB bullish move reached close to the 38.2% of the XA leg. The third leg, BC, goes in the counter direction and retraces to the 88.6% Fib level of the AB move. The last leg is crucial because our decision making depends on this move alone. We can see the last candle reaching close to the 161.8% level of the AB leg, and this confirms the appearance of the bearish Crab pattern.

Entry, Stop-Loss & Take-Profit

We immediately went short in this Forex pair as soon as the final leg of the pattern closed. For some traders, it might be challenging to take a trade on the face of strong buyers. But when the market follows all the rules of the pattern, you can confidently pull the gun. Furthermore, the bearish candles increase the chance of trade working in our favor. Conservative traders can wait for these confirmations and then take the trade. In the end, price rolls over, and prints a brand new lower low.

We have followed the same rules of risk management as we have done with a bullish Crab pattern. However, we were being optimistic and placed the take-profit order at the higher timeframe’s major resistance area. If the market had started moving sideways, we would have booked our profits either at B or C or A. Stop-loss is placed just above point D, as discussed before.

Conclusion

The Crab patterns appear less frequently compared to other harmonic patterns in the market. But when it does, it often provides a high risk to reward ratio trades. If you are new to this pattern, you need a bit of experience and skill set to identify and trade this pattern on the price chart. Once you master this pattern, new trading opportunities will emerge, which can exponentially grow your trading account. In the end, trade the bearish Crab only when it appears in an uptrend, and trade the bullish Crab only when it appears in a downtrend. Only then the odds of your trades performing increase.

We hope you find this educational article informative. If you have any queries, please let us know in the comments below. Cheers.
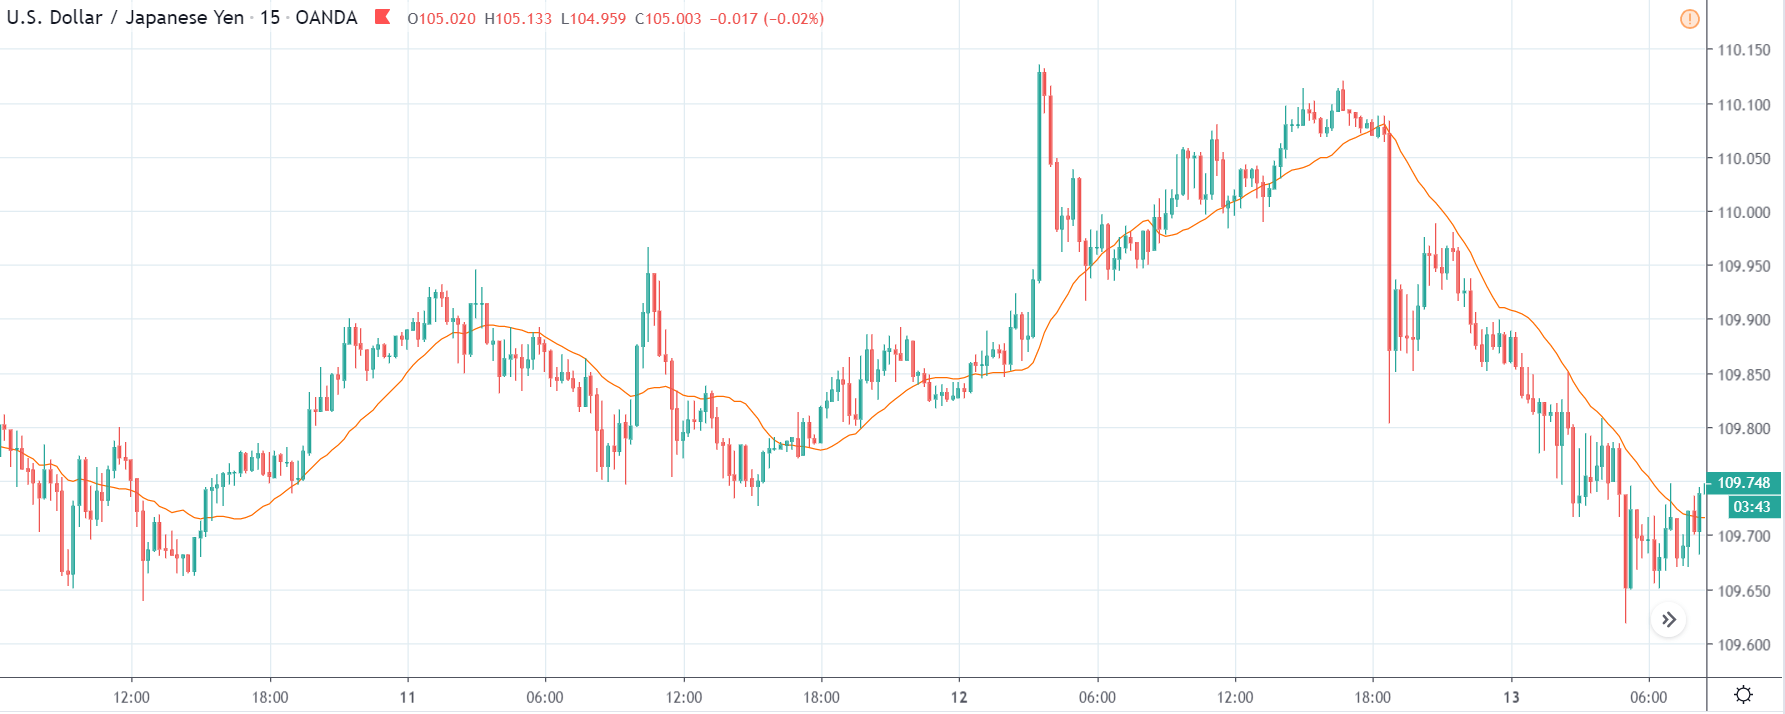
Categories
Forex Course

72. Understanding Exponential Moving Average

Introduction

In the previous course lesson, we understood the first type of Moving Average, which is SMA. We also saw how spikes could distort the SMA. The solution to this distortion is the Exponential Moving Average (EMA); so, let’s discuss this type of MA in our lesson today.

The EMA gives more weightage to the recent change in prices and does not give much importance to previous data. Learning how to calculate and plot EMA on the chart will provide us with a clear understanding of which Moving Average should be used at different times of the market.

We shall take an example to explain the definition of EMA. This example will also show how the EMA overcomes a significant limitation of the SMA. In the below figure, we have plotted a 10-period SMA on the daily chart of a currency pair. Here we have chosen the USD/CHF currency pair as an example.

Since we are calculating the 10 ‘period’ SMA, we need first to note down the closing prices of the last ten periods days. The prices are as follows:

0.97806,0.97986,0.97528,0.97336,0.97536,0.97461,0.97536,0.97829,0.98156,0.97636.

The next step is to add the above-given numbers together and then divide the result by 10. This equals to 9.76804 / 10 = 0.97680. Therefore, the SMA for the last 10 days is 0.97680. The end of the orange SMA line in the above chart points exactly to the price 0.97860.

Now let us consider a case where, on the sixth day, dollar drops drastically due to a news event that was bad for the US economy. If the sixth candle drops to a price around 0.97000 (closing of all other remaining the same) due to the news release, the new SMA will now be calculated as follows:

(0.97806 + 0.97986 + 0.97528 + 0.97336 + 0.97536 + 0.97000 + 0.97536 + 0.97829 + 
0.98156 + 0.97636) / 10 = 0.97654

The resultant SMA is lower than the SMA we had obtained in the previous step. This means when the price dropped on Day 6, it created a notion that the trend is going to reverse, but in reality, it was just a one-time event that was caused by news. We need a mechanism that will filter out these spikes so that we don’t get the wrong idea. This is where EMA comes to our help.

Taking the above example, EMA gives more stress on the recent price movements, such as the closing prices of the last four candles. This means the spike that happened on the sixth day will be of less value and wouldn’t have much effect on the moving average. It is always a smart and better idea to focus on what traders are doing recently rather than what happened long ago. Always remember that the past data is of less significance to us.

The below chart shows the difference between the two moving averages when they are plotted simultaneously.

Notice that the purple line (10-period EMA) appears to be closer to the candles than the orange line (10-period SMA). This means the EMA is more accurate in representing the recent price action, and now we know why. So, the bottom line is to pay attention to the last few candles rather than candles of last week or last month.

Conclusion

That’s about the two types moving averages with their own advantages. The EMA is a better option to use when you are swing trading as it gives precise analysis than SMA due to the reasons mentioned above. EMA, too cannot be used standalone and should be paired with a trading strategy. In the next article, we will discuss the pros and cons of using SMA and EMA.

[wp_quiz id=”65573″]
Categories
Forex Daily Topic Forex Price-Action Strategies

Manage Your Trade Differently on Different Charts

In today’s lesson, we are going to demonstrate an example of an H1 breakout strategy. Before hitting the target, at some point, the price gets sluggish. Nevertheless, it hits the target in the end. Let us now proceed to find out the lesson it has to offer us.

This is an H1 chart. The price gets choppy within these two horizontal lines. It has a rejection and makes a bearish move upon producing a bearish inside bar. The chart is yet to make a breakout. Until it makes a breakout, it does not have anything to offer to the buyers or the sellers. However, as it stands, the buyers may have an upper hand here. Let us proceed to the next chart.

Here it comes. After a long while, a candle breaches through the level of support closing well below it. The candle has a long lower shadow, but the breakout is explicit. The sellers are to wait for the next candle to close its lowest low to trigger a short entry.

The next candle comes out as a strong bearish candle. This is one perfect looking bearish candle to attract the sellers to trigger an entry. The sellers may trigger a short entry right after the candle closes, setting stop-loss above the level where the trend starts with 1R.

As expected, the price heads towards the South with good bearish momentum. However, look at the last candle. It comes out as a spinning top. In a strong bearish trend, it is not considered as a strong bullish reversal candle. Moreover, it is an H1 chart, and the entry is triggered based on the H1 breakout strategy. Thus, the sellers must hold their position and wait. To be precise, they should not even look at this chart anymore by following the rule of ‘Set and Forget.’

The price hits the target. The next candle, after the spinning top comes out as a bearish candle. However, it closes within consolidation support. If it were an H4 or the daily chart, the sellers would have to close the trade manually. This is the difference between trading on the minor chart and major chart.

If we have a plan to take trading as our fulltime business, we may have to trade on different charts from the 15M to Weekly. Trade management varies from chart to chart. This is what we must remember. In the beginning, we shall master on a particular chart that we are comfortable with. Then, we may start trading on the other charts, preferably on the demo first. Once we are confident, we may trade on that chart in our live account. We must not apply a strategy or manage the trade the same way on the weekly chart that we are successful on the H1 or the 15 Chart.

Categories
Forex Market Analysis

Daily F.X. Analysis, March 03 – Top Trade Setups In Forex – Monetary Policy Report & G7 Meeting Under Spotlight! 

The Asian session was all about the Reserve Bank of Australia, and it’s a policy decision. The Reserve Bank of Australia’s (RBA) interest rate settlement at 0330 GMT was closely followed as it is the critical policy meeting since last week’s exciting change in money market pricing. The RBA has cut the interest rate by the 25-basis-point cut is all but inevitable, devising the Australian dollar exposed to a bearish bias.

The research firm Markit will publish February U.K. Construction PMI (49.0 expected). The European Commission will report February CPI (+1.2% on-year expected), January PPI (-0.4% on year expected), and jobless rate (steady at 7.4% expected).

Economic Events to Watch Today 


EUR/USD – Daily Analysis

The EUR/USD jumped 1.1% to 1.1146, the highest level since mid-January. European Central Bank President Christine Lagarde stated that ECB stands ready to “take appropriate and targeted measures,” amid risks to the economic outlook from the coronavirus epidemic.  

Later today, the eurozone’s January jobless rate (steady at 7.4% expected) and February CPI (+1.2% on-year estimated) will be reported.

Overall the risk sentiment remains mixed as the European stocks stabilized, with the Stoxx Europe 600 Index edging up 0.1%. The U.K.’s FTSE 100 rose 1.1%, and France’s CAC was up 0.4%, while Germany’s DAX dropped 0.3%.

Investor’s focus will remain on the research firm Markit which will publish February U.K. Construction PMI (49.0 expected). The European Commission will report February CPI (+1.2% on-year expected), January PPI (-0.4% on year expected), and jobless rate (steady at 7.4% expected).

Daily Support and Resistance

  • R3: 1.1412
  • R2: 1.1265
  • R1: 1.1199

Pivot Point 1.1119

  • S1: 1.1053
  • S2: 1.0972
  • S3: 1.0826

EUR/USD– Trading Tips

The EUR/USD is trading upward near 1.1109, as the pair seems to trade in the overbought zone. Bulls seem to get exhausted, and sooner or later, the EUR/USD may drop to complete the bearish retracement. On the lower side, the 38.2% Fibonacci retracement is likely to support the EUR/USD at 1.1095, and violation of this level can drive more selling until 1.1035 which marks the 61.8% Fibonacci level. 

The RSI and MACD are in the buying zone but seems to take a bearish. The MACD’s histograms are becoming smaller on the buying side, which suggests odds of selling in the EUR/USD. Consider taking sell trades below 1.1150. 


GBP/USD– Daily Analysis

The GBP/USD dropped 0.4% at 1.2804, down for a fourth straight session. Bank of England governor Mark Carney said BOE is working with the government and international authorities to “ensure all necessary steps are taken to protect financial and monetary stability”. The fury of the Coronavirus has led some investors to believe central banks will be expected to go behind dovish monetary policy to underpin the economy against the potential threat of a coronavirus. 

The Sterling continues trading with a bearish bias as the interest rate cut sentiment from 0.75% to 0.50% remains pretty stable. The Sterling also places a four-and-a-half-month low during the previous week versus the greenback as concerns of the economic collapse from the extensive Coronavirus provoked a dramatic selling in with worldwide markets.

The Bank of England announced it was serving with Britain’s finance ministry and international allies to ensure “all necessary measures are exercised” to preserve the banking system and the larger economy.

The GBP/USD also faced a bearish pressure as the global influence of the Coronavirus is beginning to show on a post-election improvement in U.K’s manufacturing, which came out on Monday. 

Daily Support and Resistance

  • R3: 1.3209
  • R2: 1.3015
  • R1: 1.2916

Pivot Point 1.2821

  • S1: 1.2722
  • S2: 1.2627
  • S3: 1.2432

GBP/USD– Trading Tip

The GBP/USD is consolidating in a sideways range, where the overall bias remains mostly bearish. The GBP/USD has already violated the previous narrow trading range of 1.2980 – 1.2880. On the 4-hour chart, the Cable has violated the descending triangle pattern, which is still keeping the pair under 1.2880. 

Below this level, the GBP/USD may aim for the 1.2660 area. The MACD and RSI are in the selling zone, supporting the bearish bias for the GBP/USD. Let’s look for short-trades below 1.2966 and bull trades above the same level today. 


USD/JPY – Daily Analysis

The USD/JPY rebounded 0.2% to 108.29. The safe-haven Japanese yen soared versus the greenback on Tuesday, as the traders curbed expectations for global monetary policy easing with concerns about its balance and effectiveness in fighting the economic collapse from the coronavirus break.

On Tuesday, the G7 finance diplomats and central bank directors carry a conference call later to consider steps to dispense with the outbreak and its widening economic radioactivity.

The call, which French and Italian experts, is scheduled at 1200 GMT, and with this, the traders are already betting on the sentiment that the U.S. Federal Reserve will begin a series of global monetary easing.

The dollar dropped 0.5% to 107.80 yen and trimmed lower on the Swiss franc to 0.9576 francs following a report that the G7 officials are meeting to decide no fresh fiscal or monetary pledges. In the U.S., the coronavirus-related death toll has grown to six. South Korea reported a total of 4,335 cases (28 deaths), Italy 2,036 cases (52 deaths), and Iran 1,501 cases (66 deaths).

Daily Support and Resistance

  • R3: 113.5
  • R2: 112.2
  • R1: 111.46

Pivot Point 110.9

  • S1: 110.16
  • S2: 109.6
  • S3: 108.29

USD/JPY – Trading Tips

The USD/JPY consolidates in a narrow trading range of 108.400 – 107.400 as the weakness in the U.S. dollar and stronger Japanese yen keeps the pair tossed. The USD/JPY pair recovered slightly in the wake of a bullish correction, but more selling pressure seems to come soon. The pair is trading bearish at 107.775, and it has high probability of moving towards the next support level of 107.338.

We can see on the 4-hour chart above, the USD/JPY has formed a bearish engulfing pattern below 108.350, which may trigger further selling until 107.338. We need to keep an eye in the USD/JPY as the closing of candles above 108.338 level can help us secure a buy trade with a take profit of around 109.650.  

All the best for today! 

Categories
Crypto Market Analysis

Daily Crypto Review, Mar 3 – Cryptocurrencies back to bear cycle? Argentina suspending its blockchain registering system

The crypto market ended its one-day uptrend and backtracked a bit from the gains it made over the past 24 hours. Bitcoin is currently trading for $8,761, which represents a 1.7% increase on the day. Meanwhile, Ethereum gained 3.02% on the day, while XRP gained 1.7%.
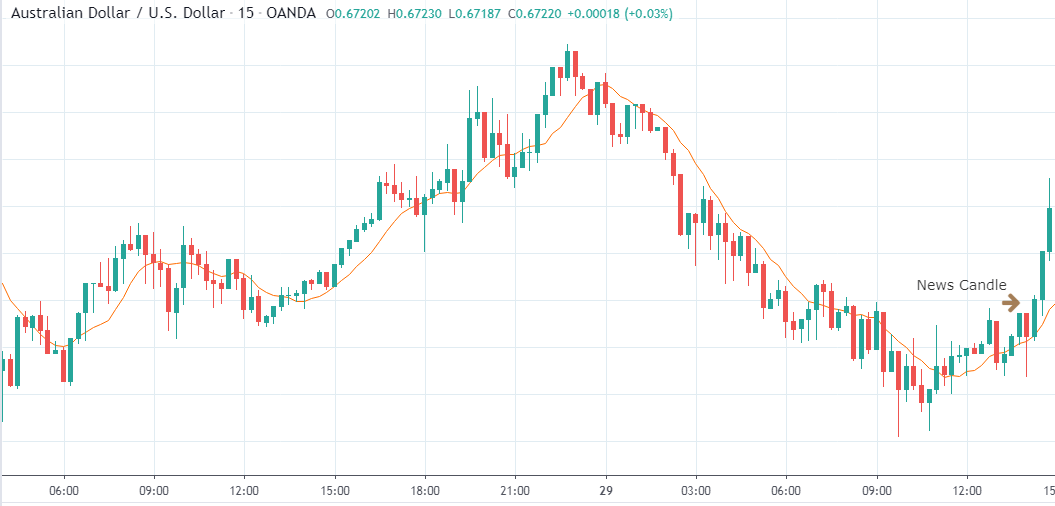
Aragon took the position of today’s most prominent daily gainer, with gains of 17.41%. On the other side, Aragon lost 7.56% on the day, making it the most prominent daily loser.

Bitcoin’s dominance managed to increase slightly over the past 24 hours. Its value is now 63.8%, which represents a 0.15% difference to the upside when compared to the value from when we last reported.
The cryptocurrency market capitalization stayed at the same spot from when we last reported. It is currently valued at $251.57 billion, which represents a decrease of $0.36 billion when its value is compared to the value it had yesterday.

What happened in the past 24 hours

The government of Argentina made an announcement that its national blockchain-based mechanism for registering new companies will be suspended for a period of 180 days.

This measure, according to the statements made by the head of General Inspectorate of Justice Ricardo Nissen to La Nación, is made so Argentina could reorder the registration of new companies so that the inspectorate could also participate in the entire process.

Honorable mention

EOS 

Block.one released EOSIO 2.0 in January 2020 as an upgrade to the protocol. Some cryptocurrency exchanges like Coinbase announced that there was trouble with the performance of the network once the new set of protocol improvements was installed. This implementation slowed down or even stopped deposits and withdrawals.

In the meantime, the EOS community voted to slash the network inflation from 5% down to 1%, which marked this event as the blockchain’s second massive token burn event ever since Q2 of 2019.

_______________________________________________________________________

Technical analysis

_______________________________________________________________________

Bitcoin

Bitcoin ended its one day long upswing which managed to reach all the way to $8980 before crashing slightly. The biggest cryptocurrency by market cap broke the $8,825 resistance and rushed towards price levels of above $9,000 but failed as bears kicked in. Bitcoin’s price is now dropping, currently trading just around the levels that BTC has when we last reported.


Bitcoin’s volume is quite average when compared to the past and this week, while its RSI level is just below the middle of the value range, sitting at around 48.

Key levels to the upside                    Key levels to the downside

1: $8,825                                           1: $8,650

2: $9,115                                           2: $$8,535

3: $9,250                                            3: $8,250


Ethereum

Ethereum more or less mirrored the actions of Bitcoin in the past couple of days. Its upswing also ended after price not being able to push above $235. ETH is now slowly dropping in price, possibly testing the support level of $225.5. However, so far, the price is safe above this support level.


Ethereum’s volume is quite low, while its RSI is just below the middle of the value range, sitting at around 48.

Key levels to the upside                    Key levels to the downside

1: $240                                                1: $225.5

2: $251.3                                            2: $217.7  

3: $259.5                                             3: $198


Ripple

XRP also moved in the same direction and played out the same patterns as Bitcoin and Ethereum. After its upswing ended, XRP started to move to the downside. However, the bear presence was strong, and XRP is now testing the $0.235 support. It is still unknown whether the price will end up above or below it as the fight for the level is continuing. However, there is a good probability that XRP will continue its path to the downside in the short term.


XRP’s volume is slightly below average, while its RSI level is just below the middle of the value range, sitting at around 46.

Key levels to the upside                    Key levels to the downside

1: $0.2454                                          1: $0.235

2: $0.266                                            2: $0.227

3: $0.285                                             3: $0.221

Categories
Crypto Market Analysis

Daily Crypto Review, Mar 2 – Cryptos regaining pre-weekend prices; Watch out for crypto-stealing Trojans

The crypto market had a pretty slow weekend, with prices at almost the same place as they were on Friday. Bitcoin is currently trading for $8,773, which represents a 2.58% increase on the day. Meanwhile, Ethereum gained 3.07% on the day, while XRP gained 1.99%.

Bytecoin took the position of today’s most prominent daily gainer, with gains of 22.74%. On the other side, Kyber Network lost 9.66% on the day, making it the most prominent daily loser.

Bitcoin’s dominance decreased slightly over the weekend. Its value is now 63.65%, which represents a 0.88% difference to the downside when compared to the value from when we last reported.

The cryptocurrency market capitalization gained some value on the daily chart, while it stayed at almost the same spot from when we last reported. It is currently valued at $251.93 billion, which represents an increase of $2.84 billion when its value is compared to the value it had on Friday.

What happened in the past 24 hours

ThreatFabric, an Amsterdam-based firm specializing in cybersecurity and threats to the financial industry, managed to identify “Cerberus” Trojan that is able to steal 2-Factor Authentication (2FA) codes that are generated by the Google Authenticator app.

Coinbase, which is one of the biggest crypto exchanges in the world, is one of the cryptocurrency platforms listed in Cerberus’ list of targets.

Honorable mention

IOTA 

Iota began its seed migration on Feb 29, while they will open the network around Mar 10. Although many have criticized the decision to close the Coordinator verifier, it may have saved quite a lot of funds from being stolen from users.
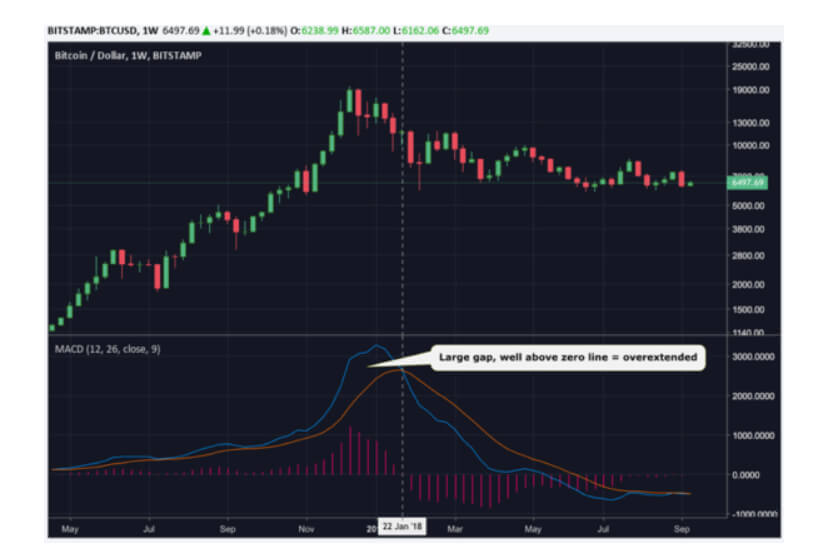
The Iota network got shut down on Feb 12, shortly after their team received multiple reports of breached and drained user wallets. This was all possible thanks to the presence of the Coordinator, which is a centralized transaction verifier that is used to operate the network.

_______________________________________________________________________

Technical analysis

_______________________________________________________________________

Bitcoin

Bitcoin spent the past 24 hours gaining some value after the yesterday’s drop to $8,400. The biggest cryptocurrency by market cap managed to bounce off this price level and reach the price it had on Friday. Bitcoin bulls also attempted an upswing above $8,825, which failed.


Bitcoin’s volume is average when compared to the past week, while its RSI level is rising above the middle of the value range.

Key levels to the upside                    Key levels to the downside

1: $8,825                                           1: $8,650

2: $9,115                                           2: $$8,535

3: $9,250                                            3: $8,250


Ethereum

Ethereum’s also gained some value in the past 24 hours. This price gain made up for the price drop, which happened yesterday, and brought the price to $212. Ethereum reached over $225.5 and regained its pre-weekend levels. It also broke the descending trend line that it formed right before the weekend.
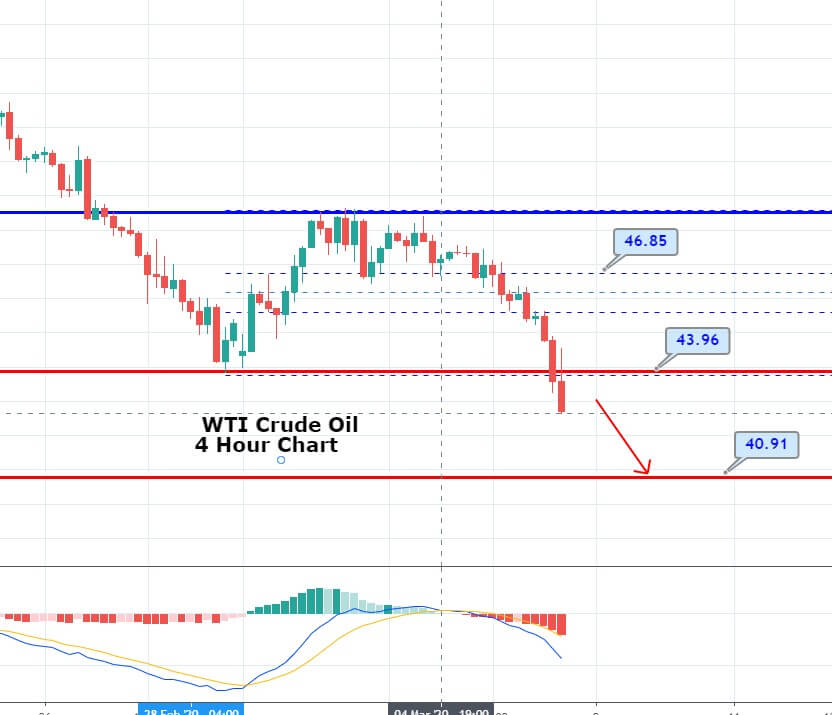

Ethereum’s volume is average when compared to the previous week, with its RSI level right in the middle of the value range.

Key levels to the upside                    Key levels to the downside

1: $240                                                1: $225.5

2: $251.3                                            2: $217.7  

3: $259.5                                             3: $198


Ripple

XRP performed almost exactly the same as Ethereum. Its price dropped to lows of $0.224 but recovered to levels above $0.235 in the past 24 hours. The third-largest cryptocurrency by market cap broke the descending trend line as well, confirming that it will stay above it (at least in the short term).


XRP’s volume is slightly below average while its RSI level is in the middle of the value range.

Key levels to the upside                    Key levels to the downside

1: $0.2454                                          1: $0.235

2: $0.266                                            2: $0.227

3: $0.285                                             3: $0.221

Categories
Forex Market Analysis

Gold Bearish Engulfing In-Play – Is It Gold time to Short Gold?

On Monday, the precious metal gold surged over 1.5%, improving from its most significant one-day drop in almost seven years, on the odds for Fed fund rate cut by the U.S. Federal Reserve to diminish the economic impact from the coronavirus break.

On Friday, the yellow metal slipped dramatically by more than 4.5% for its most significant daily decline since June 2013 as traders liquidated positions to meet margin calls in other securities.

Monday has been a painful start to the week for some investors with further drop-offs in a variety of markets occurring at the market open.

It marks the 6th day of declines in a row, which we have not seen in some time, so traders should prepare themselves for the possibility that this week will likely be filled with negative data, driven by coronavirus fears.

Last weekcoronavirus fear resurfaced, and this helped to trigger a good number of trend line breakout trades, which I hear that some of you have been able to catch.

The virus came back into focus late last week, and this tipped the U.S. major stock indices into negative territory; note how much of Saturday’s CNBC front-page was dedicated to virus-related issues.

XAU/USD – Daily Technical Levels

 Support      Resistance 

1,552.02      1,631.45

1,517.83      1,676.69

1,438.4        1,756.12

Pivot Point 1,597.26

On the technical front, gold has closed a bearish engulfing candle around 1,593. Typically such patterns trigger further selling in the XAU/USD, and we may see gold prices going after the next immediate support level of 1,580. Violation of this level can extend further selling until 1,572. Alternatively, the resistance stays around 1,602. Let’s consider selling trade under 1,597 today. Good luck! 

Categories
Forex Market Analysis

Daily F.X. Analysis, March 02– Top Trade Setups In Forex – Buckle up for Series of Manufacturing PMI 

Earlier today, during the Asian trading hours, EUR/USD extended its rally to 1.1056, and GBP/USD edged up to 1.2826 as traders seem to do profit-taking in the Greenback.

The eyes now will remain on the research firm Markit will publish final readings of February Manufacturing PMI for the eurozone (49.1 expected), Germany (47.8 expected), France (49.6 expected), the U.K. (51.9 expected) and the U.S. (50.8 expected). The Bank of England will release the number of mortgage approvals in January (68,000 expected) and the M4 money supply.

Economic Events to Watch Today 


EUR/USD – Daily Analysis

The EUR/USD rose 0.2% to 1.1026. Official data showed that Germany’s jobless rate was steady at 5.0% in January, and CPI grew 1.7% on year in February, both as expected.

The dollar has traded near a three-month high against the Euro as worries over the outbreak of Coronavirus has driven sharp volatility in the market, mostly driving dollar prices higher. The Euro has tried to rally higher during the Asian trading session on Monday but continues to encounter resistance above. 

The European stocks were also deep in the red, with the Stoxx Europe 600 Index falling a further 3.5%. Germany’s DAX dropped 3.9%, the U.K.’s FTSE 100 lost 3.2%, and France’s CAC was down 3.4%.

The eyes will remain on the final readings of February Manufacturing PMI for the eurozone (49.1 expected), Germany (47.8 expected), France (49.6 expected), the U.K. (51.9 expected), and the U.S. (50.8 expected). The U.S. Commerce Department will report construction spending in January (+0.6% on month expected). The Institute for Supply Management will post its manufacturing index for February (50.5 expected).

Daily Support and Resistance

  • S1 1.092
  • S2 1.0842
  • S3 1.0799

Pivot Point 1.0963

  • R1 1.1041
  • R2 1.1084
  • R3 1.1162

EUR/USD– Trading Tips

The EUR/USD is trading bullish near 1.1116, as the pair seems to go further higher after violating double top resistance at 1.1097. Chances of further buying in the EUR/USD remains pretty high until 1.1140 and 1.1185. The pair may find immediate support around 1.1095, which is mostly extended horizontal support level. The MACD and RSI still stay on the bullish side and are signaling odds of more buying in the pair. The EUR/USD may find resistance around 1.1140 and 1.1185, so let’s look for bullish trends above 1.1085.


GBP/USD– Daily Analysis

The GBP/USD dropped 0.5% at 1.2821, the lowest level since mid-October last year. The U.K. government is expected to publish a negotiating mandate for the future relationship with the European Union. 

The outbreak of the Coronavirus has directed some traders to think central banks will be required to go after dovish monetary policy to support the economy against the potential threat of a coronavirus. The Sterling is still trading with a bearish bias as the interest rate cut sentiment from 0.75% to 0.50% remains pretty solid. 

Prime Minister Boris Johnson’s Tories succeeded December’s election, extending his hold on parliament and pushing some Brexit risk, the Sterling was trading near 83 pence per Euro, and it also gained some support against the U.S. dollar.

The Bank of England will release the number of mortgage approvals in January (68,000 expected) and the M4 money supply.

Daily Support and Resistance

  • R3: 1.3209
  • R2: 1.3015
  • R1: 1.2916
  • Pivot Point 1.2821
  • S1: 1.2722
  • S2: 1.2627
  • S3: 1.2432

GBP/USD– Trading Tip

The GBP/USD continues trading with a bearish bias, breaking out of a narrow trading range of 1.2980 – 1.2880. On the 4-hour chart, the Cable has formed violated the descending triangle pattern, which was supporting the Sterling around 1.2880. 

It’s was one of the most crucial trading levels, and violation of this has further open room for selling until 1.2755 area. Below this level, the GBP/USD has the potential to go after the 1.2660 area. The MACD and RSI are holding in the selling zone, supporting bearish bias for the GBP/USD pair. Let’s look for selling trades below 1.2966 and bullish above the same level today. 


USD/JPY – Daily Analysis

The USD/JPY rebounded to 109.30. This morning, government data showed that Japan’s fourth-quarter capital spending declined 3.5% on year (-2.6% expected). The USD/JPY extended its decline to 109.30. This morning, government data showed that Japan’s jobless rate rose to 2.4% in January (steady at 2.2% expected), while industrial production grew 0.8% on month in January (+0.2% expected) and retail sales climbed 0.6% (-0.1% expected).

The Coronavirus is growing in the Middle East, Europe, and another area of the world, as Brazil verified its initial case in Latin America, while other regions of China found to lower their emergency response level as the number of new cases recorded there proceeds to reduce.

The Greenback is now trading with a slightly bearish bias amid forecasts that the U.S. Federal Reserve may lower the interest rates this year to control downside influence on the economy produced by China’s coronavirus outbreak.

Daily Support and Resistance

  • R3: 113.5
  • R2: 112.2
  • R1: 111.46

Pivot Point 110.9

  • S1: 110.16
  • S2: 109.6
  • S3: 108.29

USD/JPY – Trading Tips

The USD/JPY continues with its bearish momentum on Monday in the wake of weakness in the U.S. dollar and stronger Japanese yen. The USD/JPY pair is recovered a bit in the wake of a bullish correction, but more selling seems to come soon. The USD/JPY is trading bearish at 107.775, and it has high odds of going towards the next support level of 107.338.

We can see on the 4-hour chart above, the USD/JPY has formed a bearish engulfing pattern below 108.350, which may trigger further selling until 107.338. We need to keep an eye in the USD/JPY as the closing of candles above 108.338 level can help us secure a buy trade with a take profit of around 109.650.  

All the best for today!