
Trading cryptocurrencies using the MACD indicator – part 1/2
While there are many technical indicators that can help with identifying changes in the strength, momentum, or the duration of a trend, none of them are simpler than the Moving Average Convergence Divergence, better known as MACD.
By definition, the MACD indicator turns two moving averages into a momentum oscillator. It does so by subtracting the longer period moving average from the shorter period moving average.
As the MACD indicator is a “lagging” or a “trend following” indicator, it actually trails pricing events that already took place in order to determine the strength of the current trend.
As with most indicators, though, you won’t make money just by understanding the indicator works, but rather by knowing how to use this indicator. However, it is still worth explaining what MACD is, so you have a better understanding of why it is such a widely used and loved indicator.
MACD is composed of three main components: the MACD line (which is the blue oscillator), the signal line (which is the orange oscillator), and the histogram.
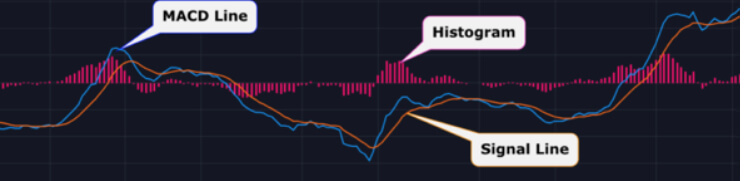
MACD line is typically made up of the 12-period exponential moving average (EMA) minus the 26-period exponential moving average.
The signal line is typically the 9-period EMA of the MACD line.
The histogram represents the difference between the MACD line and the signal line.
How to interpret the MACD indicator
It might be hard to explain how MACD works, but it is actually one of the easiest indicators to interpret as everything is represented clearly and visually.
The MACD Cross
When the MACD line performs a cross above the signal line, it is interpreted by the traders as a bullish cross. On the other hand, when the MACD line crosses under, traders know that this is a bearish cross. These crosses indicate a shift in momentum, which can represent a buy or sell opportunity.
BTC/USD example
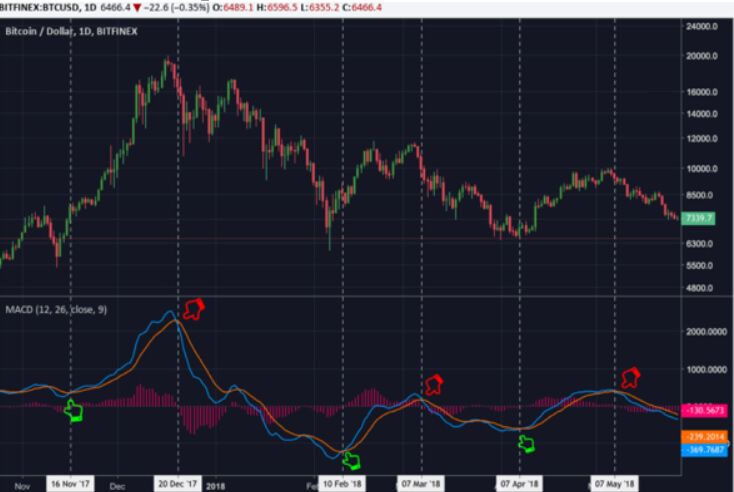
As seen in the picture, MACD crosses provide confirmation of a trend change. This is true, at least in the short term.
As an example, the MACD line crossed above the signal line on November 16, 2017, presenting a buy signal. The MACD line stayed above the signal line for over a month, which resulted in the price increasing more than 150% before the next bearish cross. The bear cross, which occurred on December 20, 2017, signaled a change of trend to bearish.
It’s recommended (and almost necessary) to use the MACD indicator in conjunction with some other indicators such as volume or RSI because MACD, just like any other indicator, is not 100% accurate and can give off false signals.
Check out part 2 of Trading cryptocurrencies using the MACD indicator to learn more about how this indicator shows overbought and oversold market conditions as well as about what zero-line represents.