Categories
Forex Basic Strategies Forex Daily Topic

Significance of Breakout Confirmation or Reversal at Pullback

Breakout trading is one of the most widely used trading strategies in the Forex market. Breakout confirmation is equally important. Without breakout confirmation, a breakout may not work in favor of the traders in many cases. Thus, if we want to have a tremendous rate of winning, we may wait for breakout confirmation or reversal at pullback before taking entry. In today’s lesson, we are going to demonstrate an example of this.

The price after being rejected at a resistance level heads towards the South. It produces a bullish inside bar and heads towards the North again. The momentum suggests that the price may make a breakout at the level of resistance. Breakout traders are to keep an eye on the pair to get a breakout followed by breakout confirmation or reversal candle at the pullback to go long on the pair.

The last candle breaches through the level of resistance. Candle’s attributes suggest that this is an ideal breakout candle. The candle barley has the upper shadow. The breakout traders are to wait for either for the next candle to close above the breakout candle or the price to come back at the breakout level to consolidate and produce a bullish reversal candle to offer them a long entry.

The price does not head towards the North. It comes back at the breakout level closing within the breakout level. The breakout is still valid. However, the buyers must wait to get a bullish engulfing candle to close above consolidation resistance to trigger a long entry by setting stop loss below the breakout level. Let us proceed to the next chart to find out what happens next.

The price breaches the level of support and closes well below the breakout level. The sellers may take control soon in the pair. Traders taking a long entry right after the breakout candle closing are to have a loss here. If they set stop loss below the lowest low, the risk-reward would not be lucrative. When the price breaches a breakout level, it usually generates more momentum and changes its trend. Let us see what happens here.

The price goes back to the breakout level. This time it makes a bullish correction. The equation changes completely another way round. If the chart produces a bearish engulfing candle closing below consolidation support, the sellers may go short and drive the price towards the lowest low.

The chart produces a bearish engulfing candle followed by another strong bearish candle. It looks like a different ball game completely now. It is now the sellers’ territory.

In the bullish market, the chart does not produce a bullish reversal candle; thus, the price gets bearish. In the bearish market, it produces a bearish reversal candle (engulfing) and offers entry to the sellers. By taking entry upon breakout confirmation, we may not find as many entries as we would like, but it gets us more consistency in winning trades.

Categories
Forex Videos

Master The Forex Hedging Strategy With Head and Shoulders Formations!

Hedging Strategy With the Head and Shoulders Formation

In this video, we are going to show you how to use money using a hedging strategy, which is a continuation in the series. On this occasion, we are going to be looking at the head and shoulders formation and try to take advantage of a price action reversal with this shape.
The trade is constructed in two parts with the idea of hedging, which is to maximize the potential for trading opportunities in either direction of price action. However, initially, we want to set the trade up with our tried and tested technical analysis methodology, and in the event that for some reason price decides to go against the chart, we will have a second opportunity to catch the move in the opposite direction. And so we will have trade one, which goes with technical analysis and trade two, which acts as an insurance policy in the event things do not go to plan.

Example A


Example A is a very typical chart pattern that traders see on their screens on a daily basis. This is the formation of a head and shoulders, where initially we have price action rising, followed by the head and shoulders formation and then price reversal.

Example B

Let’s drill down a little further in example B. Here we can see that price extended higher from the left- hand side of the chart where we subsequently have a peak formation, or the left shoulder, followed by a slight pullback in price and then a continuation higher, which forms the head, before we see another pullback and then another move higher where the price action completes the formation of the head and shoulders shape.
We can also see the neckline, which acts as an area of support that is qualified by price action bouncing off it on at least two occasions. Traders will keep a close eye else for the neckline to be breached, which will offer a high probability of price action reversal to the downside.

Example C


In example c, we are going to set up our first trade. We are going to go short when price action moves under the neckline, and place a stop loss a couple of pips above the highest point of the head. Technical analysis offers a high probability that the price action will continue lower from this point with this particular formation. We should be looking for price action to come down to at least the previous low of the initial move higher on the left-hand side of the chart.

Example D

Example D is our secondary trade setup. The insurance policy if you will. Should our first trade fail, and we get stopped out, we will have already set in place a limit order to buy the pair at or slightly above the stop loss of trade one, in order to capture what will be a continuation in price action to the upside. We must place a stop loss a couple of pips below the neckline, and we should be looking for price action to continue upwards and, at the very least, cover the loss of our first trade. This can be done by carefully managing the position. This type of setup is better suited to time frames of 15 minutes or above because we are looking for trends, and this is where the larger amount of pips will be found.

Categories
Crypto Videos

Using Bollinger Bands To Capture Consistent Profits Part 1


Intro to using Bollinger Bands in cryptocurrencies (part 1/2)

The wild movements of a typical cryptocurrency price chart can definitely look bewildering at first glance. While it is easy to see the general direction of a trend for any given crypto, the confusion really sets in if you zoom in to a smaller time frame and take a look at all the peaks and troughs that actually make up that trend line.

Intro to Bollinger Bands


Simple moving averages are used to describe the average price of an asset over a period of time while using exponential moving averages will give more credence as well as arithmetic weight to newer prices. Both of them are intended to filter out the hourly and daily bumps that make up a price chart. They are also making trends as well as patterns more immediately obvious.

The system of using moving averages was further refined by a financial analyst as well as author John Bollinger in the 1980s. He introduced Bollinger Bands to the world. Bollinger bands are nothing more than a system of computing bands (high and low) above an asset’s moving average by using standard deviation.

Bollinger bands are also being used to examine exponential moving averages, unlike the Keltner channel’s examination of simple moving averages. The way Bollinger Bands are used provides the measurement tool with much more sensitivity to certain changes in the market.
Bollinger Bands and Crypto

When speaking about the notoriously volatile cryptocurrency market, Bollinger Bands are used quite a lot. They are mostly used in predicting possible breakouts as well as identifying key times to enter or exit the market. This use-case is particularly useful for day traders (rather than long-term investors), who often have to make quick and tough calls with incomplete information so they could retain their profits. If they make only one significant step in the wrong direction on just one cryptocurrency, they can eliminate days or even weeks of carefully harvested small gains.

More on how to use Bollinger Bands to improve your cryptocurrency technical analysis in part 2 of our guide.

Categories
Forex Course

85. Learning To Trade By Using The ‘True Strength Index’ Indicator

Introduction

The True Strength Index (TSI) is a technical indicator used to analyze the financial markets. ‘William Blau’ developed the indicator in the mid of 1991. If you are interested to know more about William Blau and the technical tools developed by him, we suggest you read his book – ‘Momentum, Direction, and Divergence.’ The True Strength Index abounds between the +100 and -100 levels, and most of the values fall between +25 and -25.

Typically, the price action moves between these levels, and they are considered as overbought and oversold levels. This indicator also warns the weakening of a trend through the divergence and indicates a potential trend changes via centerline. When the indicator goes above the zero-level, it means the indicator is in positive territory, and the buying market is strong. But if the indicator goes below the zero-level, it means that the indicator is in negative territory, and the selling market is strong.

Below is how the price chart looks when the True Strength Index indicator is plotted on it.

True Strength Index Trading Strategies

Traditional Trading Strategy

Buy Example

We must look for buy trades when the crossover of the TSI lines happen at the oversold levels and hold it until the price action reaches the overbought level. The image below represents a buying entry in the AUD/JPY Forex pair. In an uptrend, when the market gives a decent pullback, the TSI indicator reached the oversold area, which means that the sellers are exhausted now and prepare for the buys. Soon after the exhaustion, the crossover happened on the TSI indicator, indicating a buy trade.

Sell Example

Look out for selling opportunities when the crossover happens at the overbought levels and hold it until the price action reaches the oversold level. The below chart represents the sell trade in the AUD/JPY Forex pair. The TSI indicator reached the overbought level when the price action gave enough pullback; the crossover indicates the failure of buyers to move price action higher, and as a result, reversal happened. We can exit our positions at any of the major support levels, or when the indicator gives an opposite signal.

TSI Breakout Strategy

Buy Example

The strategy is to identify a breakout on the price chart. Once the breakout happens, the TSI indicator must be above the zero-line to take the buy trade. We can see that in the below image when the breakout happened on the EUR/CAD Forex pair. After the breakout, we can see that the TSI indicator was also above the zero line, indicating a buy signal in this pair. We can exit our positions at the higher timeframe’s resistance area or exit when the TSI reaches the overbought area.

Sell Example

In a downtrend, find out a sell-side breakout. After the breakout, if the TSI indicator goes below the zero-line, it indicates a sell trade. As we can see in the image below, when the price action broke the trend line, the TSI indicator also breaks below the zero line, which shows that the sellers are ready to print a brand new lower low in this pair.

That’s about TSI and trading strategies related to this indicator. Make sure to try this indicator and these strategies and let us know hoe did your trades go in the comments below. Cheers.

[wp_quiz id=”67291″]
Categories
Forex Assets

EUR/MXN – Analyzing The Costs Involved While Trading This Exotic Pair

Introduction

EUR/MXN is the abbreviation for the Euro Area’s euro against the Mexican Peso. It is classified as an exotic-cross currency pair. Here, the EUR is the base currency, and the MXN is the quote currency.

Understanding EUR/MXN

The market value of EURMXN determines the value of MXN that is required to buy one euro. It is quoted as 1 EUR per X MXN. So, if the market price of this pair is 24.4733, then these many units of Mexican pesos are required to buy one EUR.

Spread

The spread is the difference between the bid price and the ask price. These two prices are set by the brokers. The pip difference is through which brokers generate revenue.

ECN: 46 pips | STP: 49 pips

Fees

A fee is simply the commission you pay to the broker on each position you open. There is no fee on STP account models, but a few pips on ECN accounts.

Slippage

Slippage is the difference between the price at which the trader executed the trade and the price he actually got from the broker. This changes based on the volatility of the market and the broker’s execution speed.

Trading Range in EUR/MXN

The amount of money you will win or lose in a given amount of time can be assessed using the trading range table. This is a representation of the minimum, average, and maximum pip movement in a currency pair.

Procedure to assess Pip Ranges

  1. Add the ATR indicator to your chart
  2. Set the period to 1
  3. Add a 200-period SMA to this indicator
  4. Shrink the chart so you can assess a large time period
  5. Select your desired timeframe
  6. Measure the floor level and set this value as the min
  7. Measure the level of the 200-period SMA and set this as the average
  8. Measure the peak levels and set this as Max.

EUR/MXN Cost as a Percent of the Trading Range

The cost of trade varies based on the volatility of the market. This is because the total cost involves slippage and spreads apart from the trading fee. Below is the representation of the cost variation in terms of percentages. The comprehension of it is discussed in the coming sections.

ECN Model Account

Spread = 46 | Slippage = 3 |Trading fee = 3

Total cost = Slippage + Spread + Trading Fee = 3 + 46 + 3 = 52

STP Model Account

Spread = 49 | Slippage = 3 | Trading fee = 0

Total cost = Slippage + Spread + Trading Fee = 3 + 49 + 0 = 52

Trading the EUR/MXN

The EURMXN is a very volatile pair. For instance, the average pip movement on the 1H timeframe is only 335 pips. Note that the higher the volatility, the lower is the cost of the trade. However, this is not an advantage as it is risky to trade highly volatile markets.

Also, the larger/smaller the percentages, the higher/lower are the costs on the trade. So, we can infer that the costs are higher for low volatile markets and high for highly volatile markets.

To reduce your risk, it is recommended to trade when the volatility is around the minimum values. The volatility here is low, and the costs are a little high compared to the average and the maximum values. But, if you’re priority is towards reducing costs, you may trade when the volatility of the market is around the maximum values.

Advantage from Limit orders

When orders are executed as market orders, there is slippage on the trade. But, with limit orders, there is no slippage as such. Only trading fees and the spread will be taken into consideration to calculate the total costs. Hence, this will bring down the cost significantly.

Categories
Forex Market Analysis

Daily F.X. Analysis, March 20– Top Trade Setups In Forex – Stronger Dollar In Play! 

The U.S. dollar strengthened further as other major central banks eased their monetary policies. The ICE Dollar Index jumped 1.8% on the day to 102.94, posting a three-day rally to the strongest level since Jan. 2017.

Later today, the European Central Bank will post January’s current account balance. The German Federal Statistical Office will report February PPI (+0.2% on-year expected).

The U.K. Office for National Statistics will release February public sector net borrowing, excluding banking groups (0.8 billion pounds expected).

Economic Events to Watch Today    


EUR/USD – Daily Analysis

EUR/USD plunged 2.6% to 1.0662, the lowest level since April 2017. The German IFO Business Climate Index dropped to 87.7 in March (88.0 expected) from 96.0 in February.

Moving on, the greenback may come under pressure and may allow EUR/USD to extend the recovery seen in the Asian session if the risk market further recovers in the European trading hour ahead. After the announcement of stimulus, the ECB President Christine Lagarde showed a willingness to use all essential tools to stop the negative impacts of the deadly virus. 

European stocks returned to positive territory, with the Stoxx Europe 600 Index gaining 2.9%. Germany’s DAX rebounded 2.0%, France’s CAC rose 2.7%, and the U.K.’s FTSE 100 was up 1.4%. A slight improvement in the stocks is also driving the bullish movement in the EUro. 

At the press time, the EUR/USD currency pair turned lower from 1.0980 to below 1.08 due to the strong haven bid around the dollar rose, producing significant gains for the greenback against the bucket of currencies. At the data front, all trader’s eyes on Germany’s Producer Price Index for February and the Eurozone Current Account data for January. Apart from this, the U.S. will release Existing Home Sales for February at 14:00 GMT. 

Daily Support and Resistance

  • S1 1.0434
  • S2 1.0677
  • S3 1.0795

Pivot Point 1.092

  • R1 1.1038
  • R2 1.1163
  • R3 1.1406

EUR/USD– Trading Tips

Lately, the currency pair EUR/USD traded bearishly as it as violated and closed below horizontal support becomes a resistance level of 1.0990. The EUR/USD is currently trading around 1.0750, and it’s forming a lower-lows pattern on the 4-hour chart, which mostly drives a continuation of a selling trend. 

At the moment, the EUR/USD is trading at 1.0750, essentially taking a bullish retracement. The EUR/USD is expected to find a hurdle around 1.0820, and above this, the pair has the potential to target the next resistance level of 1.0930. While the EUR/USD has robust odds of lingering bearish below 1.0920 to target 1.0805. On the daily chart, a violation of 1.0605 can extend the selling trend until 1.0550.


GBP/USD– Daily Analysis

The GBP/USD dipped 0.9% to 1.1499, down for an eighth straight session. The Bank of England lowered its benchmark rate by 15 basis points to 0.10% and announced that it would increase its holdings of U.K. government bonds and sterling non-financial investment-grade corporate bonds by GBP200 billion, to counter the economic shock caused by the coronavirus.

The GBP/USD pair slipped due to a stronger dollar after the U.S. official data showed that housing starts posted at an annualized rate of 1.599 million units in February (1.500 million units expected).

The Coronavirus cases rose from 643 to 3,269 during the last 24 hours in the U.K., but the separation of U.K.e Brexit Chief David Frost got major attention. The reason being his counterpart in the European Union (E.U.), Michel Barnier, also E.U.cing the flu-like deadly disease. As in result, it puts a question mark on the further Brexit talks.

As in result, the Asian stocks follow the foot-steps of Wall Street’s recovery, whereas the U.S. ten-year treasury yieldU.S.also rise to 1.158% by the press time. Due to the lack of major data, investors will keep their eyes on the coronavirus headlines.

Daily Support and Resistance

  • S1 1.0821
  • S2 1.1191
  • S3 1.1328

Pivot Point 1.1561

  • R1 1.1698
  • R2 1.1931
  • R3 1.2301

GBP/USD– Trading Tip

The GBP/USD is finally recovering a bit in the wake of bullish correction and trades around 1.1850. The pair continues to drop for a second consecutive week but seems to close a candle a bit higher this time. On the weekly timeframe, the GBP/USD pair has violated the descending triangle pattern, which supports it around the 1.2030 level. Below the 1.2030 level, the GBP/USD has expected to drop further until the next support level of 1.1245. Since the market was oversold, traders have entered buying to take profit before the weekends. As forecasted, we see bullish correction above 1.1245 level until 1.1885 or 1.2045 level, but then again, chances of selling will remain strong. 

USD/JPY – Daily Analysis

Today in the early Asian session, the USD/JPY currency pair flashing red and turned from the one-month high set earlier. However, the currency pair failed to maintain its early Asian session’s gains and dropped to 109.300 from the high of 111.35, mainly due to the long U.S. Dollar bearish sentiment. As of writing, the USD/JPY currency pairs currently trading at 109.67 and consolidates in the range between the 109.33 – 111.36.

A strong effort by central banks across the world to quiet investor’s moods and decrease fears about the global recession sent the USD lower on the last trading day of the week and was seen as one of the key factors behind the pair’s ongoing corrective drop.

Meanwhile, the losses seemed unaffected by a strong recovery in the global risk sentiment, which seems to weaken the Japanese yen’s safe-haven demand. Investors’ looking for perceived riskier assets due to a positive mood in the equity.

Daily Support and Resistance    

  • S1 105.08
  • S2 107.59
  • S3 109.24

Pivot Point 110.1

  • R1 111.75
  • R2 112.61
  • R3 115.13

USD/JPY – Trading Tips

On Friday, the safe-haven currency pair is trading above 108.400, the previously violated the double top resistance level of 107.950, and closing of candles above this level may drive further buying in the pair. On the 4 hour timeframe, the USD/JPY is trading within an upward channel, which is likely to drive further buying in the pair. 

On Friday, we may see USD/JPY finding support at 108.100 level, and above this, the chances of buying remain stable until the next resistance level of 110. Let’s stay bullish above 108.850 today. 

All the best for today!  

Categories
Crypto Market Analysis

Daily Crypto Review, Mar 20 – Cure for Coronavirus found? Crypto surging, Bitcoin above $6,000

The cryptocurrency market had another surprise in its sleeve today. Bitcoin rose above $6,000, while other cryptos followed. Bitcoin is currently trading for $6,164, which represents a staggering increase of 16.2% on the day. Meanwhile, Ethereum gained 15.57% on the day, while XRP gained 8.52%.

v.systems took the position of today’s most prominent daily gainer, with gains of 38.24%. On the other side, Bytecoin lost 6.22% on the day, making it the most prominent daily loser.

Bitcoin’s dominance has increased over the past 24 hours. Its value is now 65.43%, which represents a 0.76% difference to the upside when compared to yesterday’s value.

The cryptocurrency market capitalization increased exponentially, with a current value of $169.77 billion. This value represents an increase of $17.41 billion when compared to the value it had yesterday.

What happened in the past 24 hours

This time, the “what happened in the past 24 hours” section will not be about cryptocurrencies. However, it is connected to the market as it influences it highly. Apparently, a cure for the notorious COVID-19 virus which struck the world has been found.

A drug that treats malaria developed over half a century ago is showing great signs of being the cure for COVID-19, especially in combination with an antibiotic. The study showed great results in treating the virus.

Honorable mention

Tether

The world’s largest stablecoin by market cap has launched its operation on the Bitcoin Cash network. USDT will, at the time of writing, be available on the Bitcoin Cash network. On top of this, it is also available on many other networks, such as Ethereum, Algorand, Liquid Network, EOS, Omni, and Tron.

Tether (USDT) has seen a great surge of interest in recent weeks as the market has been going down. With people not wanting to get out of crypto, but wanting to protect their investments, Tether has been one of the main destinations for their funds.

_______________________________________________________________________

Technical analysis

_______________________________________________________________________

Bitcoin

Bitcoin experienced a surge in price in the past 24 hours. The largest cryptocurrency by market cap managed to increase in value by over 15%, reaching a price of over $6,000. The resistance level of $5,960 has been broken and became a support level.The price push has ended and Bitcoin is now consolidating at the $6,100 level.


Bitcoin’s volume increased only slightly during the upswing, while its RSI grazed the overbought area on the 4-hour chart, but did not pass it.

Key levels to the upside                    Key levels to the downside

1: $6,640                                           1: $5,960

2: $6,850                                           2: $5,000

3: $7,085                                            3: $4,300


Ethereum

Ethereum followed Bitcoin and had a day with a double-digit increase in price. The second-largest cryptocurrency rose over 15% and managed to tackle the $122.5 as well as the $128 resistance levels, turning them into support.


Ethereum’s volume increased greatly during the upswing but died down as the move ended. Its RSI level also increased, with the value currently being at 61.

Key levels to the upside                    Key levels to the downside

1: $168                                                1: $128

2: $178.6                                            2: $122.5 

3: $185                                                3: $100


Ripple

XRP had a great day, as it increased in price by over 5%. However, its fortune is not as great as the other two aforementioned cryptos. The third-largest cryptocurrency by market cap did manage to gain some value but failed to break the $0.165 resistance level, which plays a crucial role in the future price development of XRP.


XRP’s volume increased slightly during the upswing but is back to normal levels now. Its RSI level is currently at the value of 56.

Key levels to the upside                    Key levels to the downside

1: $0.165                                            1: $0.1

2: $0.19

3: $0.2                                              

Categories
Forex Market Analysis

Crude Oil’s Bearish Bias Stays Strong – Quick Technical Outlook 

The WTI crude oil has dropped to the weekly support level of 20, before bouncing off to trade at 23.94. Despite the small recovery in oil prices, analysts continue to give a warning about the coronavirus negative impact on the global market because the cases continue to rise and death losses as well. 

Moreover, the continuing price war between producers Saudi Arabia and Russia is also not showing any ending probability, despite Russian hints at a preference for higher prices on Wednesday, as per the latest report. Whereas, the recently positive inventory numbers from the US failed to give any good signals to the buyers.

At the USD front, the greenback continues to flashing green and remains as the market favorite, mainly due to its safe-haven currency status. On the other hand, the moves offer unstable trading sessions due to the downbeat performances of the Asian stocks. A stronger dollar is also placing a bearish bias on the WTI prices due to it’s negative correlation. 

Investors will keep their eyes on the coronavirus headlines since the global struggles to control the pandemic. It should also be noted that the fears of the deadly virus continue to weigh on the markets’ risk-tone, but the US equity futures have recovered off-late after the ECB’s announcement. Eventually, the demand for crude oil is suffering. 


Support Resistance
19.75 26.79
16.61 30.7
9.57 37.74
Pivot Point 23.66

On the technical front, the WTI prices are likely to find support around 20. and 13, while the resistance stays around 26. The MACD and RSI are suggesting a sharp selling trend in the oil, especially after it has closed three black crows pattern on the weekly timeframe, which is making it a big deal. Let’s consider staying bearish below 26 and bullish above 20 today. Good luck! 

Categories
Forex Videos

Master Forex Spreads Quickly To Increase Profits – Forex Tips & Tricks

Master Forex Spreads Quickly to Increase Profits

Today we are going to be looking at spreads in reference to the forex market and some of the points to remember when choosing a broker having carefully considered the trading spreads they offer and eventually helping you to decide which trades you make according to the tightest spreads available.

Example A


So, what is the spread? All foreign exchange currency trading is done in pairs are the prices for each pair and are quoted as currency exchange rates.

Example B

Prices are quoted in quote boxes similar to this one, where the relative value of one currency unit is termed in the units of the other currency in its pair. In this example, the British Pound is being quoted against the United States Dollar and is where each currency has a three-letter quote, so here it would be GBP USD.
To simplify this, the spread always reflects the price for buying the first currency of the pair, in this case, the Pound, with the second currency, in this case, the USD.

The exchange rate that is supplied to a trader willing to purchase a quote currency is called a BID, and it is the highest price that the currency pair could be bought at. The selling price of the quote currency is called the ASK, and it is the lowest price that a currency pair will be allowed for sale. The difference between the Ask and the Bid is termed as spread. Essentially, the reason for the existence of the spread is so that brokers can take a cut. It can be applied instead of charging fees on your close trade positions, although some brokers may charge a small commission separately after the trade is closed.

Spreads are typically measured in pips and measured using the fourth decimal place in a currency quotation. There different types of spreads available in forex trading with different brokers provide let’s take a look at these two examples to May better understand your options.

Example C

When choosing a broker, you will want to consider the types of spreads they offer typically. This will be a fixed spread, or it might be a variable spread. With the fixed spread, the difference between the Ask and the bid price remains constant during normal periods of activity in the trading day. This can, however, widen slightly at times of extreme volatility. Fixed spreads are phenomenal in terms of knowing where you are at all times. With this option, you can determine your costs before entering your trade. Therefore it allows you to have better foresight in terms of your finances. This type of spread is preferred by professional traders because it means that brokers cannot manipulate the spread in their own favor throughout the trading day.

Next, we have variable spreads. This type of spread does not remain constant. Spreads fluctuate in line with market conditions during the day and especially during high levels of volatility and are also affected by liquidity in the market. The benefit of having variable spreads is that sometimes the spreads can be much tighter than fixed spreads and are better suited to frequent traders, for example, scalpers and intraday traders.

Some brokers will offer kept variable spreads, and these can often be considered to be the best of both options depending on how high the cap is.

Categories
Forex Course

84. RVI (Relative Vigor Index) & Related Trading Strategies

Introduction

The Relative Vigor Index is one of the most popular indicators in the technical trading community. ‘John Ehlers’ developed this indicator, and it belongs to the oscillator family. The RVI is typically used to determine the strength of a trend in any given instrument. In a rising market, we generally expect the closing price to be higher than the opening price. Likewise, in a downtrend, we expect the closing price of any instrument to be lower than the opening price.

By comparing the opening price to its closing price, the RVI tries to gauge whether the trend is bullish or bearish. This predictive ability of the indicator makes it a leading indicator in the market. RVI consists of two lines, which are Green and Red in color. The Greenline is the standard moving average line, and the Redline is a 4-period volume weighted moving average. The Red is a trigger line as it provides the trading signal when it crosses above or below the Greenline.

Below how the price chart looks when the Relative Vigor Index is plotted on it.

Trading Strategies Using The RVI Indicator

A low value of the RVI indicates an oversold market, and when the RVI crosses above the signal line, it indicates a buying opportunity. Conversely, a high value indicates an overbought market, and the RVI crossing below the signal line indicates a selling opportunity.

Overbought and Oversold Crossovers

This is one of the basic and quite popular strategies using the RVI indicator. The trading opportunities that are generated in this strategy works well in all types of market conditions. The idea is to go long when the crossover happens at the oversold area and go short when the crossover happens at the overbought area. We must exit our positions when the indicator triggers an opposite signal.

As you can see in the below chart, we have generated a couple of trading opportunities in the USD/CAD Forex pair using the RVI indicator. We must follow all the rules of the strategy to generate an accurate trading signal. Place the stop-loss just below the closing of the recent candle and book the profit when the market gives an opposite signal.

Pairing RVI with RSI Indicator

In this strategy, we have paired the RVI indicator with the RSI indicator to identify accurate trading signals. Both of these indicators belong to the oscillator family, and when combined, they add great value. RSI indicator has only one line, which oscillates between the 70 to 30 levels. When it goes below the 30-level, it means that the market is oversold and above the 70 level means that the market is overbought.

Buy Example

The idea is to go long when both the indicators give a crossover at the oversold area.

The below charts represent a buy signal generated by both of these indicators in the CAD/JPY Forex pair. When both of these indicators line up in one direction, that trade has a very high probability of performing in the anticipated direction, and we must look for deeper targets. In this kind of situation, we can even risk a bigger amount.

Sell Example

The idea is to go short when both the indicators give a crossover at the overbought area.

In the below chart, NZD/USD was in a downtrend. During the pullback, both the indicators aligned in one direction giving us a selling signal. Expect deeper targets and make sure to exit the position when any of the indicators gives an opposite signal at the oversold area.

That’s about the RVI and the trading strategies using this indicator. Try these strategies in a demo account to master them and only then use them in the live market. Cheers.

[wp_quiz id=”67178″]
Categories
Forex Assets

Costs Involved While Trading The EUR/CZK Forex Pair

Introduction

EUR/CZK is the abbreviation for the Euro Area’s euro against the Czech Koruna. This pair is an exotic-cross currency pair. Here, the EUR is the base currency, and the CZK is the quote currency.

Understanding EUR/CZK

The price of this pair in the exchange market determines the value of CZK equivalent to one euro. It is quoted as 1 EUR per X CZK. So, if the value of this pair is 26.0896, these many Korunas are required to purchase one EUR.


Spread

Spread is the difference between the bid and the ask price offered by the broker. This value is different on the ECN account model and STP account model. An approximate value for the two is given below.

ECN: 45 pips | STP: 47 pips

Fees

A fee is another term for the commission of the trade. There is no fee on STP accounts, but a few pips on ECN accounts.

Slippage

Slippage is the difference between the price intended by the trader and the price the trader actually received from the broker.

Trading Range in EUR/CZK

The trading range is the tabular representation of the pip movement of a currency pair in different timeframes. These values are useful for determining the profit that can be generated from a trade before-hand. To find the value, you must multiply the below volatility value with the pip value of this pair.

Procedure to assess Pip Ranges

  1. Add the ATR indicator to your chart
  2. Set the period to 1
  3. Add a 200-period SMA to this indicator
  4. Shrink the chart so you can assess a large time period
  5. Select your desired timeframe
  6. Measure the floor level and set this value as the min
  7. Measure the level of the 200-period SMA and set this as the average
  8. Measure the peak levels and set this as Max.

EUR/CZK Cost as a Percent of the Trading Range

This is the representation of the cost variation of trades for different timeframes and volatilities. The values are obtained by finding the ratio between the total cost and the volatility value and are expressed as a percentage.

ECN Model Account

Spread = 45 | Slippage = 3 |Trading fee = 3

Total cost = Slippage + Spread + Trading Fee = 3 + 45 + 3 = 51

STP Model Account

Spread = 47 | Slippage = 3 | Trading fee = 0

Total cost = Slippage + Spread + Trading Fee = 3 + 47 + 0 = 50

Trading the EUR/CZK

The larger the percentage values, the higher is the cost of the trade. From the above tables, we can see that the values are large in the min column and comparatively smaller in the max column. This means that the costs are high when the volatility of the market is low.

It is neither advisable to trade when the volatility of the market is high, nor when the costs are high. To have a balance between both these factors, it is ideal to trade when the volatility of the pair is in the range of the average values.

Furthermore, to reduce your costs even further, you may place trades using limit orders instead of market orders. In doing so, the slippage will not be included in the calculation of the total costs. And this will bring down the cost of the trades by a decent number. An example of the same is given below.

Spread = 45 | Slippage = 0 |Trading fee = 3

Total cost = Slippage + Spread + Trading Fee = 0 + 45 + 3 = 48

Categories
Forex Market Analysis

Daily F.X. Analysis, March 19 – Top Trade Setups In Forex – Trump Set to Speak on Coronavirus! 

On the forex front, the ICE U.S. Dollar Index surged 1.3% on the day to 100.91, the highest level since April 2017. The U.S. Labor Department will release initial jobless claims in the week ended March 14 (220,000 expected).

The U.S. official data showed that housing starts posted at an annualized rate of 1.599 million units in February (1.500 million units expected).

Later today, initial jobless claims for the week ended March 14 (220,000 expected), and the Conference Board Leading Index for February (+0.1% on month expected) will be reported. The Commerce Department will report 4Q current account balance (108.5 billion dollars deficit expected). The Philadelphia Federal Reserve will post its Business Outlook Index for March (9.0 expected).

The U.S. dollar strengthened versus its major peers, with the ICE Dollar Index jumping 1.3% to a three-week high of 99.38. Later in the day, the European Commission will post final readings of February CPI (+1.2% on-year expected) and January trade balance (19.2 billion euros surplus expected).

During the U.S. session, the eyes will be on the U.S. Commerce Department, which is due to report February housing starts (1.5 million units expected) and building permits (1.5 million units expected).

Economic Events to Watch Today    


EUR/USD – Daily Analysis

The EUR/USD marked a day-low of 1.0802 before rebounding to close at 1.0962, down 0.3%. The European Central Bank announced a 750 billion-euro bond-buying program to counter the coronavirus impacts. ECB President Christine Lagarde said, “there are no limits” to their commitment to the euro.

The Trump administration announced that Trump administration is planning to give checks directly to Americans in the shape of a $1 trillion stimulus program. Moving ahead, the EUR/USD currency pair may return and possibly break below Tuesday’s low of 1.0955 if the stocks cheer the substantial monetary and fiscal stimulus.

After the announcement of stimulus, the ECB President Christine Lagarde showed a willingness to use all important tools to stop the negative impacts of the deadly virus. At the press time, the EUR/USD currency pair turned lower from 1.0980 to below 1.08 due to the strong haven bid around the dollar rose, producing big gains for the greenback against the bucket of currencies.

Daily Support and Resistance

  • S1 1.0434
  • S2 1.0677
  • S3 1.0795

Pivot Point 1.092

  • R1 1.1038
  • R2 1.1163
  • R3 1.1406

EUR/USD– Trading Tips

On Thursday, the major currency pair EUR/USD continues to trade bearish as it as violated and closed below horizontal support becomes a resistance level of 1.0990. The EUR/USD is currently trading around 1.0970, and it’s forming a lower-lows pattern on the 4-hour chart, which mostly drives a continuation of a selling trend. 

At the moment, the EUR/USD is trading at 1.0890, essentially following the bearish bias. The EUR/USD is expected to find a hurdle around 1.0920, and beyond this, the pair has the potential to target the next resistance level of 1.1030. While the EUR/USD has robust odds of lingering bearish below 1.0920 to target 1.0805. On the daily chart, a violation of 1.0805 can extend the selling trend until 1.0670.


GBP/USD– Daily Analysis

The GBP/USD plunged 3.5% to 1.1633, the weakest level since 1985, as U.K. Prime Minister Boris Johnson’s response to the coronavirus pandemic failed to convince investors. 

The GBP/USD pair slipped due to a stronger dollar after the U.S. official data showed that housing starts posted at an annualized rate of 1.599 million units in February (1.500 million units expected).

As per the latest report, the death losses rose to 99 on Wednesday vs. Tuesday’s 67, reporting a 48% jump. As of March 18, 2,626 people in the United Kingdom were tested for coronavirus. The test numbers have been increasing from just over 1,000 a day at the end of February, when testing started, to more than 6,000 per day by mid-March.

Looking forward, the investors will now keep their eyes on the global measures to control the negative impacts of the virus for taking the near-term direction. However, the greenback may keep benefiting from the same due to its safe-haven status.

Daily Support and Resistance

  • S1 1.038
  • S2 1.1049
  • S3 1.1316

Pivot Point 1.1718

  • R1 1.1986
  • R2 1.2388
  • R3 1.3057

GBP/USD– Trading Tip

The GBP/USD continues to encounter bloodshed in the wake stronger dollar and weakness in the GBP. The direct currency pair continues to drop for a second consecutive week, and so far, it’s has traded bearishly from 1.3000 level to 1.1540 level just in two weeks. 

On the weekly timeframe, the GBP/USD pair has violated the descending triangle pattern, which supports it around the 1.2030 level. Below the 1.2030 level, the GBP/USD is expected to drop further until the next support level of 1.1245. Since the market is oversold, traders may see a bullish correction above 1.1245 level until 1.1885 or 1.2045 level, but then again, chances of selling will remain strong. 


USD/JPY – Daily Analysis

The USD/JPY extended its rally for a second straight session, climbing 0.6% to 108.38. During the Asian session, the USD/JPY currency pair hit the session high of 109.06 before the time of writing, representing 0.70% gains and continued its 3-day bullish streak near above the 108.50 after the latest downbeat data from Japan. As well as, broad-based USD strength also keeps the pair bullish. At the time of writing, the USD/JPY currency pair is currently trading at 108.86 and consolidates in the range between the 107.89 – 109.55.

At the data front, Japan’s National Consumer Price Index (CPI) came in below 0.8% forecast on MoM to 0.4%, whereas the CPI ex Food, Energy (YoY) slipped beneath 0.9% expectations to 0.6% for February.

Following the data, the BOJ minutes for the January monthly meeting announced further support for the Japanese central bank’s Quantitative Easing (Q.E.). As in result, the Japanese yen got another burden to carry, as the Japanese press pushes for government stimulus, which in turn offered additional support to the USD/JPY pair.

Daily Support and Resistance

  • S1 104.02
  • S2 105.92
  • S3 107

Pivot Point 107.83

  • R1 108.9
  • R2 109.73
  • R3 111.63

USD/JPY – Trading Tips

The stronger U.S. dollar has also driven the bullish trend in the USD/JPY currency pair, and it’s currently trading over 109. The indirect currency pair has also violated the double top resistance level of 107.950, and closing of candles above this level may drive further buying in the pair. 

On the 4 hour timeframe, the USD/JPY is still trading within an upward channel, which is likely to drive further buying in the pair. Therefore, the pair may find support at 108.100 level, and above this, the chances of buying remain strong until the next resistance level of 110. Let’s stay bullish above 108.250 today. 

All the best for today!  

Categories
Crypto Market Analysis

Daily Crypto Review, Mar 19 – BitMEX discussing Central Bank Digital Currencies; Cryptos consolidating

The cryptocurrency market has spent yet another day without much movement. Bitcoin is currently trading for $5,305, which represents an increase of 1.62% on the day. Meanwhile, Ethereum lost 0.75% on the day, while XRP lost 2.04%.

Steem took the position of today’s most prominent daily gainer, with gains of 95.53%. On the other side, WAX lost 21.91% on the day, making it the most prominent daily loser.

Bitcoin’s dominance increased by a slight margin over the past 24 hours. Its value is now 64.67%, which represents a 0.16% difference to the upside when compared to yesterday’s value.

The cryptocurrency market capitalization remained at basically the same place, with a current value of $152.36 billion. This value represents an increase of $0.61 billion when compared to the value it had yesterday.

What happened in the past 24 hours

BitMEX Research posted a thought that discusses the two approaches that governments can take regarding the issuance of a Central Bank Digital Currency as well as the ramifications for the economy. BitMEX posted its opinion on Mar 18.

The post said that “From a liquidity perspective, the largest deposit-taking institutions in an economy have an almost unconstrained capability to create new loans since the funds loaned out will automatically get placed back into their own bank as a deposit.”

Honorable mention

MakerDAO

The MakerDAO community has locked in an auction in hopes to cover a multi-million dollar hole in the DAI collateral. The funds were “gone” after the sudden Ethereum price crash on Mar 12.

The proceeds from the auction sale will be used to recapitalize and revitalize the system as well as to compensate the losses suffered by the borrowers. They lost their money as their Ethereum collateral got auctioned off for zero DAI.

_______________________________________________________________________

Technical analysis

_______________________________________________________________________

Bitcoin

Bitcoin had a pretty quiet day with virtually no price movement. There was, at one point, an attempt made by the BTC bears to push the price below $5,000. However, that push ended up quickly and Bitcoin was back to its previous level in no time.


Bitcoin’s volume is stable at the moment, though on quite low levels. Its RSI level is currently sitting at the value of 47.

Key levels to the upside                    Key levels to the downside

1: $5,960                                           1: $5,000

2: $6,640                                           2: $4,300

3: $6,850                                            3: 3,100


Ethereum

Ethereum had a similar day as Bitcoin, though with some differences. Namely, while Bitcoin had an attempted push to the downside, Ethereum tried to break its upside resistance level. However, that ended up without much effect, and Ethereum is now back to its previous level.


Ethereum’s volume is still extremely low and is keeping these levels. Its RSI level is currently slightly below the middle of the value range, sitting at 43.

Key levels to the upside                    Key levels to the downside

1: $122.5                                             1: $100

2: $128                                              2: $80 

3: $168                                           


Ripple

XRP also experienced a slow day with almost no price movement. However, its price moved a bit more than Ethereum’s and Bitcoin’s price. XRP managed to slide down in price by 2%. It is still kept within the same range, currently trading at just above $0.146.


XRP’s volume is extremely low, while its RSI level is sitting at 45 at the time of writing.

Key levels to the upside                    Key levels to the downside

1: $0.165                                            1: $0.1

2: $0.19

3: $0.2                                              

Categories
Forex Basic Strategies Forex Daily Topic

An Old Theory about Support/Resistance

In price action trading, traders rely on support/resistance a lot. Beginners often ask a question of whether they are predetermined. In answer to this, they are predetermined to some extent. A trader can guess level/levels that may work as support/resistance. The idea is simple. Support becomes resistance, and resistance becomes support. In today’s lesson, we are going to demonstrate an example of this.

The price has a bounce at the drawn level and heads towards the North. The last candle comes out as a bearish engulfing candle. The price may head towards the South. If that happens, the sellers are to wait for a breakout at the drawn level. Let us proceed to find out what happens next.

The next candle comes out as a bearish candle as well. However, it does not make a breakout. This is an interesting chart for both the buyers and the sellers. The buyers may wait to get a bullish reversal. Since this is the level where the price has bounce earlier, this may become double bottom support. On the contrary, if the price makes a bearish breakout at the drawn level, the sellers dominate in the pair.

The bear wins. The last candle closes well below the drawn level. This is an explicit breakout. The sellers are to wait for the breakout confirmation. If the chart produces another bearish candle closing below the last candle, the price may find its next resistance at another significant level. In most cases, the price usually goes back and finds its resistance at the breakout level, which was the level of support earlier.

Look at the chart. The price goes back to the breakout level and creates a doji candle. Do you notice the doji candle is produced right at the drawn level? This means the level may drive the price towards the South by being the level of resistance.

The level produces a bearish engulfing candle closing below consolidation support (This may become resistance later as well). The last candle suggests that the price may head towards the South with good bearish momentum. The sellers have found the new resistance.

As expected, the price heads towards the South for one more candle. It usually happens when support/resistance produces an engulfing candle as a reversal candle. In the end, a level of support flips and becomes a level of resistance. If we closely observe, we find this is what happens almost every time. Support becomes resistance, and vice versa. By obeying the theory, experienced traders spot out the levels of support/resistance well ahead.

Categories
Forex Videos

Crazy Crypto Profits Using The Ichimoku Cloud Indicator – part 1


Trading crypto using Ichimoku Cloud – part 1/2


Ichimoku Kinko Hyo is a well-known indicator that seems complex to many traders but actually isn’t. Once you know how it works, it makes your crypto-trading decisions easier and faster. Mastering Ichimoku Cloud trading will really bring you one step closer to the main goal of trading, which is making high-probability decisions in a relatively short time span.
Ichimoku Cloud indicator – definition
Ichimoku Kinko Hyo is translated as the “one look equilibrium chart.” It was created with a specific purpose, which is to enable quicker decision making in trading. Ichimoku Cloud is one of the main indicators offered at websites such as TradingView.

Ichimoku Cloud lines – explained

The Senkou and Kumo
“Senkou span” represents the borders of the filled cloud, which is known as the “Kumo cloud.” This span is filled with green color when the market is bullish, while it is red in bearish markets.

Senkou lines represent major support/resistance areas, and they attract the price. Using these lines, traders set their entries, exits, and stops. However, they are mostly used as additional information alongside some other indicators.

The TK lines and Cross
The Ichimoku Cloud also consists of the Tenken and Kinjun lines, or “TK lines.” These are the balance lines, basically fast and slow MA’s.
As they are moving averages, traders will look for crosses when they search for trend reversals. Because of the names of these lines, the Cross is called “TK cross.” However, TK lines are also important, even when there is no cross in sight. They can signal that the price of a cryptocurrency is neither overpriced nor underpriced if the price sticks around them. On the other hand, if the price action happens very far from the TK lines, it shows that the price is way out of balance and that a pullback is likely. It is important to note that this indicator by itself is not a trigger to open positions expecting a pullback.

The Chinkou

The “Chinkou” span is an indicator that is a lagging one. It is used to confirm trend strength. When the Chinkou line is above the candles, it means that the market is strong. On the other hand, if the Chinkou crosses below candles, it’s a bearish market.

When there is strong action while the lagging line crosses the candles, the trend is slowly weakening and becoming undecided. This tells traders to look for a reversal.

Reading Ichimoku Cloud


Ichimoku cloud Bullish signals

In order to have a strong bullish signal, everything in this indicator must occur above the Kumo cloud, namely:

The price action has to remain above the Kumo cloud.

The Chinkou line has to stay above the Kumo
Tenken has to cross Kinjun above the Kumo – if this Cross occurs inside the Kumo, that’s only slightly bullish.

Ichimoku cloud Bearish signals

In order to have a strong bearish signal, simply reverse everything said about the bullish signals:
The price action occurs below Kumo
Tenken and Kinjun have to be crossing
The Chinoku line has to stay below the Kumo.
If none of these is happening yet, it most likely means that the market is undecided, sideways, or waiting for direction.

Check out part 2 of Trading Cryptocurrencies using the Ichimoku Cloud to learn about cryptocurrency setups using this indicator as well as to learn the popular indicators that get along with Ichimoku well.

Categories
Forex Course

83. Learning To Trade The Donchain Channel Indicator

Introduction

The Donchain channel indicator is one of the quite popular technical indicators in the market. It is developed by Richard Donchian in the mid-twentieth century. This indicator consists of three moving average lines calculated by the highest high and lowest low of the last ‘n’ period. The upper Donchian band marks the highest price of the security over the ‘n’ period of time, whereas the lower band of the indicator marks the lowest price of a security over the “n” period of time. The area between the upper and lower band represents the Donchian channel.

If the price action is stable, the Donchian channel stays in a narrow range, and in volatile market conditions, the Donchian channel indicator will be wider. In this way, the Donchian channel is a wonderful indicator to assess the volatility of the market. The upper Donchian band indicates the extent of bullish energy, highlighting the price action achieved a new high in a particular period. Whereas the centerline of the indicator identifies the mean reversion price for a particular period. The bottom line identifies the extent of bearish energy, highlighting the lowest price achieved by the sellers in a fight with the buyers.

Below is how the price chart looks once the Donchain Channel indicator is plotted on to it.

Trading Strategies Using The Donchain Channel Indicator

Scalping Strategy

This strategy is made for traders who prefer to make quick bucks from the market. By following this strategy, we can get a couple of trades in a single trading session. The idea is to go long when the price action hits the lower band and go short when the price hit the upper band. The preferred time frame will be a 5- or 3-minute chart.

The image above represents a couple of buying and selling trading opportunities. Scalping is the easiest way to make quick bucks from the market. When we take a buy or sell trade, and if the price action goes five pip against your entry, we suggest you close the trade and wait for the price action to give another trading opportunity. Book the profit when price action hits the opposite band of the indicator.

Donchain Channel To Trade The Trending Market

If the market is in an uptrend, it is advisable to go only for the buy trades, and if it is in a downtrend, only go for sell trades. In this way, we can filter out false trading opportunities, and by following the trend, we can easily hold our position for longer targets.

Buy Trade

The below image represents two buying opportunities that we have identified in the EUR/NZD pair. We can see that the trend was up, and if we take any of those small sell trades, we will end up on the losing side. So on a higher timeframe, it is advisable to trade with the trend. We have captured the whole buying movement in this Forex pair. This is the easiest and safest way to trade the market using this indicator

Sell Trade

The below image represents a couple of selling opportunities in the CAD/JPY Forex pair. We can scale our positions when the market gives an opportunity to do so. Or, we can close our positions when the opposite signal is triggered. Always wait for the desired signal with patience to trade the market.

The advantage of trading with the trend is that whenever the market gives us the trading opportunity, we can easily hit the trade without worrying much. Another advantage of trading with the trend is that we can go with a smaller stop-loss as the price action spikes very less in a trending market.

These are only a few applications of the Donchain Channel Indicator. You can follow our strategy section to learn many advanced applications of this indicator. Stay tuned to learn many more technical indicators. Cheers!

[wp_quiz id=”67024″]
Categories
Forex Market Analysis

Daily FX. Analysis, March 18 – Top Trade Setups In Forex – Inflation Figures Under the Spotlight! 

The US dollar strengthened against its major peers, with the ICE Dollar Index jumping 1.3% to a three-week high of 99.38. Later in the day, the European Commission will post final readings of February CPI (+1.2% on-year expected) and January trade balance (19.2 billion euros surplus expected).

During the US session, the eyes will be on the US Commerce Department, which is due to report February housing starts (1.5 million units expected) and building permits (1.5 million units expected).

Economic Events to Watch Today    


EUR/USD – Daily Analysis

The EUR/USD plunged from 1.5% to 1.1015. The ZEW German Current Situation Index dropped to -43.0 in March (-30.0 estimated) from -15.7 in February and Expectations Index dipped to -49.5 (-30.0 expected) from 8.7. It is worth to mention that the Eurozone’s powerhouse Germany has closed all borders, schools, public places, and unnecessary shops in the wake of intensifying coronavirus. As a result, the continuous decline in the economy could take the speed in the near term, which may add bearish pressures around the EUR.

Looking forward, the traders will keep their eyes on the broader market sentiment. If the global equities flash red, the USD will likely find buyers. At press time, the futures on the S&P 500 are reporting a 3 % decline.

The Federal Reserve and other major central banks have recently delivered rate cuts to ease the economic shock of the coronavirus pandemic. Meanwhile, the Fed has also launched a quantitative easing program worth $700 billion. Other major central banks have also played roles by cutting rates. 

The Trump administration announced on Tuesday that Trump administration is planning to give checks directly to Americans in the shape of a $1 trillion stimulus program. Moving ahead, the EUR/USD currency pair may return and possibly break below Tuesday’s low of 1.0955 if the stocks cheer the heavy monetary and fiscal stimulus.

Daily Support and Resistance

  • S1 1.0882
  • S2 1.1024
  • S3 1.1096

Pivot Point 1.1166

  • R1 1.1239
  • R2 1.1309
  • R3 1.1451

EUR/USD– Trading Tips

On Wednesday, the major currency pair EUR/USD continues to trade mostly lower after violating the horizontal support level pf 1.1095. The EUR/USD is currently trading around 1.0970, and it’s forming a lower-lows pattern on the 4-hour chart, which mostly drives a continuation of a selling trend. 

On the lower side, a continuation of a bearish bias can extend sell-off until 1.0920 and 1.0865. While the bullish breakout of 1.1096 can drive more buying until 1.1240 area. Consider staying bearish below 1.0970 today. 


GBP/USD– Daily Analysis

The GBP/USD sank 1.2% to 1.2118. Official data showed that the UK jobless rate for the three months to January climbed to 3.9% (steady at 3.8% expected). The US continues to struggle from every level, as well as the Federal Reserve, also doing the same to make sure that the world’s largest economy doesn’t getting infected due to the deadly virus. 

At the USD front, the greenback got support from the moves on Tuesday; the early-day decline could have taken clues from US Treasury Secretary Steve Mnuchin that the lack of action could send the Unemployment Rate to 20%.

Later today, the US Commerce Department will report February housing starts (1.5 million units expected) and building permits (1.5 million units expected), which may help determine further trends in the GBP/USD pair.  

The investors will keep their eyes on virus headlines and take clues from the coronavirus relating headlines while the US Senate voting on President Donald Trump’s major stimulus plan as well as the UK PM’s action will be essential to watch. 

Daily Support and Resistance

  • S1 1.1938
  • S2 1.211
  • S3 1.2189

Pivot Point 1.2282

  • R1 1.2362
  • R2 1.2454
  • R3 1.2626

GBP/USD– Trading Tip

A day before, the GBP/USD fell sharply to trade around 1.2060 level and has closed a bearish engulfing candle followed by Doji candles. It’s suggesting the odds of more selling in the market. The Cable has immediate support around 1.2170 level, and above this, the Cable can extend the continuation of a bullish bias until 1.1980 level and 1.1805. The MACD is consistently forming bearish histograms below zero, supporting the selling trend in the GBP/USD pair, which is why we should consider selling below 1.2100 today to target 1.1985 at first.  


USD/JPY – Daily Analysis

The USD/JPY rebounded 1.4% to 107.35. The USD/JPY currency pair dropped below the 107.00 and hit the fresh session lows in the last hours, mainly due to fresh risk catalysts boosted the safe-haven demand. As of writing, the USD/JPY currency pair is currently trading at 107.17 and consolidates in the range between the 106.77 – 107.72. However, the currency pair trading bearish despite the Fed’s continued action mode and downbeat comments from the US policymakers as well as doubt between Japanese firms.

As we know, the currency pair failed to continue its previous day’s strong intraday positive move of over 200 pips and faced some fresh supply during the Asian session on Wednesday, mainly due to improving demand for traditional safe-haven assets.

Despite organized struggles by global central banks and many government stimulus measures to balance the negative economic impact from the coronavirus pandemic, the fears of an expected global slowdown continued losing the investor’s confidence. 

It should be noted that the major reason behind the pair’s decline is the benefitted Japanese yen, which got support as perceived safe-haven status and turned out to be one of the key factors that leave some fresh downward pressure on the pair.

Daily Support and Resistance    

  • S1 101.97
  • S2 104.1
  • S3 105.19

Pivot Point 106.23

  • R1 107.32
  • R2 108.37
  • R3 110.5

USD/JPY – Trading Tips

The USD/JPY is trading at 107.800 and continues to face double top resistance around 108.065. Below this, the USD/JPY is exhibiting a correction which is likely to lead the USD/JPY prices towards 105.960. Closing of 4-hour candle above this level has confirmed the chances of further buying in the pair until 108. Whereas, below 105.950, we may see further selling until 103.750. On the leading indicator’s front, the USD/JPY is in a bullish mode, and we should consider buying trades over 105. All the best for today!  

Categories
Crypto Market Analysis

Daily Crypto Review, Mar 18 – Bitcoin will save the world from crisis, Tim Draper announces

The cryptocurrency market managed stayed at almost the same place as yesterday. Bitcoin climbed above the $5,000 mark and is currently stagnating and consolidating there. Bitcoin is currently trading for $5,341, which represents an increase of 1.3% on the day. Meanwhile, Ethereum lost 0.28% on the day, while XRP gained 0.56%.

Dragon Coins took the position of today’s most prominent daily gainer, with gains of 62.43%. On the other side, Terra lost 4.53% on the day, making it the most prominent daily loser.

Bitcoin’s dominance increased by a slight margin over the past 24 hours. Its value is now 64.51%, which represents a 0.57% difference to the downside when compared to yesterday’s value.

The cryptocurrency market capitalization went up slightly, with a current value of $151.75 billion. This value represents an increase of $5.61 billion when compared to the value it had yesterday.

What happened in the past 24 hours

Right as bitcoin recovered slightly after a number of back-to-back market crashes last week, investor Tim Draper announced another optimistic forecast about Bitcoin.

Draper announced that decentralization powered by Bitcoin as well as other new technologies is one of the tools that has the “ability to transform the biggest industries in the world.”

Honorable mention

NEO

NEO-based DEX Switcheo partnered with the Zilliqa platform to allow trading of Ethereum-based and EOS-based assets on their platform.

According to a Mar 16 announcement, after the launch, Zilliqa holders will have access to Ethereum-based assets for the first time. Switcheo also plans to add Bitcoin (BTC) support soon.

_______________________________________________________________________

Technical analysis

_______________________________________________________________________

Bitcoin

Bitcoin experienced almost no price movement in the past 24 hours. The price was completely flat while the volume lowered slightly. This area of no movement happened ever since Bitcoin stepped into the $5,300 area.


Bitcoin’s volume is quite low, while its RSI level is in the middle of the value spectrum (currently at 45).

Key levels to the upside                    Key levels to the downside

1: $5,960                                           1: $5,000

2: $6,640                                           2: $4,300

3: $6,850                                            3: 3,100


Ethereum

Ethereum did pretty much the same as Bitcoin by mirroring its movement (or lack thereof). The second-largest cryptocurrency did nothing but move sideways for the whole day, with the price hovering right below the $122.5 resistance.


Ethereum’s volume decreased further, while its RSI level is currently at 40. There were no changes in key levels due to no movement to the upside or downside.

Key levels to the upside                    Key levels to the downside

1: $122.5                                             1: $100

2: $128                                              2: $80 

3: $168                                           


Ripple

XRP, for the first time in a while, didn’t just follow the general direction of the market but actually mirrored Bitcoin’s and Ethereum’s movement. The lack of volume resulted in sideways trading with no price movement whatsoever. The third-largest cryptocurrency is moving in a range between $0.1 and $0.165.


XRP’s volume decreased even more in the past 24 hours, while its RSI level is currently at the 44 mark.

Key levels to the upside                    Key levels to the downside

1: $0.165                                            1: $0.1

2: $0.19

3: $0.2                                              

Categories
Forex Psychology

The Road to Become a Pro: The Trading Job Part 1

Except for elementary tasks, to do a job properly, it is commonly subdivided into several tasks or processes, each of them optimized to get the best results. To succeed in Forex trading, people need to think about trading as a job made up of several processes that the trader needs to do every day. 

There are three groups of processes a trader should do day, in day out plus another one that must be carried out periodically.

  • Preparation of the next trading session
  • The core trading processes
  • Post-session analysis 
  • Periodic review
  • Preparation for the session

Trading is like no other profession. Usually, when driving a car, the risk taken compared with the ability of people to predict where the vehicle is going is shallow, and even more so, when we think that it is in the interest of other drivers to avoid collisions against you. That is the opposite of what happens when trading the financial markets. Here, prices move to the direction of maximal pain, that is, pros and institutions, which have vast amounts of information about the trades of the rest of the crowd, move prices so as to hurt the most and profit from your “collisions.” Thus, even when just a few people recognize the fact, psychology plays a vital role in the success of the trader. 

Self-Assessment

According to Dr. Van K. Tharp, success is 60 percent self-control and 40 percent risk control. He also stated that the risk control part is 70 percent position sizing and 30 percent reward to risk ratio trades (cutting losses short and let profits run). Thus entries and exits, the basis of a trading system, account for just 12 percent of the total factors that make trading successful. That means traders need to work on themselves much more than on market analysis.

Traders also need to evaluate their physical and psychological conditions and prepare themselves before the opening of the session, since, as we saw, that they are the most crucial factor in their performance. Most top traders are aware that they must show a zen-like, emotion-free state of mind when trading. They call it Zero-state. 

Dr. Tharp contends that the propper psychological, mental state is the difference between profits and losses. That is quite true. Sometimes the edge a trader has over the market is tiny. That edge can be lost if the wrong mental state changes the equation, makes him modify or avoid a profitable entry or hold a losing trade too much, not following the rules.

Rate yourself

Before you start the trading session, rate yourself in your different facets (parts). Health, happiness, family relationships, economic condition, Self-image, your fear-greed state, your own market sentiment, and any other aspect you consider vital for you; and rate these aspects on a scale of 1 to 5 or 1 to 10. Make an index of all these and keep it. Check your trading performance in comparison with this index. Maybe you discover that trading below a certain level hurt your profits. You could make a rule not to trade unless your self-index is higher than a specific figure.

 Beliefs for Self-rating
  • I am crucial to successful trading
  • Being aware of how my brain works is a trading edge
  • Self-analysis can help my different mental parts to get in agreement
  • Trading with a self-rating below X hurt my profits
  • Success in trading is a measure of my mental performance
Best Mental States for self-rating
  • Honesty with yourself is crucial
  • Rational and meticulous
Mental strategy for self-rating
  • See yourself analyzing your condition
  • Identify and solve possible conflicts
  • Do the rating and judge if you are fit to trade today
  • if not, can you identify the part or parts with the lowest scores to improve them?
  • Yes? Go to Rehearsal
  • No? Avoid trading today.

Rehearsal

Rehearsal is a crucial element to improve almost any human activity. Visualizing the possible scenarios of future trades and identify your actions if one of them becomes real is key to success. Top athletes mentally rehearse his play before committing themselves to action. 

The rehearsal task is essential because your rational mind will be in command, and any fear or greed request sent by your subconscious (system one) mind can be easily spotted and analyzed if it is in collision with your planned course of action. That helps the trader avoid costly mistakes.

Beliefs for Rehearsal
  • Our capacity to process information is limited
  • Stress caused by our system one reduces that capacity further
  • Rehearsal helps our rational mind to take control of system one, which is irrational and primary
  • Better be prepared to act when needed, especially on disaster situations
  • Rehearsal will prevent mistakes and save money
The mental States for Rehearsal
  • Rational
  • Complete
  • Creative
  • Positive
Mental Strategy
  • Which unanticipated scenario can stop me from following the rules?
  •  For each trade: Plan the possible scenarios. Which stops and targets are optimal?
  • Mentally see yourself executing your solutions on every trade.

Further reading: Peak Performance Course Book 1 – How to use Risk, Van K. Tharp chapter V

Categories
Forex Market Analysis

WTI Crude Oil Slips Below $29- Coronavirus Outbreak Weights! 

The WTI crude oil prices flashing red falling from $30 to $28.70 in the wake of the coronavirus outbreak and uncertainties encompassing the price war between Saudi Arabia and Russia.

Improvements in the oil prices were limited today as new nations have announced COVID-19 lockdowns. Airlines are decreasing the number of regular flights because of increased numbers of cases and countries declaring quarantines to combat the new coronavirus. Canada and Malaysia are the two most recent countries to ban arrivals and close their borders.

The U.S. President Donald Trump said overnight that economic interruptions from the spread of the coronavirus and stimulus measures taken against it could start to a recession.

On the other hand, the ongoing price war between Saudi Arabia and Russia, two of the world’s biggest oil producers, also limits the oil price gains. Saudi Arabia’s Saudi Aramco threw down the gauntlet, with Chief Executive Officer Amin Nassar informing investors that the company is “very comfortable with oil prices below $30 a barrel”.  

Meanwhile, the group has decided to produce at maximum capacity of 12 million barrels a day next month, and there are no changes forecast for May. Consequently, crude oil prices are trading with a selling bias today.

Daily Support and Resistance

  • S1 23.34
  • S2 26.59
  • S3 27.96

Pivot Point 29.84

  • R1 31.21
  • R2 33.08
  • R3 36.33

On the technical side, crude oil seems to have formed a descending triangle pattern, which is likely to support crude oil around 27.70. Above this, the oil prices may trade bullish until 30 and 32.50. However, the bearish breakout of 27.70 can lead the WTI prices towards 25.65 and 23.85. Let’s consider staying bearish below $28.95. Good luck!  

Categories
Forex Videos

Forex Scalping The 5 Minute Time Frame Like A Pro! Easy Money!

Scalping with the 5-minute time frame!

The methodology in this presentation is to use the 5-minute time frame on the EURUSD and the GBPUSD pairs during lulls in the market. Such lulls or quiet periods tend to occur after the American session and just before the Asians come to market. During the Asian market session traders typically tend to focus on domestic currencies that affect their own countries’ GDP, such as the yen and Australian and New Zealand Dollar. Therefore if the timing is correct, opportunities will present themselves to scalp or look for trades with expectations of only making or losing a few pips at a time in this type of scenario. Should trace spill over into the Asian session, financial institutions will be taking positions with our peers, and volatility will increase, but our technical analysis set up and tight stops should protect us from heavy losses.
And although present market conditions are extremely volatile due to the coronavirus, eventually, the markets will calm down, and opportunities will present themselves to try and make money in calmer markets with this methodology.

The first part of our setup is to observe periods in trading that have not been volatile in the run-up to the closing of the American session. We are looking for periods of consolidation and sideways trading in our two pairs, which should spill over into the Twilight Zone between the American session closing and the Asian session opening.
We want to keep our chart set up to a minimum with as little indicators as possible because they tend to be quite laggy on the 5-minute chart. Price action and Bollinger bands are the key behind this setup.

Example A


Example A shows the GBPUSD pair on a five-minute chart, and the period between our two vertical lines shows the time zone we are targeting specifically, and please note some brokers use different times on their charts, such as ours, which is two hours ahead of UK time.
First of all, we can see that price action has been very muted in the run-up to the time we are focused on, and should this be the case, there is no reason why you should not enter this trading methodology sooner, should you wish.

Example B


In example B, we have added the Bollinger bands with a period of 13 and deviation set at the standards default of 2.0.
The most critical parts of this setup is that the Bands must be moving sideways.

Example C


In example C, we can see that price action spikes outside of the Bands at position A, where we have gone short and placed a tight stop loss a couple of pips above the previous high as denoted by our Horizontal line. And when price touches the bottom of the Bollinger band, we need to exit the trade. If price begins to move higher inside the band, which it does at position C, we would enter a buy trade with a target of the upper band and with a stop loss a couple of pips below any low in this consolidation period. In which case, our exit would be at position D.
There are conservatively 15 pips within our highlighted period and a total of over 50 pips within this consolidation period, as presented on the chart as price tops and bottoms from the tops to the bottoms and back of the bands. Tight stops keep losses to a minimum with this setup.

Categories
Forex Fundamental Analysis

What Is Balance Of Trade & What Impact Does It Have On The Forex market?

Introduction

The Balance Of Trade AKA. BOT is essentially the difference or variance in a nation’s export and import. When understood correctly, this indicator can help us in evaluating the relative robustness of any given economy compared to the other ones. 

Understanding Balance Of Trade

In the simplest of analogies, consider a scenario where a rice seller sells $1000 worth of rice to other grain sellers in the market over a month. Within that month, if he had purchased $800 worth of goods like vegetables, fruits, etc. from the other vendors, his Balance Of Trade would be $200.

Here, in this example, the market is the entire world, and the rice seller is equivalent to a nation. $1000 is the net worth of the exported goods and services that went out of the country, whereas the $800 is the net worth of the imported goods and services that came into the country. In this case, $200 is the trade surplus that the country is having.

Therefore, Balance Of Trade can be considered as a difference between what goes out (exports) and what comes in (imports) over a given time frame. And depending on whether exports or imports are greater, a nation is said to be running a Trade Surplus or Trade Deficit, respectively. Fundamentally, an Export is when a foreign resident or nation purchases an in-country produced good or service, and an Import is when an in-country citizen purchases goods or services from foreign.

How is the Balance Of Trade calculated?

In the previous article, we understood the formula of a country’s current account. That is, Current Account = (Exports – Imports) + Net Income + Net Current Transfers.

In the above formula, (Exports – Imports) is the Balance of Trade.

How Can This Economic Indicator Be Used For Analysis?

Investors can use Balance Of Trade numbers to ascertain whether the overall economic activity of a nation has grown or slowed down concerning the previous month’s/quarter’s/year’s numbers. For example, a country which has seen a trade surplus for let’s say over ten years, and due to some calamities, its exports got hit. The nation might enter into a trade deficit or a reduced trade surplus. Such a relative comparison can help investors to ascertain whether a country’s economy is booming or slowing down.

In an absolute sense, a Trade surplus or Trade deficit, as discussed, cannot tell in entirety. But it will definitely give us a macroeconomic picture of an economy’s health and what the nation has undergone in the present business cycle. Let’s assume a country is a major exporter of oil for which it receives a majority of its income. If the production of oil is doubled, automatically there will be an increase in the demand for that currency worldwide. This will result in an appreciation of that country’s currency.

Not just this, but the Balance Of Trade can also point towards many things like an increase in employment or an oncoming expansion or recession when viewed with correct perspective and analysis.

Impact of Balance Of Trade on Currency

By simply looking at the BOT numbers, we cannot conclude whether a nation is experiencing growth or slow down straight away. Because the Balance Of Trade only projects a partial picture and not the whole picture.

A developing country might want to import more goods and services from abroad, which increases the competition in their respective markets. Thereby they keep the prices and inflation low. During these periods, that country will have a Trade Deficit. To an outsider, it will only look like the country is consuming more than it is producing. So this scenario can be wrongly assumed as the country’s economy is slowing down. But in reality, what if the country is experiencing a trade deficit for the first six months and a trade surplus for the next six months?

Developed nations like the United States and the U.K. have experienced long periods of trade deficits against developing and emerging economies like China and Japan, who have maintained trade surpluses for long times. Hence, the time frame, business cycles, the relative situation with other countries all factor in to give a correct interpretation to the BOT.

But in general, most of the time, an increase in the Balance of Trade number is good for Currency. It is a proportional indicator, meaning. Lower or negative Balance of Trade numbers relative to previous periods signals currency depreciation and vice versa.

Balance of Trade & Balance of Payments

BOT is a major component of a Nation’s BOPs, i.e., Balance Of Payments. Balance Of Payments, ideally, should always equate to zero, giving us a complete account of all things traded in and out of an economy. A nation can have a surplus while having a trade deficit. This happens when other components of Balance Of Payments like Financial Account or Capital Account run into large surpluses.

But in general, countries prefer to have a trade surplus, and it is obvious. A country in net terms receiving a gain or profit for their goods and services would mean that the people of that country will experience higher wealth, and it would automatically result in a higher standard of living. And also, by continually exporting, they would develop a competitive edge in the global market. This would also increase employment within the nation, which, in general, is favorable for the nation. But as said, it is always not necessary for this condition to be true. It depends on what goals the country has in mind for future short term deficits also matters.

Hence Balance Of Trade is one of the important indicators for analysts to ascertain a country’s economic activity and current health of an economy.

Economic Reports

Since the Balance of Trade is about imports and exports, data for the same is publicly available on a monthly basis for all the countries. The reports are released in the United States by the U.S. Bureau of Economic Analysis and the U.S. Census Bureau. The units would be typically in millions of dollars for most reports and for most nations. The popularly used reports are typically seasonally adjusted to give a more accurate report.

Sources of Balance Of Trade

To get the latest information about this economic indicator for the United States, you can refer to this link. To know all the diverse components involved in Balance Of Payments and International Trade, you can refer to this page from The Bureau Of Economic Analysis.

Impact Of ‘BOT’ News Release On The Price Charts

Now that we know the meaning of trade balance and how it affects the economy, we shall extend our discussion and understand how it impacts any of the currencies after the news announcement is made.

As we can see in the below image, the Trade Balance indicator has the least effect on currency (yellow indicator implies the least impact on currency). Hence, this might not cause extreme volatility in the currency pair after the news release. It is still important to understand the effect and look at how we can position ourselves in the market in such scenarios.

For illustration, we have chosen the New Zealand Dollar in our example, and we will analyze the latest’ Trade Balance’ data of the same. The data shows that Trade Balance was increased by 44M as compared to the previous reading, which is said to be positive for the currency. But let us see how the market reacted to this data after the announcement was made.

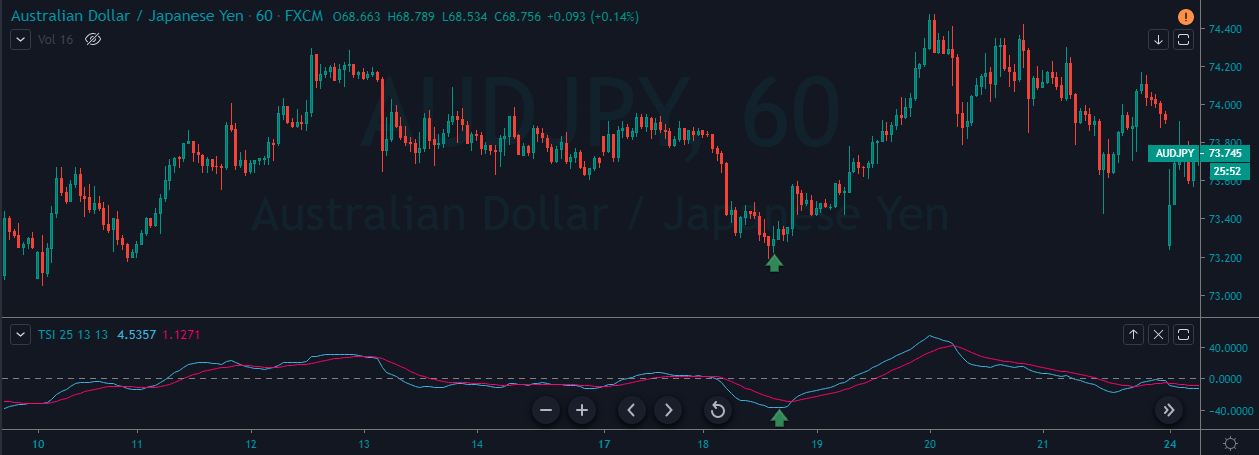
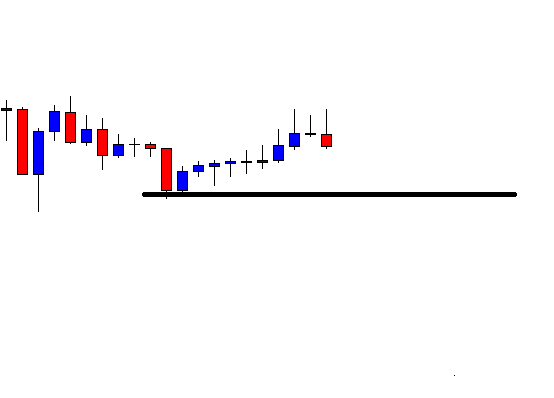
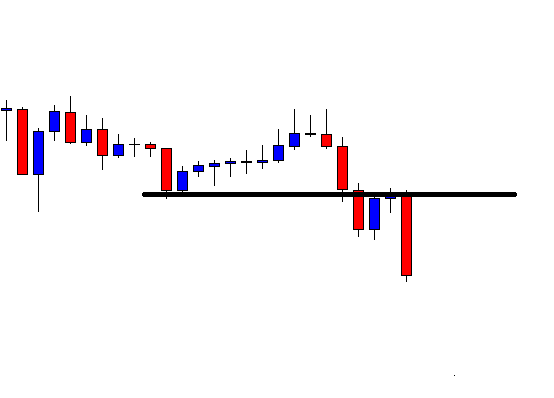
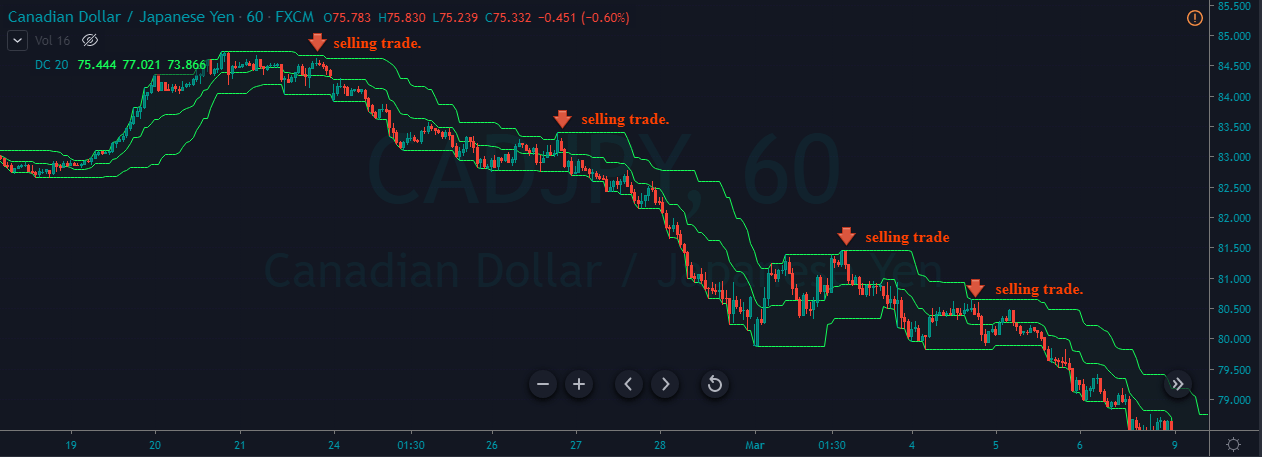
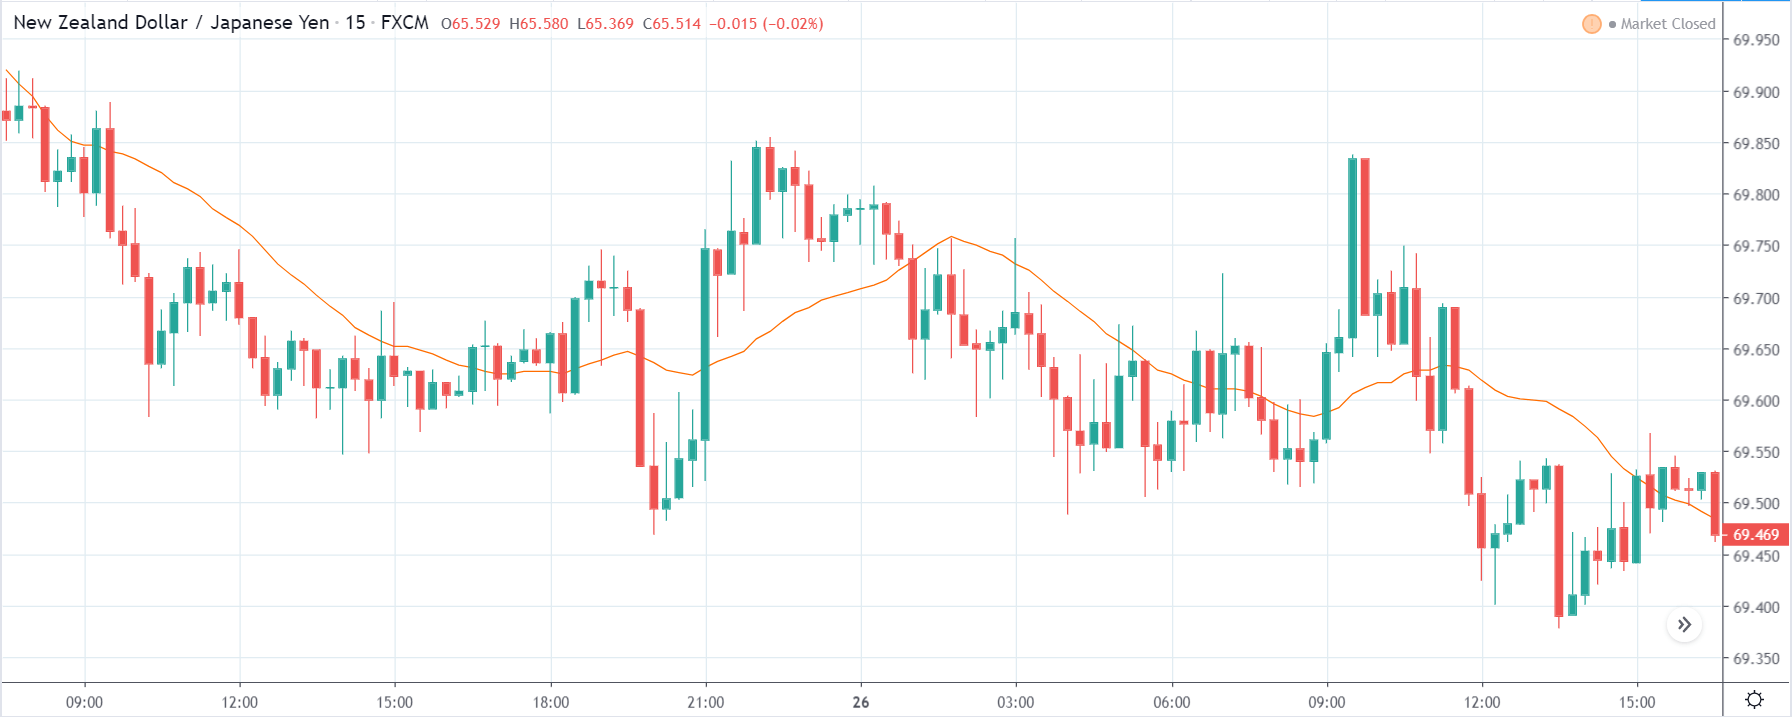
NZD/JPY | Before The Announcement - (Feb 26th, 2019)

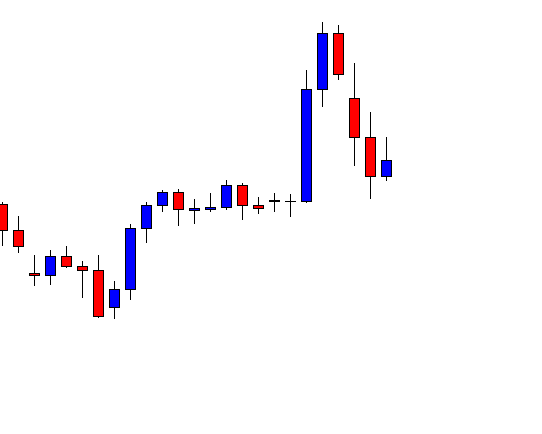
The below chart shows that the overall trend is down, which means the New Zealand dollar is very weak. As said in the above paragraph that changes in Trade Balance of a country do not have much impact on the currency, so better than expected data can only cause a reversal of the trend. However, if the data is retained at previous reading, we can expect a continuation of the downtrend, and volatility will be more on the downside. We will be looking to trade the above currency on the ‘short’ side if the Trade Balance data is bad for the country since even positive data cannot push the currency higher.

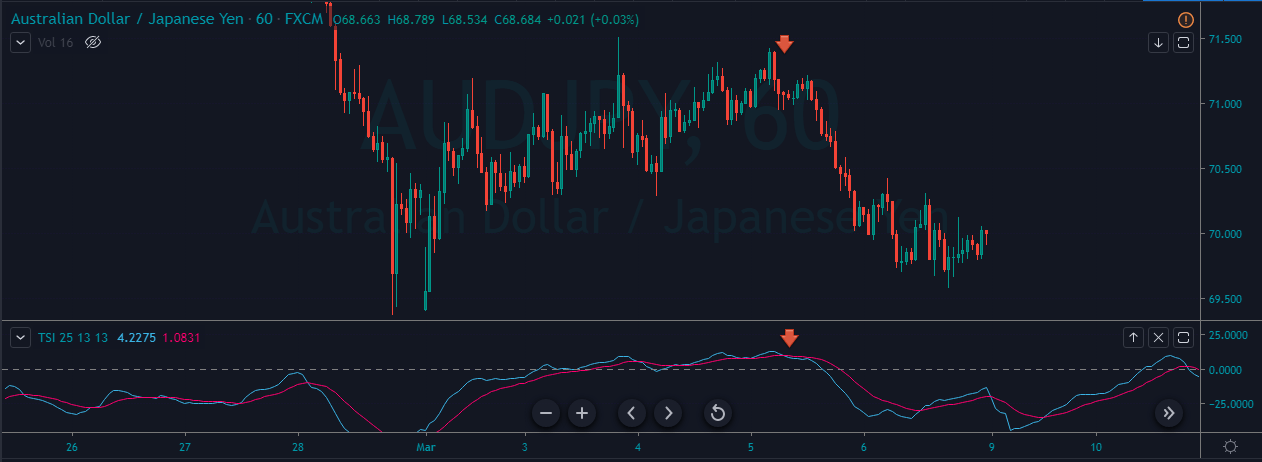
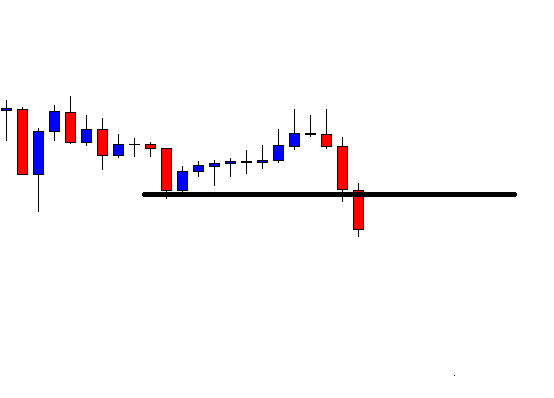
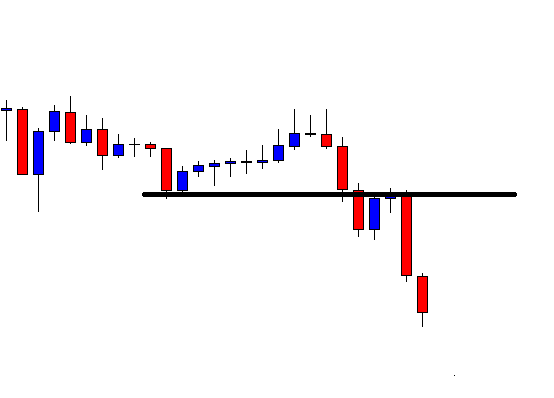
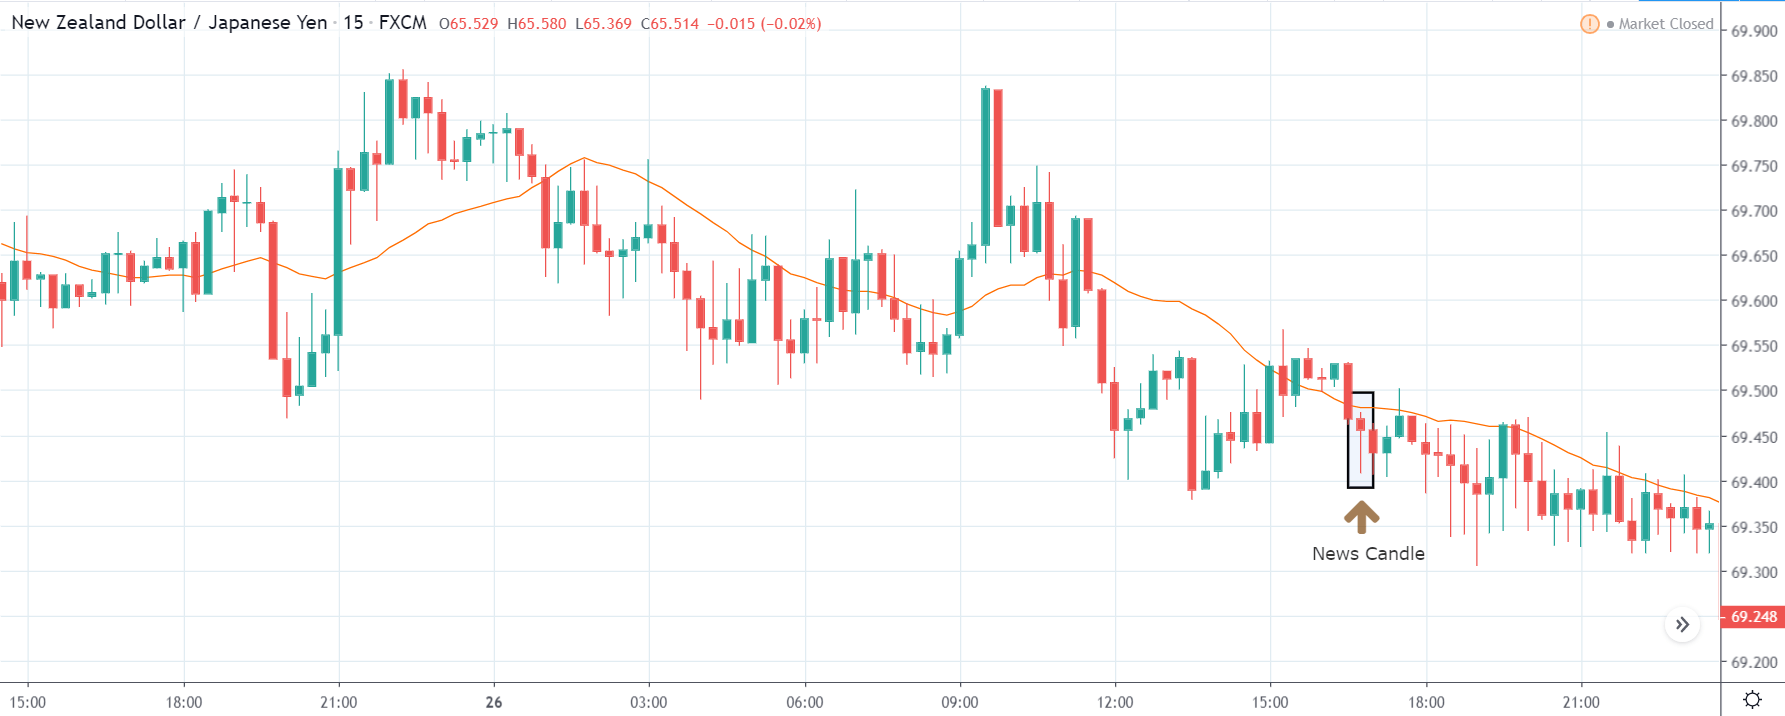
NZD/JPY | After The Announcement - (Feb 26th, 2019)

After the news announcement, we see that the price crashed below the moving average, reacting to the not-so-good numbers of Trade Balance for New Zealand. The market participants were expecting much better Trade Balance data, but after seeing that it was increased by mere 44M, they were disappointed and hence sold New Zealand dollars. We can take advantage of this change in volatility by taking risk-free ‘short’ positions in the pair soon after the market falls below the moving average. We can hold on to our trade as long as the price is below the moving average and exit once we see signs of reversal.

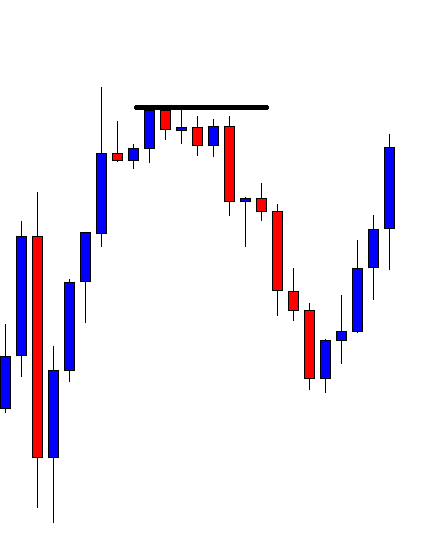
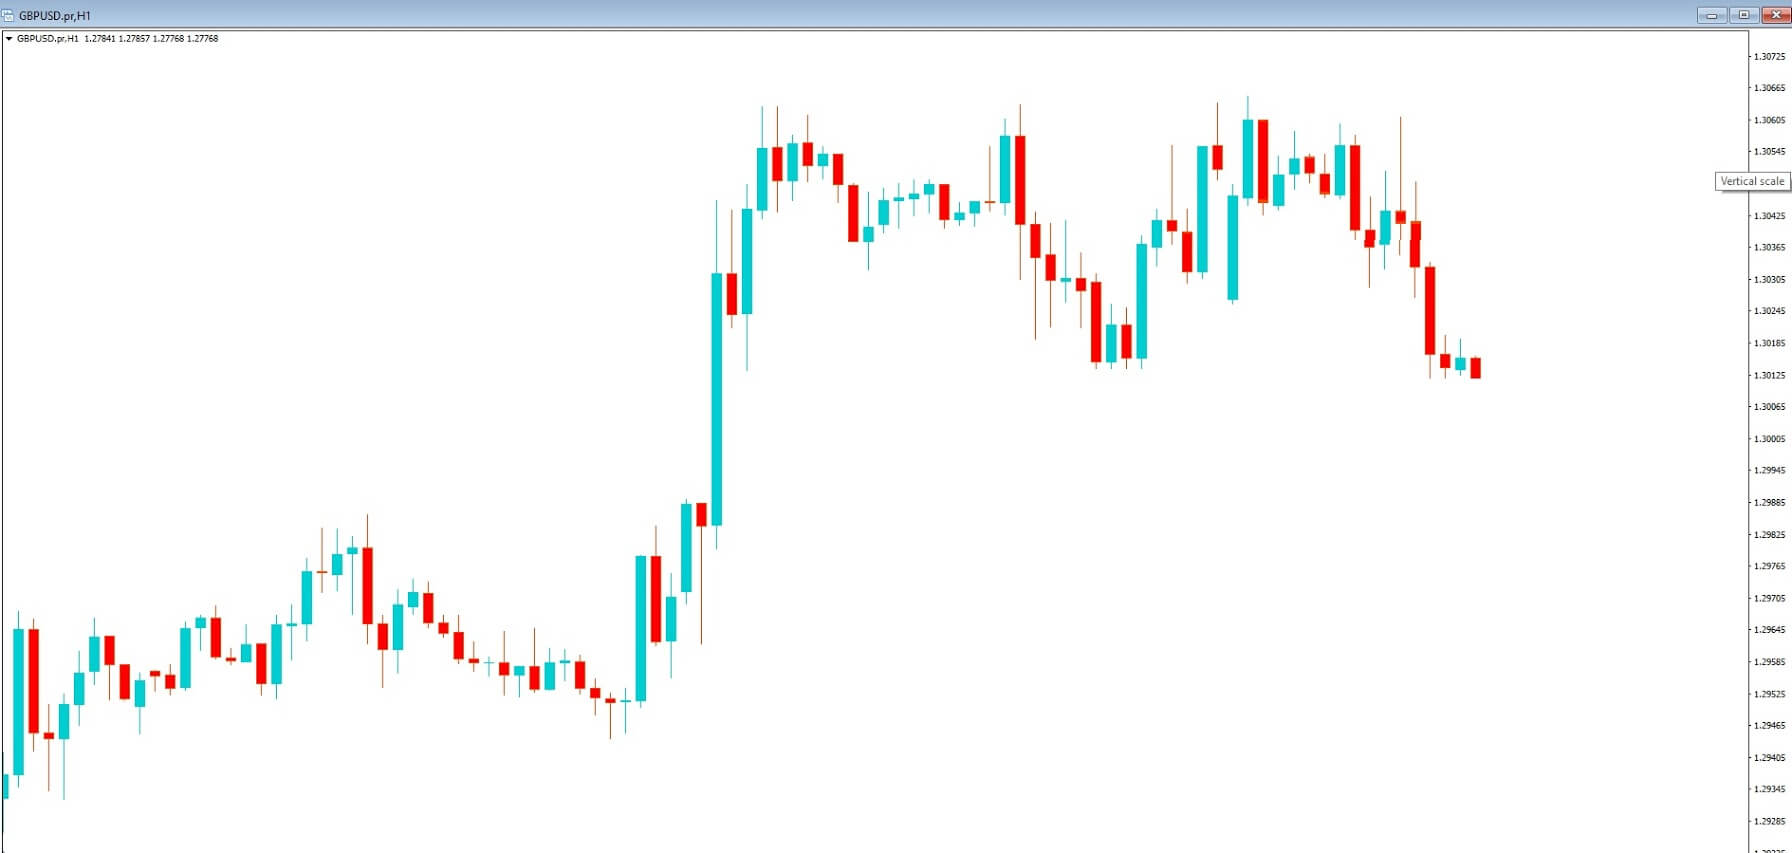
GBP/NZD | Before The Announcement - (Feb 26th, 2019)

Here we can see that the New Zealand dollar is on the right-hand side, and since the market is in a downtrend, the currency is strong. In this situation, a risk-free way to trade this pair is by going ‘long’ if the Trade balance numbers are not good for the pair and after trend reversal signals. Since the downtrend is not very strong, we can take ‘short’ positions only if it breaks the recent ‘lows’ and shows signs of trend continuation.

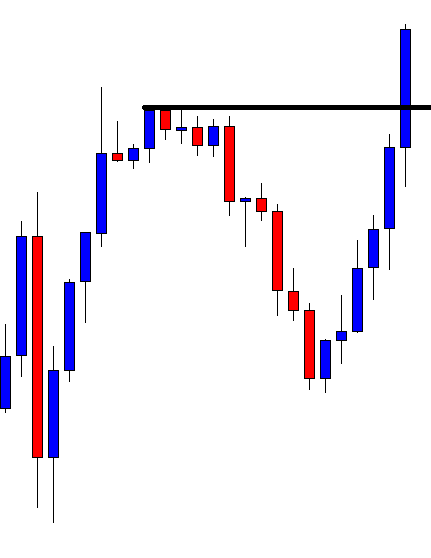
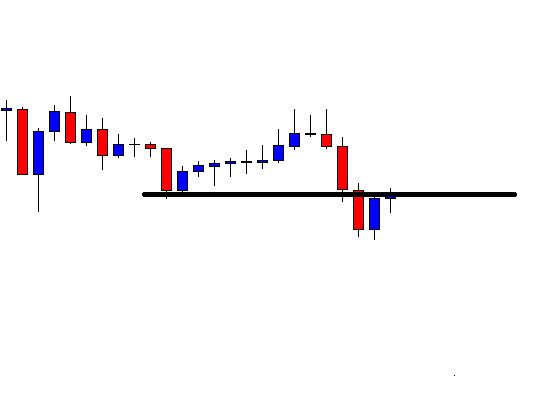
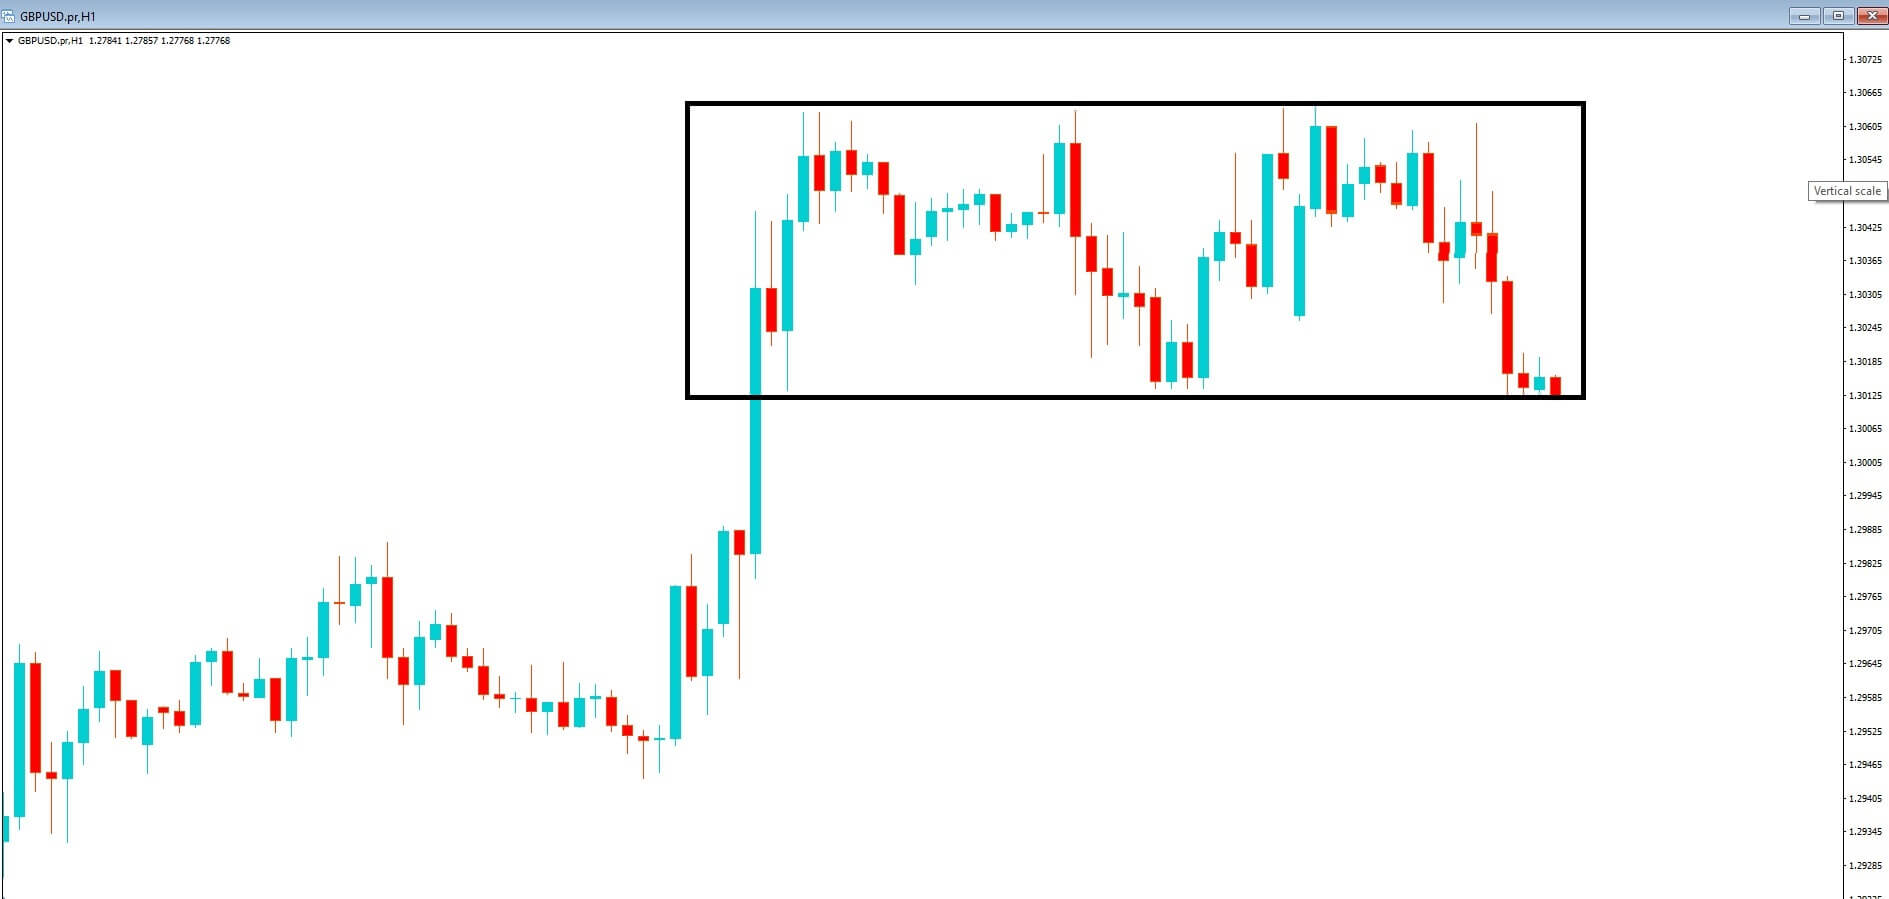
GBP/NZD | After The Announcement - (Feb 26th, 2019)

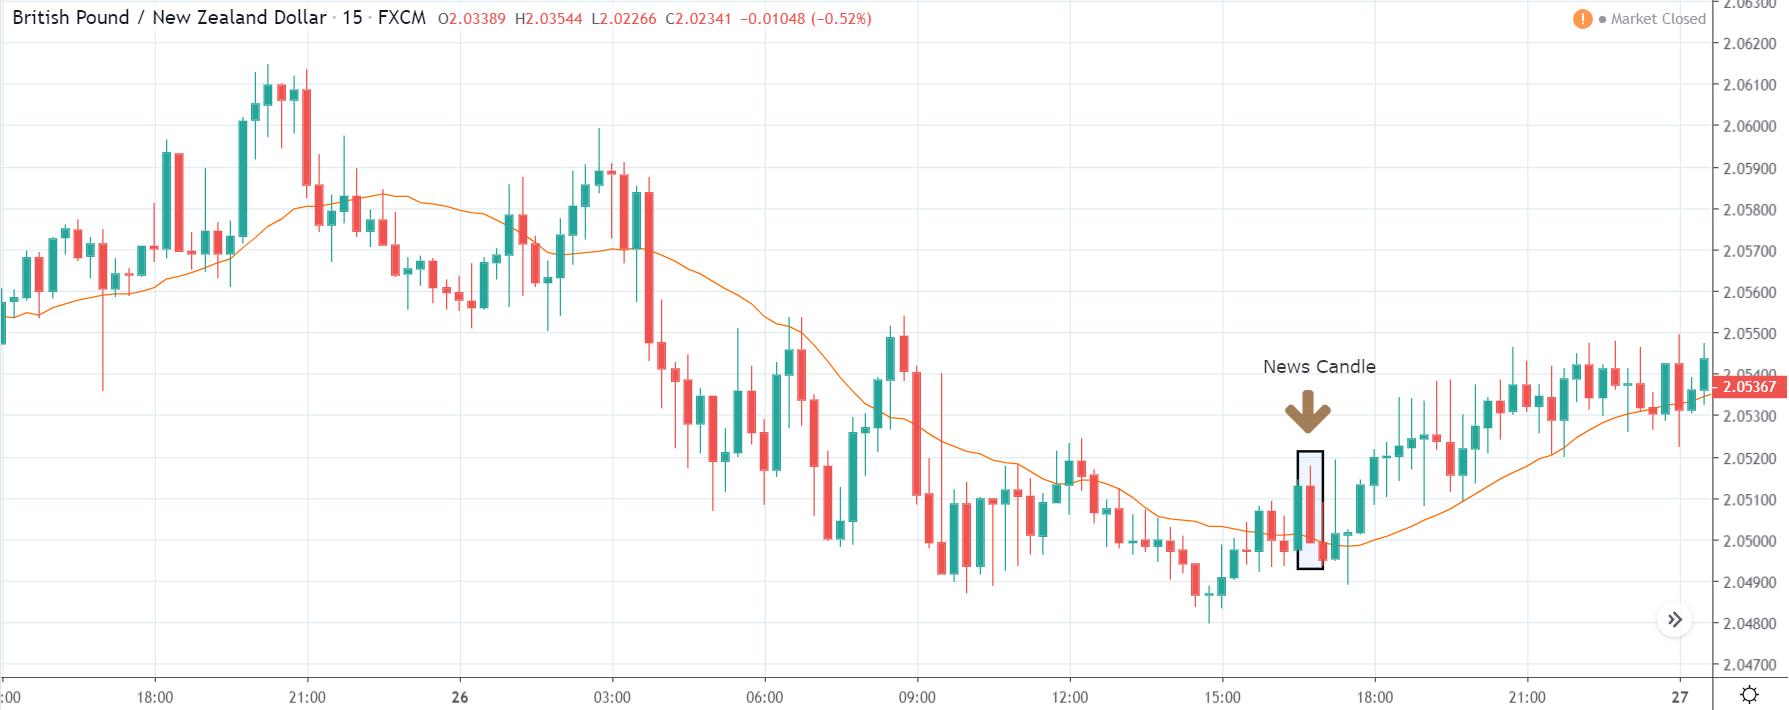
After the numbers are out, we see the positive reaction for the New Zealand dollar as the numbers were better than last time, but it could not take it lower. Since the data was weak, we can ‘long’ positions in the pair once the price makes a ‘higher low’ after crossing above the moving average.

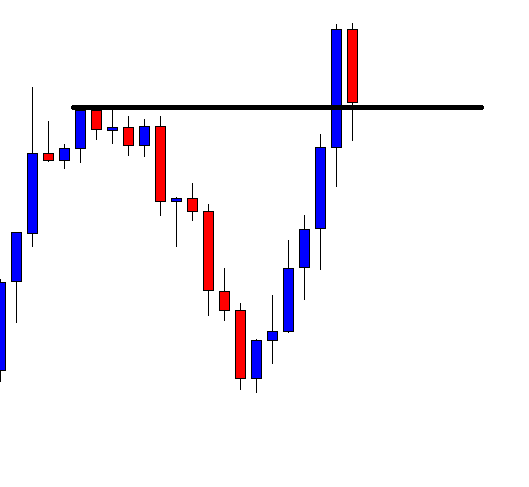
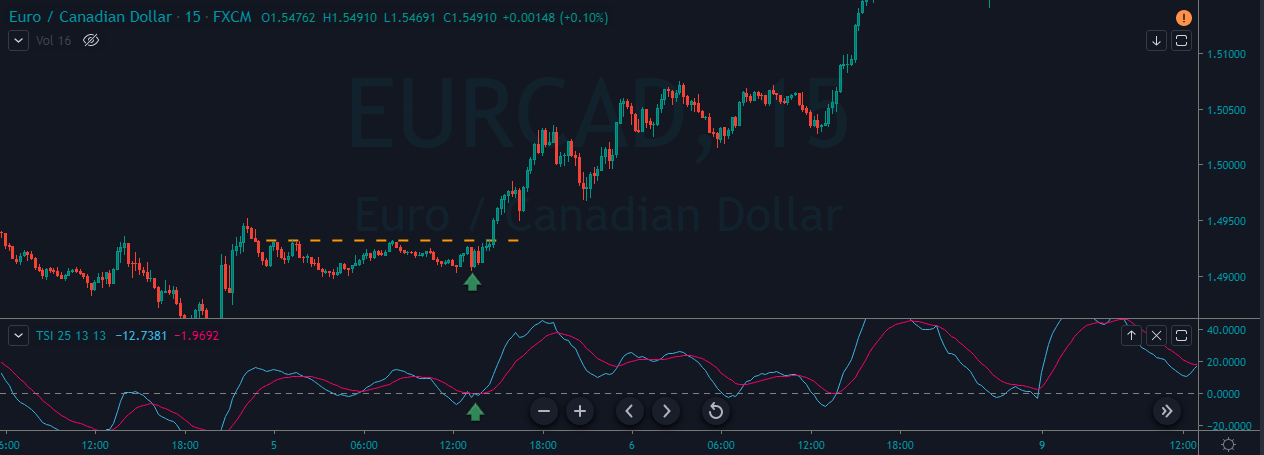
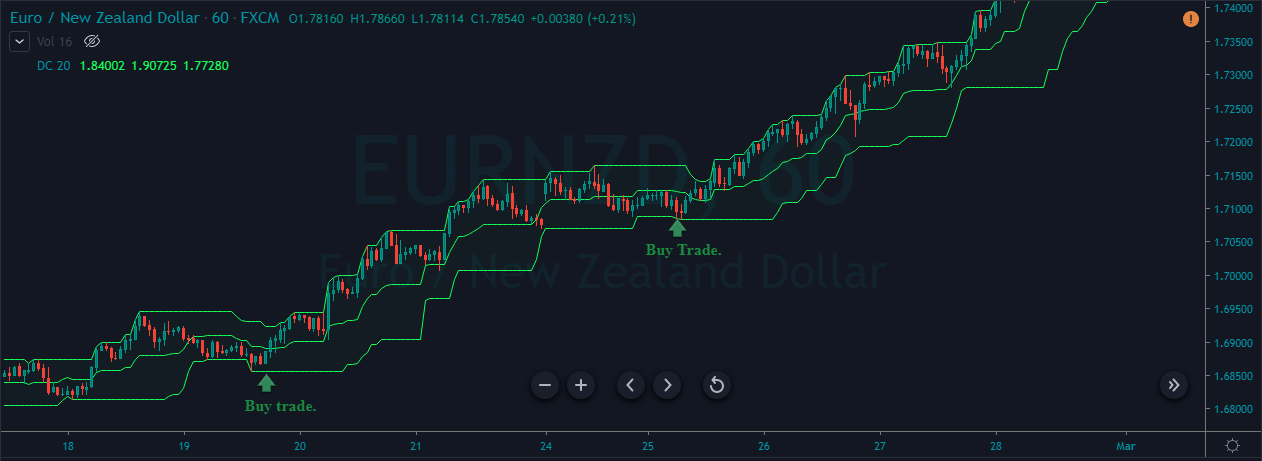
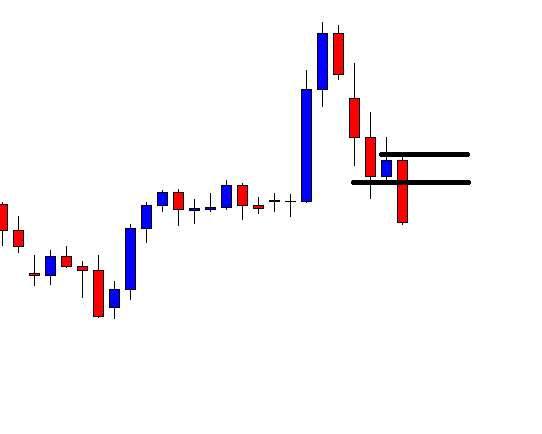
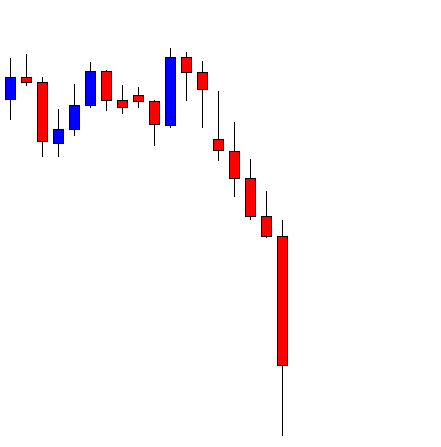
EUR/NZD | Before The Announcement - (Feb 26th, 2019)

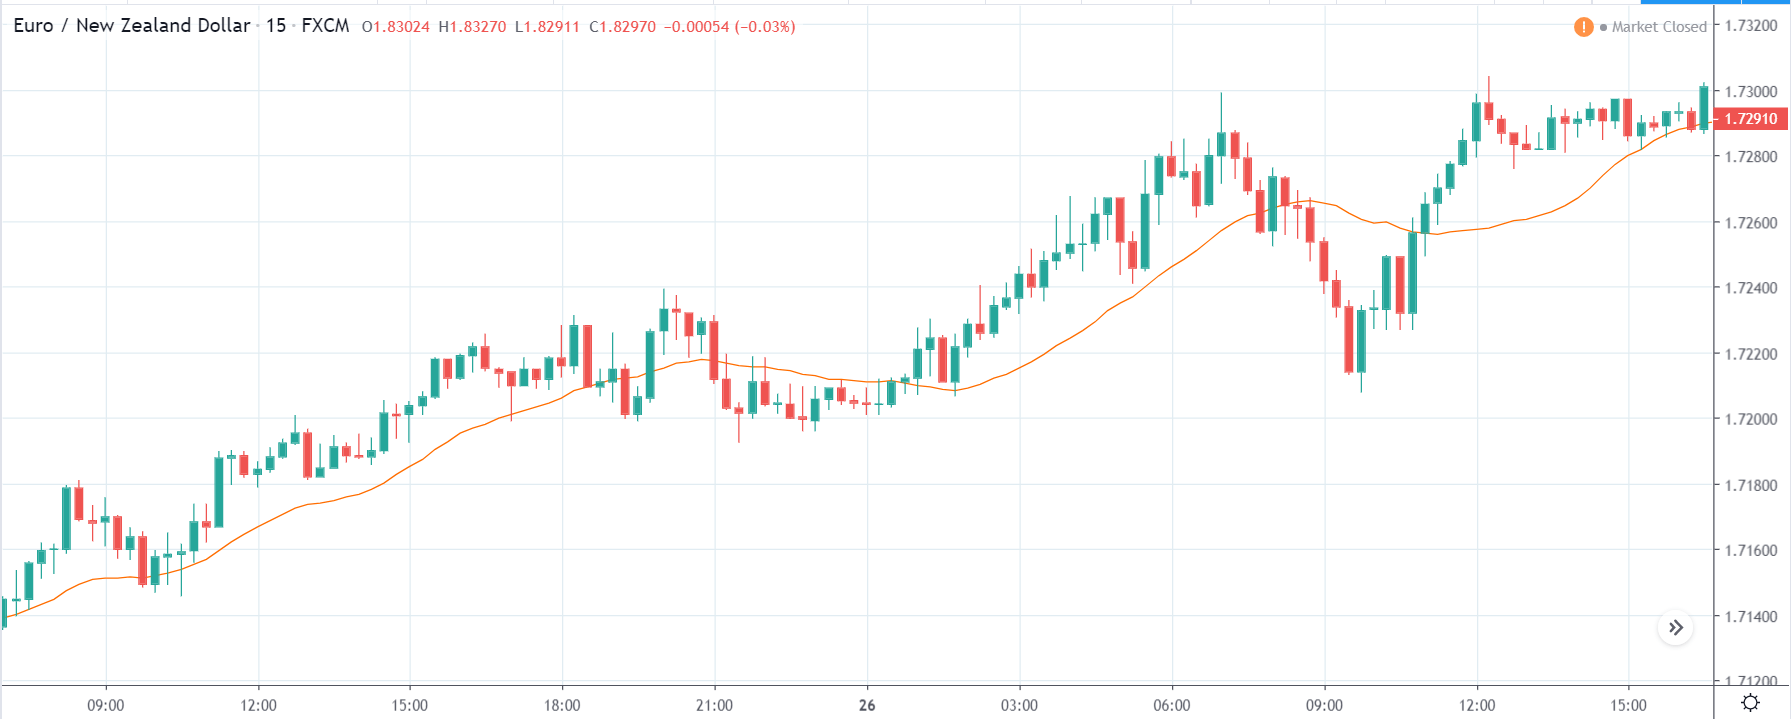
The above chart represents the currency pair of EUR/NZD, which shows similar characteristics as that of the NZD/JPY pair but in reverse as the New Zealand dollar is on the right-hand side. In this pair, the New Zealand dollar is extremely weak, and we also the price is above the moving average showing the strength of the uptrend. Therefore taking’ short’ positions in this pair is not advisable even if the Trade Balance data is good for the New Zealand economy, as it is a less impactful event, and the reversal might not last. A better option would be to go ‘long’ in this pair.

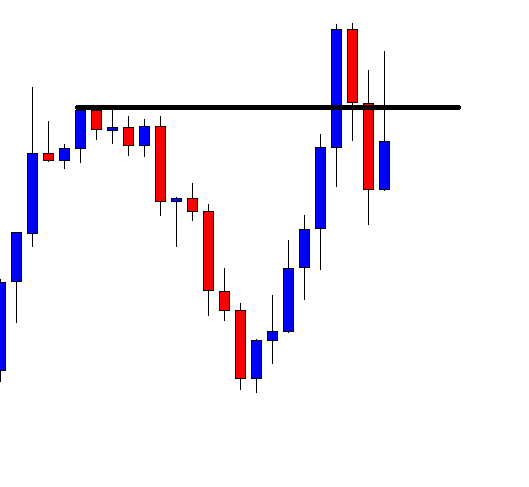
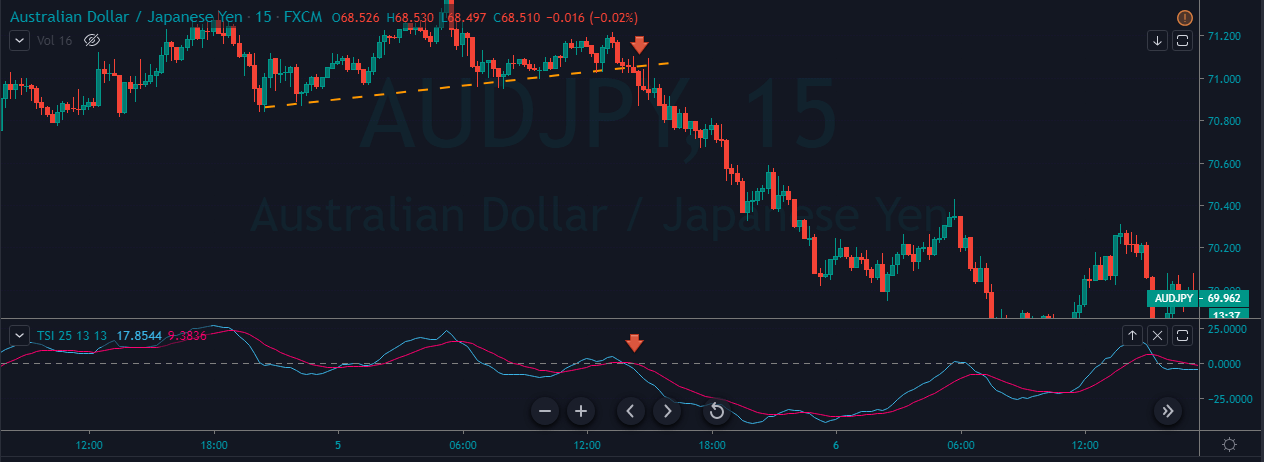
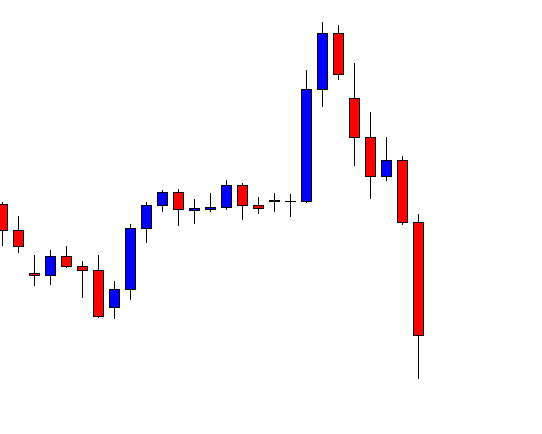
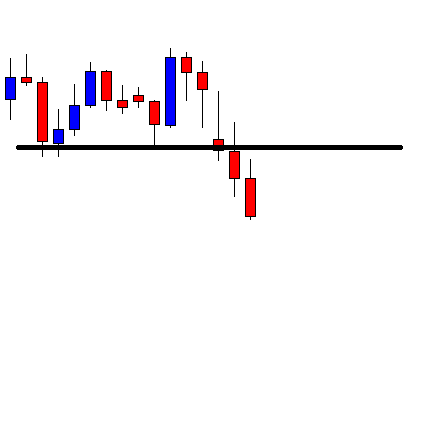
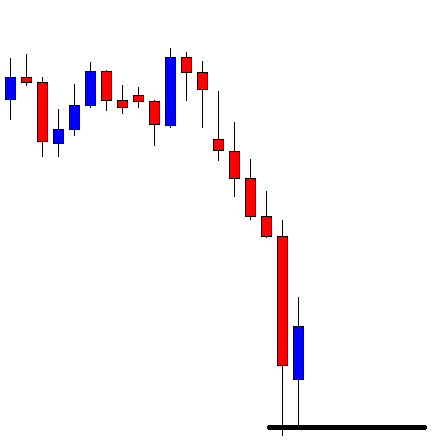
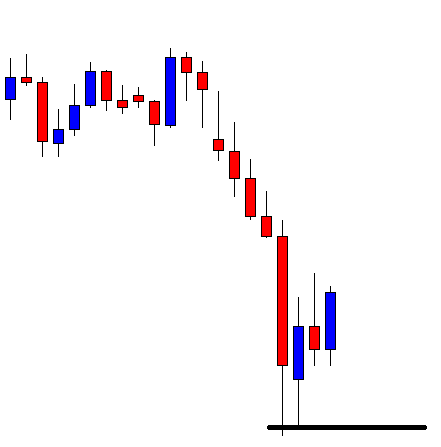
EUR/NZD | After The Announcement - (Feb 26th, 2019)

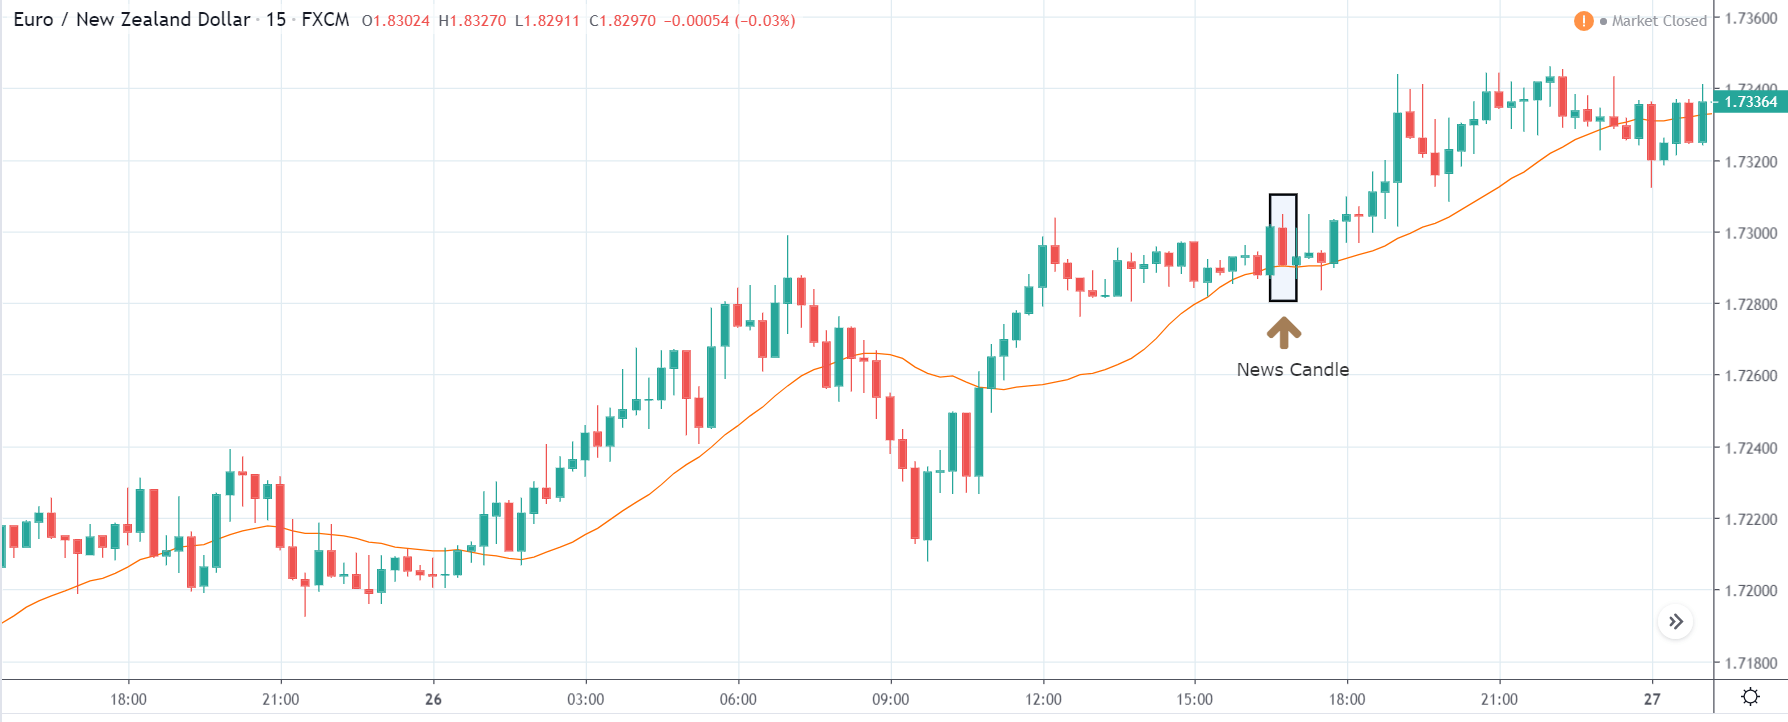
After the news announcement, we see a red candle, and the price bounces off the moving average, continuing its uptrend. Since the data was not very positive, the market continues its uptrend, and thereby the New Zealand dollar weakens further. This could be the perfect setup for a ‘buy’ since all parameters are in our favor. The volatility here expands on the upside, after the news release.

That’s about the Balance of Trade and its impact on the Forex currency pairs. We just wanted to show how the markets get impacted after the news release. It is always advisable to combine these fundamental factors with technical analysis as well to ace the Forex markets. Cheers.

Categories
Forex Course

82. Using The MACD Indicator To Identify Potential Trading Signals

Introduction

The MACD indicator was developed by Gerald Appel in the late 1970s. It stands for Moving Average Convergence and Divergence. MACD is quite popular, and it can be considered as one of the safest and most effective momentum indicators in the market. As the name suggests, this indicator is all about the convergence and divergence of the two moving averages. When the moving average moves away from each other, the convergence occurs. Likewise, the divergence occurs when the moving average of the indicator moves towards each other.

MACD fluctuates above and below the zero lines, unlike the RSI indicator that we discussed yesterday. Also, since MACD is an unbound indicator, it is not useful to find out the overbought and oversold market conditions. Instead, traders can look for the signal line crossovers, centerline crossovers, and divergence to trade the market.

The image below represents the MACD indicator on the GBP/USD Forex chart.

How To Trade Using The MACD Indicator?

Signal Line Crossovers

The signal line crossover is one of the most popular trading strategies designed around the MACD indicator. A bullish crossover occurs when the indicator prints a crossover below the zero-line.  Contrarily, A bearish crossover occurs when the MACD prints a crossover above the zero-line.

If you are trading the lower timeframe, these crossovers last for a few hours. But if you are trading the higher timeframe, these crossovers can last a few days or even weeks. In the below chart, we can see a buy and sell signal generated by using the MACD indicator. In simple words, crossover below the zero-line indicates a buying trade, and the crossover above the zero-line indicates a selling trade.

Trade The Zero Line By Following The Trend

When the MACD line goes above the zero-line, it means that the trend of the instrument is gaining strength. When this happens, any buying anticipation will be a good idea. Conversely, when the indicator goes below the zero-line, it indicates a strong downtrend, and going short in the market is a good idea at that point.

If we plan to go long, it is advisable to trade with the trend. In a buy trend, if the MACD line indicates a selling signal, try to ignore that signal and wait for the buy signal. The same applies to the sell-side as well. If we find any breakout or breakdown supporting the MACD signal, that increases the probability of our trade performing in our desired direction.

The below image represents a sell signal by using the MACD indicator. In a downtrend, when the price action broke the major resistance line, we can see a crossover on the MACD indicator below the zero-line. This clearly indicates the gained momentum by the sellers,, and going short from here will be a good idea. Make sure to book the profit when the MACD indicator gives the crossover to the buying side.

MACD Indicator + Double Moving Average

We have learned what Moving Averages are and how to use them on the price charts. In this strategy, we are pairing the MACD indicator with 9-period and 15-period moving averages to identify potential trading signals.

The strategy is to go long when the MACD gives a crossover below the zero-line and the moving averages crossover below the price action. Conversely, go short when the MACD indicator gives the crossover above the zero-line and the moving averages crossover above the price action. It is advisable to use this strategy in healthy market conditions, and the lower period averages work fine for intraday trading only.

As you can see in the below chart, the market was in an uptrend. Using this strategy, we have identified three buying opportunities. All of these three trading opportunities have gives us 70+ pip profit in just two days. As we know that the moving averages act as dynamic support and resistance to price action, it is safe to put the stops just below the moving average indicator and exit our position when any of the indicators give an opposite signal.

That’s about the MACD indicator and how to trade the Forex market using this indicator. If you have any questions, let us know in the comments below. Stay tuned to learn about many more technical indicators in the upcoming sections.

[wp_quiz id=”66874″]
Categories
Forex Market Analysis

Daily F.X. Analysis, March 17 – Top Trade Setups In Forex – Eyes on U.S. Retail Sales 

On the forex front, the U.S. dollar encountered a volatile trading session, with the ICE U.S. Dollar Index dropping 0.8% to 98.00. ZEW survey results in March will be released for Germany (current situation at -30.0, expectations at -27.2 expected) and the eurozone. The U.K. Office for National Statistics will publish a jobless rate for the three months to January (steady at 3.8% expected).

The U.S. Commerce Department will post February retail sales (+0.2% on month expected) and January business inventories (-0.1% on month expected). The Federal Reserve will release February industrial production (+0.4% on month expected) and capacity utilization (77.1% expected). The Labor Department will report JOLTS job openings for January (6.40M expected). The National Association of Home Builders will publish March Housing Market Index (74 expected).

Economic Events to Watch Today    


EUR/USD – Daily Analysis

EUR/USD rose 0.5% to 1.1160. Later today, the ZEW German Current Situation Index for March will be released (-30.0 estimated). The ZEW survey results in March will be released for Germany (current situation at -30.0, expectations at -27.2 expected) and the eurozone.

European stocks returned to negative territory, with the Stoxx Europe 600 Index losing 4.9%. Germany’s DAX dropped 5.3%, France’s CAC lost 5.8%, and the U.K.’s U.K.’sU.K.’s U.K.’s FTSE 100 fell 4.0%. Meanwhile, the European Union proposed a 30-day travel ban on non-essential travel for the whole of the union region.

Whereas, the broad market recession fears continue to increase the progress into the U.S. bonds, which translates into lower returns on the bonds, ultimately keep the greenback under pressure. The U.S. dollar index trades around 98.25, down 0.50% on the day, having stopped its recovery just shy of 98.50. 

Meanwhile, Treasury Secretary Steven Mnuchin said after a meeting with Senate Republicans that he was trying to attempt a significant stimulus package expected to support the economy due to the coronavirus outbreak. Looking forward, the focus will be on the German Zew Survey for March, which is scheduled to release at 10:00 GMT. During the American session, the spotlight will be on the U.S. Retail Sales, which is due at 12:30 GMT. 

Daily Support and Resistance

  • S1 1.0882
  • S2 1.1024
  • S3 1.1096

Pivot Point 1.1166

  • R1 1.1238
  • R2 1.1309
  • R3 1.1451

EUR/USD– Trading Tips

The EUR/USD has traded mostly lower, bouncing off the double bottom support level of 1.1095 level. The EUR/USD is currently trading around 1.1165, and it’s forming a lower-lows pattern on the 4-hour chart, which mostly drives a continuation of a selling trend. On the lower side, a continuation of a bearish bias can extend sell-off until 1.1100 and 1.1095. While the bullish breakout of 1.1350 can drive more buying until 1.1454 area. Consider staying bullish over 1.1182 and bearish below the same level today. 


GBP/USD– Daily Analysis

The GBP/USD marked a day-high of 1.2431 before retreating to close at 1.2268, broadly flat compared with the prior session. Investors will focus on the latest official jobs report due later in the day (jobless rate steady at 3.8% expected). For now, eyes will be on the U.K. Office for National Statistics as it will report a jobless rate for the three months to January (steady at 3.8% expected).

Market’s risk-tone seems to recover after the fresh stimulus from New Zealand and extended bond-buying from the BOJ. Also, supporting the risk recovery could be comments from Japan to coordinate with China and South Korea to tackle the pandemic. As in result, the U.S. ten-year treasury yields increase five basis points (bps) to 0.775%, whereas stocks in Asia also mark mild gains by the press time.

As we all know that the economic calendar is also active during the day ahead, markets will pay more attention to the COVID-19 headlines and the global struggles to stop the pandemic.

Daily Support and Resistance

  • S1 1.1938
  • S2 1.211
  • S3 1.2189

Pivot Point 1.2282

  • R1 1.2362
  • R2 1.2454
  • R3 1.2626

GBP/USD– Trading Tip

The GBP/USD fell sharply to trade around 1.2260 level and has closed a Doji candle followed by strong selling candles. The Cable has immediate support around 1.2170 level, and above this, the Cable can extend the continuation of a bullish bias until 1.2290 level and 1.2325.  

The MACD is consistently forming bearish histograms below zero, supporting the selling trend in the GBP/USD pair, which is why we should consider selling below 1.2282 today. Recently, the GBP/USD has closed a bullish candle that can drive buying in the GBP/USD, and it may lead its prices higher towards 1.2425 level. 


USD/JPY – Daily Analysis

The USD/JPY marked a day-low of 105.12 before closing at 106.25, down 1.5% on the day. The Bank of Japan kept its benchmark rate unchanged while doubling its target for the net purchase of ETFs to 12 trillion yen.

The USD/JPY currency pair are flashing green and trading above the mid-106.00 level, mainly due to the risk sentiment improved in the market. While the pair remain struggling to find acceptance above the 107.00, at the press time, the USD/JPY is trading at 106.86 and consolidates in the range between the 105.86 – 107.17.

The currency pair succeeded in recovering some positive traction on Tuesday and built on the overnight late bounce from the region of the key 105.00 psychological marks after a combination of supporting factors.

Notably, the moderate recovery in the global risk sentiment, as represented by positive sentiment in the equity markets, weakened the Japanese yen’s safe-haven demand and gave some support to the pair.

A hard struggle by major central banks to stop any negative impact from the coronavirus pandemic improved to boost investors’ confidence and turned the equity market positive.

The reason behind the risk-on sentiment could also be the goodish bounce in the U.S. Treasury bond yields, which improved the U.S. dollar demand and further added to the pair’s modest uptick.

Daily Support and Resistance

  • S1 99.26
  • S2 102
  • S3 103.37

Pivot Point 104.74

  • R1 106.11
  • R2 107.47
  • R3 110.21

USD/JPY – Trading Tips

The USD/JPY is trading at 107.800 and has already completed a 61.8% Fibonacci retracement level at 108.065. Below this, the USD/JPY is exhibiting a correction which is likely to lead the USD/JPY prices towards 105.960. Closing of 4-hour candle above this level has confirmed the chances of further buying in the pair until 108. Whereas, below 105.950, we may see further selling until 103.750. On the leading indicator’s front, the USD/JPY is in a bullish mode, and we should consider buying trades over 105. All the best for today!  

Categories
Crypto Market Analysis

Daily Crypto Review, Mar 17 – Bitcoin back up above $5,000 as bulls gather up

The cryptocurrency market managed to recover slightly from the fall it had yesterday. Bitcoin went above the $5,000 mark and regained some confidence. Bitcoin is currently trading for $5,297, which represents an increase of 2.83% on the day. Meanwhile, Ethereum gained 0.48% on the day, while XRP gained 1.02%.

WAX took the position of today’s most prominent daily gainer, with gains of 29.55%. On the other side, Komodo lost 13.25% on the day, making it the most prominent daily loser.

Bitcoin’s dominance increased by a slight margin over the past 24 hours. Its value is now 65.08%, which represents a 0.7% difference to the upside when compared to yesterday’s value.

The cryptocurrency market capitalization went up slightly, with a current value of $146.14 billion. This value represents an increase of $5.38 billion when compared to the value it had yesterday.

What happened in the past 24 hours

The fight against the Coronavirus pandemic is even present in the sphere of GPU mining, as the US chip manufacturer NVIDIA proposed for all users to use their computers to help the cause.

This initiative will accept donations of unused GPU computing power and then distribute it to an international processing power network. This will, in turn, be used to research COVID-19.

Honorable mention

Cardano

Earlier today, March 16, The Cardano Foundation made announced on its website that Z/Yen Group Limited (based in the UK) has initiated legal proceedings against the foundation.

Z/Yen Group Limited is a fintech company (think tank) as well as a former research partner of the Cardano Foundation.

_______________________________________________________________________

Technical analysis

_______________________________________________________________________

Bitcoin

After breaking $5,000 to the downside, Bitcoin bulls managed to gather and push its price back up. After struggling for a whole day, Bitcoin finally managed to break the $5,000 barrier and to reach consolidation above it. The largest cryptocurrency is now trading near the $5,250 area.


Bitcoin’s volume increased slightly during the breakout but quickly returned to normal. Its RSI level on the 4-hour chart is approaching the middle of the value range, currently being at around 44.

Key levels to the upside                    Key levels to the downside

1: $5,960                                           1: $5,000

2: $6,640                                           2: $4,300

3: $6,850                                            3: 3,100


Ethereum

Ethereum, unlike Bitcoin, did not move much in the past 24 hours. While it tried to replicate Bitcoin’s movements to the upside, the bull presence wasn’t strong enough to push the price above the $122.5 mark.


Ethereum’s volume is quite low, which is one of the main factors contributing to ETH not breaking the $122.5 resistance level. Its RSI level on the 4-hour chart is currently slightly above the oversold area.

Key levels to the upside                    Key levels to the downside

1: $122.5                                             1: $100

2: $128                                              2: $80 

3: $168                                           


Ripple

Our yesterday’s report said that XRP was in a better spot at that moment as it did not break any support levels during the price drop. This is true (but to the upside now) in today’s case as well. XRP gained some value as the bulls gathered up for a push, but the third-largest cryptocurrency did not break any significant levels (now to the upside).


XRP’s volume is quite low at the moment, while its RSI level on the 4-hour chart is currently 44.

Key levels to the upside                    Key levels to the downside

1: $0.165                                            1: $0.1

2: $0.19

3: $0.2                                              

Categories
Forex Psychology

The Road to Become a Pro: Preparation

I see a lot of people approaching the financial markets as a way to get a second income or even be financially independent. The major part of them wants to invest in the financial markets but don’t have the time or interest in mastering the needed skills to really succeed. 

A minority of them are involved in acquiring those skills but think that to be successful, only the knowledge to forecast the markets is needed, most of them focused on learning one or several technical analysis methods that would allow them to do it.

The cruel reality is that the randomness of the markets is high, and forecasting is not deterministic. Thus, operating in leveraged markets makes the task much more difficult if traders are not aware of the statistical parameters and size limitations of the system in question. Thus, psychology comes into play as traders get confused and unable to act as losses accumulate, greed, and fear driving the decision process instead of the rational mind.

The preparation tasks

Dr. Van K. Tharp states in his Peak Performance Course series that top traders need to master 15 different tasks or processes, twelve related to trading, two preparation tasks, plus “being out of the market” task. The two tasks related to preparation are: 

  • Developing Self-awareness and 
  • Developing a low-risk game plan

Self-Awareness

This task aims to recognize our strengths and flaws, so we can profit from the first ones and overcome the second ones. For instance, if you are good at recognizing breakouts, you could focus on that kind of pattern to create your trading strategy. Another trader might have difficulty with decision making but is good at programming. Thus he could use his skills to develop a mechanical system that makes decisions for him.

Goal Settings to solve the conflict

Dr. Tharp rightfully states that most traders are nor aware of what they want to accomplish. Of course, they want to get the max out of the markets, but that statement says nothing about the right way they should go. Most of the time they have conflictive goals, they want profits but also avoid losses, be safe at the same time they risk capital. Most of the time, unresolved conflict of both primary desires spells catastrophe. The right way to solve personal issues is through goal setting. In the case of profit/risk conflict, traders must set goals for the monthly profits and verify these are congruent with the expected risks (drawdowns), and match both to fit him. Goal setting is part of developing a system that suits you, but to know what suits you, you need to know yourself. It is important to list all your desires and expectations about you and the markets.

Are you a risk-taker or avoid risk? Do you want to work 100 percent of the time looking at monitor screens or just to enter a trade? Do you like to plan in advance, or are you an intuitive trader acting the moment you feel a move?  

Development of a Low-risk Plan

The key to succeeding in the financial markets is not good forecasting, but profiting from low-risk ideas. A lot of traders only focus their attention on entries and forget that the exit is when the profits are realized. Also, since most traders want to avoid losses, they think that a high percentage of winners is the critical element of a sound trading system. Thus these traders end up scalping small profits and holding their substantial losses. Instead, the key to success is the opposite. Traders must create a written plan with a primary element: low-risk trades.

A low-risk idea is one in which the reward is higher than its risk. The property of high reward-to-risk ratios is better shown with an example. Let’s call the risk R and the reward a multiple n of R. It is evident that in a series of n trades, just one needs to be profitable to break-even. Thus, if continually trading using 5:1 RR ideas, only one profitable trade, every five trades is enough to keep us afloat. Therefore, it is in the trader’s interest to chose low-risk trades as protection for a drop in the percentage of winning trades.

Consistency by following your rules

A written plan consisting of a set of rules is essential. You need written rules so you can, later, analyze results and make changes to the rule that needs to be improved. If there are no rules, it is impossible to improve them. 

For instance, let’s suppose there is a stop-loss rule that cut losses at 1.5 ATR(10). Maybe, after some time, you see that there is a substantial portion of trades that reverse after your stop is hit. If your system has such a rule, and you keep a record of your past trades, you could do an analysis and conclude that your system could be optimized by changing the 1.5ATR to 1.8ATR, but that 1.9ART or more harms you in the risk side with no substantial improvement in the number of winning trades. That kind of analysis, obviously, is impossible if your stop-loss strategy is decided on each trade depending on your subjective feelings

Making money demands consistency and discipline. Trading rules are essential to both. To respect the rules is the factor to consistency, and a disciplined mind is required to adhere to the rules. With no rules, trading is a set or random entries and exits with no possible statistical value for future analysis and improvement. In this context, a mistake means not a losing trade, but not following the rules.


Further reading: Peak Performance Course Book 1 – How to use Risk, Van K. Tharp chapter V

Categories
Forex Market Analysis

WTI Crude Oil Slips Beneath $29 as Coronavirus Outbreaks Further! 

Crude oil prices fell sharply to trade below $29 after showing a slight bullish recovery during the previous week. Crude oil prices benefited from President Trump’s saying that his government is to buy large quantities of crude oil for the Strategic Petroleum Reserve to take advantage of lower oil prices. Nymex crude oil futures rose 2.8% to $31.87 a barrel, and Brent rebounded 4.3% to $34.07.

Over the weekend, the global coronavirus pandemic worsened, particularly in Europe. Italy saw the number of coronavirus cases surge past 24,700 (1809 deaths), while Spain reported over 7,800 cases in total, Germany over 5,800 cases and France over 5,400 cases. In the U.S., the number of cases jumped to nearly 3,600 (68 deaths).

The RBA indicated that it would purchase bonds while holding a special meeting on Thursday. Whereas, RBNZ finally also joined the role of major central bankers that offered major rate cuts in order to control the coronavirus (COVID-19). 

China’s National Bureau of Statistics (NBS) said that China’s economy continues to stabilize despite the impact of coronavirus. The comments came after January-February month Retail Sales and Industrial Production disappointed markets. As in result, the risk-tone remains under pressure with the U.S. ten-year treasury yields decreased around 0.673% while stocks in Asia register mild losses due to pandemic fears.

Moving forward, traders will keep their eyes on central banker’s moves and announcements/surprises for near-term trade direction. On the other hand, coronavirus headlines will also be essential to watch.

Daily Support and Resistance

  • S1 26.84
  • S2 29.16
  • S3 30.25

Pivot Point 31.49

  • R1 32.57
  • R2 33.81
  • R3 36.13

On the technical front, crude oil has formed a bearish engulfing candle, which is strengthening the bearish bias among traders. On the lower side, the WTI prices may head further lower towards the support level of 27.33 level. Below this, the next support can be found around 23.95 level. Fundamentals are in favor of a selling trend, and but oil should break below 27.50 level before exhibiting further selling today. Let’s consider staying bearish below $31. Good luck!  

Categories
Forex Course

81. Learn To Trade Using The ‘RSI’ Indicator

Introduction

In our previous article, we have learned how to trade the markets using the Bollinger Bands. We hope you have used that indicator in a demo account and got a hang of it. Now, in this course lesson, let’s learn the identification of trading opportunities using a reliable indicator know as RSI.

RSI is one of the most famous indicators used in the Forex and the Stock market. It stands for the ‘Relative Strength Index’ and is developed by an American technical analyst – J. Welles Wilder. This momentum indicator measures the magnitude of the price change to identify the oversold and overbought market conditions.

The RSI indicator consists of a line graph that oscillates between zero and 100 levels. Traditionally, the market is considered overbought when the indicator goes above the 70-level. Likewise, the market is considered oversold when RSI goes below the 30-level. These traditional levels can be adjusted according to different market situations. But if you are a novice trader, it is advisable to go with the default setting of the RSI.

When the market is in an overbought condition, it indicates a sell signal in the currency pair. Likewise, if the market is in an oversold condition, we can expect a reversal to the buy-side. To confirm the buy and sell signals generated by the oversold and overbought market conditions, it is advisable to also look for centerline crossovers.

When the RSI line goes above the 50-level, it means that the strength of the uptrend is increasing, and it is safe to hold our positions up to the 70-level. When the centerline goes below the 50-level, it indicates the weakening in strength and any open sell position until the 30-level is good to hold.

RSI is one of those indicators which is not overlapped with the price action. It stays below the price charts. Below we can see the snippet of how the RSI would look on the charts. The highlighted light purple region marks the 70 and 30 levels, and the moving line in the middle is the RSI line.

How To Trade Using The RSI Indicator

There are various ways to use the RSI indicator to generate consistent signals from the market. You can use this indicator stand-alone, or you can pair it with other indicators and with candlestick patterns for additional confirmation. In this article, let’s learn the traditional way of using the RSI indicator along with RSI divergence and RSI trendline breakout strategies.

Traditional Overbought/Oversold Strategy

In the traditional way, we just hit the Buy when the RSI indicator gives sharp reversal at the oversold area. Contrarily, we go short when the RSI indicator reverses at the overbought area. The image below represents the Buy and Sell trade in the AUD/CAD Forex pair. We must close our positions when the market triggers the opposite signal. Stop-loss can be placed just below the close of the recent candle.

RSI Divergence Strategy

Divergence is when the price action moves into one direction, and the indicator moves in another direction. It essentially means that the indicator does not agree with the price move, and soon a reversal is expected. In other words, RSI divergence is known as a trend reversal indication.

In the below image, price action prints the RSI divergence twice, and both times the market reversed to the opposite side. When the market gives us a reversal, find any candlestick pattern or any reliable indicator to confirm the trading signal generated.

In the below image, we have identified the market divergence twice, and both the times the market reversed. If traded correctly, this strategy will result in high profitable trades.

Trendline Breakout Strategy

RSI trend line breaks out is a quite popular strategy as it is used by most of the professional traders. In the image below, when price action and the RSI indicator breaks the trend line, we can see the market blasting to the north.

Always remember to strictly go long in an uptrend, and go short in a downtrend while using this strategy. Buying must be done when the market is in an overbought condition, and the selling must be done when the market is in an oversold condition.

If you want to confirm the entry, wait for the price action to hold above the breakout line to know that the breakout is valid. Exit your positions when the RSI reaches the opposite market condition.

That’s about RSI and trading strategies using this indicator. Try using this indicator on a demo account today and experiment with the above-given strategies. Let us know if you have any questions in the comments below. Cheers!

[wp_quiz id=”66690″]
Categories
Forex Assets

Exploring The EUR/THB Exotic Currency Pair

Introduction

EUR/THB is the abbreviation for the Euro area’s euro against the Thai Baht. This pair is classified as an exotic currency pair. In this pair, EUR is the base currency, and THB is the quote currency.

Understanding EUR/THB

The market value of this pair represents the value of THB equivalent to one EUR. It is quoted as 1 EUR per X THB. For example, if the current market price of this pair is 35.345, these many units of THB are required to purchase one euro.

EUR/THB Specification

Spread

The algebraic difference between the bid and the ask price is referred to as the spread. Spread is determined by the brokers and varies based on the execution model they use.

Spread on ECN: 25 pips | Spread on STP: 28 pips

Fee

The fee is simply the commission paid on the trade. However, this fee is levied only on ECN accounts, not STP accounts.

Slippage

When you execute orders by market, the price you receive from the broker is different from the price you trigger your order. This happens solely due to the changes in the market volatility and the speed with which brokers execute the trades.

Trading Range in EUR/THB

The trading range is the representation of the range of pip movement in a currency pair. These pip values help in assessing the profit/loss in a trade, even before opening positions. In the below table, we have included six timeframes, ranging from 1H to 1M.

Procedure to assess Pip Ranges

  1. Add the ATR indicator to your chart
  2. Set the period to 1
  3. Add a 200-period SMA to this indicator
  4. Shrink the chart so you can assess a large time period
  5. Select your desired timeframe
  6. Measure the floor level and set this value as the min
  7. Measure the level of the 200-period SMA and set this as the average
  8. Measure the peak levels and set this as Max.

EUR/THB Cost as a Percent of the Trading Range

The cost as a percent of the trading range is the representation of the cost variation in the trade. The cost varies based on the volatility of the market. Having an idea of the cost variation, we can find our ideal times of day to trade in the market with reduced costs.

ECN Model Account

Spread = 25 | Slippage = 3 | Trading fee = 3

Total cost = Spread + Slippage + Trading Fee = 25 + 3 + 3 = 31

STP Model Account

Spread = 28 | Slippage = 3 | Trading fee = 0

Total cost = Spread + Slippage + Trading Fee = 28 + 3 + 0 = 31

The Ideal way to trade the EUR/THB

Before getting right into it, let’s comprehend the above tables. To analyze the tables, we consider the magnitude of the percentages. The higher the percentages, the higher is the cost of the trade. Conversely, lower percentages imply lower costs.

The costs in the min column are higher compared to the max column. This means that the costs are high when the volatility of the market is low, and the converse holds true as well.

The ideal way to trade this pair is completely dependent on the type of trader you are. For instance, if you are a trader looking for low costs, then you may trade when the volatility is high. Since the majority of the traders need a balance between the two, they may trade when the volatility of the market is somewhere around the average values in the trading range table.

Another simple technique to reduce costs is implementing strategies such that orders are executed using limit orders instead of market orders. In doing so, the slippage will be completely eradicated, and the total costs will be reduced by a decent number.

Categories
Forex Elliott Wave

Intermediate Wave Analysis – Impulsive Waves – Part 3

Impulsive waves are characterized by their directionality; thus creating trends; however, how the wave analyst can recognize the stage of the trend? To answer this question, we will present the canalization process.

Canalization

Until now, we presented a set of rules that allow that wave analyst to identify which kind of structure the price action is creating. However, these rules do not provide any clue about its target area.

To aid in solving this question, R.N. Elliott, in his Treatise, introduced the use of channels to identify the potential target zone of the next path.

Channels are a useful tool to recognize if an impulsive sequence is complete, and to identify the potential ending points of waves in progress.

In motive waves, there exist two kinds of base-line of channels; these are base-line 0-2 and 2-4. The way to trace them is as exposes the following figure.

In the left-side figure, we observe the trace of the 0-2 line. The dotted line represents a preliminary 0-2 line that was violated by the price action. In this case, the wave analyst must update the base-line 0-2 until the confirmed end of wave 2.

Once the ending of the second wave and traced the base-line is validated, the wave analyst must project a line parallel to the 0-2  line at the end of wave 1, this channel will provide a potential target of the third wave.

Analogously, on the right-side figure, we distinguish the trace of base-line 2-4 and its projection at the end of wave 3. The channel projection will provide the potential end of the fifth wave.

The procedure for executing the canalization process is as described below.

Once the price has created the first impulse wave and, then, completed the second corrective wave, a base-line is projected linking the origin of the first impulse wave to the end of the second wave.

The base-line is then projected at the end of wave 1. This channel will provide the wave analyst with the potential target of wave 3.

When wave 3 is complete, the ends of wave 1 and 3 are joined, then a parallel line is projected towards the end of wave 2.

The projection of this channel will provide information about the possible end of wave 4.

Subsequently, once wave 4 is complete, the ends of waves 2 and 4 are joined, then the line parallel to the end of wave 3 is projected, this channel will provide the potential target of wave 5.

EURNZD – Channels Suggests a Five-Wave Sequence Completion

The following chart illustrates to EURNZD cross in its 4-hour timeframe. From the figure, we observe the rally developed by price action that began on January 24th, low at level 1.66642.

EURNZD made a first rally that boosted the price in five waves until 1.71764 level reached on last February 02nd. Once its first upward sequence has been completed, the price retraced in three waves.

The corrective process brought the price to find fresh buyers at 1.67854 on February 10th. The completion of waves (i) and (ii) allow us to trace the first channel in blue, from where the next path corresponds to wave (iii).

On the figure, we observe that the price extended its third upward sequence until 1.78755 level on March 02nd. Once this fresh higher high was reached, EURNZD started to consolidate in a fourth wave. The ending of this corrective structure drives us to trace the second upward channel in brown.

The upper-line breakout of the second ascending channel carried the EURNZD cross to complete its fifth wave that found resistance at 1.90725 level, reached on March 09th.

Once it peaked at 1.90725 level, the price action pierced the base-line of the second ascending channel, this movement could drive the cross to start a corrective sequence in the coming trading sessions.

Conclusions

In this article, we have seen how the use of channels can assist the wave analyst in the process of identifying impulse wave targets.

From the example exposed, we observed how the canalization process worked in the real market. It is essential to consider that the fifth wave can fail, and not surpass the upper-line of the ascending channel.

In this context, the wave analyst should consider the signals that can reflect the end of the five-wave sequence, for example, the base-line breakdown.

Suggested Readings

  • Neely, G.; Mastering Elliott Wave: Presenting the Neely Method; Windsor Books; 2nd Edition (1990).
  • Prechter, R.; The Major Works of R. N. Elliott; New Classics Library; 2nd Edition (1990).
Categories
Crypto Videos

The Fear & Greed Index Indicator! The Best Way To Identify Crypto Market Reversals?

Trade cryptocurrencies using Fear and Greed Index – part 1/2


It’s a well-known fact that emotions move markets. Greed drives prices up, while fear drives them down. Human psychology always ends up being predictably irrational because a lot of people tend to react very similarly in certain situations.

If people behave almost the same way in certain situations, it is possible to make money trading by just being a contrarian. As an example, Baron Rothschild made his fortune by buying when others panic-sold. His philosophy was relying on “Buying when there’s blood in the streets.”
John Templeton once said to “Invest at the point of maximum pessimism.”
This rings true simply because – the greater the fear — the larger the opportunity for profit.

The Fear and Greed Index

If we conclude that a trader can be profitable by acting contrary to how others are acting, then it is important to pinpoint moments of fear as well as moments of greed.

This strategy is quite simple:
If others are greedy – be fearful.
If others are fearful – be greedy.
One well-known tool that measures cryptocurrency market sentiment is the Fear and Greed Index.

The Fear and Greed Index measures cryptocurrency market sentiment by aggregating data from various sources and generating them into one number, which is on a scale of 0 to 100. A value of 0 is known as “Extreme Fear,” while the opposite (a value of 100) represents “Extreme Greed.”

The data that the index uses is compiled daily. You can also glean the data of the Fear and Greed Index on a daily, weekly, monthly, as well as yearly basis.


Tendencies that show in the Fear & Greed Index

Extreme fear is a place where the first signs of greed are created. As we can see from the graph above, fear can quickly spiral out of control. However, every time the Fear and Greed Index is close to or below the 10 mark, the value of the index quickly reverses to the upside.
This brings us to the conclusion that every time high levels of fear dwells in the minds of traders and investors, opportunists use this market climate to their advantage. Following the ways of savvy investors such as Warren Buffet, Baron Rothschild, or John Templeton, these “bargain hunters” get greedy when others were fearful.
However, just like fear can quickly gain momentum, so can greed. And since emotions move markets, extreme fear drives prices down, while greed drives them up.

Check out part 2 of our Fear and Greed Index guide to learn more about how to use this tool to predict market movement.

Categories
Forex Videos

Forex Hedging Using The Elliot Wave Setup – How To Win Trades Whatever The Outcome!

Hedging using the Elliot Wave setup

Continuing with our hedging strategy series. Today we are going to look at setting up two trades. One Which involves using the Elliott wave Theory of technical analysis, and should this prove ineffective, we will also be setting up a secondary hedging, or insurance based trade, in the event that our first trade does not go according to technical analysis.

While hedging comes in many forms and strategies, the methodology behind this type of hedging is that we want to carefully set up a trade based on tried-and-tested technical analysis, and where, in this particular case, price action may be set for a sharp reversal, but turns unexpectedly, in which case we will be able to catch the move in the opposite direction. In which case theoretically we win no matter which way price moves. Therefore this strategy works best when markets have consolidated or reached highs or lows, which seem right for reversal or continuation in price action but where the consolidation squeeze should cause a burst in volume in either direction.

Example A


Example A, Let’s quickly remind ourselves of the theory of the Elliott Wave, which consists of an impulse wave that is usually composed of 5 sub-waves that move in the same direction followed by a corrective wave composed of three subways that move against the previous trend.

Example B


Example B, Here we can see the Elliot wave in action. After a consolidation period, we can see the Elliott wave as denoted by 1 2 3 4 5 6 pattern, with higher highs and higher lows and where we would expect price action to begin to fade with our three-part full pull back as denoted by the A B C technical pattern we have drawn as an estimation onto our chart.
Therefore, if the Elliot Wave theory holds true in this case at position A, we would see a decent in price action in line with our A B C expectation, and if not, we would expect a price action continuation up to position 7 in continuation of the original upward trend.

Example D


Example D, This is the first part of our hedging strategy in which case we are going to go shorts at position A, which represents her 50% pullback between position 6 and 5, and at which point should be the beginning of the three-wave counter move in the opposite direction of the trend upwards should the Elliott wave Theory hold at this point we will capture some decent down movement, especially if this setup is used on a 15 in 30 or 60 minutes chart.
We must set our stop loss at a couple of pips above position 5, which would mean that the Elliott wave theory has not held out on this occasion, and that price could be set in a continuation upwards of the original trend. However, should position 5 on your chart be a round number and what is also called a big figure number such as 1.3400 which you might see in the USDCAD pair, or 1.300 in the EURUSD pair at the time of writing, then price action might find this as a level of resistance and fall anyway. But as the theory would be negated, we would suggest you consider this and think about exiting the trade and waiting for another Elliot Wave set up. In either case, stop losses should not be more than 20-30 pips.

Example E


Example E is our hedging strategy. In the events that the Elliott wave fails and price action continuous, we must set a buy limit order a couple of pips above the previous trade’s stop loss in order to capture the move from position 6 to position 7 and beyond. If possible, we should monitor this move closely, because as an insurance policy, we need to at the very least make the same amount of pips.i.e. 20 to 30 that we lost in the first trade.

Categories
Forex Market Analysis

Daily F.X. Analysis, March 16 – Top Trade Setups In Forex – G7 Meetings In Highlights! 

During Asian trading hours on Monday, the ICE U.S. Dollar Index dropped 1.1% to 97.67, giving up most of its gains made in the prior session, as the Fed slashed interest rates over the weekend. The U.K. house price grew 1.0% on month in March (+0.8% in February), according to the home-listing website Rightmove.

In the U.S., the New York Federal Reserve will publish March Empire Manufacturing Index (4.9 expected).

Economic Events to Watch Today    


EUR/USD – Daily Analysis

On Monday, the European Union finance ministers plan to agree on an economic acknowledgment to the coronavirus pandemic, with the European Commission forecasting the consequences of the virus could drive the European Union into a recession.

The central bank kept rates unchanged on Thursday and raised its asset purchase program by EUR120B. They introduced a new program of cheap loans that would necessarily pay banks up to 0.75% to give to small businesses. However, the EUR traders were not impressed, as indicated by the long-tail (seller exhaustion) attached to Thursday’s candle. 

Whereas, the broad market recession fears continue to increase the progress into the U.S. bonds, which translates into lower returns on the bonds, ultimately keep the greenback under pressure. The U.S. dollar index trades around 98.25, down 0.50% on the day, having stopped its recovery just shy of 98.50. 

Looking forward, the markets now keep their eyes on the European Union (E.U.) Finance Ministers’ and G7 leaders’ economic response to the virus outbreak, which is due later on Monday for taking fresh near-term trading opportunities in the main currency pair. 


Daily Support and Resistance

  • S1 1.0654
  • S2 1.0918
  • S3 1.1045

Pivot Point 1.1182

  • R1 1.1309
  • R2 1.1447
  • R3 1.1711

EUR/USD– Trading Tips

The EUR/USD has traded mostly lower, bouncing off the double bottom support level of 1.1095 level. The EUR/USD is currently trading around 1.1165, and it’s forming a lower-lows pattern on the 4-hour chart, which mostly drives a continuation of a selling trend. On the lower side, a continuation of a bearish bias can extend sell-off until 1.1100 and 1.1095. While the bullish breakout of 1.1350 can drive more buying until 1.1454 area. Consider staying bullish over 1.1182 and bearish below the same level today. 


GBP/USD– Daily Analysis

The GBP/USD dropped to 1.2321. Over the weekend, the global coronavirus pandemic worsened, particularly in Europe. Italy saw the number of coronavirus cases surge past 24,700 (1809 deaths), while Spain reported over 7,800 cases in total, Germany over 5,800 cases and France over 5,400 cases. In the U.S., the number of cases jumped to nearly 3,600 (68 deaths).

On Sunday, U.S. Federal Reserve slashed interest rates to near zero percent while announcing plans to purchase 700 billion dollars in bonds and securities to stabilize financial markets and support the economy. 

It is worth mentioning that the global markets remain sluggish despite the Fed, and the RBNZ announced an unscheduled rate cut while the BOJ is in the pipeline. As in result, the risk-tone remains on the back foot with the U.S. treasury yields falling almost 30 basis points while markets in Asia also flash losses by the press time.

Looking forward, the coronavirus headlines and the central bank updates will be the key to watch for near-term direction, while the traders will keep their eyes on the EU-UK disputes regarding Brexit.

On Monday open, U.S. stock futures dropped nearly 5% to their daily limit.

U.K. house price grew 1.0% on month in March (+0.8% in February), according to the home-listing website Rightmove.

Daily Support and Resistance

  • S1 1.1957
  • S2 1.2295
  • S3 1.2436

Pivot Point 1.2633

  • R1 1.2774
  • R2 1.297
  • R3 1.3308

GBP/USD– Trading Tip

The GBP/USD fell sharply to trade around 1.2360 level and has closed a bullish candle followed by strong selling candles. The Cable has immediate support around 1.2270 level, and above this, the Cable can extend the continuation of a bullish bias until 1.2450 level and 1.2625.  

The MACD is consistently forming bearish histograms below zero, supporting the selling trend in the GBP/USD pair, which is why we should consider selling below 1.2633 today. Recently, the GBP/USD has closed a bullish candle that can drive buying in the GBP/USD, and it may lead its prices higher towards 1.2685 level. 


USD/JPY – Daily Analysis

Today in the Asian session, the USD/JPY currency pair flashing red and trading below the 107.00, representing 1.40% losses on the day after the Bank of Japan avoided delivering the rate cut ahead of the European open on Monday.

During its emergency 1-day monetary policy meeting, the Bank of Japan (BOJ) board members decided to keep rates unchanged at -10bps whereas maintaining a10-yr JGB yield target at 0.00%. Although, the decision on maintaining its interest rate targets was made by a 7-2 vote with board members Goushi Kataoka and Yutaka Harada dissenting.

At the BOJ front, the BoJ Interest Rate Decision is announced by the Bank of Japan. Usually, if the BoJ raises the interest rates, it is positive, or bullish, for the JPY. Likewise, if the BoJ has a dovish view on the Japanese economy and cuts the interest rate, it is considered negative or bearish.

On the other hand, the U.S. Federal Reserve (Fed) announced a surprise rate cut to 0.25% in addition to $700 billion worth of Quantitative Easing. As well as, the Fed policymakers signaled that there would not be any Federal Open Market Committee (FOMC) during this week, which was earlier scheduled for Wednesday.

Whereas, the RBA indicated that it would purchase bonds while holding a special meeting on Thursday, whereas RBNZ finally also joined the role of major central bankers that offered significant rate cuts in order to control the coronavirus (COVID-19). 


Daily Support and Resistance

  • S1 99.26
  • S2 102
  • S3 103.37

Pivot Point 104.74

  • R1 106.11
  • R2 107.47
  • R3 110.21

USD/JPY – Trading Tips

The USD/JPY is trading at 107.800 and has already completed a 61.8% Fibonacci retracement level at 108.065. Below this, the USD/JPY is exhibiting a correction which is likely to lead the USD/JPY prices towards 105.960. Closing of 4-hour candle above this level has confirmed the chances of further buying in the pair until 108. Whereas, below 105.950, we may see further selling until 103.750. On the leading indicator’s front, the USD/JPY is in a bullish mode, and we should consider buying trades over 105. All the best for today!  

Categories
Crypto Market Analysis

Daily Crypto Review, Mar 16 – Bitcoin under $5,000, how far down can we go?

The cryptocurrency market had yet another meltdown of epic proportions today. Bitcoin fell under $5,000 while most altcoins witnessed a price decrease that even goes into double digits on the daily. Bitcoin is currently trading for $4,847, which represents a staggering 7.93% decrease on the day. Meanwhile, Ethereum lost 11.82% on the day, while XRP lost 7.65%.

Dragon Coins took the position of today’s most prominent daily gainer, with gains of 117.84%. On the other side, Ren lost 27.37% on the day, making it the most prominent daily loser.

Bitcoin’s dominance decreased greatly over the weekend after falling over 5% in just one day. Its value is now 64.38%, which represents a 4.98% difference to the upside when compared to Friday’s value.

The cryptocurrency market capitalization went down significantly yet again, with a current value of $140.72 billion. This value represents a decrease of $12.8 billion when compared to the value it had on Friday.

What happened in the past 24 hours

Coinbase, which is one of the biggest US exchanges, recently revealed a new feature on its platform called Bitcoin batching. This feature is designed to save users money on transaction fees.

This move was taken by Coinbase in order to improve the customer experience, as it will allow single on-chain crypto transactions to be bundled into one.

Honorable mention

Tezos (XTZ)

A digital asset marketplace Binance.US will list Tezos’s XTZ token on March 16th. According to the announcement on Binance’s website, XTZ/USD, as well as XTZ/BUSD trading pairs, will be available to traders on Monday, March 16th.

_______________________________________________________________________

Technical analysis

_______________________________________________________________________

Bitcoin

After a pretty stable weekend of trading just above $5,000, Bitcoin’s price experienced some turbulence. At first, it seemed that the bulls have taken the lead and Bitcoin started moving up. However, the move slowed down as Bitcoin aproached $6,000. This newfound resistance got confirmed as Bitcoin’s price bounced back to $5,300, and then began falling even further. The largest cryptocurrency managed to go under the major support level of $5,000, which is a major psychological point. If the price continues going down this way, we can expect a major pinpoint to be the low of $3,100.


Bitcoin’s volume is average, except during the times of the price increases or decreases when it goes up. Its RSI level is currently in the oversold territory on the 4-hour chart.

Key levels to the upside                    Key levels to the downside

1: $5,000                                           1: $4,300

2: $5,960                                           2: $3,100

3: $6,640                                            


Ethereum

Ethereum shared a similar faith to Bitcoin. The second-largest cryptocurrency went above the $128 resistance level, but the bullish move quickly got shut down as bears took over. Ethereum then fell under the $128 and $122.5 support levels and is now trading just under $110.


Ethereum’s volume is quite low, while its RSI is in the oversold area on the 4-hour chart.

Key levels to the upside                    Key levels to the downside

1: $122.5                                             1: $100

2: $128                                              2: $80 

3: $168                                           


Ripple

Even though XRP almost mirrored the move that Ethereum made as far as price movement goes, it is in a much better spot at the moment. The third-largest cryptocurrency tried moving up but got stopped at the $0.165 resistance level. Right after that, the price started falling, and XRP reached the price of around $0.135. However, the price is slowly recovering, and the move to the downside didn’t break and support levels.


XRP’s volume is low, while its RSI level just went out of the oversold area on the 4-hour chart.

Key levels to the upside                    Key levels to the downside

1: $0.165                                            1: $0.1

2: $0.19

3: $0.2                                              

Categories
Forex Videos

Forex Limit Order Hedging Strategy – Making Cash Hand Over Pip


Limit Order Hedging strategy

This video continues in the series showing you how you can make money by using hedging strategies to take advantage of breakouts and reversals in the market, no matter what direction. And while there are many different styles of hedging strategies, in this series, we are focussing on a simple way to maximize opportunities while increasing the chance of profitability, no matter which way the market moves and if used correctly, you will be able to utilize this in your own methodology.
While the following is risky – just like all trading, we will show you how to keep setups tight, while implementing clear and precise technical analysis that professional traders use every day in the Forex market. This strategy consists of two parts, the initial trade, and a backup trade. We have eyed an opportunity with multi-month lows for the EURCHF pair.

Example A

Example A is a monthly chart of the EURCHF pair, and we can see that the Euro is falling heavily against the Swiss franc. This is due to the flight to safety, whereby the Swiss franc is seen as a safe-haven currency during the Coronavirus pandemic.

However, the Swiss National Bank will be very unhappy about their currency being so strong and are threatening to intervene in the money markets to correct this. We can also see from this chart that we are approaching lows that have not been visited for five years. Therefore with the threat looming of the Swiss National Bank intervention, and previous reversals from these levels, we can hypothesize that although the continuing risks of the virus are still prevalent, there could be an argument for imminent price action reversal, particularly because of the current strength of the Euro and where the EURUSD is currently riding high around the 1.13 level.

Example B


Let’s take another look at this chart as in example B. While we may see some further downside in the EURCHF pair, our particular area of focus will be on the key 1.03 level. Previously price action found support at this level for several months. We are going to look at putting in a buy limit at the 1.03 level, with a tight stop loss, which, if triggered, we will also implement an immediate sell limit order to target the 1.00 key psychological trading level, which is parity.

Example C


Example C is a one-hour chart of the EURCHF pair, and our setup for the first part of this trade. We have placed a buy limit at the key 1.03 level with a tight stop loss at the 1.0270 level and a profit target of the current trading range around the 1.0550 level.

Example D


Example D, Now let’s look at our backup or insurance trade in the event that price continues to fall in the pair. We want to to set up a sell limit order at the 1.0270 level which is our previous stop-loss, and this time we need a slightly wider stop loss on this new trade at 1.0310, in case the key 1.03 level is initially targeted from our entry, and where we believe it might possibly become an area of resistance before price action reverses again and where will be looking at a target of 1.000 or parity in the pair.
On the second trade, we should be looking to implement a protective profit stop at around 1.0240 level in order to, at the very least, cover the loss from our first trade.

Categories
Forex Course

80. Indicator Based Trading – Bollinger Bands

Introduction

In the previous course lessons, we understood the importance, types, and various pros and cons involved in indicator-based trading. From this lesson, let’s start learning some of the most widely used indicators in the market. We will be starting with Bollinger Bands, which is arguably considered as one of the most widely used indicators in the Forex Market.

What are the Bollinger Bands?

They are a technical analysis indicator, which was developed by one of the famous technical trader John Bollinger in the 1980s. This indicator consists of three lines, which are simple moving average (the middle band), an upper and a lower band. In a volatile market, the bands of the indicator expand, and it contracts in tight market conditions.

Most of the traders think that the Bollinger bands indicator is similar to the moving average envelope, but it’s not true, because the calculations of both of the indicators are different. For plotting the upper and lower bands of the Bollinger Bands indicator, the standard deviation is considered. On the other hand, for moving average envelopes, the lines are calculated by taking a fixed percentage.

Bollinger Bands Indicator Plotted on a Forex Price chart

Using The Bollinger Bands Indicator To Take Trades

Most of the market experts and chartists believe that when the price action continuously touches the upper band, it means that the market is in an overbought condition, triggering a sell signal. Conversely, the closer the price action moves towards, the lower band, the more oversold the market is, triggering a buy signal.

This is the most common way to trade the markets using the Bollinger Bands. As much as this is true, we don’t suggest to use this approach to trade the markets where traders just blindly follow this one single rule. As we all know that the trend is our friend, we must first figure out the trend. Then it is advisable to trade only buy opportunities in an uptrend and sell opportunities in a downtrend. This is one of the most reliable ways to identify the trades on any trading timeframe.

The below image represents the buying opportunities on the EUR/CAD 5 min Forex chart. As we can see, the market was in a strong uptrend. We have identified four buying opportunities in just a couple of hours. The chart clearly represents how many times the price action touched the upper band and didn’t drop instantly. This is the reason why most of the professionals use this indicator to trade the market.

Trading Ranges Using The Bollinger Bands

One more crucial applications of the Bollinger Bands indicator is while trading ranges. This is because the bands of the indicator act like dynamic support and resistance levels to the price action. Higher the timeframe we use to trade the ranges, stronger are the bands will be. That is, price relatively respects these brands than the bands in the lower time frames. Many successful traders ace the market by using this strategy alone.

As we can see in the below chart, the market generated three buying and two selling opportunities when the market is ranging. Do not place the buy or sell orders blindly when prices reach the upper or lower level of the consolidation phase. Instead, wait for the prices to hold there for a couple of candles to activate your trades. In the below image, we have activated our trades only when we saw the confirmation candles. In this way, we can filter out whipsaws and false trading signals.

Conclusion

This lesson is an attempt to give you a basic idea of the working of this indicator. There are many more aspects to this, and you will be learning them once you start exploring Bollinger Bands on the price charts. You can refer to this and this articles to get advanced trading strategies using this indicator. Bollinger Bands can also be combined with technical tools like chart patterns and other reliable indicators to generate more accurate trading signals. One such example can be found here. Cheers!

[wp_quiz id=”66529″]
Categories
Forex Assets

Everything You Should Know About The EUR/SEK Forex Pair

Introduction

EUR/SEK is the abbreviation for the Euro Area’s euro against the Swedish Krona. This exotic-cross currency pair has enough volatility but lacks liquidity. This is the reason this has pretty high spreads. In this pair, EUR is the base currency, and SEK is the quote currency.

Understanding EUR/SEK

The market price of EURSEK as a whole determines the value of SEK that is required to buy one euro. It is quoted as 1 EUR per X SEK. For example, if the value of this pair is 10.5839, then this amount of SEK is required to purchase one EUR.

EUR/SEK Specification

Spread

The difference between the bid price and the ask price is called the spread. This value is different from one ECN and STP accounts. The approximate values of the same are mentioned below.

Spread on ECN: 50 pips | Spread on STP: 55 pips

Fees

The fee is simply the commission paid for the trade. This, too, depends on the type of execution model used by the broker. The fee on ECN accounts is a few pips, while it is nil on STP accounts.

Slippage

The slippage is the difference between the trader’s intended price and the broker’s executed price. There is this difference because orders are executed by the ‘market.’ The two main reasons for slippage to occur include, broker’s execution speed & Market volatility.

Trading Range in EUR/SEK

With the values in the trading range, which depict the pip movement in different timeframes, we can determine the gain or loss that is possible on trade.

These values are obtained by combining the moving average with the average true range indicator. A complete procedure to get it into your charts is given below.

Procedure to assess Pip Ranges

  1. Add the ATR indicator to your chart
  2. Set the period to 1
  3. Add a 200-period SMA to this indicator
  4. Shrink the chart so you can assess a large time period
  5. Select your desired timeframe
  6. Measure the floor level and set this value as the min
  7. Measure the level of the 200-period SMA and set this as the average
  8. Measure the peak levels and set this as Max.

EUR/SEK Cost as a Percent of the Trading Range

Firstly, the total cost is calculated by finding the sum of the spread, slippage, and trading fee. And this cost varies as the volatility of the market changes. Below is a table that represents the cost variation for EURSEK for both ECN and STP accounts.

ECN Model Account 

Spread = 50 | Slippage = 3 | Trading fee = 3

Total cost = Spread + Slippage + Trading Fee = 50 + 3 + 3 = 56

STP Model Account

Spread = 55 | Slippage = 3 | Trading fee = 0

Total cost = Spread + Slippage + Trading Fee = 55 + 3 + 0 = 58

Note: The costs may seem high because of the Spreads. As we know, these Spreads keep changing from time to time. At times we have seen the spreads for this pair being as low as 10. But we have considered the maximum spread to give you the maximum cost percentages.

The Ideal way to trade the EUR/SEK

From the trading range table, we can clearly see that the volatility in this pair is pretty high. However, this does not mean that it cannot be traded.

Coming to the next two tables, the percentage values are within the 600% mark. Note that the higher the value of the percentages, the higher is the cost. The opposite holds true, as well. Since the percentage values are high in the min column, we can conclude that the costs are high when the volatility of the market is low.

Now, to have a balance between the costs and the volatility, one must trade during those times when the volatility of the market is around the average values in the trading range table.

Moreover, there is a way through which we can nullify the slippage on the trade. This can simply be done by placing orders using ‘limit’ instead of ‘market.’ In doing so, the total cost will reduce by a decent amount.

Categories
Forex Daily Topic Forex Price-Action Strategies

Price Action Trading: Entries to Take and Entries to Skip

In today’s price action trading lesson, we are going to demonstrate an example of a chart that offers multiple entries. We try to spot out entry/entries that we may skip and the entry/entries we may take. We try to find out the reasons behind that as well. Let us get started.

The price after being bullish for a long time produces a bearish reversal candle and heads towards the South. Look at the last candle. It comes out as a bullish inside bar. Price action traders start eyeing on such a chart to go short. However, the sellers would love to see the price have deeper consolidation.

The chart does not make a deep consolidation. It produces a bearish engulfing candle closing well below consolidation support. The trend and the reversal candle get 10 on 10, but the consolidation is not deep enough. It is not an A+ entry. It is best if we restrain ourselves from taking such entry. Let us proceed to the next chart.

Many of us may think an opportunity missed. Here is one added lesson on ‘ do not cry over spilled milk.’ Forex traders must obey this. Let us concentrate on the chart again. The last candle comes out as a very strong bearish candle. The pair may offer more short entries.

The chart produces a bullish inside bar again. The equation is simple for the sellers based on price action. The chart is to produce a bearish engulfing candle closing well below consolidation support. Let us proceed to the next chart.

Here it comes. This is one good-looking bearish engulfing candle closing well below consolidation support. The trend, consolidation length, and the bearish reversal candle all get 10 on 10. As far as price action breakout trading strategy is concerned, this is an A+ entry. Let us now find out how the entry goes.

It does not go according to our expectations. It rather produces a bullish inside bar again. It is an inside bar. Thus the sellers still hold the key here. The fact remains at the first consolidation, despite having shallow consolidation, the price heads towards the South with extreme bearish momentum. On the contrary, despite being an A+ entry, the price does not move according to the sellers’ expectations. It may even go towards the North and hits the stop loss. Then again, we must stick with our trading rules and be extremely disciplined. Let us proceed to the next chart to find out what happens next.

Ah! What a move this is! The sellers make some green pips here. The chart makes them wait, but it pays them back. As mentioned, it could go another way. That does not mean we start thinking to change our strategies or start taking random entries. We must make sure we only take entries that get A+ after considering all the segments.

Categories
Forex Market Analysis

WTI Crude Oil Prices Rose To $32.35 – Emergency Cash Injection U.S. Fed Hikes! 

The WTI crude oil prices flashing green and recovered to $32.35, mainly after the emergency liquidity injected from the United States Fedra Reserve. The fresh geopolitical tension from Iraq supporting the energy prices. Moreover, the reason behind the oil price recovery could also be the surprise infusion of liquidity from the Bank Of Japan. The U.S. Crude Oil WTI Futures traded 2.7% higher to $32.35. 

The WTI Crude Oil prices recovered today after the Federal Reserve moved to provide $1.5 trillion in short-term liquidity and changed durations of Treasuries it buys.

Despite today’s recoveries, crude oil markets fell almost 30% this week after Saudi Arabia and Russia prices war and decided not to cut production further and instead sell at lower prices, raising fears of a price war. 

Meanwhile, the U.S. decision to ban travel from some European countries as President Donald Trump’s main tactic to control COVID-19 also disappointed the investor’s sentiment.

Traders are expecting that the talks between U.S. President Donald Trump and Saudi Prince may help to stop the fall in crude prices while, on the other hand, Russia’s willingness to attend the OPEC+ meeting on March 18 adds smiles on the face of the oil trades.

Looking forward, qualitative catalysts could keep the driver’s seat, whereas the weekly release of the Baker Hughes US Oil Rig Counts, prior 682, will entertain the traders.

Daily Support and Resistance

  • S1 26.84
  • S2 29.16
  • S3 30.25

Pivot Point 31.49

  • R1 32.57
  • R2 33.81
  • R3 36.13

Technically, crude oil is trading at $32.36 per barrel, mostly maintaining sideways trading range of 34.40 – 27.33. At the moment, 34.35 resistance is very, very crucial for crude oil as the MACD is in the buying zone, and traders need a reason to go long on crude oil. Breakout of 34.35/40 can be that reason which may attract some buying in crude oil and may lead its prices towards 38. Let’s look to stay bearish below 34 as below this; crude can head to target the next support level of 31.50. Good luck! 

Categories
Forex Videos

Master Forex – Hedging Strategy Using Buy & Sell Limit Orders

Hedging strategy using buy and sell limit orders

This video is a follow on from Hedging – Making money no matter which way the market moves and Hedging Strategy Via The Ascending Pennant Chart Pattern.

The idea in this series is to incorporate a secondary backup, or insurance policy type trade, in order to maximize the possibilities of breakouts from well-known, tried, and trusted chart patterns that professional traders use. And these setups are better suited to the 15-minute, 30-minute, and 1-hour time frames, where you might expect a larger amount of pips to be made in a trending, or reversing market.

Example A


Example A is a 1-hour chart of the GBPUSD pair, but this set up works with any forex pair.

Example B


Example B shows that after an initial push higher, price action consolidates in a sideways move and this consolidation is confirmed by at least two attempts to push higher than a horizontal line of exchange rate where price action is rejected and which acts as a line of resistance and at least two pushes lower on a separate horizontal line of the exchange rate which was met with a line of support.
While this see-sawing between the resistance and support levels may continue for some time, one thing is for sure, that eventually, price action will either break to downside or break to the upside.

Example C


Now let’s look at Example C. This is where we will set up our first limit order. Firstly, price action appears to be fading to our support line, as defined by the green line. This fading of price action means that we are more likely, at this point, to see a breach of our support line and a continuation in price action in a downwards direction.
Therefore we have placed a sell limit order a couple of pips below the support line with a stop loss a couple of pips above the resistance line.

Example D


Now we must turn to example D, which is our secondary backup buy limit order, which we believe would be a good insurance policy should price action break the resistance line and move in an upward direction.
In this situation, we simply set our buy limit order a couple of pips above the line of resistance with a stop loss a couple of pips below the area of support.

The idea regarding our hedging strategy is to prime everything in readiness for where we believe the price action will go due to our technical analysis and also to set up a secondary trade in the reverse direction as a backup or insurance policy in case price action reverses in the opposite to the direction where we believe price action will go.
Obviously, it is possible that both trades could be executed and therefore we would advise that you keep an eye on the trade and should both trades be executed and where one triggers a stop loss, the profit target from the secondary trade should be at the very least the amount that was stopped out on the first trade, in order not to adversely affect your profit and loss.

Categories
Forex Market Analysis

Daily F.X. Analysis, March 13 – Top Trade Setups In Forex – Market Tosses in Profits & Losses Amid Coronavirus! 

On the forex front, the U.S. dollar gained traction on Thursday, with the ICE Dollar Index climbing 1.0% on the day to 97.50. The U.S. official data showed that producer prices declined 0.6% on month in February (-0.1% expected), and initial jobless claims fell to 211,000 in the week ended March 7 (220,000 expected).

Later today, March University of Michigan’s Consumer Sentiment Index (preliminary reading, 95.0 expected) will be reported.

U.S. official data showed that producer prices declined 0.6% on month in February (-0.1% expected), and initial jobless claims fell to 211,000 in the week ended March 7 (220,000 expected).

Later today, March University of Michigan’s Consumer Sentiment Index (preliminary reading, 95.0 expected) will be reported.

Economic Events to Watch Today    


EUR/USD – Daily Analysis

The EUR/USD lost 0.8% to 1.1181. The European Central Bank expanded its asset purchase program by EUR120 billion while keeping its key interest rates unchanged. ECB President Christine Lagarde said, “the spread of the coronavirus Covid-19 has been a major shock to the growth prospects of the global economy and the euro areas economy, and it has heightened market volatility”.

The central bank kept rates unchanged on Thursday and raised its asset purchase program by EUR120B. They introduced a new program of cheap loans that would necessarily pay banks up to 0.75% to give to small businesses. However, the EUR traders were not impressed, as indicated by the long-tail (seller exhaustion) attached to Thursday’s candle. 

It should be noted that the 3-month euro-dollar and dollar-yen swap spreads had widened to levels last seen in 2017 on Thursday. Notably, spreads widened by nearly 40 basis points, the most significant single-day increase since December 2008, highlighting stress in the dollar funding markets. Whereas, the Federal Reserve injected liquidity by $1.5 billion. As a result, the credit markets could normalize ahead of the weekend.

The German Federal Statistical Office will report final readings of February CPI (+1.7% on-year expected). France’s INSEE will post final readings of February CPI (+1.4% on-year expected).


Daily Support and Resistance

  • S1 1.0654
  • S2 1.0918
  • S3 1.1045

Pivot Point 1.1182

  • R1 1.1309
  • R2 1.1447
  • R3 1.1711

EUR/USD– Trading Tips

The EUR/USD has traded mostly lower to test the double bottom support level of 1.1095 level. The EUR/USD is currently trading around 1.1195, and it’s forming a lower-lows pattern on the 4-hour chart, which mostly drives a continuation of a selling trend. On the lower side, a continuation of a bearish bias can extend sell-off until 1.1100 and 1.1095. While the bullish breakout of 1.1350 can drive more buying until 1.1454 area. Consider staying bullish over 1.1182 and bearish below the same level today. 


GBP/USD– Daily Analysis

The GBP/USD plunged 1.9% to 1.2576, the lowest level since last October. Sterling fell against the U.S. dollar despite weaker than expected U.S. economic events. The U.S. official data showed that producer prices declined 0.6% on month in February (-0.1% expected), and initial jobless claims fell to 211,000 in the week ended March 7 (220,000 expected).

At the U.K. front, there are fewer chances that the British PM Johnson will announce any significant stimulus after the BOE joined the budgetary push to defeat the virus the previous day. However, Traders should wait for the final announcement because we all know that the Tory leader is famous for providing surprises.

Apart from the coronavirus headlines, traders will likely pay a little attention to the U.S. data. However, the Bank Of England minutes could offer a robust near-term direction after the central bank marked a surprise cut during the week. “Minutes are released at noon GMT from MPC’s “special” March 10 meeting, where they decided to coordinate the inter-meeting easing package announced Wednesday.

Later in the day, the U.S. Labor Department will release the February import price index (-1.0% expected). The University of Michigan will publish its Consumer Sentiment Index for March (95.0 expected).


Daily Support and Resistance

  • S1 1.2523
  • S2 1.2695
  • S3 1.2758

Pivot Point 1.2867

  • R1 1.293
  • R2 1.3039
  • R3 1.3211

GBP/USD– Trading Tip

On Friday, the GBP/USD continues to trade in a bearish mode due to the BOE rate cut decision. The GBP/USD has dropped further after violating the immediate support level of 1.2750, which is now working as a resistance. The sell-off in the GBP/USD was so solid that it’s pricing fell down to 1.2506 level which is now working as a support. 

Recently, the GBP/USD has closed a bullish candle that can drive buying in the GBP/USD, and it may lead its prices higher towards 1.2685 level. The MACD is consistently forming bearish histograms below zero, supporting the selling trend in the GBP/USD pair, which is why we should consider selling below 1.2825 today. 


USD/JPY – Daily Analysis

During the early Asian session, the USD/JPY currency pair flashing green but dropped from the session highs, because the Japanese yen is finding bids, mainly due to the sharp decline in the U.S. stock futures. At the press time, the USD/JPY currency pair is currently trading at 105.41 and consolidates in the range between the 104.51 – 106.03. However, the pair dropped from 105.20 to 104.68 in the 60 minutes to 01:30 UTC and was last seen trading around 104.89. 

The futures Wall Street’s benchmark equity index S&P 500 are currently down 1.64 percent, having started the Asian session on a relatively less risk-off note. 

Whereas, the global equities and the U.S. stock markets are expected to trade red on Friday. In the time being, the Asian equities are flashing red with Japan’s Nikkei reporting a 9% drop. 

The BOJ offered a liquidity injection of 500 billion yen early Friday, but so far, but that has failed to improve the risk sentiment and weaken the Japanese yen.


Daily Support and Resistance

  • S1 99.41
  • S2 102.11
  • S3 103.7

Pivot Point 104.81

  • R1 106.4
  • R2 107.51
  • R3 110.21

USD/JPY – Trading Tips

The USD/JPY is trading at 105.800 and has already bounced off a double bottom support level of 104.100. Closing of 4-hour candle above this level has confirmed the chances of further buying in the pair. The recent candles on the 4-hour chart are three white soldiers who are bullish nature and typically drive buying in the market. 

The immediate resistance that USD/JPY can face is around 106.150 level, and violation of this can extend more buying until 107.450 marks. On the lower side, support stays around 104. All the best for today!  

Categories
Crypto Market Analysis

Daily Crypto Review, Mar 13 – Cryptos staring into the abyss as Bitcoin drops to $3,800

The cryptocurrency market had a meltdown of epic proportions today. Almost every single cryptocurrency dropped over 20% in value. However, almost all the other markets are bleeding heavily as well due to the halt of the economy, which is caused by the Coronavirus outbreak. Bitcoin is currently trading for $5.025, which represents a staggering 34.29% decrease on the day. Meanwhile, Ethereum lost 29.15 % on the day, while XRP lost 24.74%.

Multi-collateral DAI took the position of today’s most prominent daily gainer, with gains of 7%. On the other side, Synthetix Network lost 49.74% on the day, making it the most prominent daily loser.

Bitcoin’s dominance decreased greatly over the past 24 hours. Its value is now 59.4%, which represents a 5.95% difference to the downside when compared to yesterday’s value.

The cryptocurrency market capitalization melted down, with a current value of $153.59 billion. This value represents a decrease of a whopping $63.64 billion when compared to the value it had yesterday.

What happened in the past 24 hours

The European Central Bank (ECB) announced that it would provide a $135 billion stimulus to the market. This number certainly dwarfs Bitcoin’s entire market cap. This move is not unique, as similar efforts have been shown from the US Federal Reserve on Mar 10.

In an effort to combat currently struggling markets, The European Central Bank made a decision to not cut interest rates any further, but to rather allocate 120 billion Euros to its asset purchase program.

Honorable mention

Enjin (ENJ)

Blockchain-based gaming ecosystem Enjin has just launched its Multiverse Program. The platform is now seeking applications coming from interested developers.

The Multiverse program is designed to attract developers to enter and explore Enjin’s Multiverse platform, which is a gaming platform supporting the creation of in-game digital assets. These assets can be transferred as well as used across multiple games that are hosted in the multiverse.

_______________________________________________________________________

Technical analysis

_______________________________________________________________________

Bitcoin

Bitcoin’s price had quite a meltdown in the past 24 hours. All technical analysis seems to be out of the game as BTC’s price went down from $7,400 to $3,830 in a matter of hours. The price broke every possible line and anchor it could hang onto and dropped to the lows of $3,830. However, the price quickly moved back up to just over $5,000 which is where it is at the moment.


Bitcoin’s volume increased greatly due to the selloff, while its RSI is deep in the oversold territory on every chart except for the weekly chart.

Key levels to the upside                    Key levels to the downside

1: $6,640                                           1: $5,000

2: $6,850                                           2: $4,300

3: $7,060                                            3: $3,100


Ethereum

Ethereum took a big hit as well, alongside other altcoins. In a price drop led by Bitcoin, Ethereum lost over 20% of its value in the past 24 hours. Its price fell to a staggering $90 all the way up from above $185 levels. The price has stabilized since and is trading at around $125. Unlike Bitcoin, though, Ethereum found resistance closeby, which is at the $122.5 level.


Ethereum’s volume increased due to the selloff, while its RSI level is oversold on every single chart except for the weekly chart.

Key levels to the upside                    Key levels to the downside

1: $128                                                1: $122.5

2: $168                                              2: $100 

3: $178.6                                            3: $80


Ripple

XRP was no different than other altcoins in terms of price development over the past 24 hours. Its price dumped as well, dropping to lows of $0.1. The price has recovered since and is now trading and consolidating near $0.14. However, XRP might be in the worst position out of the top3 cryptocurrencies as it does not have an anchor point to the downside.


XRP’s volume increased greatly, while its RSI level dropped to deeply oversold levels except for the weekly chart, where it is nearing the oversold area as well.

Key levels to the upside                    Key levels to the downside

1: $0.165                                            1: $0.1

2: $0.19

3: $0.2                                              

Categories
Forex Daily Topic Forex Psychology

What does it take to Replicate Success?

Replicating something is done by taking a model and copying it. To become a successful trader, beginners should replicate, or model, a successful trader. But what does it take to replicate Success?

The Model

To replicate a model, we need first to define and subdivide it into sub-processes or tasks. According to Dr. Van K. Tharp, the needed subtasks required to master to become a successful trader are:

 The trading process

  1. The process of trading
  2. The process of developing a trading system that fits the trader
  3. The process of objective definition and risk management
  4. The process of a business plan as a document that guides decision-making.

Of course, to aim for excellence, we need to model the best traders in class. 

The first step is to subdivide the model into sub-tasks. Once the tasks have been defined, we need to attach beliefs, mental states, and mental strategies for each one. The purpose is to duplicate the way a successful trader thinks and acts. If we can achieve this feat, we are sure the results can be replicated.

The beliefs

According to Dr. Tharp, beliefs act as the first filter to transform the information coming from the world. Beliefs, meanings, categorizations, and comparisons determine how people perceive the real world. What a trader expects from the market depends largely on his beliefs about it. That which is called market sentiment is really “market beliefs.”

Since beliefs are filters to reality, it is wise to classify them, by asking ourselves the following

  • Where did this belief come from?
  • How useful is it?
  • How does it limit my actions?

This process helps us keep and improve valuable beliefs and get rid of un-useful ones.

Mental States

The next step to generate success is duplicating the mental state of top traders. It has to do with discipline and emotional control. When people carry their mental problems to trading their results usually come from an improper mental state, not suited to trading:

  • I’m impatient and always get in too early
  • I get mad at markets. They seem to know when I trade just to do the opposite
  • I’m afraid the market is against me now that I’m wining
  • I get too excited when I’m winning and don’t get out in time.

Controlling these states is not the solution to solve all problems. It is just one part of it. Dr. Van K. Tharp tells that in the ideal model to the trading success, each task has an optimal mental state attached to it. 

Mental Strategies

 A mental strategy is a sequence of thoughts that go from a stimulus coming any of your senses to output or action. Let’s create an example with two possible mental strategies for the same stimulus to better understand the concept.

Mental Strategy One:
  • perceiving a trading signal
  • realizing it is a known signal
  • Think about what can go wrong if you take it
  • Visualize the scenario
  • Feel afraid
Mental Strategy Two
  • Perceiving the Signal
  • Recognize it as part of your system
  • Feel good your system delivers you a new opportunity
  • Take it and trade

What do you think is the right strategy for trading? Could you take action and trade consistently using mental strategy one?

As in the case of the mental states, each trading task requires an optimal mental strategy to optimize the results.  That will be developed in future articles.


Further Reading: Peak Performance Course Book 1- How to use Risk, Van K. Tharp.

Categories
Forex Market Analysis

Gold Exhibits a Dramatic Dip – Is It Good Time to Go Long?

On Thursday, the precious metal fell dramatically despite worries about the economic influence of the coronavirus break on the global market.s The United States rejected flying from virus-infected Europe, although gains were capped as investors covered margin calls after plunge inequities.

The global coronavirus crisis deepened, as the number of cases surged to 7,375 (366 deaths) in Italy, to 7,313 (50 deaths) in South Korea, and 6,566 (194 deaths) in Iran. The situation is also worsening in France (1,126 cases), Germany (1,040 cases), Spain (674 cases), and the U.S. (534 cases). The New York Stock Exchange reopened trading following a brief pause initiated by a 7% slump quickly after the market opened. 

Support Resistance

1,646.71     1,696.48

1,619.68     1,719.22

1,569.91     1,768.99

Pivot Point 1,669.45

The yellow metal gold slips dramatically, falling from 1,649 high level to 1,573 level during the U.S. session open. Usually, gold get’s stronger when the stock market drops, but in today’s case, both the stock markets and billions are falling like a tit for tat situation. 

At the moment, gold is gaining support at 1,574 level, and violation of this can open the selling room until 1,562 mark. While the closing of candles above 1,573 can help us capture a quick retracement until 1,602 level. Let’s wait for the market to calm down a bit before we place further bets in gold. 

Good luck! 

Categories
Forex Videos

Forex Hedging Strategy – The Ascending Pennant Chart Pattern

Hedging Strategy Via The Ascending Pennant Chart Pattern

Today’s video is a follow on from our: Hedging – Making money no matter which way the market moves. So be sure and check that out if you missed it. The theory in this series is that we are looking to maximize successful trading opportunities from areas in price action that are likely to accelerate in either direction. And by covering both eventualities, we create a situation where we can capture the breakout in either direction, even if our initial trade goes against us.

There are various types of hedging, such as selling equities in favor of buying gold or buying one currency pair while simultaneously hedging the position by selling another pair, which might be seen as acting in confluence, in order to spread the risk.
But this is a different style of hedging, where we essentially set up two trades in the opposite direction, while incorporating tight stop losses and where trade one is based on a high probability of a correct move based on our technical analysis and where trade 2 acts as a backup trade, or insurance policy if the market reverses against our technical setup, which, unfortunately, can happen.

Example A


Let’s look at example A. This is the basic pattern you would expect to see on an ascending pennant pattern.

Example B


Now let’s take a look at this setup in a little more detail in example B. Initially we can see that there has been a period of consolidation, where price action is conforming to an area of support and resistance at positions A and B, and where price action remains above a key moving average, which is gradually moving higher, in line with price action, which eventually breaches the area of resistance at position A and a short while after finds support at that level, before continuing higher.
At the top of our charts, at position D, we have a wedge shape formation, which confirms our bullish Pennant chart pattern. Price action has consolidated within the wedge and is beginning to break out from it in an upward direction. From this setup, we would have very good technical grounds to believe that the buyers have got hold of this pair at the current time and that break from price consolidation within the D shaped wedge is likely to be higher, in continuation of the overall trend.
Had you not already been buying into the trend, this is the point at which you might want to seriously consider buying the potential continuation.

Example C


In Example C, we are going to implement our hedging strategy with an immediate buy order at position 1, and a stop loss at position 2.

Example D


In example D, we are going to set up our backup trade in the event that our first trade reverses.
First of all, we are going to put a sell limit order just below the stop loss of our first trade at position 3, and we will place a stop loss for this second backup trade just above our entry of the first trade at position 4. We need to place a take profit at around the area or position 5, which would be equal to at least the amount that we lost in our first trade in order to rebalance our profit and loss. In this a hedging strategy, we have covered all the bases regarding strict observation of technical analysis, and we have carefully placed our orders in order to capture the breakout from this ascending

pennant set up. We have also carefully mitigated against the risk of a price reversal by incorporating a backup trade.

Categories
Forex Course

79. Is Indicator Based Trading For You or Not? (Pros & Cons)

Introduction

In the previous course article, we have briefly discussed the basics of indicator-based trading. We have also understood the different types of indicators. Before considering how to trade using these indicators, let’s see if indicator based trading is for you or not. For that, we will be listing down some of the significant pros and cons involved in indicator-based trading. After going through this article, we will know why we should be using indicators to trade the markets and what we should be cautious about while using these indicators.

Pros of using Technical Indicators

Simplification

As discussed in the previous course article, Indicators mainly present the existing price and volume data on the price charts. For novice traders who have less knowledge of reading this data, can take the help of indicators to understand the price charts in a more precise way. Also, indicators act as a great tool to identify market strength.

For instance, using the Moving Average indicator, the direction of the trend can be found. By using the stochastic indicator, overbought and oversold areas can be found. These cannot be easily identified by the novice traders if not for these indicators.

Swift Decision Making

Since you aren’t entirely aware of most of the indicators, we would like to give you an example of the indicators we have learned till now. If you remember trading Fibonacci levels, we have taken our entries right after the price bounces after touching the respective Fib levels. It is impossible to make such swift decisions in the absence of these indicators. Hence we can say that indicator based trading allows us to make quick decisions comparatively.

Confirmation Tool

Indicators act like an excellent confirmation tool for experienced traders as well. For example, a technical trader identifies a candlestick pattern and wants to take trades based on that pattern. To confirm if the signal provided by the pattern is accurate or not, he can take the help of any technical indicator like RSI or Stochastic. If the indicator supports the signal provided by the pattern, the trader can confidently make trades.

Combination Capability  

Indicators can be combined to understand the market more clearly. For instance, Moving Averages can be combined with Fibonacci levels, and Stochastic can be combined with many other reliable indicators to generate accurate signals. If we wish to, we can even add an end number of indicators, but these additions should able to simplify the price chart rather than making it more complex.

Cons of using Technical Indicators

Unawareness of the complete picture

Novice traders who get used to trading with these indicators can never get an entire background on what’s happening behind the charts. If they get used to this, they can never become a professional technical trader. Also, they won’t be able to identify if the signal generated by the indicator is accurate or not. Hence, it is always crucial to understand why the indicator is moving the way it is so that we can make better trading decisions.

Not for pure price action traders

Price action trading is also a part of technical trading. It is purely based on the price movements of the asset alone. So price action traders might find indicator based trading a bit redundant because they know why the price is moving the way it is moving. Hence we can say that indicators don’t add more value to pure price action traders.

Lag Issue

By now, we know that there are lagging indicators that portray what has already happened in the market. These indicators do add significant value to indicator based trading, but they can’t be completely used to take the trades.

Final Word

These are some of the pros and cons involved in using indicators for trading the markets. So the answer to the question ‘If the Indicator based trading is for you or not?’ is yes. It is for you. But we have to be cautious and understand the entire picture instead of blindly following the indicators. In the upcoming articles, we will start learning how to take trades using various reliable indicators in the market. Cheers!

Categories
Forex Assets

EUR/NOK – Everything You Should Know Before Trading This Currency Pair

Introduction

EUR/NOK is the abbreviation for the Euro Area’s euro against the Norwegian Krone. This pair is classified as an exotic-cross currency. Here, EUR is the base currency, and NOK is the quote currency.

In this asset article, we shall understand what the value of this pair means, the volatility in different timeframes, the cost variations, and finally, the ideal way to trade this pair.

Understanding EUR/NOK

The value of this pair represents the value of NOK equivalent to one EUR. It is quoted as 1 EUR per X NOK. For example, if the value of this pair is 10.4373, approx. 10 Krones are required to purchase one euro.

EUR/NOK Specification

Spread

The difference between bid and ask prices set by the brokers is referred to as the spread on the trade.

There are two types of trade execution models in forex, namely, ECN and STP. The spread on both vary.

  • Spread on ECN: 55 pips
  • Spread on STP: 57 pips

Fees

For every position you take on your account, you are required to pay some fee for it. This fee is typically between 5-10 pips. Moreover, there is no fee as such in STP accounts.

Slippage

When orders are executed by the market, the trader will not receive the exact price at which he triggered the button. The difference between the actual received price and the triggered price is called the slippage.

Trading Range in EUR/NOK

A Trading range is a tabular representation of the pip movement in a currency pair for different timeframes. Below is the same table for the EURNOK currency pair. From these values, we can assess our profit/loss on a trade beforehand. All you must do is, find the product of the volatility value and the pip value ($0.95).

Procedure to assess Pip Ranges

  1. Add the ATR indicator to your chart
  2. Set the period to 1
  3. Add a 200-period SMA to this indicator
  4. Shrink the chart so you can assess a large time period
  5. Select your desired timeframe
  6. Measure the floor level and set this value as the min
  7. Measure the level of the 200-period SMA and set this as the average
  8. Measure the peak levels and set this as Max.

EUR/NOK Cost as a Percent of the Trading Range

This is an application to the above trading range table. By clubbing these values with the total cost of a trade, we can determine the cost variations for changing volatilities.

ECN Model Account 

Spread = 55 | Slippage = 3 | Trading fee = 3

Total cost = Spread + Slippage + Trading Fee = 55 + 3 + 3 = 61

STP Model Account

Spread = 57 | Slippage = 3 | Trading fee = 0

Total cost = Spread + Slippage + Trading Fee = 57 + 3 + 0 = 60

The Ideal way to trade the EUR/NOK

Trading the EURSEK is similar to trading any other exotic-cross pair. This pair has pretty high volatility with liquidity lesser than major/minor pairs. This is the reason for its spreads to be at 55 pips. Yet, this pair can still be traded.

From the above cost percentage table, we can infer that the magnitudes are large in the min column and small in the max column. This means that the costs are more for low volatilities are less for high volatilities. It is neither preferable to trade during high volatilities nor when the costs are less, for obvious reasons. So, to maintain equilibrium between costs and volatility, it is ideal for entering this pair when the volatility is more or less near the average values in the trading range table.

Another simple way to bring down your costs is by placing orders by ‘limit’ and ‘stop.’ When trades are not executed as market orders, the slippage is cut off. Hence, the total cost is reduced by a decent percentage. An example of the same is given below.

Spread = 55 | Slippage = 0 | Trading fee = 3

Total cost = Spread + Slippage + Trading Fee = 55 + 0 + 3 = 58

Categories
Forex Daily Topic Forex Price-Action Strategies

Price Action Trading: Let it go

The Engulfing Candle is considered one of the most influential candles to indicate a trend reversal. Price action trading is closely related to identifying trend reversal for which price action traders give value to engulfing candles a lot. In today’s lesson, we are going to demonstrate an example of an engulfing candle, which does not work in favor of the traders. We try to find out the reason behind that.

The chart shows that the price heads towards the South with good bearish momentum. On its way, it makes a breakout and trades below the level for one more candle. The sellers are to keep an eye on this pair for the price to consolidate and produce a bearish engulfing candle closing below consolidation support. Do not miss the point ‘closing below consolidation support’.

The price does not consolidate. It instead produces another bearish candle. It may consolidate now. A candle like this attracts more sellers to go short on the pair. Let us proceed to the next chart.

The chart produces a bullish inside bar. This means the chart is still bearish biased. The signal candle may come out at any time. The waiting game gets intense. The sellers are to keep checking the chart since the next candle may be the signal candle.

The chart makes them wait further. It produces a bearish inside bar followed by a bullish engulfing candle. The chart is still bearish biased, but the chart may get choppy as well if the next candle comes out as a bullish candle. Let us wait and find out how the next candle comes out.

The next candle comes out as a bearish engulfing candle. Is this what the sellers want? Here is a question for you. Would you trigger a short entry?

If the answer is no, you are right. The reason behind that is this is an engulfing candle, but it does not close below consolidation support. Look at the line below. This is where both candles get rejection. Thus, we may consider this one as consolidation support. Even if we consider only their bodies (not the best way), the candle closes within that level as well. The equation is an engulfing candle does not make a breakout. Thus, traders may skip taking this entry. We need to make sure these four things are there before taking entry based on this setup.

  1. Clear trend
  2. Consolidation
  3. Engulfing candle
  4. Breakout

If a trade setup misses any one of these, be patient. Let it go.


Categories
Forex Market Analysis

Daily F.X. Analysis, March 12 – Top Trade Setups In Forex – Brace for ECB Interest Rate Decision! 

The U.S. dollar strengthened versus its major peers for a second straight session, with the ICE Dollar Index bouncing 0.2% on the day to 96.60. The European Central Bank will announce its key policy rates (deposit facility rate at -0.5% expected). The European Commission will report January industrial production (+1.5% on month expected). During the U.S. session, the U.S. Labor Department will release February PPI (+1.8% on-year expected), and initial jobless claims in the week ended March 7 (220,000 expected).

Economic Events to Watch Today   


EUR/USD – Daily Analysis

The EUR/USD fell 0.2% to 1.1263. It is reported that the European Central Bank President Christine Lagarde told European Union leaders that Europe is facing a major economic shock, and that ECB is looking at all of its tools for the monetary policy meeting due later today.

There are so high chances of a slowdown in the Eurozone, especially in Germany, in the wake of dangerous coronavirus. So, possibly the European Central Bank will go with another stimulus measure on Thursday to soften the economic fallout, which may hurt the shared currency very well. 

The European Central Bank will announce its key policy rates (deposit facility rate at -0.5% expected). The European Commission will report January industrial production (+1.5% on month expected).

Considering the slowdown in the economy, the markets are expecting a cut in the deposit rate, which currently stands at -0.5%. Therefore, the EUR could see a sharp rise if the central bank keeps rates unchanged. The traders are keenly awaiting the ECB rate decision to take new directions. The Italian Quarterly Unemployment Rate, Industrial Production m/m, Italian 10-y Bond Auction also will be key to watch.

Daily Support and Resistance

  • S1 1.106
  • S2 1.1176
  • S3 1.1218

Pivot Point 1.1293

  • R1 1.1335
  • R2 1.1409
  • R3 1.1526

EUR/USD– Trading Tips

The EUR/USD is trading with a mixed bias around 1.1305 on Thursday as it seems to extend the bearish trend even after completing the 38.2%% and 50% Fibonacci retracement levels around 1.1350 and 1.1275.  

The EUR/USD is currently trading around 1.1305, and it’s forming lowers low pattern on the 4-hour chart, which mostly drives a continuation of a selling trend. On the lower side, a continuation of a selling bias can extend sell-off until 1.1200 and 1.1095. While the bullish breakout of 1.1350 can drive more buying until 1.1454 area. Consider staying bullish over 1.1275 and bearish below the same level today. 


GBP/USD– Daily Analysis

The GBP/USD dropped 0.7% to 1.2817. The Bank of England slashed its benchmark rate by 50 basis points to 0.25% after a special meeting, citing economic shock from the coronavirus. On the other hand, official data showed that the U.K.’s GDP growth was flat on month in January (+0.2% estimated), and industrial production declined 0.1% in February (+0.3% expected).

Whereas, the U.S. 10-year Treasury yields failed to continue the previous day’s run-up, current down by 8-basis points (bps) to 0.67%.

The U.K. Office for National Statistics will report January monthly GDP (+0.2% on month expected), industrial production (+0.3% on month expected), manufacturing production (+0.2% on month expected) and trade balance (356 million pounds deficit projected). 

At the U.K. front, there are fewer chances that the British PM Johnson will announce any major stimulus after the BOE joined the budgetary push to defeat the virus the previous day. However, Traders should wait for the final announcement because we all know that the Tory leader is famous for providing surprises.

Looking forward, the US PPI and Jobless Claims will likely entertain the momentum traders. The overall PPI was likely lower due to the weakening in energy prices, similar to the pattern in the CPI (TD -0.2%). The core measures were probably moderately weak as well after the above-trend readings in January.

Daily Support and Resistance

  • S1 1.2523
  • S2 1.2695
  • S3 1.2758

Pivot Point 1.2867

  • R1 1.293
  • R2 1.3039
  • R3 1.3211

GBP/USD– Trading Tip

On Thursday, the GBP/USD continues to trade in a bearish mode due to the BOE rate cut decision. The GBP/USD has dropped further after violating the immediate support level of 1.2850, which is now working as a resistance. 

Continuation of a selling trend can lead the GBP/USD prices towards 1.2740 and 1.2720. On the higher side, the GBP/USD is likely to trade bullish until 1.2840 level, and bullish breakout of which may drive further buying until 1.2910 level. The MACD is consistently forming bearish histograms below zero, supporting the selling trend in the GBP/USD pair, which is why we should consider selling below 1.2825 today. 


USD/JPY – Daily Analysis

The USD/JPY currency pair hit the bearish track and dropped below the 104.00, mainly due to a sharp decline in the equity market. U.S. President Donald Trump failed to ease the fears about intensifying coronavirus slowdown in the global economy, which later boosted the safe-haven Japanese yen and sent the USD/JPY pair lower near the 103.30. As of writing, the safe haven pair is trading at 107.30 and consolidates in the range between the 103.09 – 104.81.

Trump said during his speech that the U.S. would ban all flights from Europe to the U.S. for the next 30 days effective Friday at midnight. While also says that travel bans will not apply to the U.K., He said that the U.S. would take emergency action to provide financial relief for workers who are ill, hospitalized, or caring for others due to coronavirus. Whereas also says that we will provide capital and liquidity to the small firms which are affected by the coronavirus, provide low-interest loans as well. Trump promised to provide $200 billion in additional liquidity in the fight against coronavirus. 

As we already mentioned that the investors were expecting a more potent stimulus and sold risk after Trump’s speech. The S&P 500 futures, which traded 0.5% lower ahead of President’s address, are now reporting a 2.4% decline. Meanwhile, the yield on the U.S. 10-year Treasury registering losses by 5-basis points at 0.76%. 

Daily Support and Resistance

  • S1 99.41
  • S2 102.11
  • S3 103.7

Pivot Point 104.81

  • R1 106.4
  • R2 107.51
  • R3 110.21

USD/JPY – Trading Tips

The USD/JPY is trading at 103.800 and has already violated the double bottom support level of 104.100. Closing of 4-hour candle below this level confirms the chances of further selling in the pair. The recent candle on the 4-hour chart is bearish engulfing in nature as it’s covering the full body of the precious candle, and it signifies the chances of further selling in the USD/JPY pair. 

Below 104.250, the selling trend continuation can lead the USD/JPY prices towards 101.670, whereas, further buying over 104.250 can lead the USD/JPY to 106.250 area.

All the best for today!  

Categories
Crypto Market Analysis

Daily Crypto Review, Mar 12 – The US creating AmeriCoin? Altcoins plunging while Bitcoin increases its dominance

The cryptocurrency market moved down yet again in the past 24 hours. However, Bitcoin held up much better than most cryptos. Bitcoin is currently trading for $7,728, which represents a 2.1% decrease on the day. Meanwhile, Ethereum lost 7.18 % on the day, while XRP lost 4.57%.

Aave took the position of today’s most prominent daily gainer, with whopping gains of 35.9%. On the other side, WAX lost 20.15% on the day, making it the most prominent daily loser.

Bitcoin’s dominance increased greatly over the past 24 hours. Its value is now 65.45%, which represents a 1.52% difference to the upside when compared to yesterday’s value.

The cryptocurrency market capitalization lost a lot of value over the past 24 hours due to altcoins plunging. It is currently valued at $217.23 billion, which represents a decrease of $7.83 billion when its value is compared to the value it had yesterday.

What happened in the past 24 hours

Adam Kokesh, the first libertarian US 2020 presidential election candidate, just appointed Alastair Caithness as his personal chief blockchain policy advisor. The main purpose of Caithness’s role is to work on the development of a US-made sovereign cryptocurrency, better-known as AmeriCoin.

Caithness will focus on developing a cryptocurrency that is pegged to all the assets of the Federal government. The assets included will be the US government’s substantial land, gold, energy, timber, and mineral reserves.

Honorable mention

Basic Attention Token (BAT)

Brave purchased a whopping amount of 534,441 Basic Attention Tokens (BAT) on Mar 9. The event of purchasing BAT tokens happens just one day before Brave made an announcement of a partnership with TAP Network. This partnership will enable convertibility of BAT tokens into “gift cards from hundreds of national brands”.

_______________________________________________________________________

Technical analysis

_______________________________________________________________________

Bitcoin

Bitcoin is slowly continuing its price drop as bears took over the market. The biggest cryptocurrency by market cap fell under the $7,760 support level, but did not go too far down from it. BTC is currently trading between $7,600 and $7,700, with the next significant support level standing at $7,420.


Bitcoin’s volume has maintained levels it had yesterday, while its RSI value is declining towards oversold again.

Key levels to the upside                    Key levels to the downside

1: $7,760                                           1: $7,420

2: $8,000                                           2: $7,085

3: $8,650                                            3: $6,850


Ethereum

Ethereum took a big hit in the past 24 hours. The second-largest cryptocurrency by market cap fell under the support level of $198 as well as the $193.5 level. The next support, which is sitting at $185, held up quite well and held back the bears for now. However, the short-term outlook is certainly not positive.


Ethereum’s volume is low when compared to the previous days, while it is keeping the levels of the beginning of March. Its RSI level is on the verge of reaching oversold territory.

Key levels to the upside                    Key levels to the downside

1: $193.6                                             1: $185

2: $198                                              2: $178.5 

3: $217.7                                             3: $167.8


Ripple

XRP followed the daily trend of altcoins underperforming Bitcoin. The third-largest cryptocurrency by market cap lost almost 5% on the daily, but still outperformed Ethereum. XRP’s price fell below the support level of $0.2 but did not reach the $0.1985 level yet.


XRP’s volume is quite low when compared to the past couple of days, while its RSI level is approaching the oversold area, hovering around the value of 34.

Key levels to the upside                    Key levels to the downside

1: $0.221                                            1: $0.2

2: $0.227                                            2: $0.1985

3: $0.235                                             3: $0.19