Categories
Crypto Videos

Make Huge Crypto Profits With The Heiken Ashi Strategy! Part 2

Heikin Ashi Technique – Crypto trading (part 2/2)

We will take a look at a Heikin Ashi cryptocurrency high-low breakout trading strategy. We will need to go through several steps in order to fully execute the strategy.
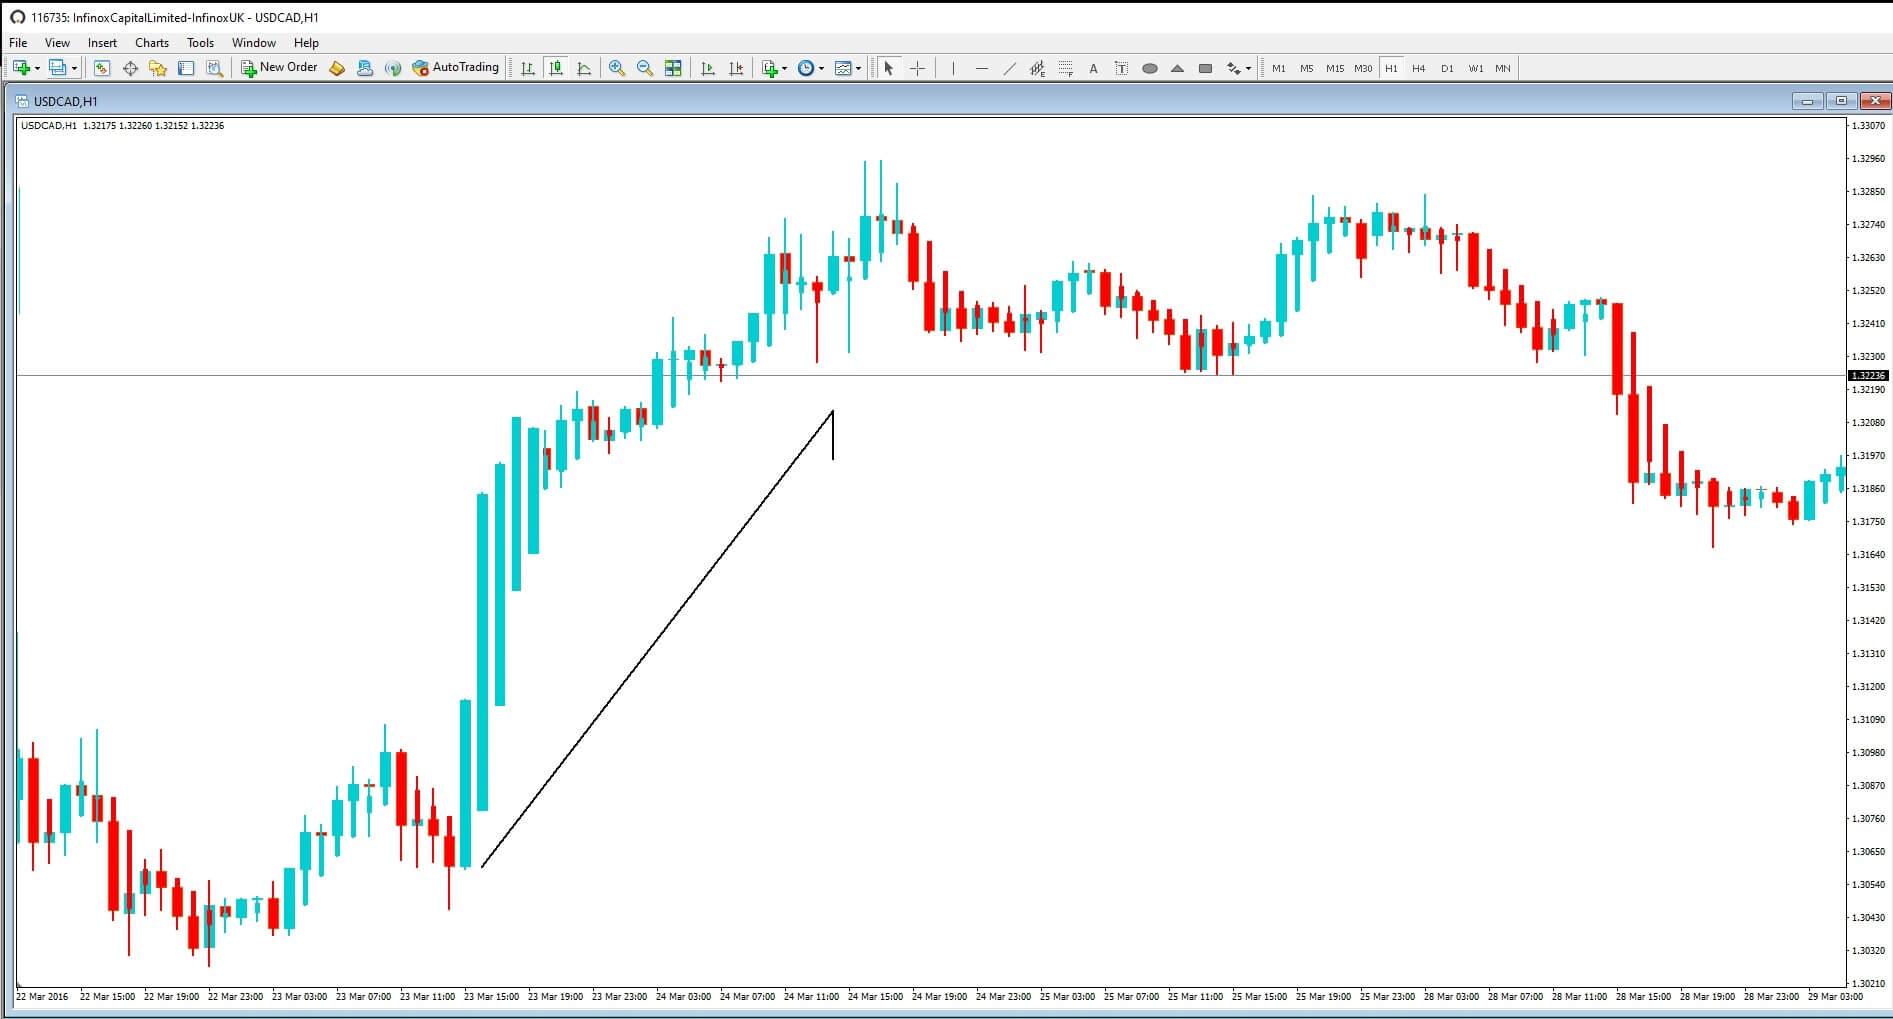
Identifying three consecutive bullish candles without any lower wicks.

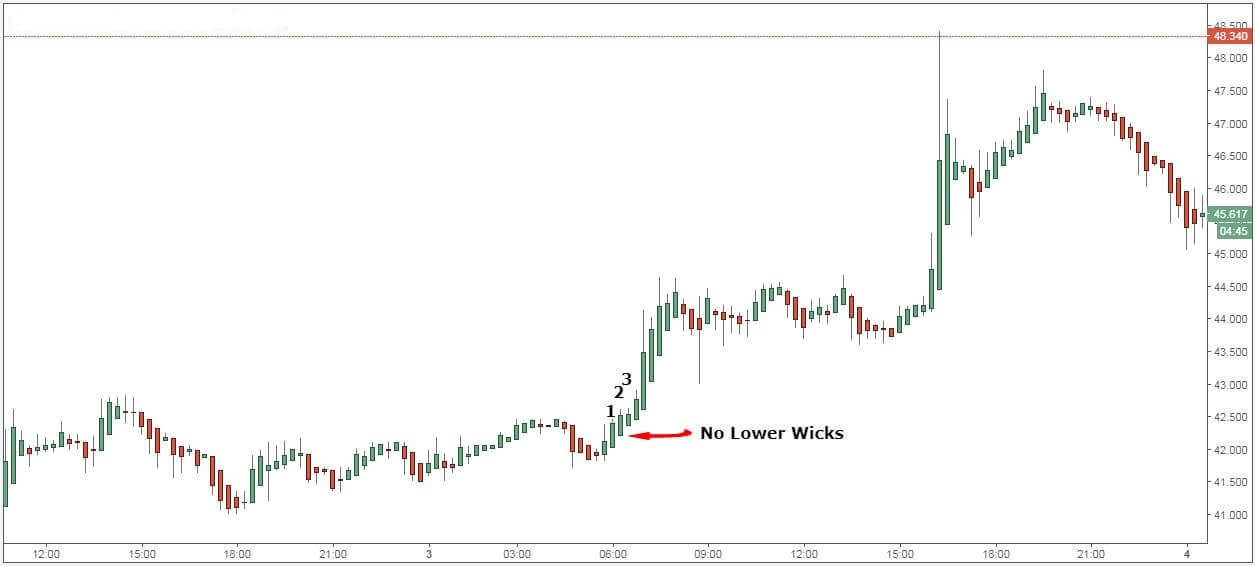
After switching to the Heikin Ashi candlestick chart on your preferred trading platform, you will need to identify three consecutive bullish candles. It is mandatory that all three candlesticks have no lower wicks.
This is because bullish candlesticks with no wicks indicate a strong trend to the upside and a further increase in price. Once that is done, we need to check the location of the candles.


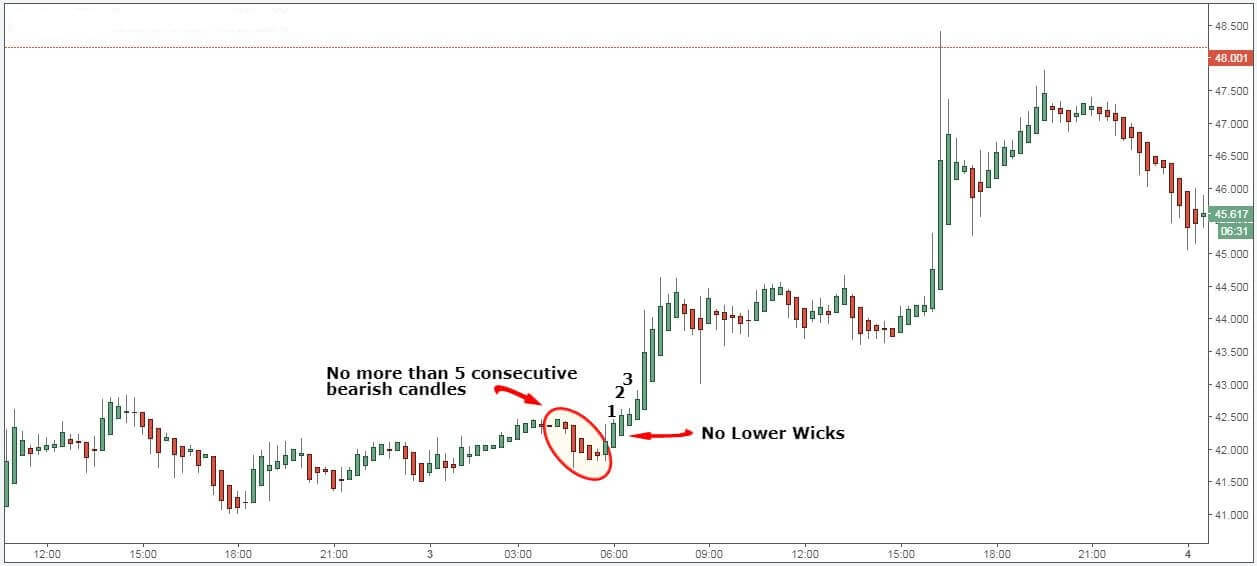
There have to be less than five consecutive bearish candles before the three consecutive bullish candles.

Trading Heikin Ashi candlesticks are very trend-oriented, so each of the little bits of info the chart gives, we have to take.
We need the location of the pattern, meaning that we can’t count more than five consecutive bearish candles prior to the three bullish candles spotted in the first step.
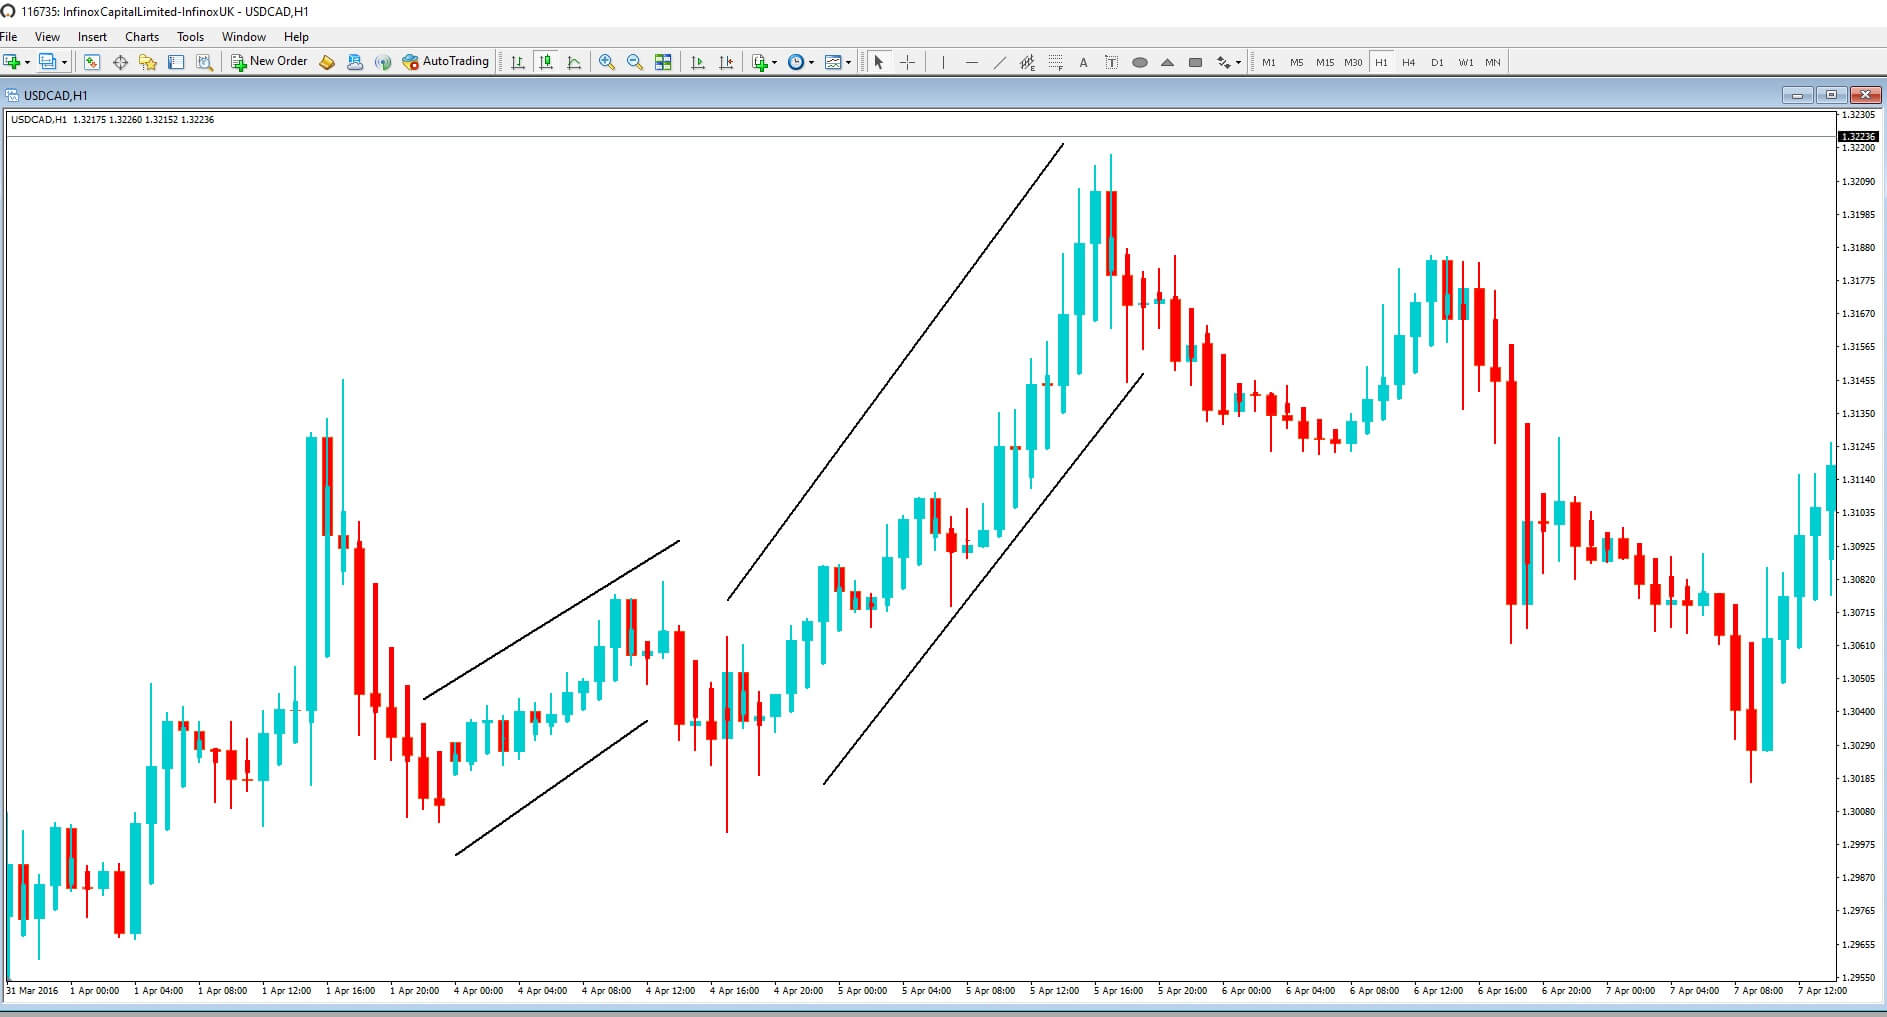
Now that we established the trend direction as well as the position of the pattern, we can look for buy opportunities.

Making an entry position at the 4th candle opening

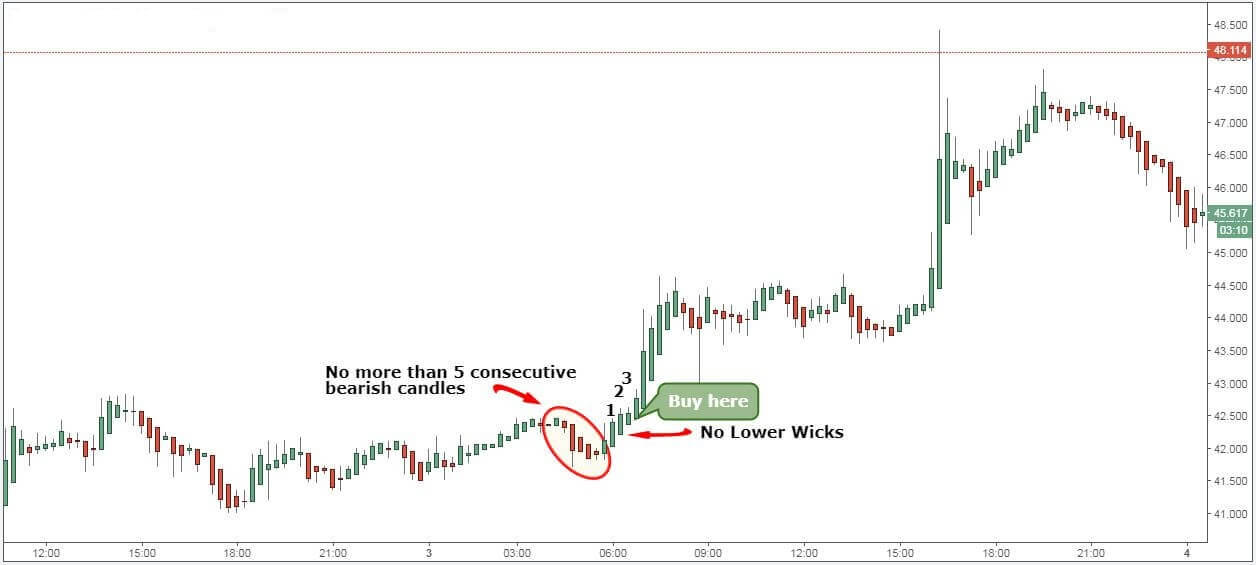
To initiate a position, make an entry at the 4th candle opening, right after the three consecutive bullish candles have finished forming.
Get ready to pull the trigger near the finish of the 3rd candle, so you can be ready for the 4th candle opening.

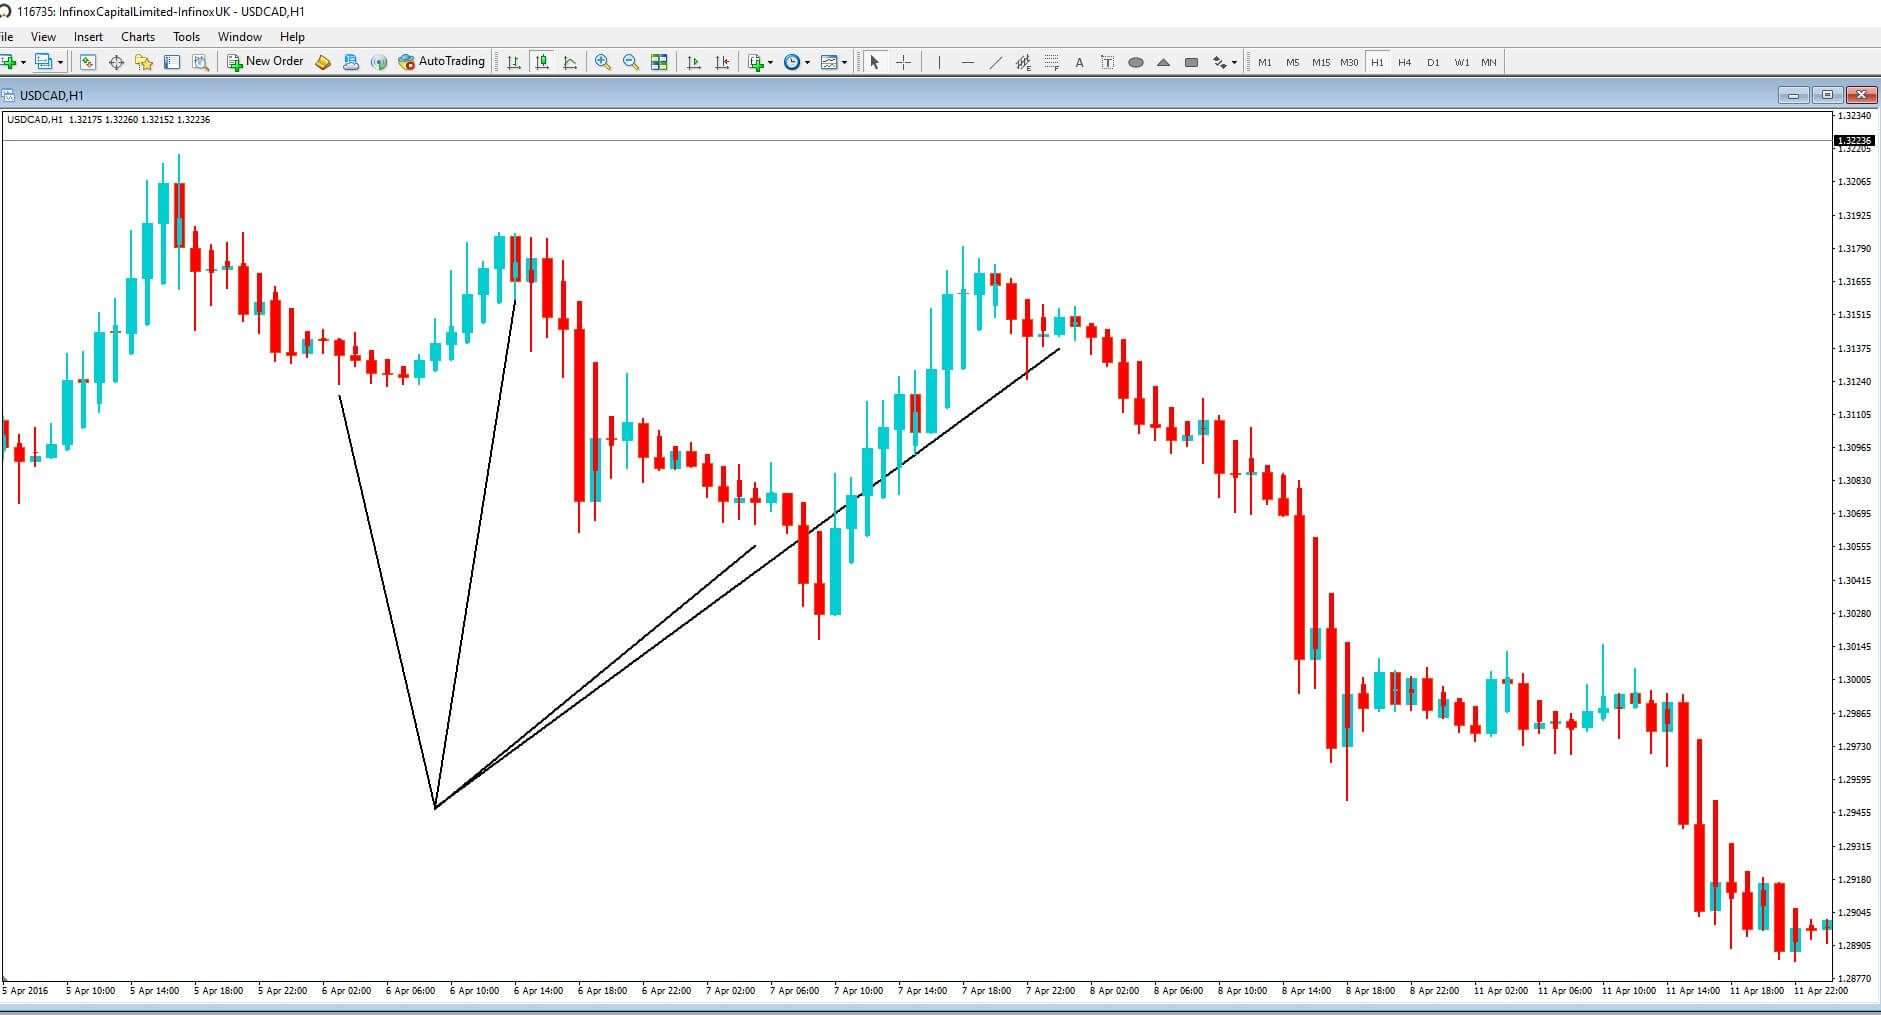
Placing your Stop-Loss below the most recent swing low 

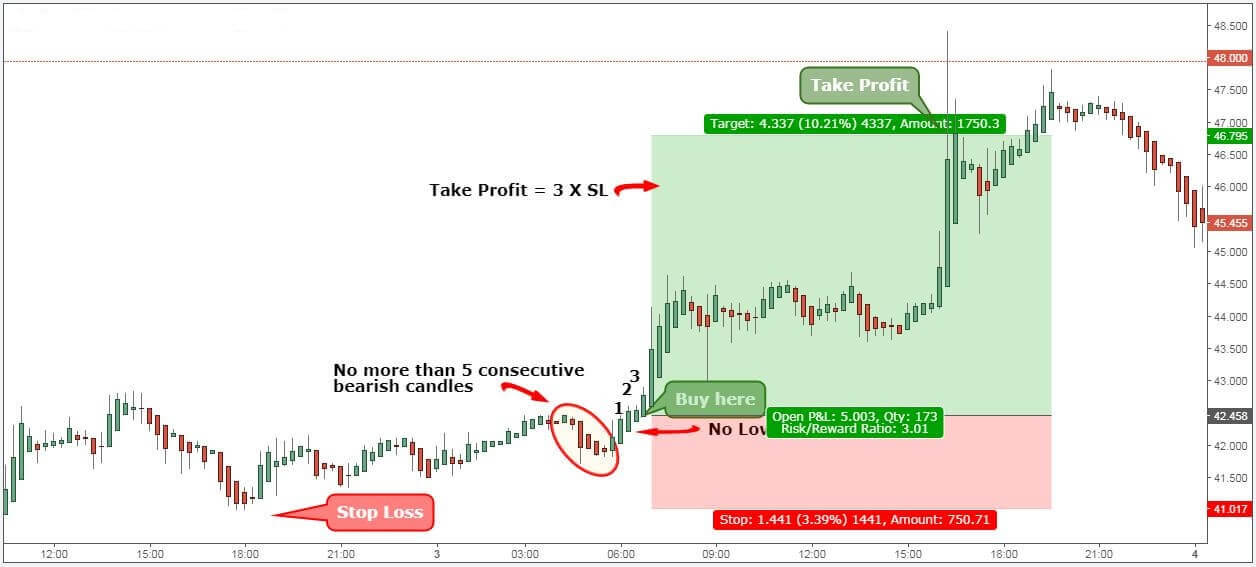
As with every trade you will take, there is a chance of it going the opposite direction to what you predicted. That’s why setting stop-losses is extremely important. The strategy behind setting stop-loss with Heikin-Ashi is quite simple.
The protective stop-loss should be placed just below the most recent swing low, or ultimately below the three bullish candlestick pattern. However, placing it below the three bullish candlestick patter might be risky as you can be taken out of the trade prematurely.
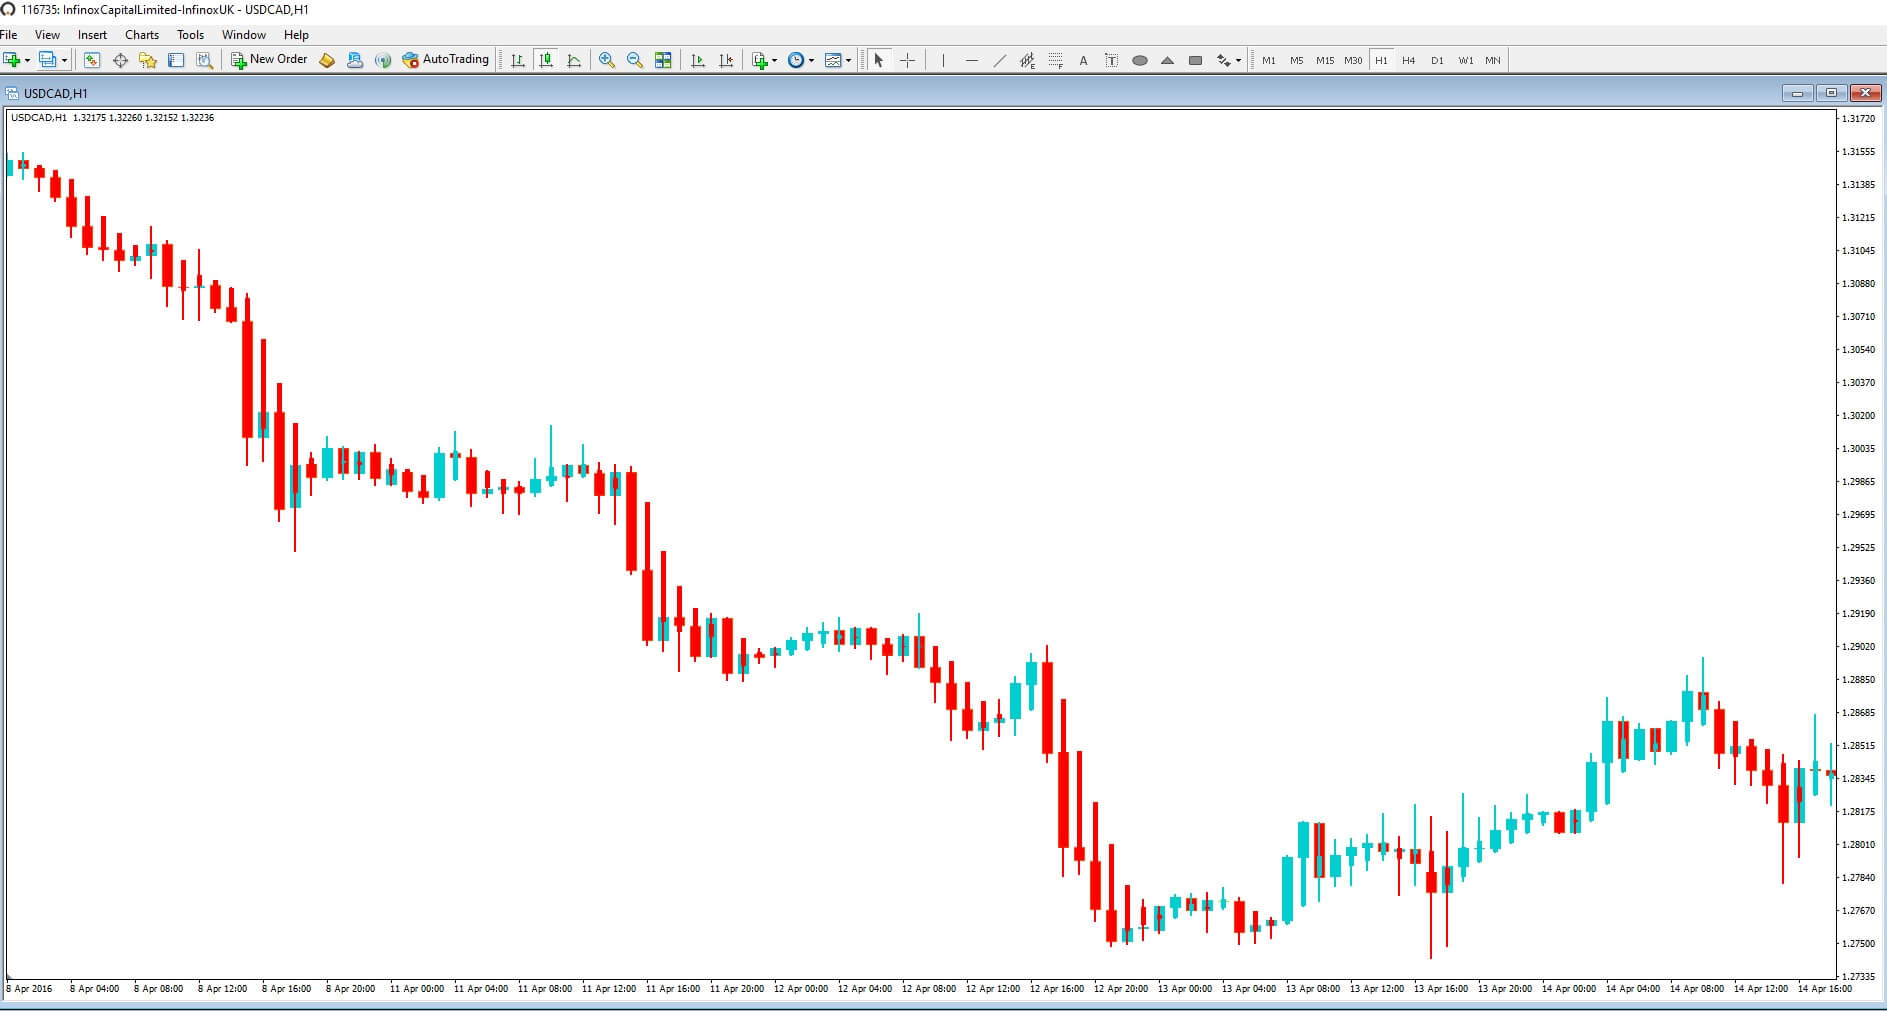
Taking Profit 

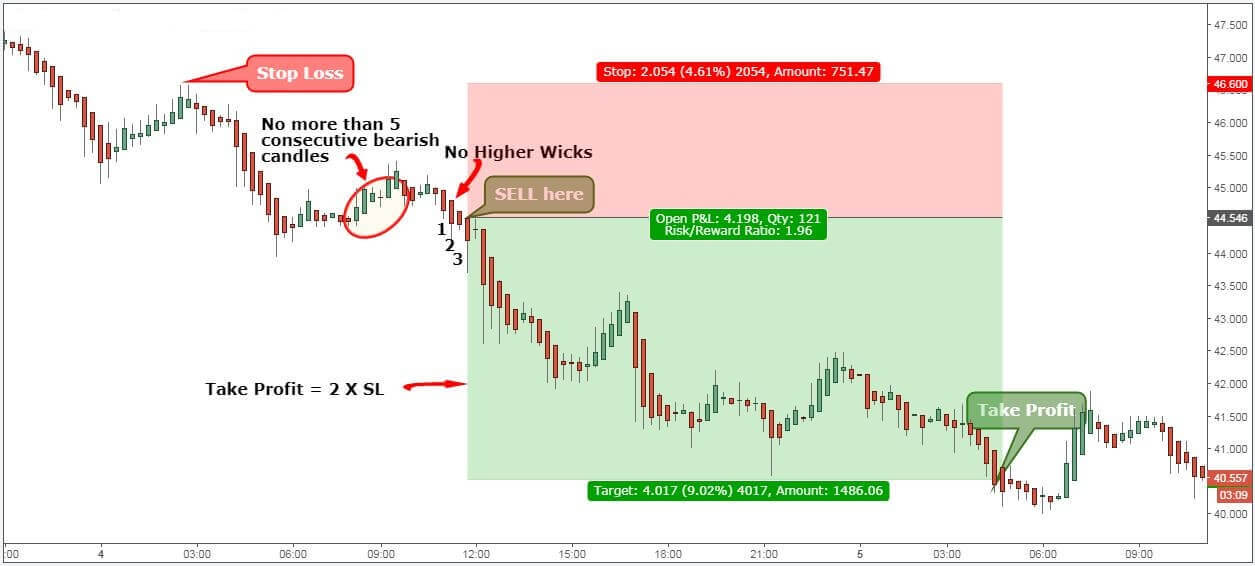
Depending on how strong the trend is, you would want your take profit to be two or three times more than you stop-loss. By doing so, you are trying to maximize your reward to risk ration.

Conclusion

Using the Heikin Ashi candles to determine the trend direction and set up trades can be extremely lucrative. It is important to make sure the position of the pattern is correct before entering trades, so that should not be compromised. This guide has hopefully taught you a trading strategy you can add to your toolset and possibly use.

Categories
Forex Videos

Heikin Ashi – Forex Trading Like A Samurai Warrior!


Heikin Ashi – Forex Trading Like A Samurai Warrior!


The Heikin Ashi technical indicator means “average bar” in Japanese, by the people who invented the tool. Heikin Ashi is combined with the Japanese candlestick, with the basic principle being that when functioning together on a chart, they have the effect of smoothing out a lot of the noise you get in forex trading while making charts more readable and making trends easier to analyze.

The Heikin Ashi has the same four data points, open, low, high, and close and the ordinary candlestick, however, they have some unique maths behind them and differ from that of a normal candlestick.

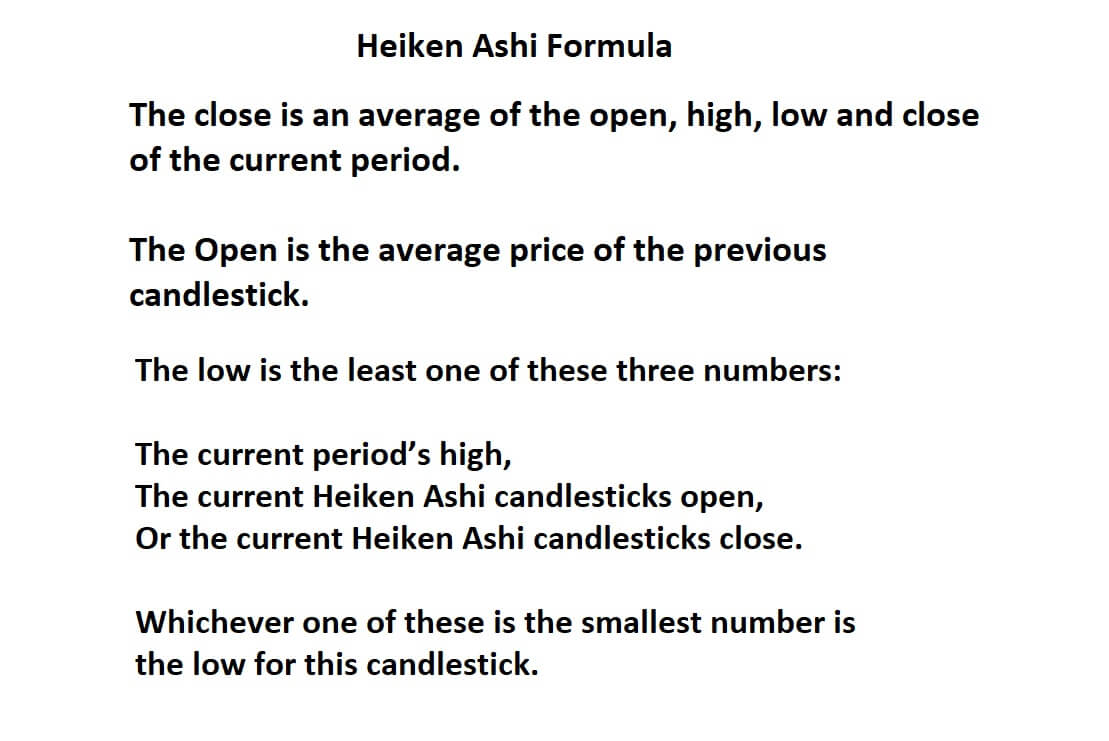
The close is an average of the open, high, low, and close of the current period. The Open is the average price of the previous candlestick.

The low is the least one of these three numbers: the current period’s high, the current Heiken Ashi candlesticks open, or the current Heiken Ashi candlesticks close. Whichever one of these is the smallest number is the low for this candlestick.
As traders, we can use the tool to show us more clearly when to hold on to a trade while also identifying when a trend may have run its course and thus showing us when to exit a trade.
As most profits are gained when markets are trending, it is important to have any tool available to help us more clearly identify those trends and thus help us to maximize our profits.


Example A

Example A is a 5-minute chart of the USDCAD pair using only Japanese candlesticks and where price action appears to be quite choppy.

Example B

In example B, we have added the Heiken – Ashi indicator while setting up the colors of our bars to match those of our candlesticks. We can already see that there is a noticeable difference and where we previously might have expected some price action reversals, the Heiken Ashi averaged out some possible turns and would have kept us in the trade.
Let’s go back to Example A in case you missed them.

Example C

Now let’s revisit our Heiken Ashi chart one more time as per example C, where we can see three areas that filtered out the noise and would have kept us in those trades a little longer in order to bag extra pips.
So when we look for a smoother Identification in trends, the Heiken Ashi will definitely help us to filter out some of the noise associated with standard candlesticks. That’s because normal candlesticks tend to alternate color even if the price action is predominantly moving in one direction. However, Heiken Ashi trend to stay blue in up trends and red in downtrends, or depending on how you have your candle colors setup.

Example D

Anything that gives us an edge is welcomed, and a lot of traders prefer Heiken Ashi over Japanese candlesticks, especially when they are as effective in Example D at identifying overall trends, in this case, a sell-off of the USDCAD pair on a one hour chart showing a 700 pip sell-off.

Let’s take a look at some simple rules when trading Heiken Ashi:

Example E

1: Example E, Blue candles with no wicks to identify strong upward trends. These offer strong bullish signals, so let them run

Example F

2: Example F: Blue candles identify an uptrend; you might want to add to your bull position and close out short positions.

Example G

3: Example G, Candles with short bodies and long wicks show market indecision and possibilities for price action reversals. You might want to close your positions and wait for confirmation of a new trend direction.


Example H

4: Example H, Red candles identify a downward trend. You might want to look for opportunities to add to your short position. And exit long positions.

Example I

5: Example I, Red candlesticks with no wick signify strong downward price action. You might want to exit your long trades and add to your short positions as price action moves lower. And stay in the trade until there is an indication of price action reversals.
Therefore the Heiken Ashi can be a great technical tool in your armory.