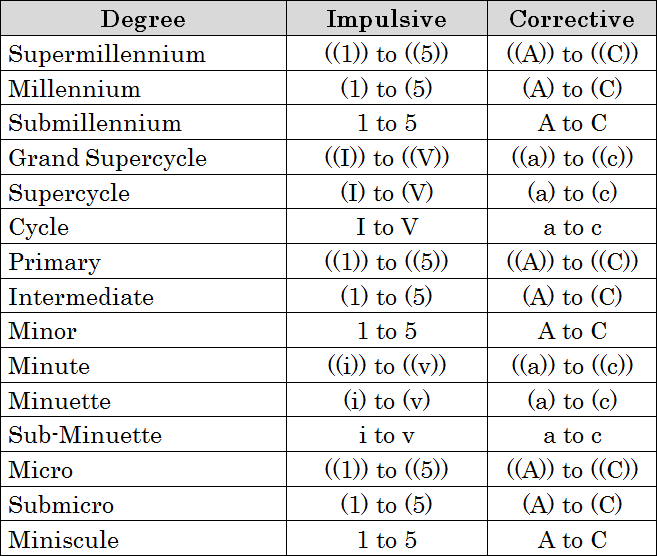
Categories
Forex Elliott Wave

Advanced Applications in Wave Analysis – Part 3 of 4

Introduction

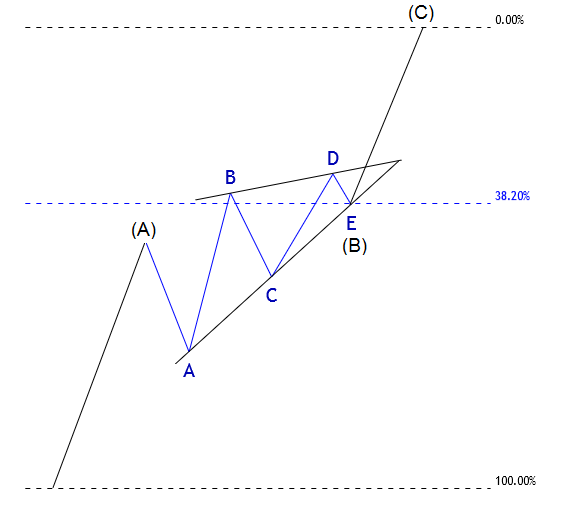
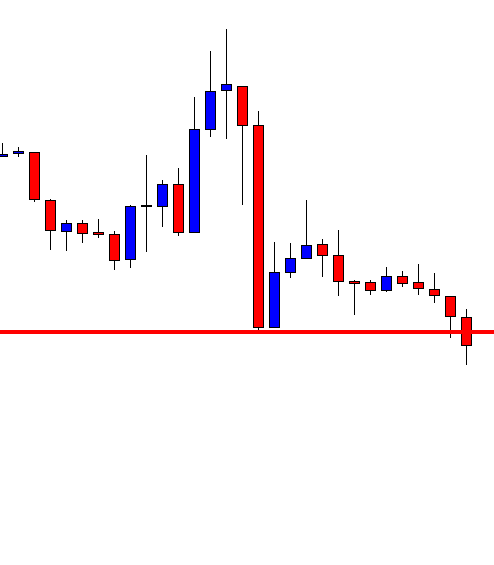
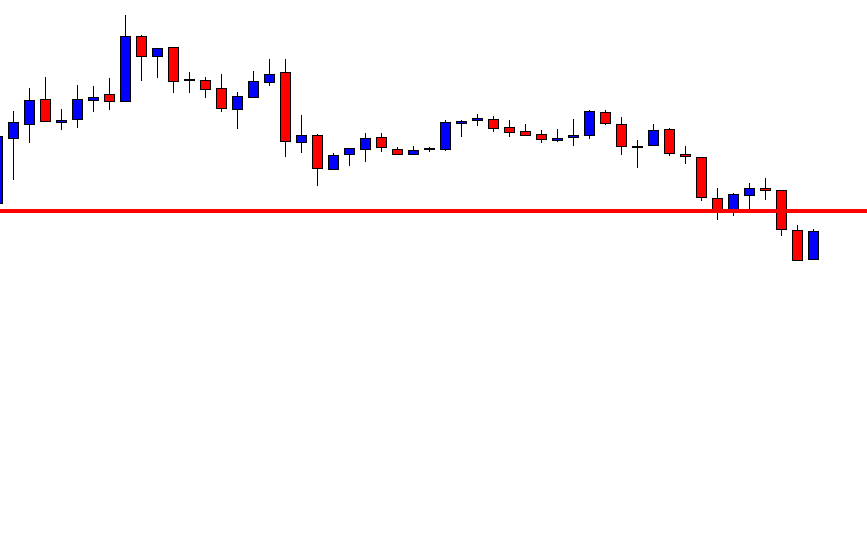
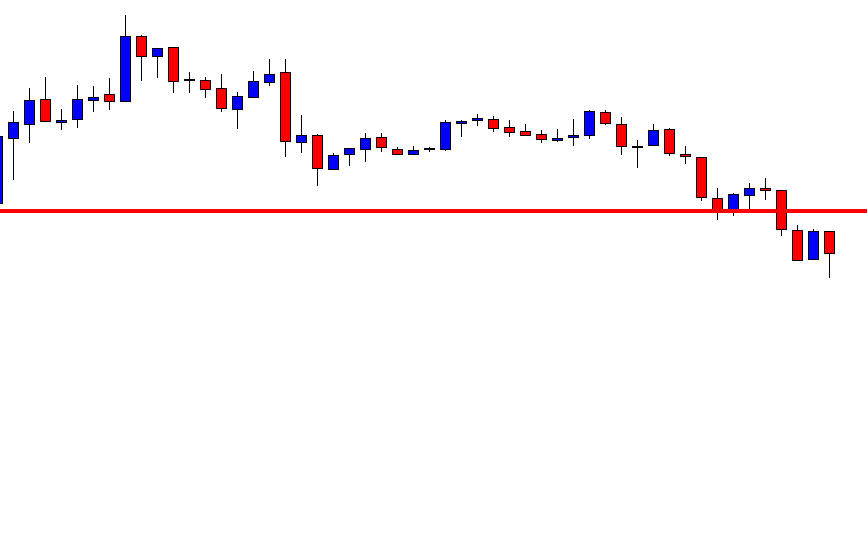
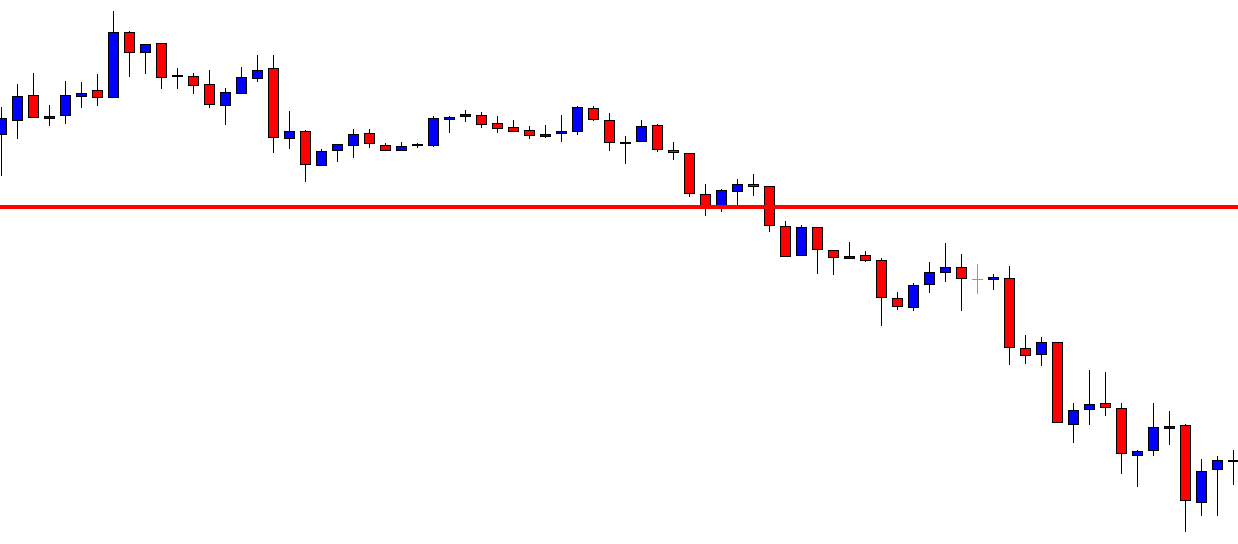
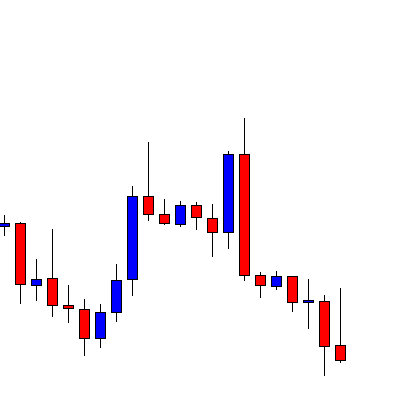
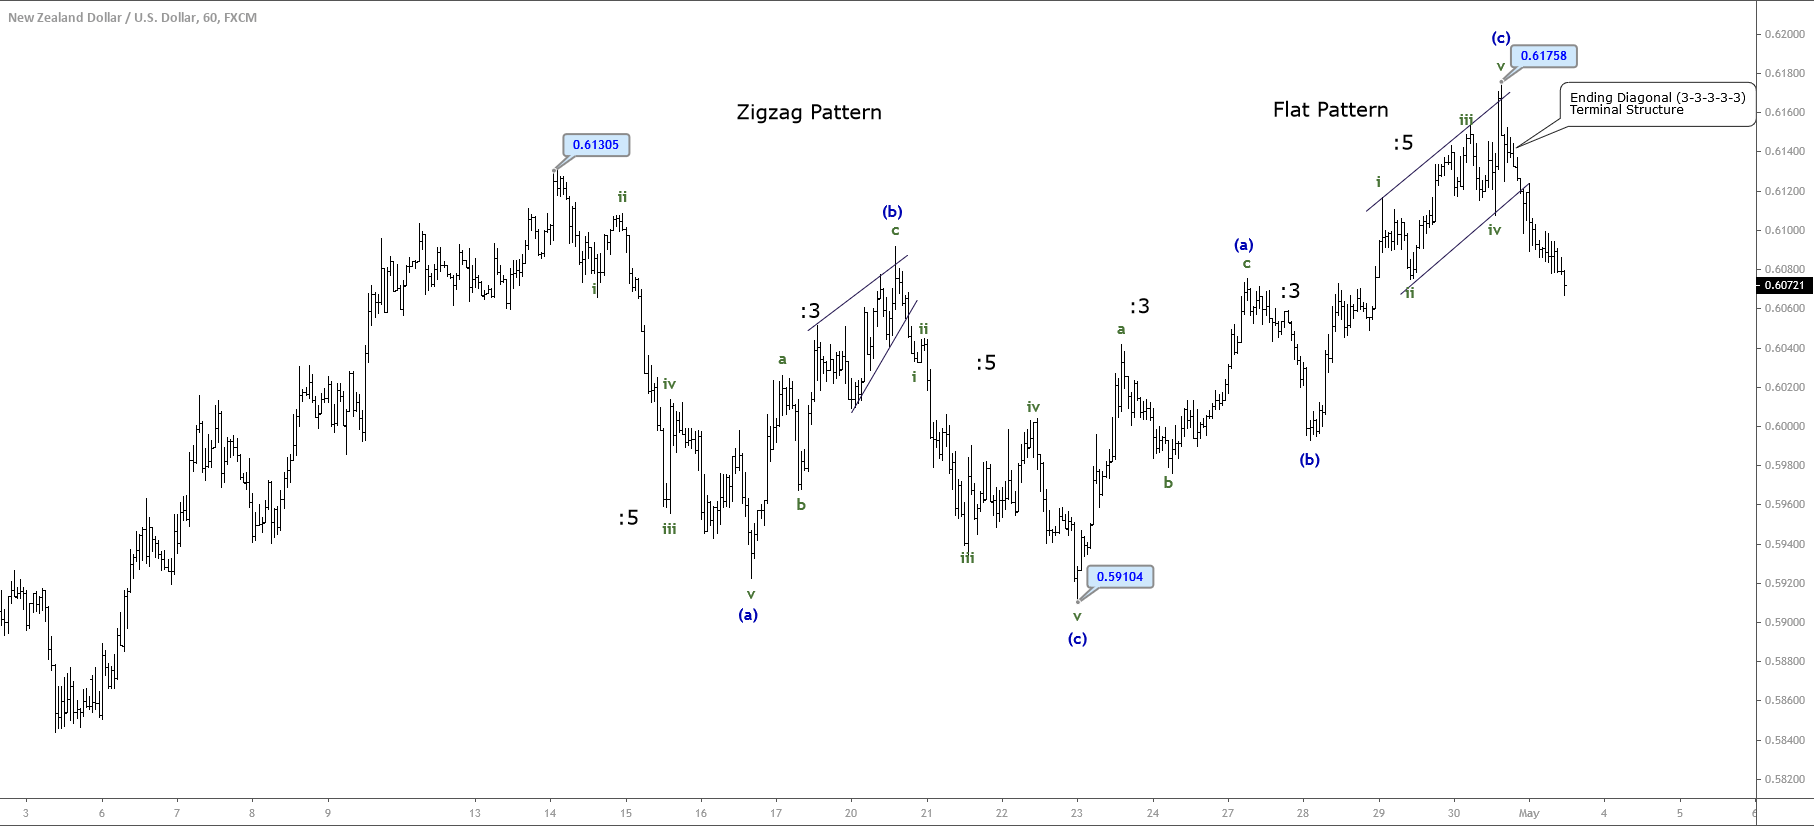
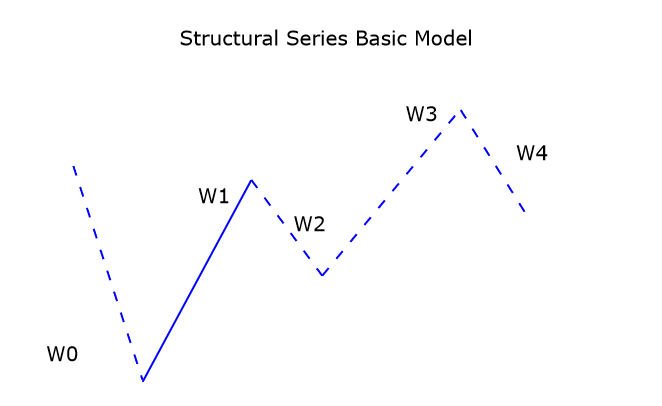
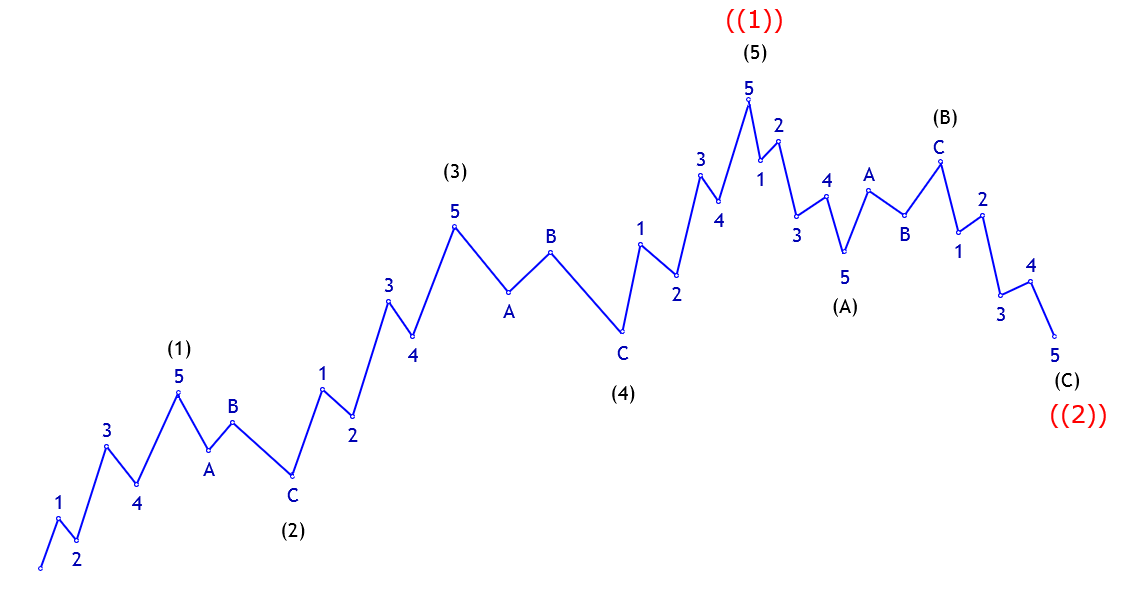
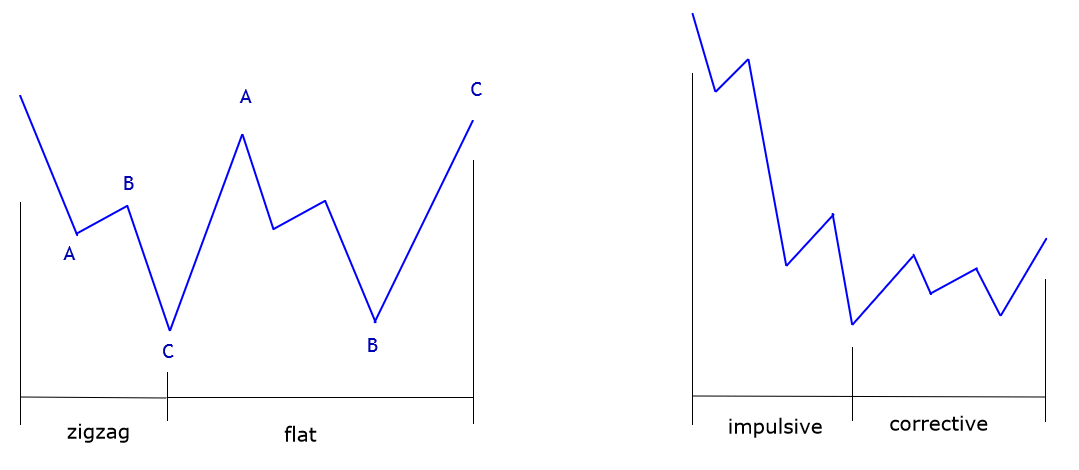
The triangle pattern is the third basic model of the corrective structures defined by R.N. Elliott. The triangle contains five internal segments and tends to appear in waves 4 and B. 

Glenn Neely, in his work “Mastering Elliott Wave,” expands the definitions of contracting and expanding triangle introduced by Elliott proposing two subcategories identified as non-restricting and restricting. 

In this educational article, corresponding to the third of four parts, we’ll present the triangle pattern variations and its implications in the wave analysis. In particular, we’ll discuss the contracting triangle pattern and its restrictive subcategory.

Contracting Triangles

This type of triangle is the most frequently identified in the real market. In this group, there are two types of triangles, restrictive and non-restrictive contracting triangles.

Restrictive Contracting Triangle

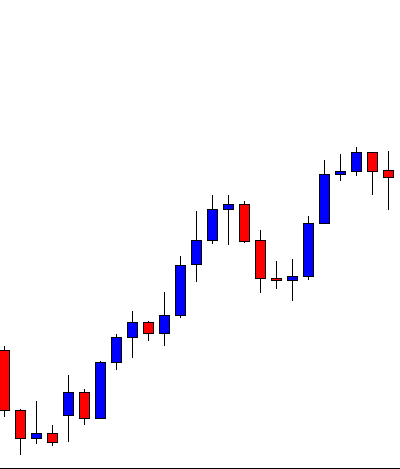
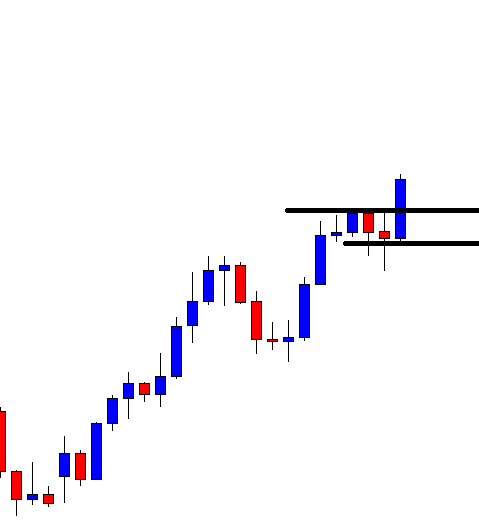
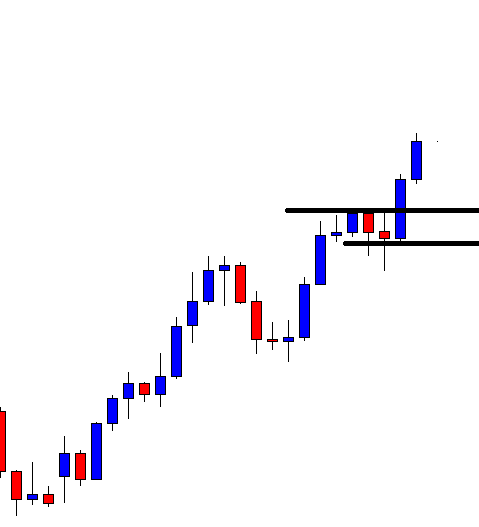
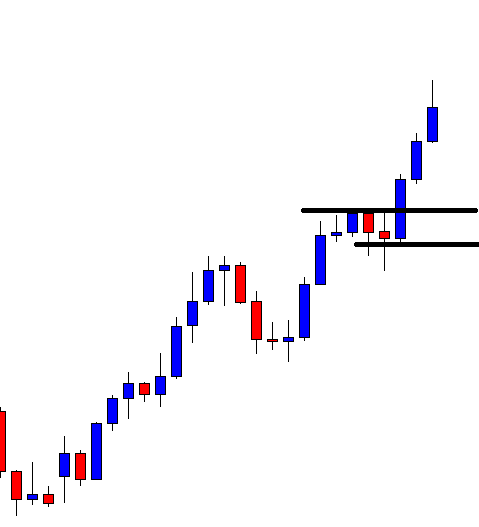
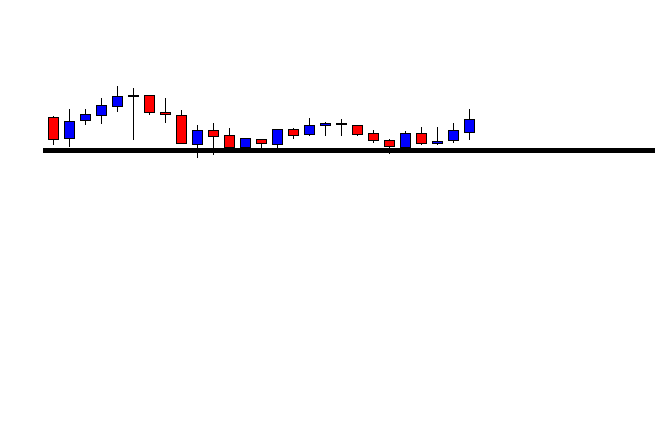
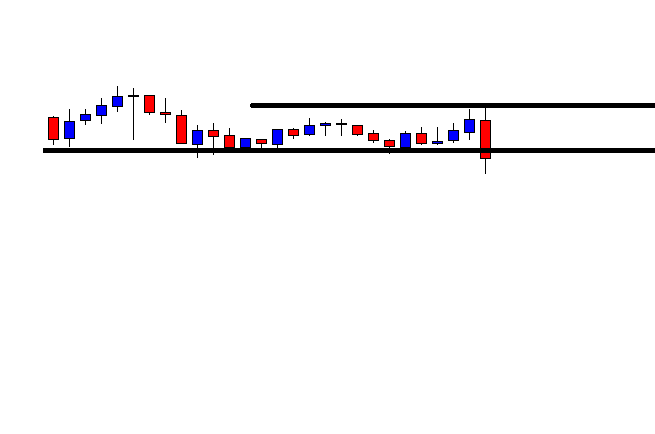
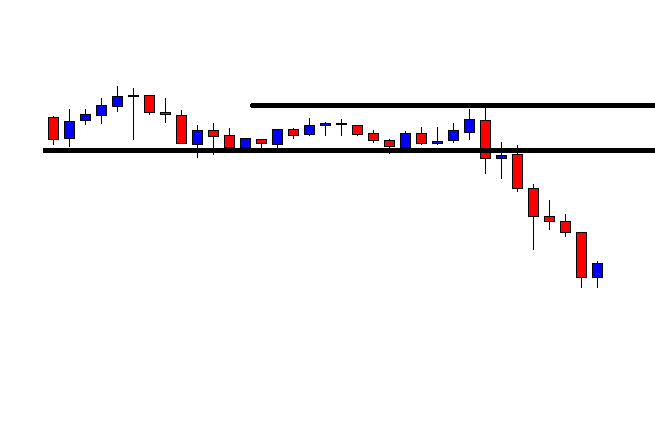
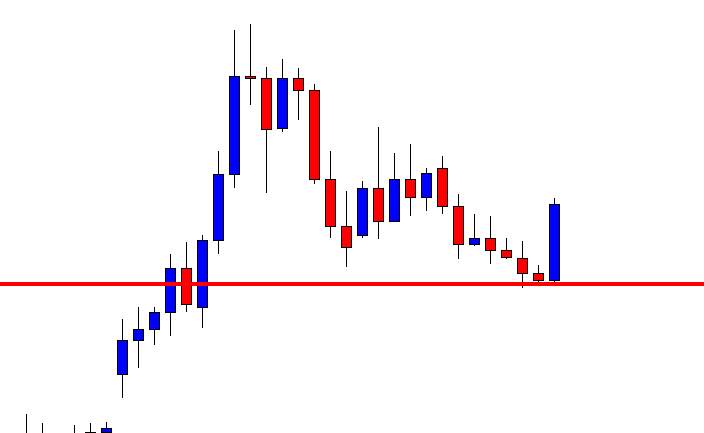
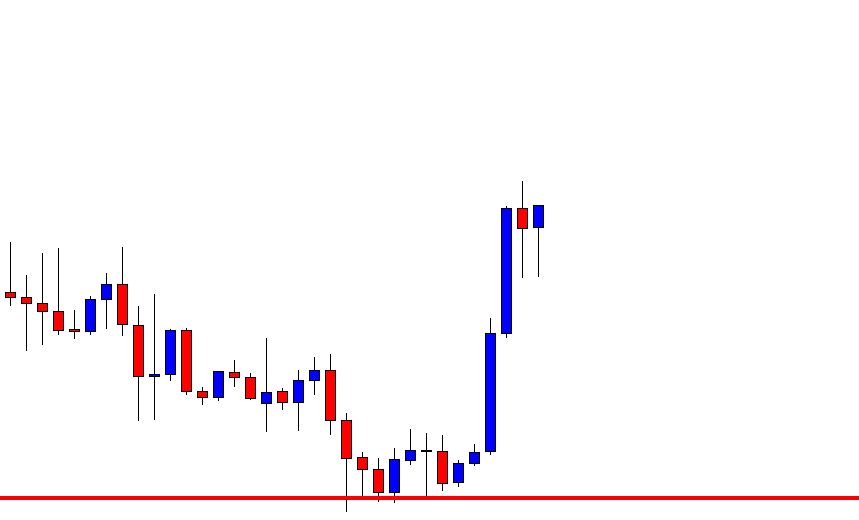
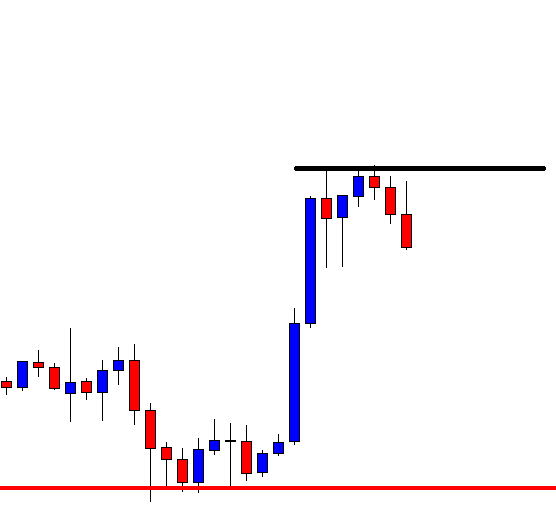
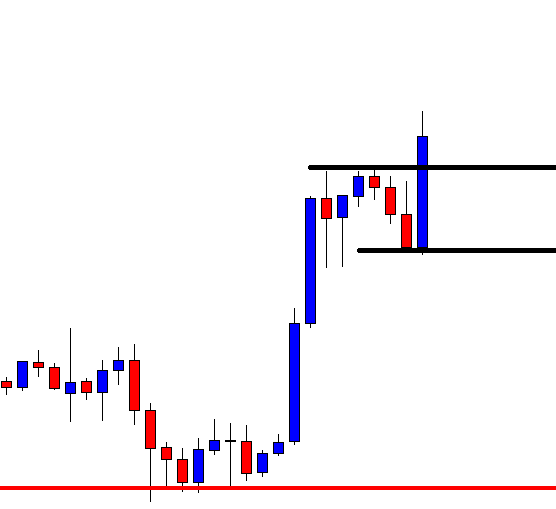
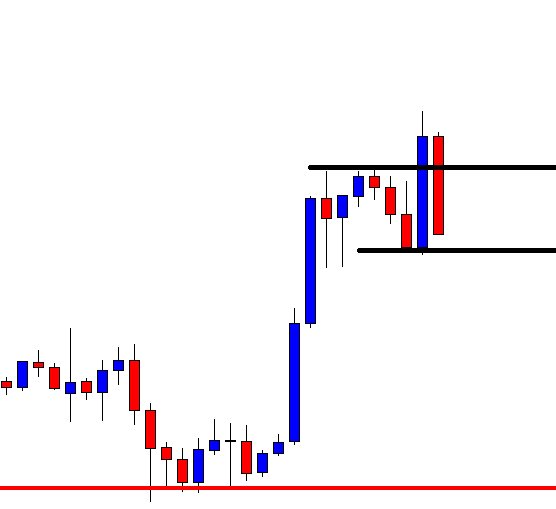
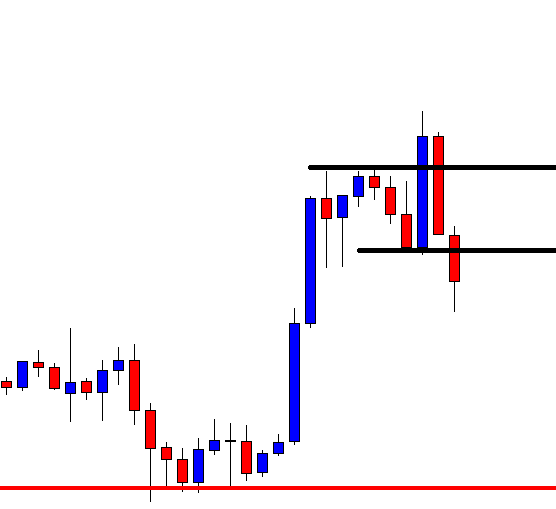
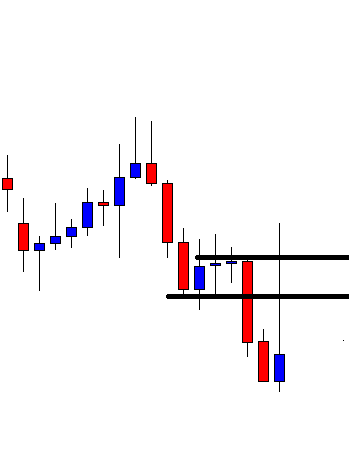
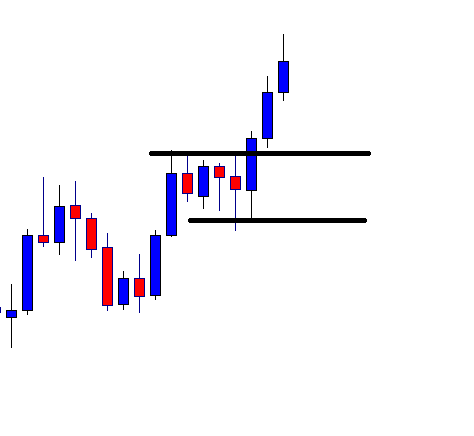
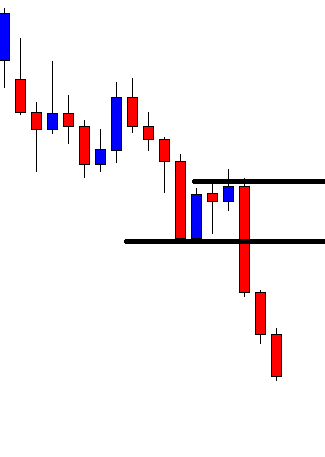
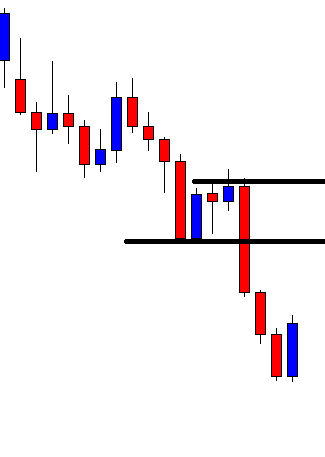
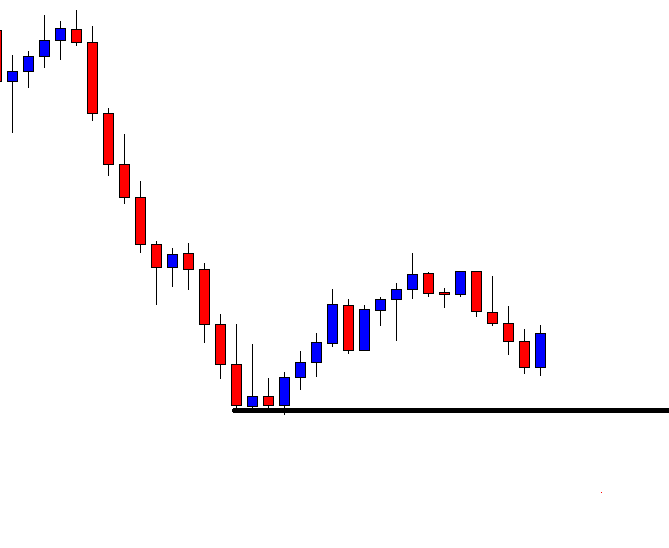
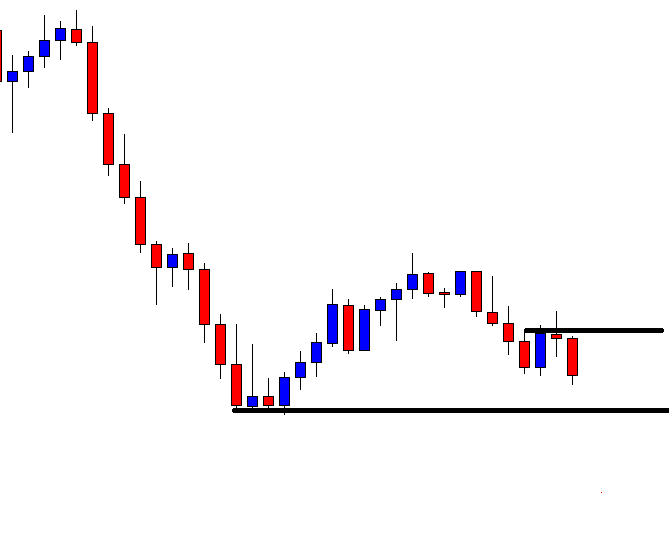
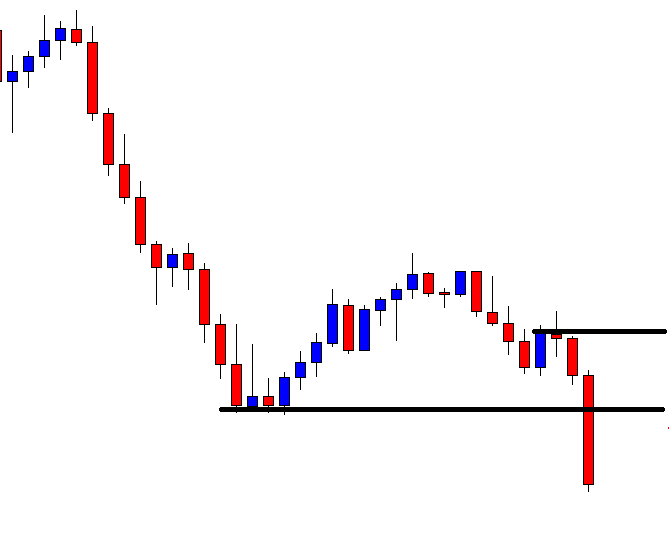
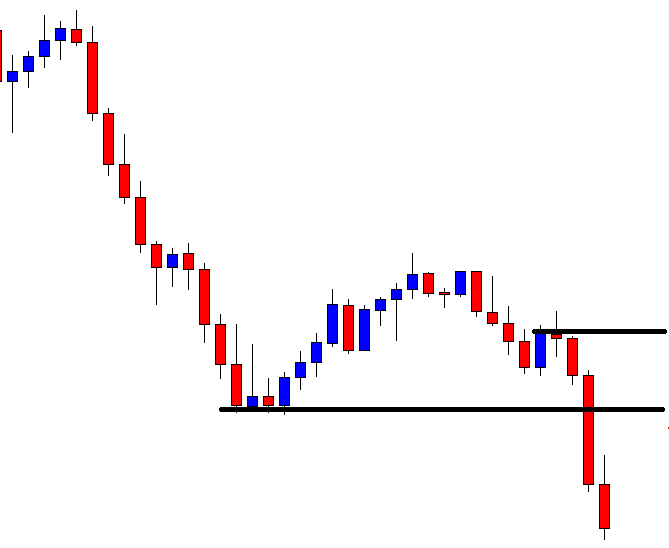
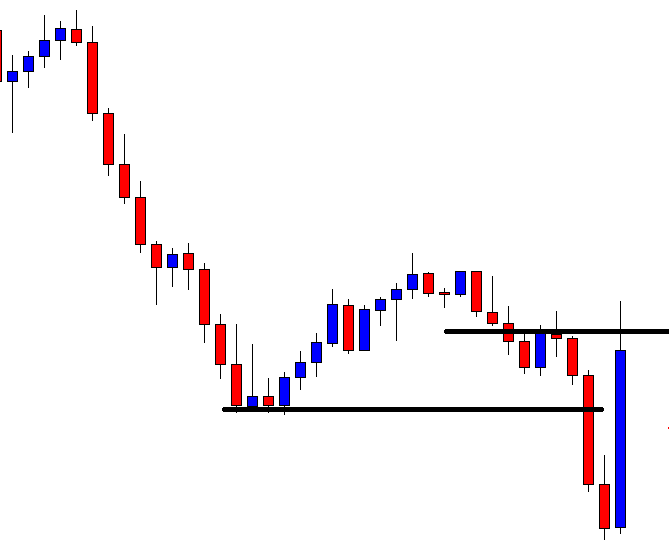
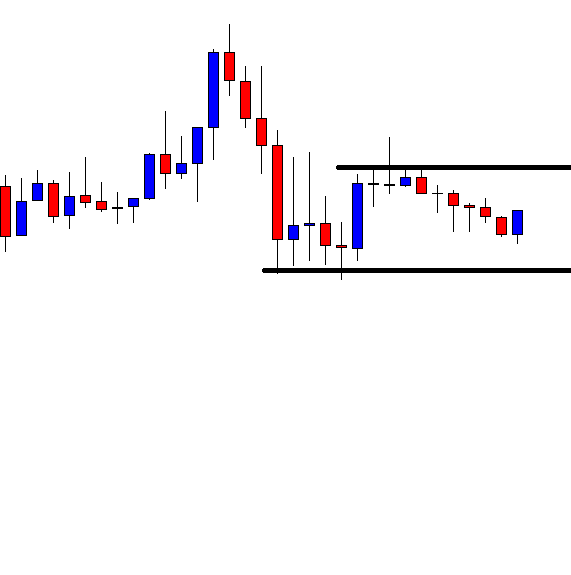
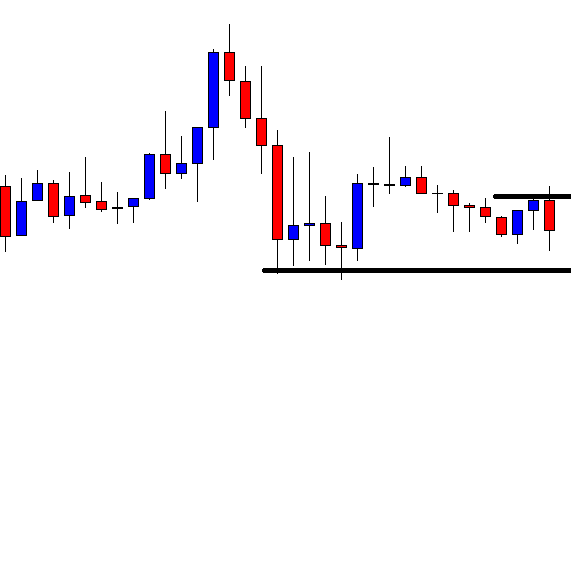
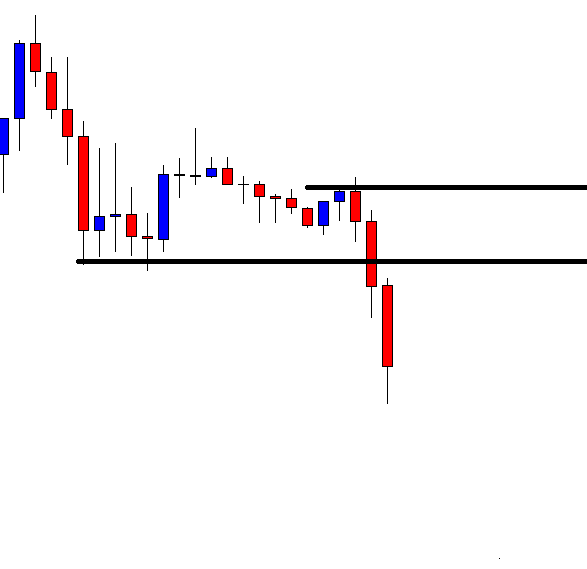
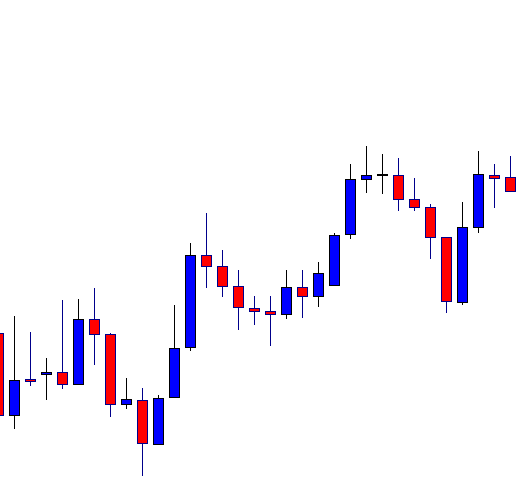
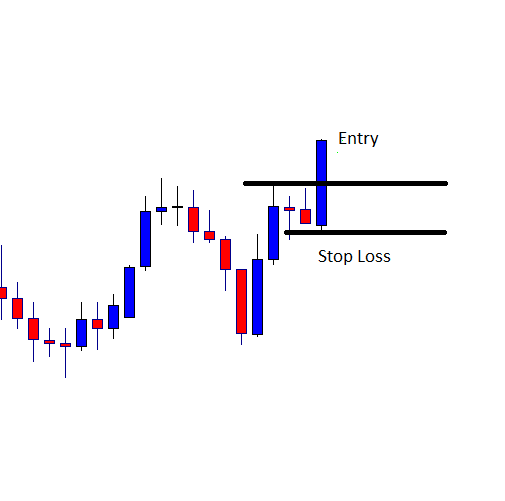
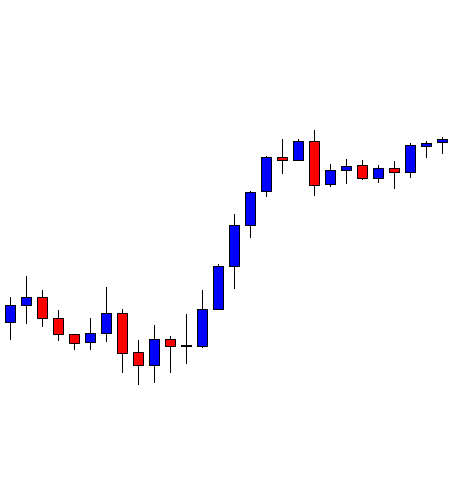
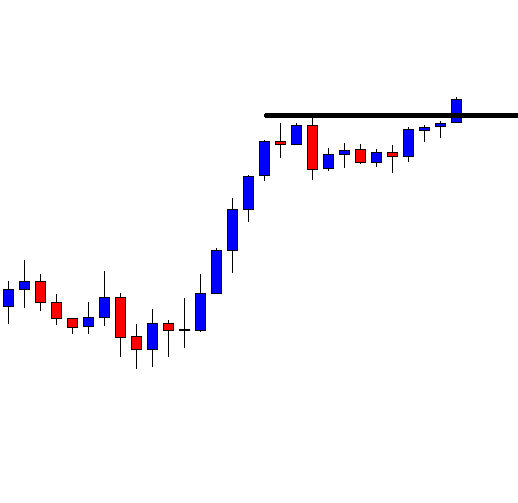
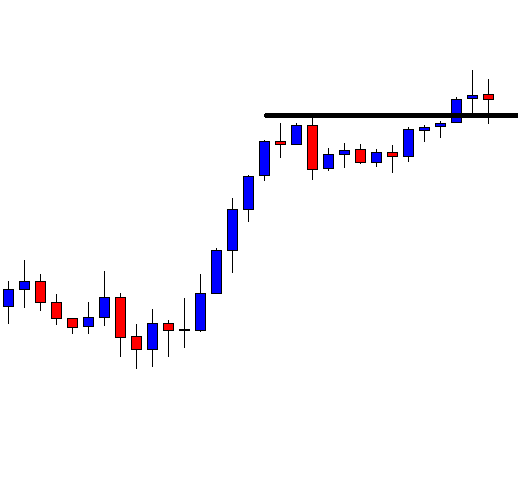
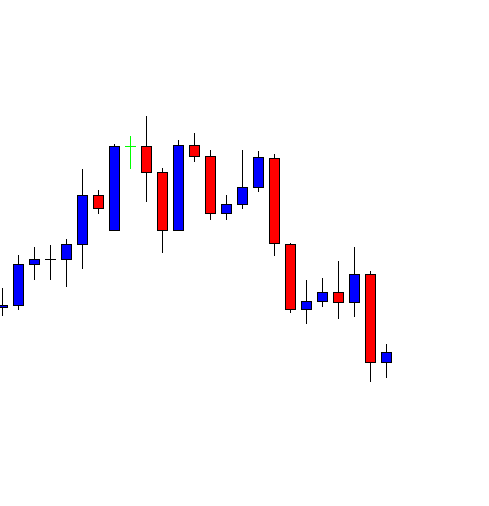
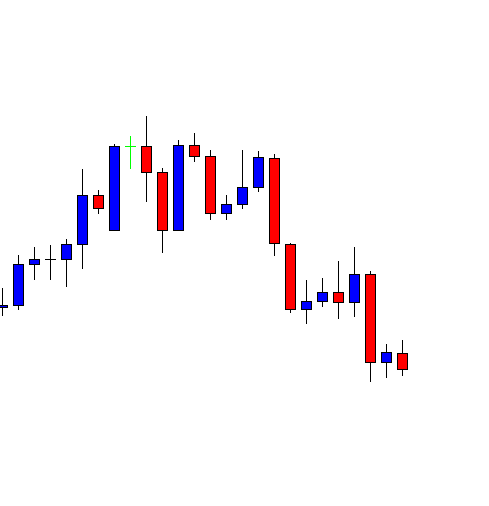
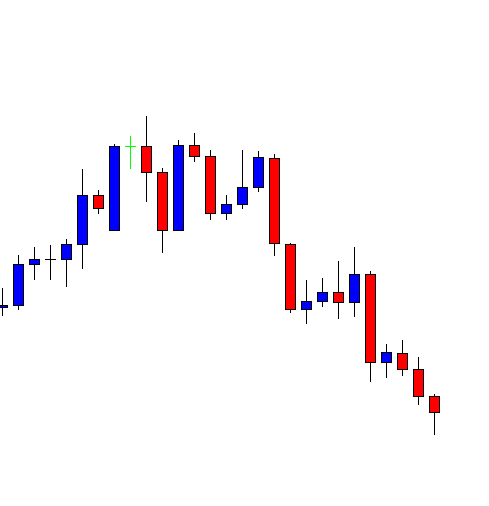
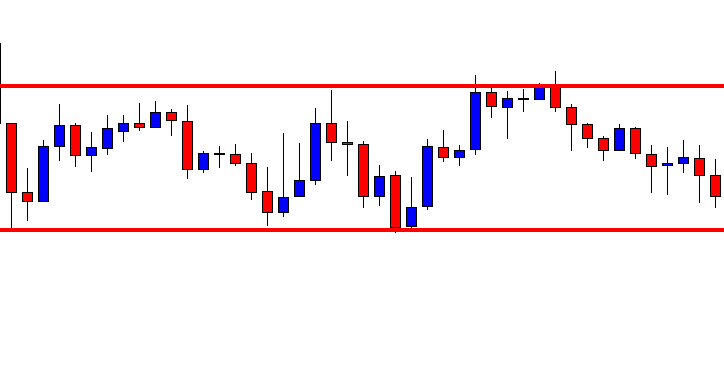
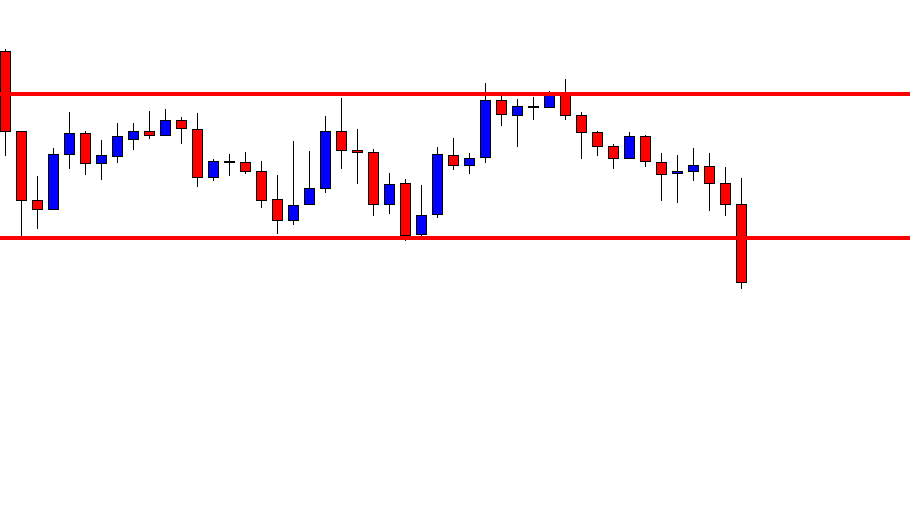
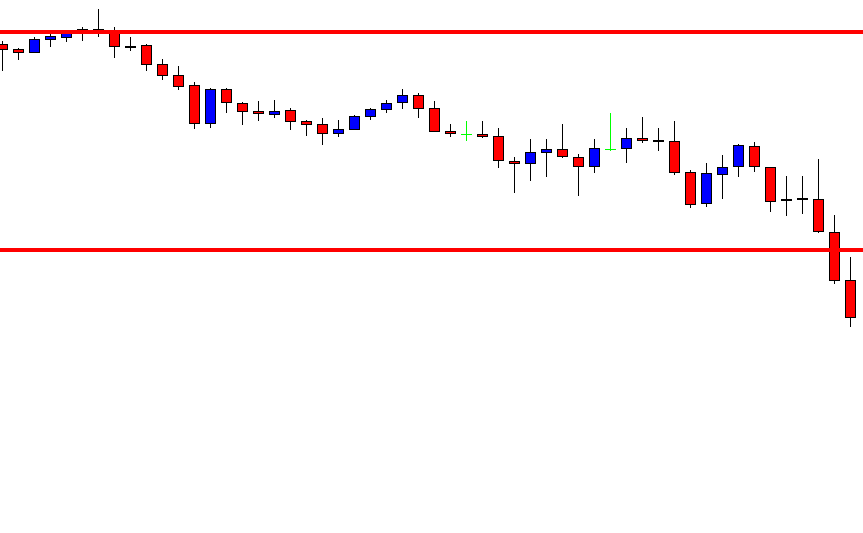
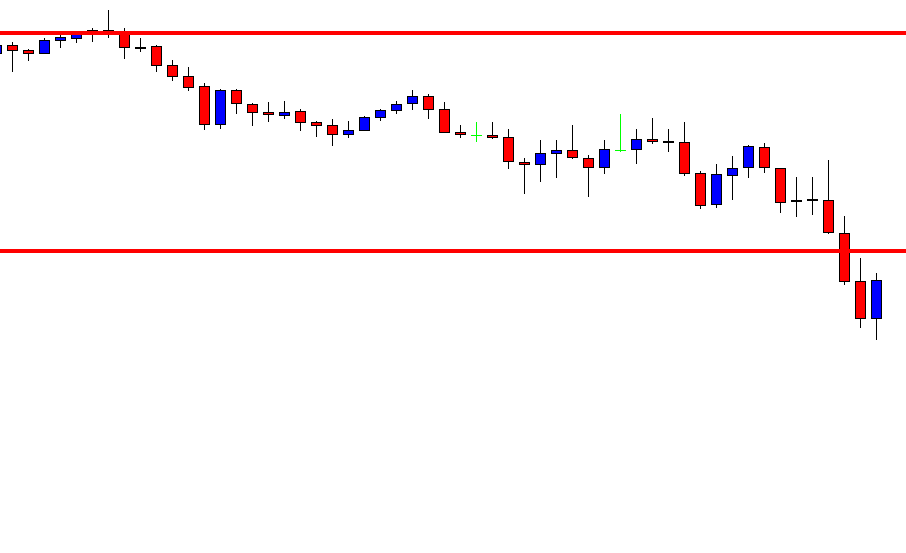
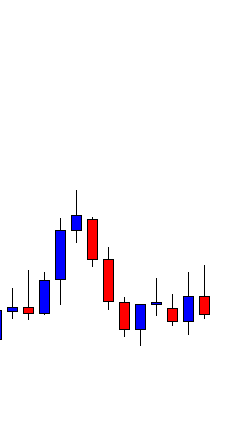
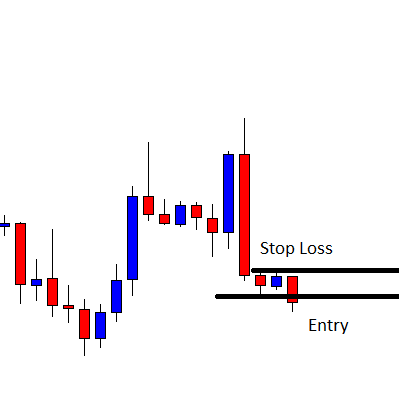
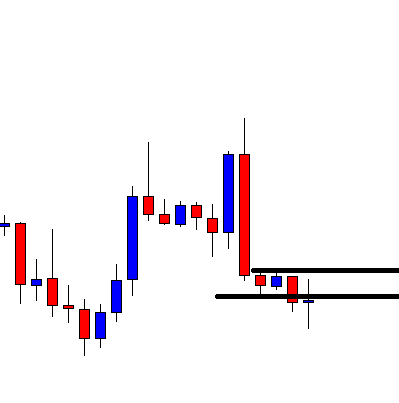
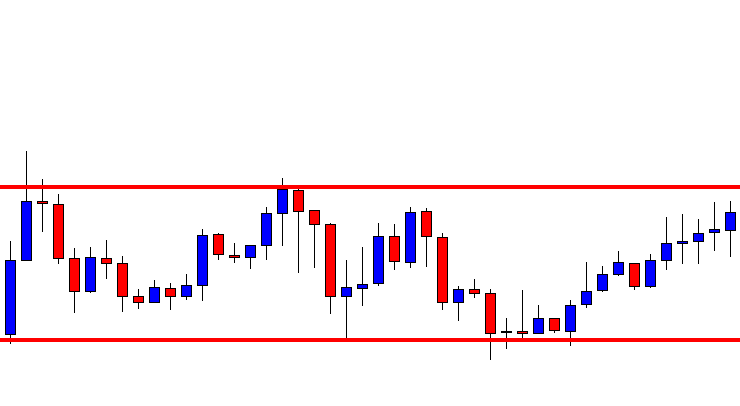
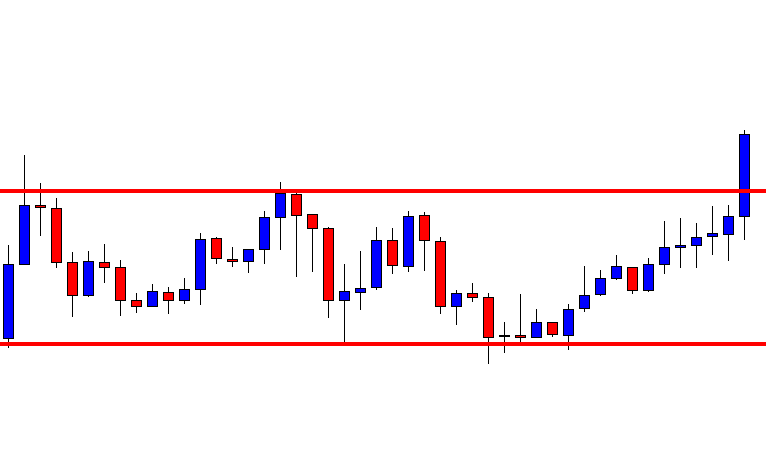
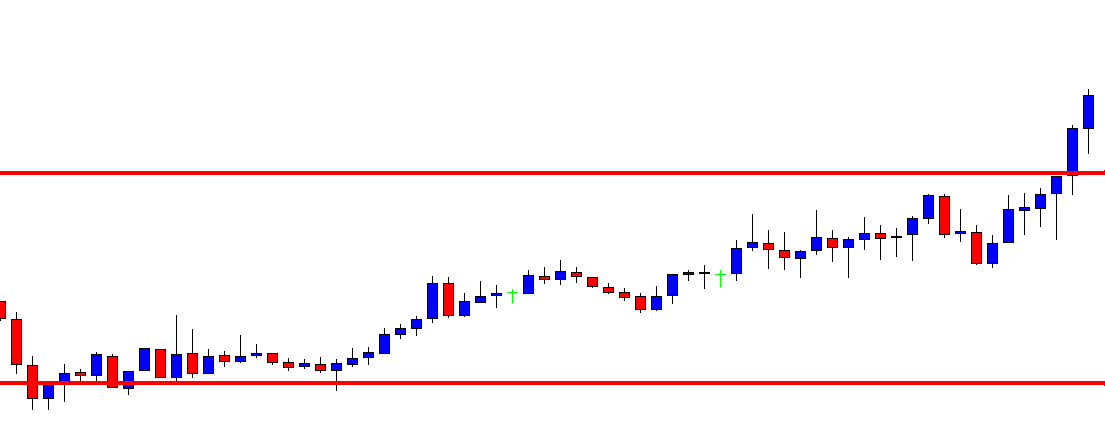
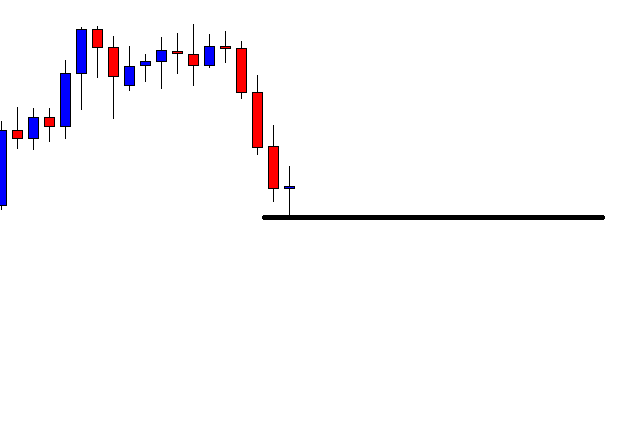
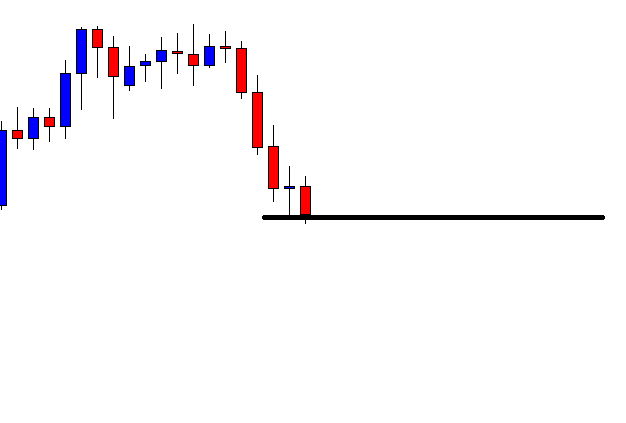
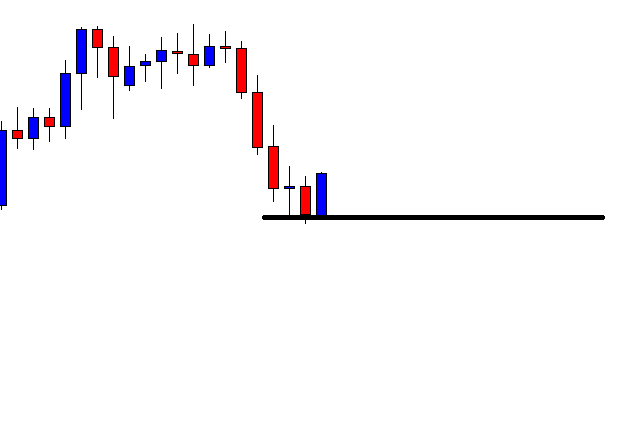
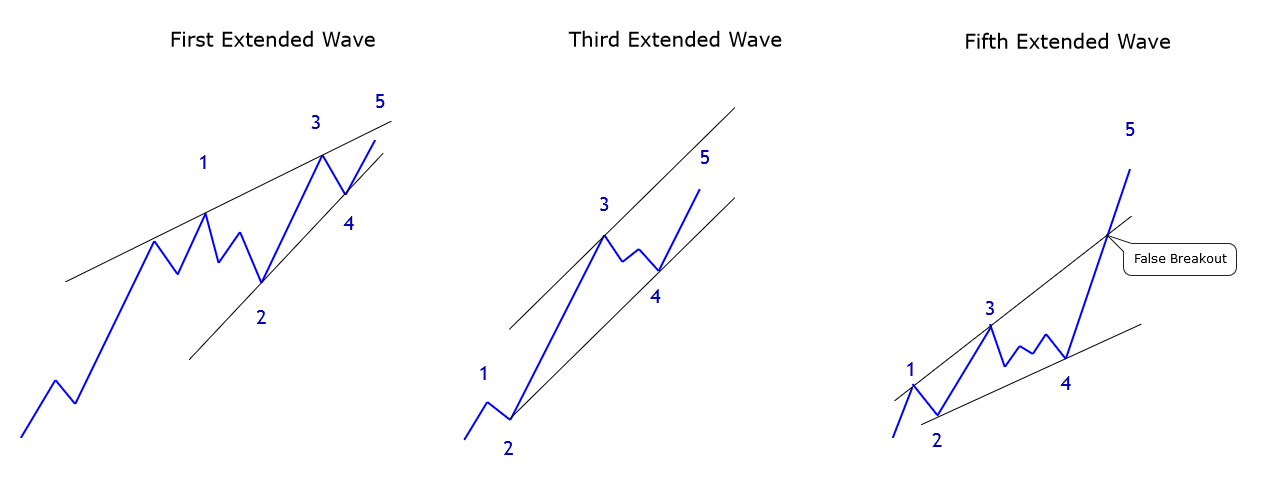
All contracting triangles have a similar shape in its construction. The main characteristic is that wave E ends before the apex of the triangle. The apex tends to occur in a range of 20% to 40% of the total triangle time extension. 

Concerning the thrust, in restrictive contracting triangles, it is limited by the most extended segment of the triangle (25% approx.) This type of triangles corresponds to the formations described by Elliott in his Treatise. Moreover, these patterns tend to appear in waves 4 and B.

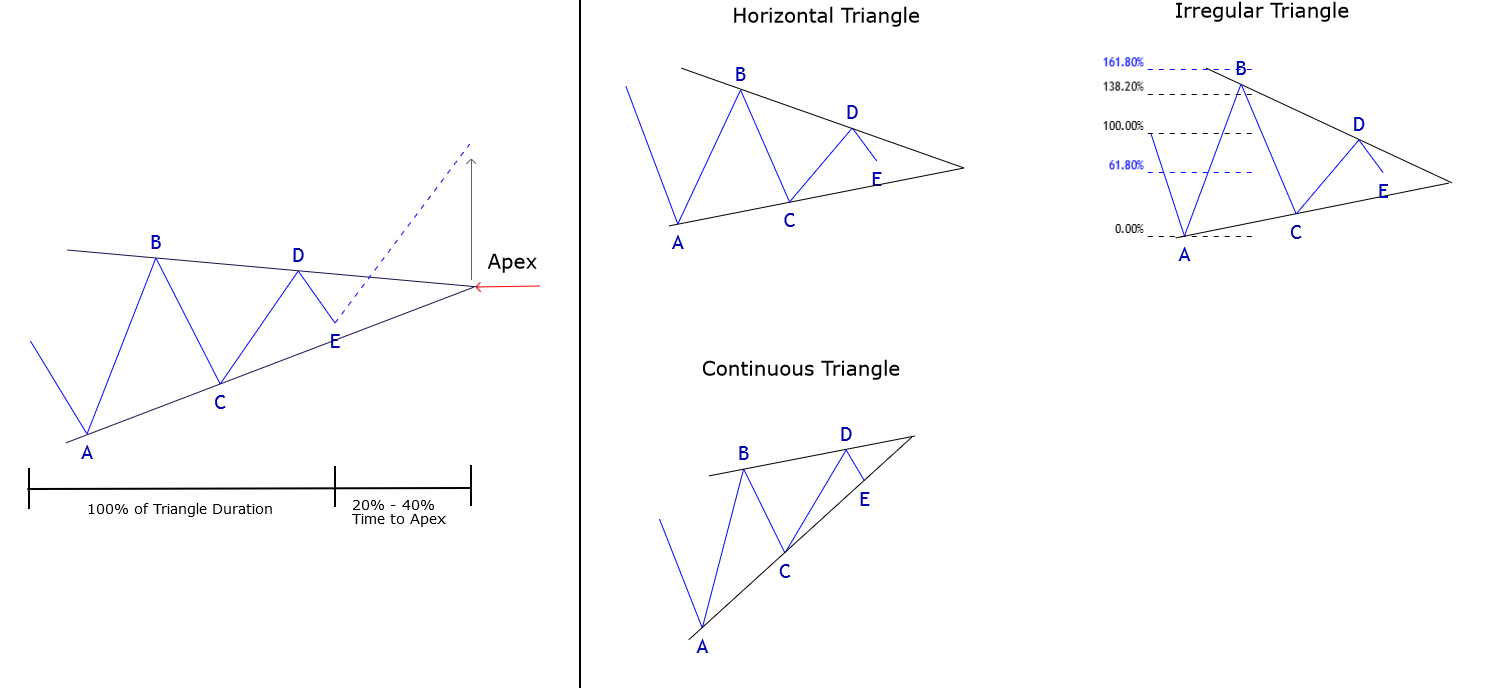
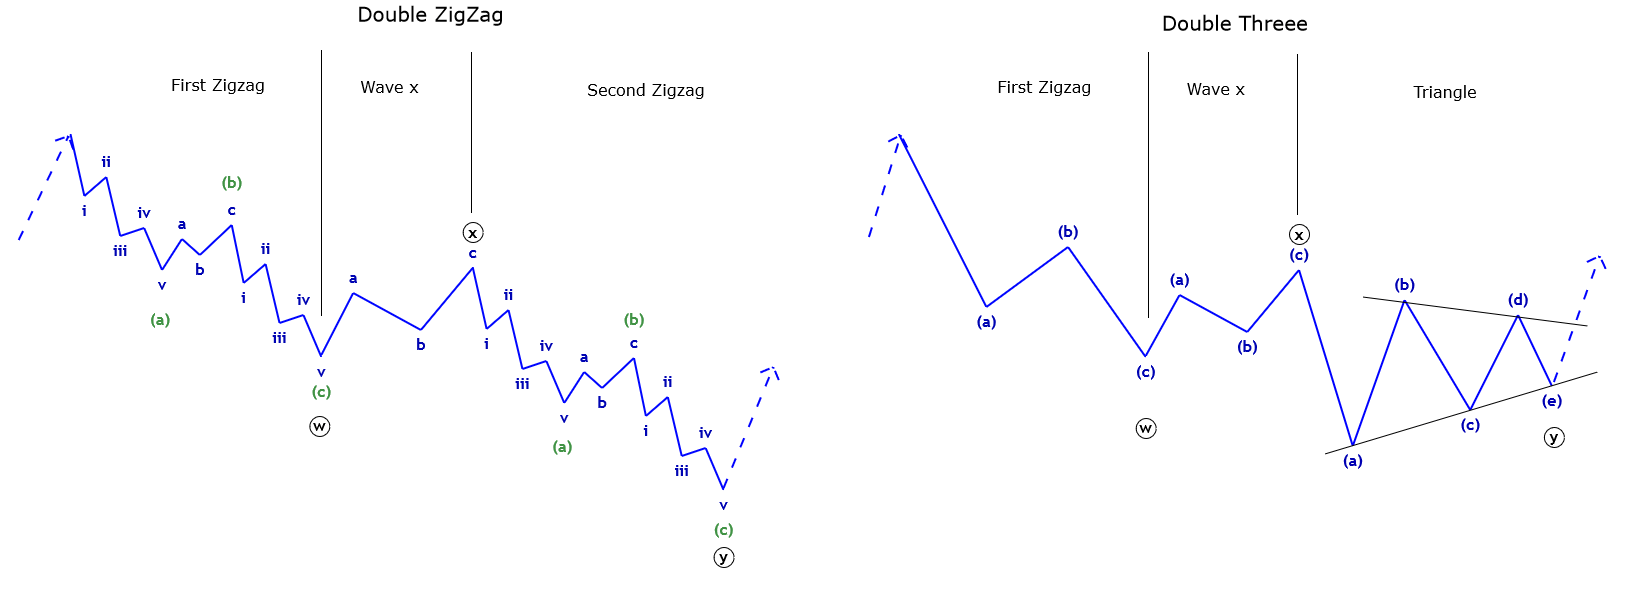
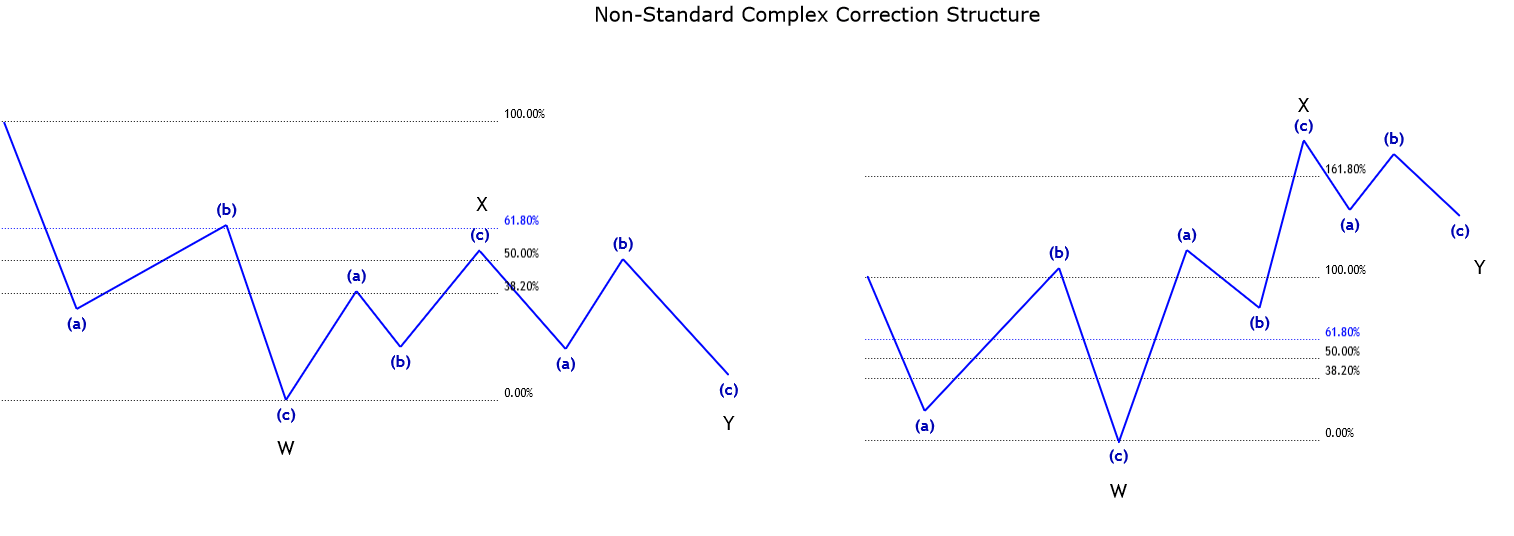
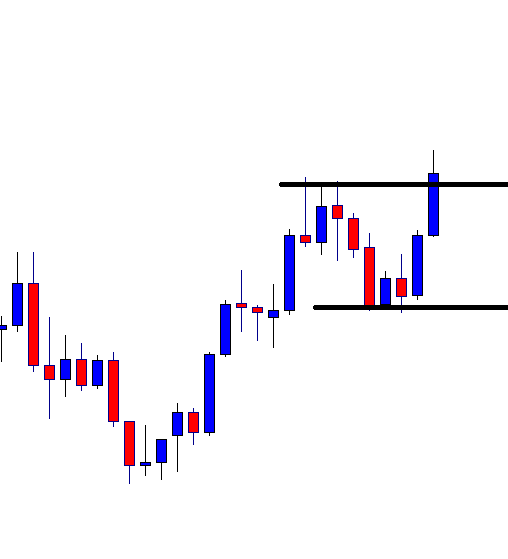
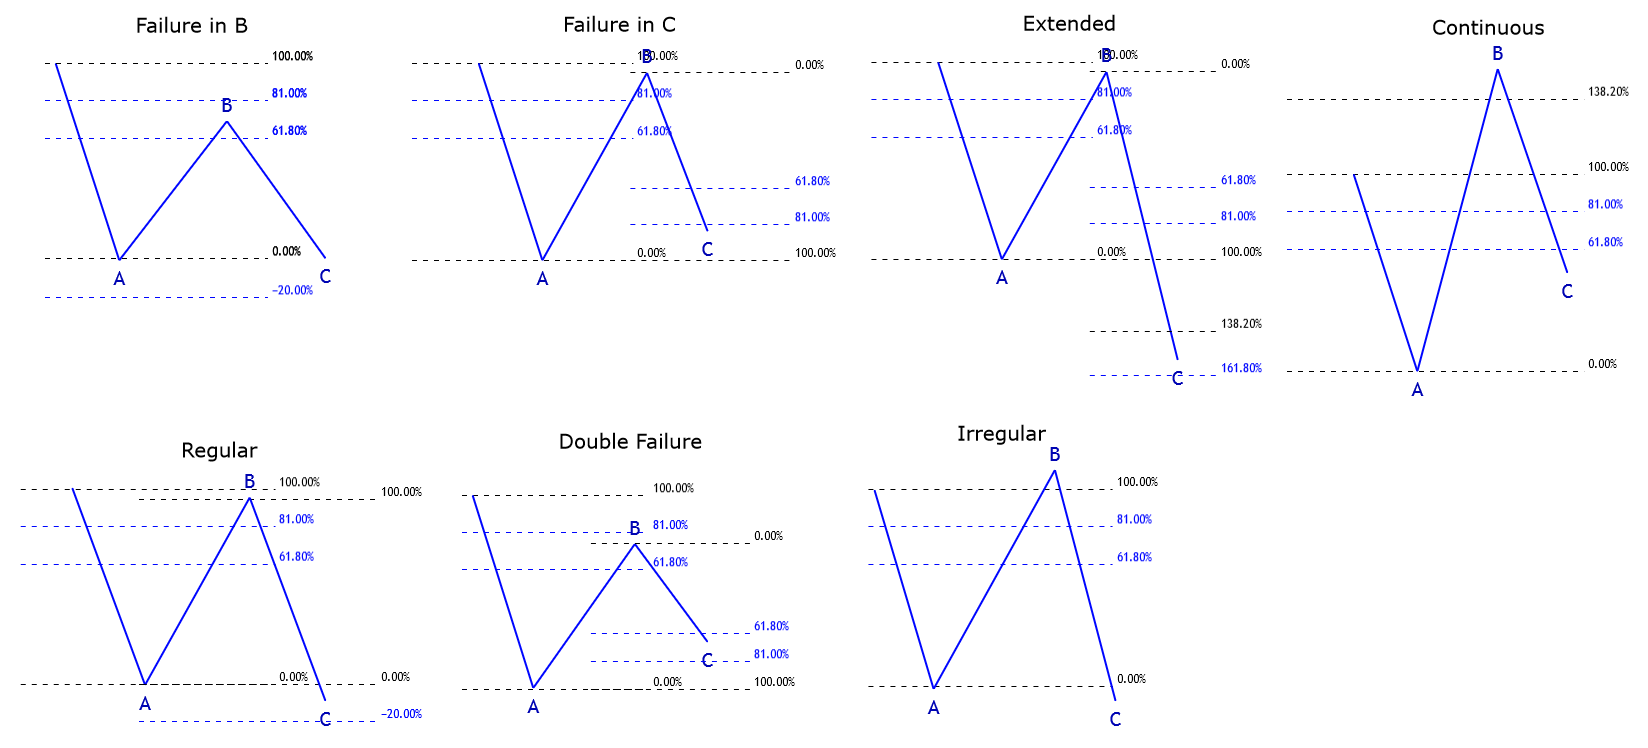
  • Horizontal Contracting Triangle. Each segment must measure at least 38.2% of the previous segment, except for wave E. Wave B can’t be more than 261.8% of A, wave C can’t extend more than 161.8% of B. Wave D must be shorter than wave C, and wave E must be shorter than wave D.
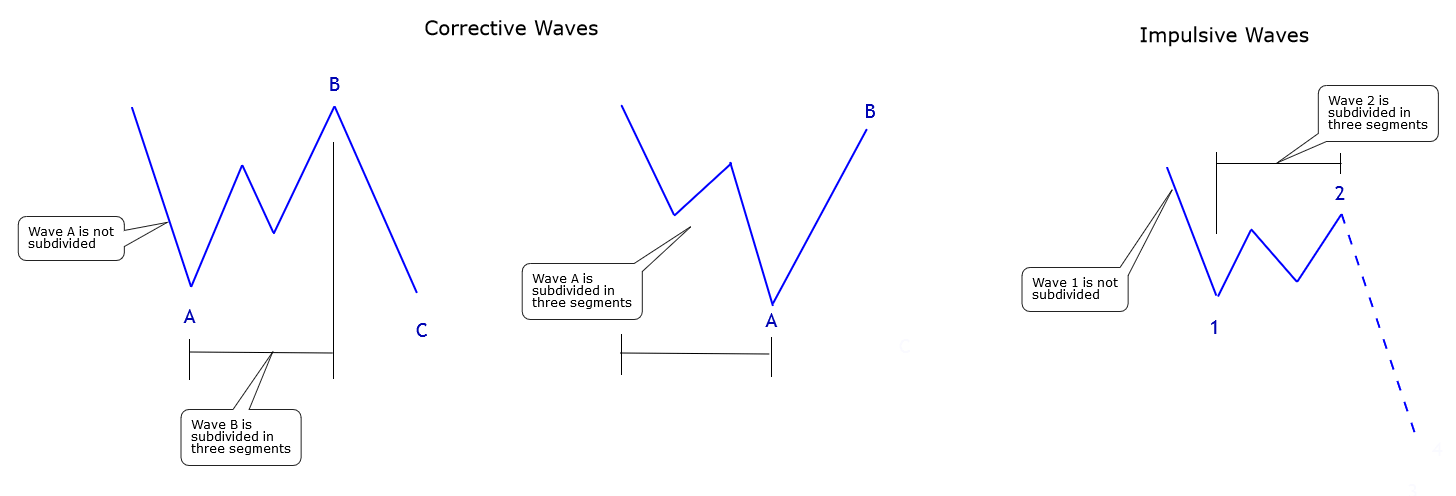
    1. Wave A. This wave will not necessarily be the largest in terms of the price of the triangle. Likewise, it will not be the shortest wave of the pattern.
    2. Wave B. In this case, if wave B is shorter than wave A, then the rest will be shorter. If the wave is longer than wave A, there are a few possibilities that wave C will be longer than wave B, and the triangle formation corresponds to a contracting triangle. If wave C is longer than wave B, then the structure corresponds to an expanding triangle
    3. Wave C. Under a few circumstances, wave C could get longer than wave B. If this scenario occurs, then the base-line should be traced connecting waves C and E.
    4. Wave D. This wave must be shorter than wave C, although it could last longer than wave C.
    5. Wave E. This one must be the shortest wave of the triangle pattern.
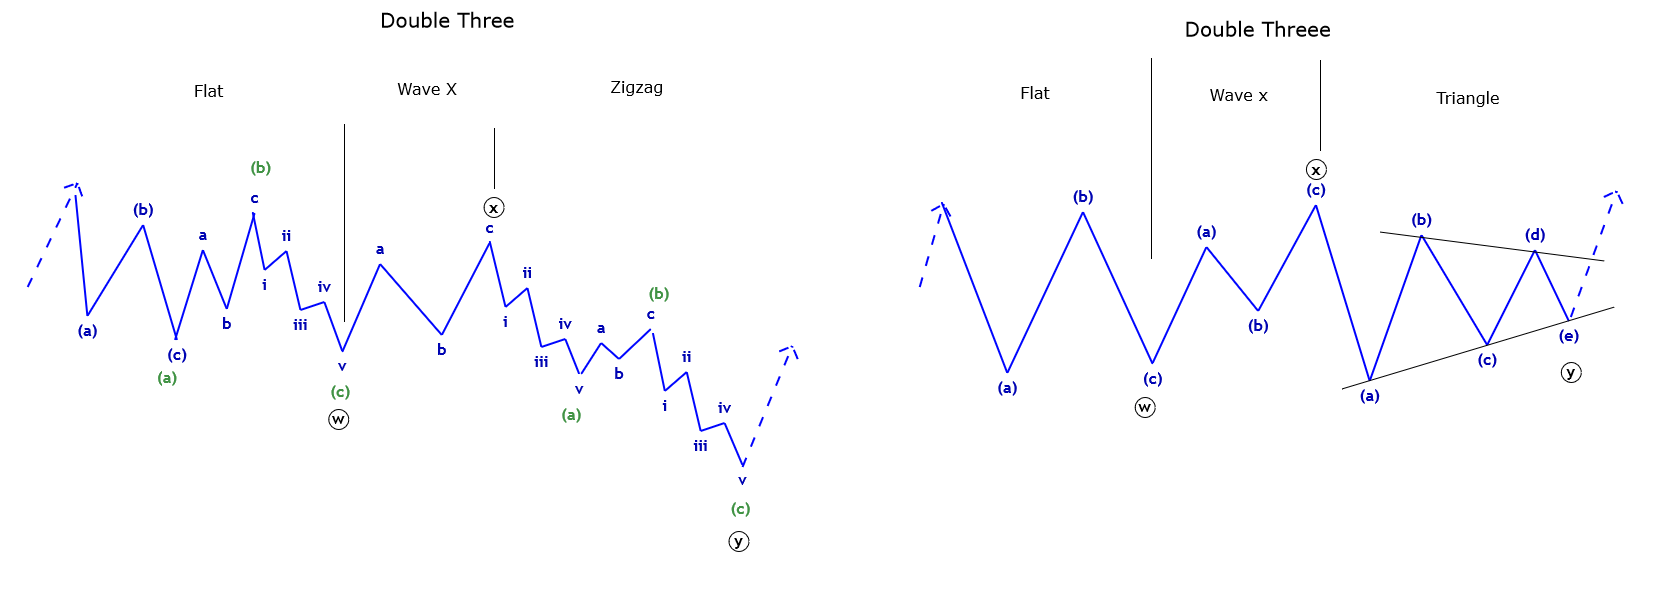
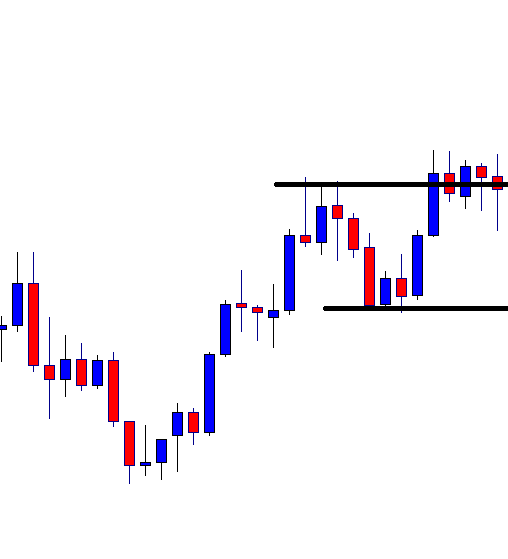
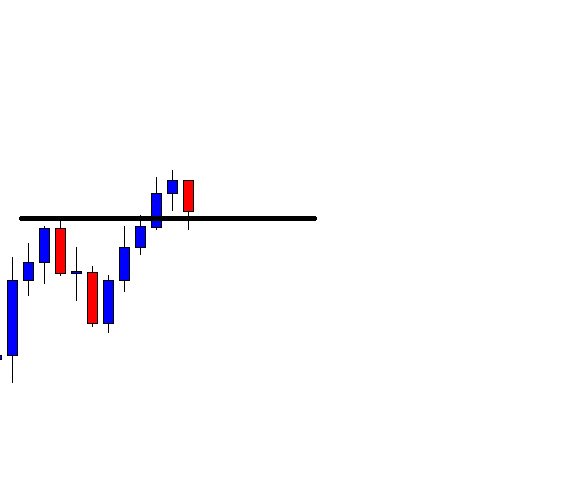
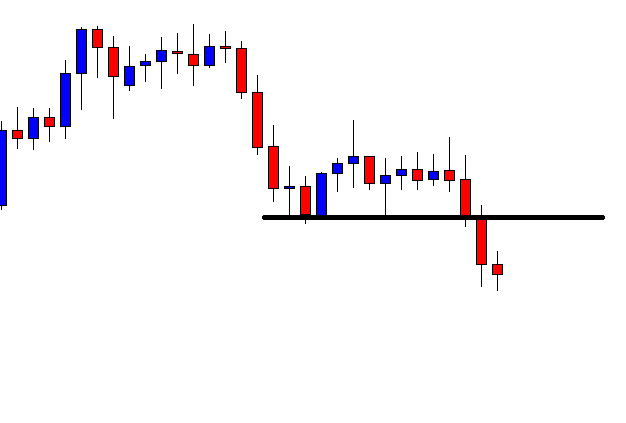
  • Irregular Contracting Triangle. This variation is characterized by wave B being the most extended of the structure.
    1. Wave A. In this case, wave A will tend to be shorter in terms of time than wave B. The extension of wave B should be longer than 161.8 of wave A. Wave A could be any corrective pattern except for a triple zigzag or an extended flat.
    2. Wave B. This wave should be the largest wave of the entire formation, extending until 161.8% of wave A, but never beyond 261.8%. Wave B tends to be a zigzag or a double zigzag.
    3. Wave C. This wave will be shorter than wave B and should retrace at least 38.2% of wave B. Wave C could be a zigzag, flat, or an extended flat.
    4. Wave D. This wave will be shorter than wave C and should retrace at least 38.3% of wave C. Wave D could be any corrective pattern that alternates with wave C.
    5. Wave E. This wave will be the shortest wave of the triangle pattern in terms of price. Generally, wave E will tend to be a triangle pattern.
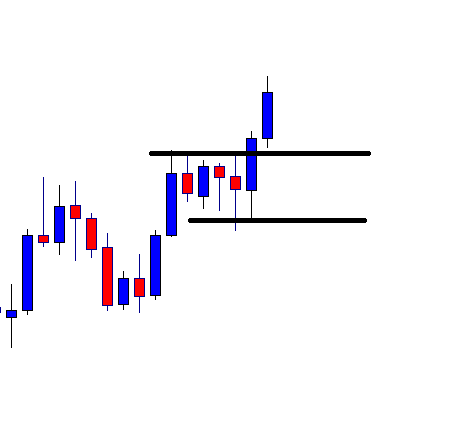
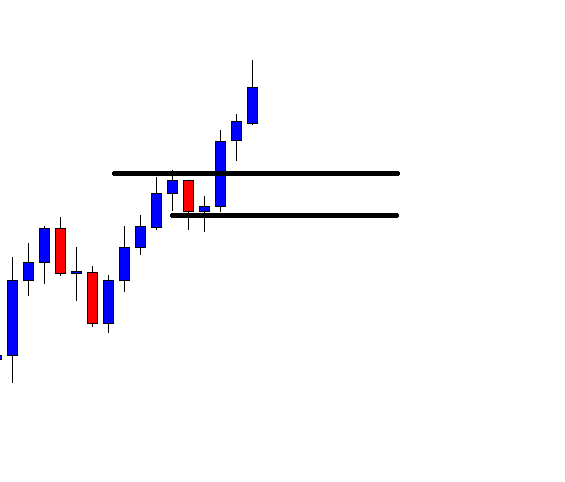
  • Continuous Contracting Triangle. This pattern is detected through the advance of waves B and D. Wave B will be larger than wave A, and simultaneously, wave D will be larger than wave C. The thrust of this pattern would be at least 161.8% respect to the largest segment of the triangle.
    1. Wave A. This wave should not be lower than 38.2% of wave B. Wave A could be a flat or a zigzag, but never a triangle or a double or triple zigzag. Most of the time, wave A will be a flat pattern.
    2. Wave B. This wave must be the largest segment of the complete formation. Its formation could correspond to a zigzag, double zigzag, or rarely a triple zigzag.
    3. Wave C. This segment must be shorter than wave B, and can’t be more complex than wave B.
    4. Wave D. This segment must be larger than wave C in terms of price and could be any type of corrective pattern except a triple zigzag.
    5. Wave E. This segment must be the shortest wave of the triangle. If the continuous triangle moves in wave B, this wave will frequently end at 61.8% or 38.2% of the entire movement.

Conclusions

In this educational article, corresponding to the third part of the four-part series, we presented the contracting triangle pattern under the restrictive subcategory.

The contracting triangle tends to be the most common corrective pattern in waves 4 and B. As said by R.N. Elliott in his Treatise, the knowledge of the corrective formations and its implications provides to wave analyst an advantage of the potential next move of the market.

In the next article, we’ll end this four-part present the non-restrictive contracting triangles and the expanding triangles.

Suggested Readings

  • Neely, G.; Mastering Elliott Wave: Presenting the Neely Method; Windsor Books; 2nd Edition (1990).


Categories
Forex Price Action

The Daily-H4 Combination Trading: Do Not Only Look for Reversal Candle

The daily–H4 combination traders are to wait for the daily chart to produce a reversal candle first to look for entry. Once the chart produces a daily reversal candle, traders are to flip over to the H4 chart; wait for consolidation and an H4 reversal candle to trigger an entry. We must not forget that if the daily chart is trending, the daily-H4 combination trading strategy may offer entry as well. In today’s lesson, we are going to demonstrate an example of that.

This is a daily chart. The pair produced a bullish engulfing candle and three more bullish candles followed. The daily-H4 combination traders are to keep their eyes on the pair right after it produces that bullish engulfing candle. Let us assume on the fourth day, we flip over to the H4 chart as well.

This is how that H4 chart looks. The chart shows that after making a bullish move, the price starts having consolidation. The last candle comes out as a bearish pin bar. It seems the chart may take time to produce a bullish reversal candle to offer a long entry. Then again, we never know. It may be just around the corner.

The char produces a good-looking bullish engulfing candle closing well above consolidation resistance. The buyers may trigger a long entry right after the last candle closes by setting stop loss below consolidation support and by setting take profit with 1R. Let us move to the next chart to see how the trade goes.

The price consolidates again. After producing such a good-looking signal candle, it seems a bit unusual. The last candle has a bearish body but it has a long lower shadow. Be patient and see what the price does next.

Look at the last candle. It comes out as a bullish engulfing candle. This is a strong sign that the price may head towards the North now. As far as the last candle is concerned, the price may not take too long to hit the target.

As expected, the price heads towards the North with good bullish momentum. It produces only one bearish candle before hits the target. As it seems, a bearish inside bar followed by a bullish engulfing candle may push the price towards the North further. Anyway, the buyers have achieved their 1R here with ease.

The message we get from today’s lesson is that if the daily chart is trending, we may keep an eye on the H4 chart to take entries with the trend as well. If it produces a reversal candle, we may look for entries too. However, we must not look for short entries if the last daily candle is bullish and vice versa.

Categories
Forex Price Action

The H1-15M Combination Trading: Waiting for an H1 Reversal Candle Ensures Better Reward

The H1 reversal candle plays a significant part in the H1-15M chart combination trading. If the traders wait to get an H1 reversal candle, by using candle’s lower low/higher high, they get a better risk-reward. In a bearish market, a trader needs to wait for an H1 bearish reversal candle after the breakout. In a bullish market, he needs to do the opposite. In today’s lesson, we are going to demonstrate an example of a bullish market where the H1-15M chart combination offers an entry upon producing an H1 bullish reversal candle. Let us get started.

This is an H1 chart. The chart shows that the price heads towards the North with good bullish momentum. The price, then upon finding its resistance, has been in a bearish correction. It consolidates around a level and heads towards the North. The buyers are to keep their eyes on the chart with a hope that it may make a bullish breakout.

The chart shows that the last candle makes a bullish breakout closing well above the last highest high. The buyers are to wait for the chart to produce an H1 bullish reversal candle followed by a 15M bullish candle to trigger a long entry. Let us keep watching the chart to get that H1 bullish reversal candle.

The chart shows that it produces two doji candles. It means the price has been in bearish correction at the minor charts. An H1 bullish reversal candle at the breakout level would be the ‘getting ready’ signal to go long in the pair.

Look at the last candle. The last candle comes out as a bullish candle forming at the breakout level. The buyers are waiting for the chart to produce such a candle. They may flip over to the 15M chart now. Let us flip over to the 15M chart.

The last candle comes out as a bearish inside bar. Since the H1 candle closes as a bullish candle, so a 15M bullish candle is the signal to trigger a long entry. Let us proceed to the next chart.

Here it is. The chart produces a bullish Pin Bar. The buyers may trigger a long entry right after the last candle closes. Traders may set their stop loss below the H1 bullish reversal candle’s lowest low, which is below the red-marked level. To set take profit, they may use Fibonacci levels. If the price trends from 61.8%, it usually goes up to the level of 161.8%. Let us find out how this one goes.

Yes, the price heads towards the level of 161.8% with good bullish momentum. If we flip over to the 15M chart right after the breakout, we would take entry by setting stop loss below 00.00%. By waiting for an H1 reversal candle, we may set the stop loss below 38.2%. This ensures a better risk-reward. On the other hand, if we always wait to get an H1 reversal candle after the breakout, we may not get it all the time. Thus, we end up being offered less number of entries in the H1-15M chart combination trading.


Categories
Forex Daily Topic Forex Price Action

The Levels You Need to Pay Extra Attention

Support and Resistance are the two key factors of Forex trading. The good thing is in most cases time these levels can be guessed well earlier. By drawing support/resistance levels where the price reacts earlier,   we can spot those levels. This helps a trader set his stop loss, take profit and make a trading decision. In today’s lesson, we are going to demonstrate an example of how the previous levels where the price reacts earlier play a significant part as far as support/resistance is concerned.

Look at the chart carefully. The price makes a strong bearish move and makes an upside correction. The chart produces a spinning top followed by a bearish engulfing candle. If we consider the existent trend and candlestick pattern, it is a short signal. The question is whether it really is a short signal or not. Look at the next chart.

At the correction, one of the candles breaches through a level. This level was a level of support earlier. After being bearish, the level should work as a level of resistance. It does not. The price breaches through the level. In fact, it may work as a level of support again. If it produces a bullish reversal candle, the buyers are going to take control here.

The level seems to hold the price as a level of support. It produces two a bullish pin bar and a doji candle. If it produces a bullish engulfing candle here, the price may get bullish and head towards the North.

The chart produces a bullish engulfing candle closing well above the wave’s highest high. Let us calculate whether the buyers should go long here or not. The price makes a bullish move breaching a significant level. The price makes a bearish correction and the breakout level works as a level of support. As far as price action trading is concerned, traders may trigger a long entry right after the last candle closes.

As expected, the price heads towards the North with good bullish momentum. It gets the buyers 1R already. The last candle comes out as a bearish inside bar. The price may reverse now. However, there is still a 40% possibility that the price continues its bullish move. Let us assume that the buyers close the trade and cash in some profit.

If we consider the whole scenario, the market seems bearish in naked eyes. When we draw the significant level, it gives us a clearer picture of the breakout and correction. We, then realize that the market is actually bullish. A long entry at the pullback gets the buyers some green pips. This is what Support and Resistance (significant levels) do.

Categories
Forex Price Action

The H4-Daily Combination Strategy: Do not Get Carried Away

In today’s lesson, we are going to demonstrate an example of an H4-daily chart combination trading. The lesson has an important message to remember for the H4-Daily combination traders. Let us get started.

The chart shows that the price produces a double top and heads towards the South with good bearish momentum. The daily candle closes as a bearish Marubozu candle having no lower shadow at all. The next trading day starts with a Spinning Top. It seems that the H4 chart starts having consolidation. The last H4 candle comes out as a bullish engulfing candle. This looks good for the sellers that the price is having consolidation after making a good bearish move. However, the H4-Daily combination traders must not forget one thing that the signal is to be produced within the next two candles. Otherwise, it becomes daily support.

The fifth H4 candle of the day comes out as a bearish engulfing candle. The candle closes well below consolidation support. The sellers may trigger a short entry right after the last candle closes by setting stop-loss above consolidation resistance and by setting take profit with 1R.

The next candle comes out as a bullish inside bar after triggering the entry. The sellers would love to get a long bearish candle here. However, a bullish inside bar suggests that the bear still holds the key. Let us proceed to the next chart.

The next candle comes out as a bearish engulfing candle. This looks extremely good for the sellers now. The price finds another resistance. This attracts sellers to add more short positions. Anyway, the H4-Daily combination traders are to wait for the price to hit their 1R take profit.

The price takes two more candles to hit the target. I would say that the price hits the target at a moderate pace here. Anyway, the H4-Daily combination strategy offers entry, and the trade setup works well for the sellers.

The message this lesson has is that we must not get carried away with bullish or bearish move followed by consolidation. The H4 chart is to produce a trade signal within the next day. If it does not, that chart does not belong to the H4-Daily combination trading strategy.  If it does, then the H4-Daily combination traders may trigger an entry.

Categories
Forex Fibonacci

How to Use Fibonacci Levels in the H1-15M Combination Trading

In today’s lesson, we are going to demonstrate an example of an H1 chart offering an entry. We find out how Fibonacci levels and 15-min chart help us take the entry. Let us get started.

This is an H1 chart. The chart shows that the price after making a strong bearish move has been making an upward correction. The chart produces a Shooting Star and creates a bearish momentum. However, the sellers are to wait for the chart to make a breakout at the lowest low of the wave. Let us proceed to the next chart to find out what the price does next.

The price keeps driving towards the South and makes a breakout at the lowest low. The breakout candle has a long lower shadow, but it closes well below the level of support. The H1-15M combination traders may flip over to the 15M chart now.

This is how the 15M chart looks. The last candle comes out as a bullish candle. The sellers are to wait for a bearish reversal candle to go short in the pair. They must concentrate hard on the chart. It is waiting time for the sellers.

The 15M chart produces a bearish reversal candle. The candle has a long lower shadow but has a thick bearish body. Moreover, the H1 chart makes a breakout, so a 15M bearish reversal candle means a lot to the sellers. The sellers may trigger a short entry right after the last candle closes. There is another equation, which we will reveal in a minute. Let’s now find out how the trade goes.

The price heads towards the South with good bearish momentum. The 15M chart shows that it consolidates now and then. The H1 chart should look much more bearish than this. Ok, here is the equation we have pointed out a bit earlier. Let us draw Fibonacci levels and find out how it may help us set our stop-loss and take-profit levels.

The Fibonacci levels show that the price trends from the level of 61.8%. It makes a breakout at the level of 100.0 and heads towards the level of 161.8. When the price trends from 61.8%, it creates an extra momentum. This is what this example shows, as well. With Fibonacci, we know where to set the take-profit level. Yes, it is to be at 161.8%. With stop-loss, you may set it above 61.8% if you are too defensive a trader. If you want to be too tight with your stop loss, you may set it between 78.6% to 100.0%. The first one offers less risk-reward, but it has a higher winning percentage. On the other hand, the second one offers excellent risk-reward but has less winning percentage. The choice is yours.

Categories
Forex Daily Topic Forex Price Action

Double Top-Engulfing Combination and Trade Management

In today’s lesson, we are going to demonstrate an example of daily-H4-combination trading. The trade setup starts with a double top, and the trend-initiating candle comes out as a bearish engulfing candle. The price consolidates and produces another bearish engulfing candle closing below consolidation support. We find out what happens next and how we may manage the trade to get the best result out of it.

This is an H4 chart. The chart shows that the price produces a double top. At the second rejection, the reversal candle comes out as a bearish engulfing candle and drives the price towards the South with good bearish momentum. Upon finding its support, it consolidates for a while and produces another bearish engulfing candle. We know what the daily-H4 combination traders are to do here.

The daily-H4 combination traders may trigger a short entry right after the last candle closes by setting stop-loss above consolidation resistance and by setting take profit with 1R. Let us proceed to the next chart to find out what the price does after triggering the entry.

The next candle comes out as a bearish candle as well. It looks good for the sellers. It seems the price may not take too long to hit the target of 1R. Let us proceed to the next chart.

It does not look good for the sellers now. The last candle comes out as a bullish engulfing candle. It suggests that the price may get bullish and hit the stop loss. Since this is an H4 chart, traders are to manage their trades according to the candlestick. The entry is carrying a loss now. Traders have three options here.

  1. They may close the whole entry
  2. They may let the whole trade run
  3. They may close 50% of the entry

It depends on an individual trader how he likes to manage his trades. Some traders may want to keep the whole trade, and some may want to close the whole trade. There is a saying that cut your losses short and let your profit run. Thus, we may manage the trade by closing half of it and let the rest of it run. This is how we earn or lose 50% of the initial target. Let us see how it goes now.

The chart produces a spinning top and heads towards the downside. The last candle comes out a hammer, but it hits the target of 1R. This means the trade setup brings profit for the sellers. It may have gone another way round. Thus, in such a situation, taking out half of the trade offers us less profit but less loss as well in the end. It does not always happen. However, when it does, we may consider managing the trade by doing it so.

Categories
Forex Elliott Wave

Advanced Applications in Wave Analysis – Part 2 of 4

Introduction

As we commented in previous articles that cover the corrective structures, R.N. Elliott considers its study as a key to understand the current market situation and what to expect for the next path.

In this educational article, we expand the observations of the flat and the zigzag pattern.

Corrective Patterns in Action

In the first part of this four-part series, we commented that impulsive waves create trends. Corrective waves correct or retrace the progression of the trending movement developed by the motive waves. A corrective structure will never appear in a wave 1, 3, 5, in a wave A and C of a zigzag, and wave C of a flat pattern.

The Flat Pattern

The flat pattern develops different variations depending on the strength of the trend or the level of complexity of the correction in progress. In its fundamental nature, the flat follows an internal sequence as 3-3-5.

On the other hand, variations in the flat pattern surge in the extensions of its waves B and C. In brief words, as wave B extends more than the 100% of wave A, wave C will tend to be short. And the lesser the retrace of wave A by wave B, the larger wave C will be.

  1. Failure in B. This case represents the scenario when wave B retrace between 61.8% and 81% the progress of wave A. If wave B extends beyond 81%, it means that the market is temporarily weak. Wave B will fail when the wave A be a double zigzag or a double combination. Wave C will tend to retrace the advance of wave B entirely. This variation could appear in waves 2, 4, A, B, or inside a horizontal triangle in its legs C, D, or E.
  2. Failure in C. This type of failure tends to occur when wave A experiences a complete or almost complete retracement made by wave B. When the price movement fails in wave C, the market shows a signal against the dominant trend. In this context, this pattern will appear in a terminal sequence. Wave C duration will be shorter than wave B and will show a similar duration than wave A. This variation could arise in waves 2, 4, A, B, or the wave 5 of a terminal impulsive wave.
  3. Regular. This formation is the typical flat pattern. Wave B retraces at least 81% of wave A, and wave C will advance wave B entirely. Also, this wave could extend between 10% and 20% beyond the end of wave A. In this variation, wave B will tend to be a complex structure, and its extension in time will be longer than waves A and C. The regular flat could rise in waves 2, 4, A, B, or in waves C, D, or E in a terminal impulsive wave.
  4. Double Failure. This scenario is infrequent; however, the double failure occurs when wave B to retrace beyond 81% of wave A, and wave C doesn’t extend beyond 100% of wave A. The double failure variation will look like a contracting triangle. Finally, this scenario will tend to appear in waves 2, 4, in wave A inside of a triangle or an irregular flat. When it happens in a wave B, it could belong to a zigzag, a regular on in an extended flat.
  5. Extended. This configuration occurs when wave C advance reaches between 138.2% or beyond 161.8% of wave B. Waves A and B must be similar in terms of price and time. This variation should tend to appear in waves 1, 3, or 5 as an impulsive terminal wave. In waves A, B, C, or D in a horizontal triangle, or wave E of an expanding triangle.
  6. Irregular. This is the most straightforward variation of the flat pattern. At the same time, it isn’t easy to find it in the real market. This pattern is indicative of the strength of the previous move. Wave B must be higher than wave A in price. Generally, wave C will be equal to wave A in price and time relation. This variation tends to appear in waves 2, 4, in wave B before the extended wave C of a flat, or as the wave B in a zigzag when wave C moves beyond 161.8% of wave A.
  7. Continuous. This correction is the most powerful variation of the flat pattern. This type of formation tends to imply volatile movements of the same degree. The continuous flat pattern tends to emerge in the second wave after an extended third wave. When it appears in the fourth wave, this variation could occur before a fifth extended wave. In a wave B, it surges before an extended wave C; in a triangle pattern, it could happen in the a-b-c series, or in a wave B of a zigzag that forms a triangle structure.

The following figure represents the seven flat pattern variations.

The Zigzag Pattern

The main difference between zigzag and flat pattern is that zigzag does not have a wide variety. The central aspect to take in consideration with the zigzag pattern is the extension of wave C compared with wave A, and the subdivisions number of wave C compared with wave A.

  1. Wave A. This wave must have an impulsive structure; this means that its internal structure must contain five segments. The A wave of a zigzag formation shouldn’t experience a retrace beyond 61.8% by wave B. If the wave B retraces beyond 61.8%, this could be indicative that the market is developing a complex correction as a double zigzag or a double combination.
  2. Wave B. This wave must show a corrective structure with three segments in its construction. As stated earlier, its progression should not go beyond 61.8% of wave A. This wave never will present a continuous correction. If this situation occurs, then the zigzag moves inside a triangle pattern. In this case, the zigzag will be the second wave of an impulsive sequence. Consequently, if this scenario occurs, then the wave B could not be a complex corrective structure as a double or triple zigzag, nor any other type of combination of corrective structures.
  3. Wave C. This part of the zigzag pattern contains five internal segments. Its extension could be from 61.8% to 161.8% of wave A.

Conclusions

In this educational article, we presented the variations of the flat pattern and the zigzag. These variations can provide a significative clue to the wave analyst respecting to the market situation and what to expect for the following sessions.

In the next educational article, corresponding to the third part of the advanced applications in wave analysis, we will present the variations in the triangle pattern.

Suggested Readings

      • Neely, G.; Mastering Elliott Wave: Presenting the Neely Method; Windsor Books; 2nd Edition (1990).
Categories
Forex Elliott Wave

Advanced Applications in Wave Analysis – Part 1 of 4

Introduction

The Elliott wave theory applied in financial markets allows the wave analyst to support its forecasting process and make a decision in the investment stage.

This educational article corresponds to the first of four parts, which aim to help understand the current market position. In particular, we’ll present the impulsive waves and its variations.

Impulsive Waves in Action

The impulsive movements appear only in advance positions. In consequence, waves 2, 4, b, d, or x, will never be part of a motive wave. The wave analyst can find motive waves in only two market stages, in a trend structural series or when the markets develop a terminal sequence.

Trending Impulsive Waves

  1. First Extended Wave. When the market progress in a first extended wave, the second wave shouldn’t retrace beyond 38.2% of the first wave and should take more time in its formation than the fourth wave. The fifth wave will be the shortest motive wave. 
  2. First Non-Extended Wave. When the first wave is not the extended wave, the second wave can retrace it until 99%. If the first wave surges after a noticeable decline, the third wave will be the extended wave.
  3. Second Wave. If the first motive wave is (or probably will be) the extended wave, the second wave should not retrace beyond 38.2%. If the first wave is not the extended wave of the impulsive sequence, the second wave could retrace it until 99%. If in the second wave, its wave A retraces beyond 61.8%, thus the second wave should fail in its wave C.
  4. Third Extended Wave. This sequence has more chances to occur in the real market. In general, the fourth wave tends to take more time in its completion than the second wave. When the third wave is the extended move, the fifth wave tends to fail.
  5. Third Non-Extended Wave. When the third wave is not the extended wave, then the first or fifth wave will be the extended wave. However, the third wave will never be the shortest.
  6. Fourth Wave. If the fifth wave is the extended wave, then the fourth wave will be the complex correction of the complete five-wave sequence. If the first wave is the extended move, then the fourth wave will be a simple correction, and the second wave the complex correction. Generally, when the fifth wave is the extended move, the third wave will experience a retrace between 50% and 60%. If the third wave is the extended wave, the fourth wave will be the complex and retrace the third wave between 38.2% and 61.8%.
  7. Fifth Extended Wave. When the fifth wave is the extended move, its length in terms of price will be at least the length between the first and the end of the third wave. In general, this extended wave should not experience a complete retrace.
  8. Fifth Non-Extended Wave. In this case, the fifth wave should experience a retracement near to 100%. If the fifth wave belongs to the third wave of upper degree, then the fifth wave will experience a retrace until the fourth wave zone.
  9. Failure in Fifth Wave. This case is possible when the third wave is the extended wave.

Terminal Impulsive Waves.

In his work “The Wave Principle,” R.N. Elliott defined this kind of pattern as “triangle diagonal.” However, Glenn Neely to avoid confusion re-calls to this pattern as “terminal impulsive wave,” providing an intuitive and it-self definition. 

  1. First Extended Wave. In this case, the terminal impulsive wave tends to appear. The second wave shouldn’t retrace beyond 61.8% of the first wave. The third wave should extend near to 61.8% of the first wave, but it should never be less than 38.2%. The fourth wave will tend to be 61.8% of the second wave, and the guideline that connects the ends of waves 2 and 4, should be clear in its identification.
  2. First Non-Extended Wave. When this scenario occurs, the terminal structure will be the wave C of a corrective formation and not the end of an impulsive sequence.
  3. Second Wave. As we said previously, if the first wave is the extended wave, the second wave should retrace until 61.8% of the first wave. If the first wave is not an extended wave, thus the second wave could retrace until 99% the first wave.
  4. Third Extended Wave. When the third wave is the extended wave, rarely the market will develop a terminal impulsive wave. The likely context in its appearance could occur in a wave C, not in a motive wave.
  5. Third Non-Extended Wave. If this scenario occurs, the first wave will likely be the extended wave, and the fifth wave will be the terminal impulsive wave.
  6. Fourth Wave. The third wave should not experience a retrace beyond 61.8% by the fourth wave.
  7. Fifth Extended Wave. This scenario can happen if the structure advances inside of the fifth wave of upper degree or when the terminal impulsive sequence is the wave C of a corrective pattern, except in a horizontal triangle.
  8. Fifth Non-Extended Wave. In this scenario, the fifth wave shouldn’t be higher than 61.8% of the third wave, and the fifth wave shouldn’t be more complex than the other two impulsive waves. The fourth wave should take less time and price than the second wave.

Conclusions

In this educational article, we reviewed the context of each case of extended, non-extended, and corrective waves, which advances in a motive sequence.

In particular, the wave analyst must maintain in consideration that in an impulsive sequence must have only one extended wave, in this context, a complex correction should appear before or after an extended wave.

In our next article, that corresponds to the second part, we’ll present the observations in corrective waves, in particular, we’ll discuss the flat and zigzag patterns.

Suggested Readings

  • Neely, G.; Mastering Elliott Wave: Presenting the Neely Method; Windsor Books; 2nd Edition (1990).
  • Prechter, R.; The Major Works of R. N. Elliott; New Classics Library; 2nd Edition (1990).
Categories
Forex Videos

Elliot Wave Education In Forex – Trading With Confidence!

Elliot Wave Theory


This video is an example of a wave counting case when the movement starts from a different level to the lowest point of the movement recorded in the price chart.

The following chart corresponds to the cross Euro Pound in its hourly timeframe.

Different techniques of technical analysis teach that the price should be analyzed from the lowest point to the highest level, or vice versa. However, in Elliott’s wave theory, an impulsive, or corrective movement, does not always start or end at the lowest level shown on the price chart.

In this example, we see that the price comes from a bearish movement, which ends with an aggressive fall. However, this did not end at level 0.82758, but ended at level 0.82767, from where we observed that the euro pound cross initiated an impulsive sequence in five waves, which developed an extended third wave, also shows the advance on a fourth wave which is longer in time than the second wave and this impulsive sequence ended on January 14, 2020.

Now we will see the internal structure of the extended third wave. Here we see the first wave, the second, third, fourth, fifth. The degree of the sequence would correspond to Subminuette in green.

Remember that both colors and grades are used for convenience for analysis purposes. Elliott, when he developed his wave theory, he never pointed out an obligation of a time range with a specific degree. The important thing in wave counting is the existing order in the analysis process.

We have already seen the third extended wave, now we see the principle of alternation between the corrective waves, from the graph we see that wave 2 is a simple correction and the fourth is a complex correction.

In the fourth wave, we see that its structure corresponds to a triangular formation, and we see its internal segments a, b, c, d, and e, and here we can observe the initiation of impulsive movement in 5 waves belonging to the fifth wave.

The start of the fifth wave is validated once the price breaks the b-d triangle guideline. Likewise, the upward movement of the fifth wave is considered finished after the low rupture of the upward guideline that joins waves 2 and 4.

This corrective sequence should correspond to a corrective process of a similar degree to this training that began on December 13, 2019. However, for the purposes of this analysis, we will only analyze the impulsive structure. 

Another detail that we must take into account in the impulsive structure is related to the extended third wave, which has a particularity that we can observe in this case. When the share price goes back beyond 38.2% of Fibonacci, the price warns us that the momentum bullish is running out, and it is very likely that the price will not exceed the previous maximum. In this case, we see that the price exceeded the maximum of wave 3 for only 4 pips reaching the level 0.85959.


Categories
Forex Price Action

The H1-15M Breakout Trading: Concentrate on Breakout and Reversal Candle

In today’s lesson, we are going to demonstrate an example of a trade setup based on the H1-15M chart combination. Usually, the straighter the first move, the better it is.  However, the price sometimes consolidates in the first arm as well. Such consolidation makes a move look weak and may hold us back from eyeing on the chart. We try to find out whether we should skip eyeing on such a chart or not.

This is an H1 chart. The chart shows that the price makes a bullish move. Then, it produces a bearish inside bar followed by a bullish engulfing candle. The H1-15M buyers may flip over to the 15M chart to get a 15M bullish reversal candle to trigger a long entry. However, those two bearish H1 candles suggest that the 15M chart does not produce any bullish reversal candle after the H1 breakout. The price starts having a bearish correction instead.

The chart makes its bullish move, followed by a bearish correction. The bullish move does not look that impressive. It consolidates before making the bearish correction. Many traders may skip eyeing on this chart to go long in the pair. Ideally, the H1-15M combination trading requires an H1 breakout followed by a 15M bullish reversal to offer a long entry. Let us proceed to the next chart to find out what the price does here.

The price finds its support and heads towards the North. The last candle closes above the level of resistance. This is an H1 breakout. The H1-15M combination traders are to flip over to the 15M chart to trigger a long entry. Let us flip over to the 15M chart first.

This is how the 15M chart looks right after the H1 breakout. If the price comes back to the breakout level, and the level produces a 15M bullish reversal candle, the buyers may trigger a long entry.

The 15M chart produces a bearish engulfing candle closing within the breakout level. The next candle comes out as a bullish engulfing candle. The H1-15M buyers may trigger a long entry right after the last candle closes by setting stop loss below consolidation support and by setting take profit with 1R.

The price never looks back before hitting 1R. It heads towards the North at a very good pace. Consolidation and bullish reversal candle come out exactly the buyers would want to get. Do not forget that the first bullish move does not look that impressive. The breakout and 15M chart’s price action attract the buyers to go long here, though. This is what we are to look for in the H1-15M combination trading. It is good if the price makes a strong move in the first arm. However, if it does not, we may still eye on the chart to see whether it makes an H1 breakout and offers us an entry by producing a 15M bullish reversal candle.

Categories
Forex Daily Topic Forex Price Action

The H1-15M Combination Trading in a Bearish Market

In today’s lesson, we are going to demonstrate an example of the H1-15M combination trading strategy offering a short entry. In one of our previous lessons, we demonstrated an example of a long entry. Let us see how it ends up offering us the entry.

This is an H1 chart. The chart shows that the price gets caught within two horizontal levels. The chart shows that the price after getting the last rejection has been heading towards the South. The sellers are to wait for a bearish breakout to go short in the pair.

Here it comes. The last candle breaches the level of support closing well below it. The H1-15M combination traders may flip over to the 15M chart to get a bearish reversal candle for triggering a short entry. Let us flip over to the 15M chart.

This is how the 15M chart looks. As expected, the last candle comes out as a bearish candle. If the next 15M candle comes out as a bearish candle closing below the last candle, the sellers may trigger a short entry. If the chart consolidates, the sellers are to wait for a 15M bearish reversal candle to take the entry. Let us find out what happens here.

The chart produces a bullish corrective candle. The sellers are to wait for a bearish reversal candle to go short in the pair. Usually, if the price makes a correction, it goes towards the breakout level and produces a reversal candle there. Let us find out where it produces a bearish reversal candle for the sellers.

The chart produces a bearish engulfing candle closing below consolidation support. The sellers may trigger a short entry right after the last candle closes. Stop Loss and Take Profit are to be set according to the H1 chart. Stop Loss is to be set above H1 horizontal resistance before the breakout, and Take Profit is to be set with 1R. Let us now find out how the entry goes.

This is the H1 chart. We see that the price heads towards the South with good bearish momentum and hits the target of 1R with ease. After producing the 15M bearish reversal candle, the price never looks back but goes towards the trend’s direction. This is what usually happens in the H1-15M combination trading. The price heads towards the trend’s direction without wasting time.

Do a lot of backtesting in your trading chart to find out some entries based on the H1-15M chart. Then, do some demo trading with the strategy before going live. It will help you be a better trader.


Categories
Forex Market Analysis

Daily F.X. Analysis, May 21 – Top Trade Setups In Forex – Services & Manufacturing PMI! 

On the news front, the EUR, GBP, and USD remain in the highlight due to manufacturing and services. The PMI figures are expected to improve all of the economies, perhaps due to smart lockdown strategy, which may have driven some business activity during the last month.


Economic Events to Watch Today


EUR/USD – Daily Analysis

The EUR/USD prices were closed at 1.09777 after placing a high of 1.09988 and a low of 1.09185. Overall the movement of EUR/USD remained bullish throughout the day. The EUR/USD pair remained near 1.1000 after the release of FOMC meeting minutes. The surge in the EUR/USD pair suggested that the pair might break its 7-week range and move further to earn more gains.

The FOMC minutes failed to impress the market as there was no surprise element in Powell’s presentation and was ignored by market participants. It was widely expected that the coronavirus outbreak would continue to weigh on the economy, and the economic outlook would remain somewhat pessimistic. Greenback holds onto its losses as there was no room for surprises in the minutes of the meeting. 

The U.S. Dollar Index (DXY) fell about 0.25% on the day to post the lowest close since May. Powell said that Fed might need to introduce more stimulus measures if the economic lockdown remains there for a long time. He also added that banks should prepare themselves for the bankruptcies of nonfinancial companies.

On the data front, at 13:00 GMT, the Current Account Balance from the Eurozone showed a balance of 27.4B during March against 37.8B of February. At 14:00 GMT, the Final CPI from Eurozone for the year declined to 0.3% against the expectations of 0.4% and weighed on EUR. The Final Core CPI for the year came in line with the hopes of 0.9%. 

At 19:00 GMT, the Consumer Confidence on the Eurozone economic condition showed a decline to 19 forms the forecasted decline of 23 and supported EUR. The market participants ignored the poor than expected CPI from Eurozone, and EUR got its support after the release of consumer confidence, which showed less decline than expected.

Furthermore, the latest Franco-German proposal for a 500 euros fund to fight coronavirus crisis helped EUR pair to gain traction in the market and remain stronger than other currencies; this ultimately supported the upward trend of EUR/USD pair.


Daily Support and Resistance

  • R3 1.1097
  • R2 1.1048
  • R1 1.1014

Pivot Point 1.0966

  • S1 1.0932
  • S2 1.0884
  • S3 1.0849

EUR/USD– Trading Tip

The EUR/USD prices are facing strong resistance around 1.0993, which marks the triple top resistance level and can trigger selling in the pair. Conversely, the EUR/USD pair may find support around 1.09512, and below this, the next support is likely to be seen around 1.0910. The bearish bias remains strong today. On the downside, the EUR/USD has odds of bouncing off above 1.0933. 


GBP/USD – Daily Analysis

The GBP/USD pair was closed at 1.22375 after placing a high of 1.22875 and a low of 1.22212. Overall the movement of GBP/USD pair remained bearish throughout the day. The GBP/USD pair remained in a consolidation phase on Wednesday and showed a slight bearish movement amid poor than expected economic data from Great Britain. The CPI, RPI & PPI data showed a decline in the month of April and provided a weak economic outlook and weighed on GBP, which ultimately dragged the GBP/USD pair on Wednesday.

At 11:00 GMT, the Consumer Price Index (CPI) for the year from the United Kingdom fell short of expected 0.9% ad came in as 0.8% and weighed on GBP. The PPI Input in the month of April showed a decline of 5.1% against the expected decline of 4.2% and weighed on Pound. The PPI output of April also declined by 0.7% from the forecasted decline of 0.5% and weighed on GBP.

At 11:02 GMT, the Core CPI for the year from the United Kingdom came in line with the expectations of 1.4%. The RPI for the year from Britain also declined to 1.5% from 1.6% of expectations and weighed on GBP. At 13:30 GMT, the HPI for the year from Great Britain exceeded the expectations of 1.5% and came in as 2.1% and supported Pound.

Apart from economic data, news about considering negative rates as an option by BoE added in the pressure on GBP on Wednesday. According to Governor Andrew Bailey, the Bank of England studied how low U.K. interest rates can be cut even more to cope with the coronavirus crisis and did not exclude the idea of lowering borrowing costs below zero.

Daily Support and Resistance

  • R3 1.2346
  • R2 1.2317
  • R1 1.2279

Pivot Point 1.225

  • S1 1.2211
  • S2 1.2183
  • S3 1.2144

GBP/USD– Trading Tip

After exhibiting sharp bullish trends, the GBP/USD faced resistance around 1.2269 level. As we can see on the 4-hour chart, the pair has closed doji and bearish engulfing candles below 1.2269 zones, which has driven a bearish retracement in the Cable. On the lower side, the Sterling may find support against the U.S. dollar around 1.2170 level. The MACD and 50 EMA are supporting selling bias in the pair. Today, the release of UK PMI figures may help drive further movement in the market. Therefore, the bullish breakout of 1.2270 level can lead the Sterling prices towards 1.2360. While breakout of the support level of 1.2169 may lead the Sterling pair towards the 1.2080 support zone. 


USD/JPY – Daily Analysis

The USD/JPY was closed at 107.535 after placing a high of 107.982 and a low of 107.335. Overall the movement of the USD/JPY pair remained bearish throughout the day. After posting gains for the previous two sessions, the USD/JPY pair starting to lose on Wednesday amid broad-based U.S. dollar weakness and renewed safe-haven demand. 

The U.S. dollar remained weak on Wednesday after Federal Reserve failed to provide any surprising element in its April meeting minutes. The Fed Chairman Jerome Powell said that risk remained on the downside and held the interest rates on the same level.

Powell said that the second wave of coronavirus would impact on U.S. economy with more intensity, and the lockdown in that time would be stricter and for the longer time period, which would cause massive destruction of U.S. economy.

Powell showed his concerns about the impact of the second wave of coronavirus, which was still onboard due to no improvement in vaccine trials. Powell said that the lower-income households would suffer more due to another wave of the virus if it happened. 

However, adding in the U.S. dollar weakness, the uncertainty about the potential coronavirus vaccine emerged in the market. After the trails of the Moderna vaccine in 6 monkeys, it was reported that all six monkeys out of which 3 received the vaccine were tested positive for COVID-19. The virus was found in the noses on all monkeys who participated in animal trials for that vaccine. This report decreased the risk sentiment in the market and added uncertainty.

Daily Support and Resistance    

  • R3 108.57
  • R2 108.28
  • R1 107.91

Pivot Point 107.62

  • S1 107.25
  • S2 106.96
  • S3 106.59

USD/JPY – Trading Tips

The USD/JPY mostly remains mostly bearish following a bullish breakout of the choppy trading range of 107.480 – 107.029 level. For now, the pair is holding at 107.630, having immediate support around 107.500. Above this level, we may see USD/JPY prices heading towards the next resistance level of 108.130. The ascending triangle pattern has already been violated, and it’s expected to kee the USD/JPY supported around 107.500. So let’s consider taking buying trades over 107.500 today. 

All the best for today! 

Categories
Forex Daily Topic Forex Price Action

When a Double Top and an Engulfing Candle Comes Together

In today’s lesson, we are going to demonstrate an example of a chart where the price heads towards the downside upon making a double top. At the second rejection, the chart produces a bearish engulfing candle. Usually, a combination of these two does not usually go wrong. The price does not make a deep consolidation afterward. However, it still heads towards the South with good bearish momentum. Let us have a look at how it happens.

This is a daily chart. The chart shows that the last candle comes out as a Shooting Star. The daily –H4 combination traders may consider it as a bearish reversal candle and flip over to the H4 chart.

The H4 chart shows that the price produces a double top. At the second bounce, the reversal candle comes out as a bearish engulfing candle. This combination may attract the sellers to look for short entries upon consolidation and getting bearish reversal candle.

The chart produces a bullish candle. It finds its resistance and produces a bearish engulfing candle closing below consolidation support. The sellers may trigger a short entry right after the last candle closes by setting stop-loss above consolidation resistance and take profit with 1R. Here is an equation that we may think about that. The price does not make a deep consolidation. Since the price is bearish upon a double top and an engulfing candle, most probably, it will make a strong bearish move. However, if you are in doubt, leave it out. Let us proceed to the next chart to find out what happens.

The next candle comes out as a doji candle. The price heads towards the Stop Loss, but it does not hit, though. It looks good for the sellers since the candle closes below the breakout level. Let us proceed to the next chart to find out what the price does.

The chart produces a long bearish candle and hits the target of 1R. Shallow consolidation may hold the price back a little to hit the target in a hurry. However, in the end, the sellers make some green pips with a combination of a Double Top and an Engulfing candle.

This trade setup does not meet all the requirements for combination breakout trading. The trend starts from a Double top resistance along with a bearish engulfing candle; it continues its bearish journey with more candles even after a shallow consolidation. This is what a combination of a Double Top/Bottom along with an engulfing candle can do. Thus, be keen on a chart if a trend starts with a combination of these two.

Categories
Forex Daily Topic Forex Price Action

The H1-15M Combination Trading Has a Lot to Offer

In today’s article, we are going to demonstrate a combination strategy. The combination is made of the H1 and the 15M chart. Since these two are busy intraday charts, thus a trader can find a good number of entries with this strategy. Let us now proceed and find out how it works.

The above image displays the H1 chart. The chart shows that the price gets caught within two horizontal levels. At the last bounce, the chart produces a bullish engulfing candle and heads towards the North. The sellers may wait for the chart to produce a bearish reversal candle at the level of resistance. On the other hand, the buyers are to wait for a breakout at the level.

The bull wins. A good-looking bullish candle breaches through the level of resistance, closing well above the level of resistance. Some traders may trigger a long entry right after the last candle closes. Some may initiate their long entries by setting limit order above the level of resistance. Every strategy has some advantages as well as disadvantages. Anyway, we are going to flip over to the 15 M chart to trigger an entry.

This is how the 15M chart looks. The last candle closes as a bullish candle too. This suggests that the bull has taken control. The H1-15M combination traders are to wait for the price to consolidate and produce a 15 M bullish candle to offer them a long entry.

The chart produces a bearish engulfing candle followed by a bullish engulfing candle. The buyers (H1-15M combination traders) may trigger a long entry now. The stop loss is to be set below the level of new support (breakout level), and take profit may be set with 2R. Let us proceed to the next chart to find out what the price does after triggering the entry.

This is the H1 chart. The chart shows that the price heads towards the North with good bullish momentum. The buyers achieve their 1R with ease. The point we may notice that the price never even comes back to the breakout level again after triggering the entry.

By using the H1-15M strategy, traders can get an excellent risk-reward. It offers a high winning percentage as well. In most cases, the price heads towards the trend’s direction with good momentum. On the contrary, the 15M chart may not always consolidate and produce the signal candle. Thus, traders may not get as many entries as they would like. However, since it is the H1-15M combination, it still offers a good number of entries per week in major pairs.

Categories
Forex Signals

EUR/AUD Engulfing Pattern at the bottom of the channel

EURAUD has been moving inside a slightly ascending channel. The last interaction of the price drove the pair to the bottom of the channel. On Monday afternoon, the price did a strong reversal on increased volume, confirmed by a second bullish candle. We see also that the MACD made a bullish transition, as the RSI reversed from the 30 level.

A bullish setup can be created with entry at the current levels and target at the top of the channel, and stop-loss below the last lows.

Main levels:

  • Buy order: 1.67777
  • Stop-loss: 1.67017
  • Take-Profit: 1.69037

Reward/Risk: 1.66

Risk:76 pips, or $491 per lot, 49,1 per mini-lot, and 4.91 per micro-lot

Reward: 126 pips, or  $816 per lot, 81.6 per mini-lot, and 8.16 per micro-lot.

A knowledgeable trader will invest no more than 2 percent of its funds in a trade. A rookie trader should start less, no more than 1 percent. That means five micro-lots every $1,000 in the trading account.


Categories
Forex Price-Action Strategies

Price Action Trading: Dealing with Daily Chart’s Support/Resistance

In today’s price action lesson, we are going to demonstrate an example of a daily chart where the price reacts to support and resistance. We will dig into the chart and find out what message it has to offer us.

The chart shows that the price heads towards the North upon producing a bullish track rail pattern. The next candle comes out as another bullish candle. However, the price finds its resistance. The level has been working as a level of resistance where the price has rejection twice already. Look at the last candle on the chart. It comes out as a bearish inside bar. However, the level is now triple top resistance. Intraday sellers may look to go short in the pair and drive the price towards the South.

As expected, the pair produces another bearish candle. The last swing low offers enough space for the sellers to go short in the pair. Thus, they may still go short in the pair and drive the price towards the South further. The daily sellers are to wait for the price to consolidate and produce a bearish reversal candle to offer them a short entry. Let us see what happens next.

The chart produces a bullish inside bar. The sellers on the daily chart may go short if the next daily candle comes out as a bearish reversal candle. They are to keep this chart on their watch list.

The next candle comes out as a bearish engulfing candle. This means the sellers on the daily chart may go short in the pair and drive the price towards the last swing low as far as price action trading is concerned. If the next daily candle breaches the level of support (last swing low), they may keep holding the position to grab more pips. Let us find out what happens next.

The next candle comes out as a bearish candle closing within the last swing low though. The sellers make some green pips. It might be time for them to close the trade since the candle closes within the level of support. If the candle closes below the level of support, it would surely be a different ball game for the sellers.

Intraday traders obey Support/Resistance on the daily chart a lot. Thus, daily support/resistance plays a significant role in the Forex market to make a reversal/correction/consolidation. Thus, if we take entry even based on the daily chart, we must count those to manage our entries.

Categories
Forex Elliott Wave

How to Count Using the Elliott Wave Principle Part 3 of 3 – Advanced Level

Introduction

Previously, we presented in a theoric way several criteria to realize wave counting, which could allow the wave analyst to foresee the likelihood next path of the market. In this educational article, we’ll analyze some examples in the real market.

Case 1 – NZDUSD Advances in a Corrective Sequence

The NZDUSD price in its hourly chart shows the progress in two consecutive corrective patterns. Our intraday analysis begins at the intraday high at 0.61305 reached on April 14th.

The price market reveals a decline in five internal segments of Subminuette degree identified in green. Once completed this move, the kiwi reacted bullishly, moving upward in three waves. This move ended a wave (b) of the Minuette degree labeled in blue. 

Observe how the price action completed the wave (c) of Subimiuette degree, developing an ending diagonal pattern, as commented on the previous article. The breakdown of this Elliott wave formation suggests the beginning of a bearish sequence that will correspond to a wave (c) of the Minuette degree.

The bearish sequence corresponding to wave (c) ended at 0.59104 on April 23rd reveals us that NZDUSD completed a zigzag pattern of Minuette degree.

The next move, developed by the NZDUSD cross, reflected the advance as a flat pattern and ended at 0.61758 on April 30th, when the kiwi developed an ending diagonal in the same way that the wave (b) of the previous zigzag pattern.

On the other hand, from the two patterns analyzed, we note the alternation principle in the corrective sequence, while the first correction is a zigzag, the second one is a flat pattern

Finally, the two consecutive corrective patterns, lead us to observe that NZDUSD completed a 3-3 sequence. In this context, the study of previous waves will reveal what should be the likely structure in progress and what could be the potential next move.

Case 2 – EURGBP Begins a Five-Wave Sequence from a Different Low

The second case considers the scenario when the market starts a five-wave sequence from a higher low. 

The EURGBP cross in its hourly chart shows the aggressive sell-off developed on December 12th, when the price plummeted to 0.82758. After this decline, the price consolidated and reached a slightly higher low at 0.82767 from where the cross began an impulsive movement identified as wave (i) of Minuette degree labeled in blue. 

Once the second wave ended, EURGP realized a third extended wave, which boosted the cross until 0.85917 reached on December 23rd. 

In this case, we observe the alternation principle in action. As the second wave is a simple correction. In consequence, the fourth wave must be a complex correction. In fact, from the chart, we observe that EURGBP developed a triangle pattern, which retraced beyond 38.2% of the third wave of Minuette degree. This context leads us to conclude that the cross should not reach a new higher high.

In this sense, the price action realized a limited higher high, which topped at 0.85959 last January 14th, from where it started to decline.

Conclusions

In this educational article, we showed a group of examples. In the first one, corresponding to the NZDUSD cross, we learned how the price action tends to end in ending diagonal patterns. 

In the same way, we observed the alternation principle applied in corrective waves, while the first corrective structure corresponded to a zigzag, the second formation built a flat pattern.

In the second chart, we observed that an impulsive sequence not necessarily will begin in the lowest (or highest) level of the price chart. This context makes us remember that an Elliott wave structure could finish developing a failure in the wave 5 or C.

On the other hand, the retracement experienced by the third extended wave beyond the 38.2% warned us about the exhaustion of the bullish momentum. This context provides us a signal of the limited potential next move corresponding to the fifth wave.


Categories
Forex Fibonacci

Fibonacci Trading: When Momentum is Lacking

Traders wait for the price to trend from 61.8% Fibonacci level. This is what attracts more traders to trade, which generates good momentum. When the price trends from 61.8% level, it usually goes up to 161.8%. Since the price gets enough space to move, it offers better risk-reward. This is another reason that Fibonacci traders love to trade in a chart when the price trends from 61.8%. However, the Forex market is uncertain. We may see that the price does not head towards 161.8% with good momentum upon trending from 61.8% from time to time. In today’s lesson, we are going to demonstrate an example of this.

This is an H1 chart. The chart shows that the price heads towards the South with good bearish momentum. Upon producing a strong bearish candle, it starts having a bullish correction. Fibonacci traders shall get themselves ready by drawing Fibo levels on the chart to find out potential short opportunities in the pair.

Here it is. The chart shows that the price breaches 78.6% level and trades above the level for two more candles. This means the price is in 61.8% zone. If the price trends from here, it may go towards 161.8% level. Yes, it would be better if the price goes towards the North and trends right from the level 61.8%. Nevertheless, the sellers still are to count the move from 61.8% zone. The chart produces a bearish engulfing candle followed by a doji candle. Since the reversal candle comes out as a bearish engulfing candle forming from 61.8% zone, some sellers may trigger a short entry (some may wait for the price to breach the last lowest low). Let us proceed to the next chart to find out what the price does.

The price heads towards the South and it makes a breakout at the last swing low as well. The pair may get more short orders now. However, the price does not head towards the South. It seems that 161.8% level is far away for the price to reach. It does not usually happen but this is how the Forex market runs. It does not always run on a single equation. A question may be raised here what does a trader do with his entry? Since it is an H1 chart based entry, it must be left behind and let it decide its fate by setting Stop Loss and Take Profit accordingly.

Categories
Forex Elliott Wave

How to Count Using the Elliott Wave Principle Part 2 of 3 – Advanced Level

Introduction

In our previous educational article, we discussed the basic concepts of the Wave Principle developed by R.N. Elliott and the wave counting process.

Glenn Neely, in his work “Mastering Elliott Wave,” describes a series of rules that will allow the wave analyst to objectively identify what kind of structural sequence is developing the price action.

In this educational article, we present a summary of the basic rules described by Neely and their impact on the wave analysis and counting process.

Use of Retracements in Wave Analysis.

When the wave analyst faces his first real-time market analysis, it may seem confusing to define what kind of wave the market is developing.

To solve this problem, Neely defined a set of rules that will allow the wave analyst to determine what kind of sequence the market develops.

These rules are described as follows.

Our reader can examine with more detail these rules and the Fibonacci retracements use in wave analysis here.

Types of Structural Series

R.N. Elliott, in his work “The Wave Principle,” defined some specific patterns that tend to repeat across the time. These patterns are built by different structural series that the wave analyst should know before to start the counting process. These Elliott wave structures are formed as follows.

Impulsive waves (:5)

  • Impulse – 5-3-5-3-5
  • Leading or Ending Diagonal – 3-3-3-3-3

Corrective waves (:3)

  • Zigzag – 5-3-5
  • Flat – 3-3-5
  • Triangle: – 3-3-3-3
  • Double Three – 3-3-3
  • Triple Three – 3-3-3-3-3

Remember that double and triple three are combined patterns.

The First Count and the Recount

As the level of complexity increases, wave sequences tend to create new waves of a higher degree, which can lead to confusing the wave analyst to identify where each wave begins and ends. For this, we use the validation channels and rules we have seen in previous articles.

Usually, the first analysis tends to be the one that presents the greatest challenge, because it tends to consider the highest level, or the lowest, to start the wave count. However, not necessarily the lowest, or highest level will be the beginning of an impulsive structure. This situation occurs because most methods of analysis consider the highest and lowest level as the starting point for analysis.

In terms of wave theory, a structural sequence will not end at the highest (or lowest) point due to the loss of momentum of price action. This situation will be reflected in one of the following four ways:

  1. An impulsive sequence containing a failure in the fifth wave.
  2. A flat pattern will end with a C-wave failure.
  3. A complex formation will end with a non-restrictive contractive triangle.
  4. An impulsive structure ends with a terminal pattern.

The following figure shows each of the four scenarios where the sequence will not end at the lowest level.

When a potential impulsive pattern experiences a reversal higher than its beginning, then the recount must consider that the origin of the previous movement is not the origin of an impulsive structural series, but can be part of a complex corrective structure.

Conclusions

In this educational article, we review different criteria described by Glenn Neely in his work “Mastering Elliott Wave,” which allow the wave analyst to identify what kind of structure the market could be developing.

Later, we reviewed the different patterns that R.N. Elliott described in his work “The Wave Principle” and his internal sequences. Currently, the patterns described by Elliott in the 1930s still can be recognized in the real market.

Finally, we discussed the cases where the market does not finish or start a new impulsive or corrective sequence from the lowest or highest point but will depend on how the previous structural series ends. 

In the next educational article, corresponding to the third and last part of the wave counting process, we will see a series of examples of wave counting and identification.

Suggested Readings

  • Neely, G.; Mastering Elliott Wave: Presenting the Neely Method; Windsor Books; 2nd Edition (1990).
  • Prechter, R.; The Major Works of R. N. Elliott; New Classics Library; 2nd Edition (1990).
Categories
Forex Daily Topic Forex Price Action

Spot the Chart Accordingly before Triggering for an Entry

In today’s lesson, we are going to demonstrate an example of a chart, which may entice traders to take entry more than once. Some traders may get themselves engaged in taking entry. We find out why we price action traders skip taking those entries. Let us get started.

This is an H4 chart. The price makes a strong bearish move by producing three consecutive Marubozu bearish candles. The last candle comes out as a doji candle. The price may consolidate now. The sellers are to wait for a strong bearish reversal candle upon consolidation to go short in the pair. Let us proceed to the next chart.

The chart produces a bearish Marubozu candle again. As a reversal candle, it is a strong one. However, the price has not consolidated well. It has produced the bearish reversal candle upon having a shallow consolidation. Moreover, the last candle does not close below the level of support. Thus, the sellers may skip taking the entry but wait for the right time to come. The chart still looks good for the sellers.

The chart produces a bullish engulfing candle. The price may make a deeper consolidation this time. The sellers may keep their eyes on the chart again to go short in the pair. Let us proceed to the next chart to find out what happens next.

The price makes a deeper consolidation. Upon finding its resistance, it makes a bearish move. It seems that the price may make a breakout here. A question may be raised here whether the sellers on the H4 chart shall take the entry or not? We find out the answer in a minute. Meanwhile, let us proceed to the next chart.

The next H4 candle closes well below the level of support. The pair trades below the breakout level for one more candle as well. However, the sellers on the H4 chart may skip taking the entry. The reason behind that is the chart takes more than six candles (a day) to make the breakout. This level of support is a daily level of support now. Thus, the sellers may take the trading decision as far as the daily chart is concerned. If they take their trading decision by observing the H4 chart, it may not be that fruitful. The risk-reward may not be a good one. It may not end up being a daily breakout, but the price may come back in. Or, the daily chart may produce a bullish corrective candle next day, which makes the price hit the H4 sellers stop loss. Thus, in such cases, they might have to take losses only because the pair belongs to the daily chart. Thus, for better trading, traders shall take a closer look before taking entry on a chart to determine whether it favors their trading chart.

Categories
Forex Course

112. Summary – Elliot Wave Theory

Introduction

Over the last six lessons, we discussed the Elliot Wave Theory from understanding the basics of applying it in the financial markets. In this article, we shall have a quick summary of the previous learnings.

The Elliot wave theory was discovered by a professional accountant named Ralph Nelson, who claimed that markets don’t move in random directions, but recurring swings called waves. Most importantly, Elliott stated that the waves are fractals. That is, each swing or wave in the market can be broken into smaller and smaller waves of the same type.

The market moves in the 5-3 Elliot pattern. This pattern is appliable on uptrend and downtrend. Also, it occurs in every timeframe.

Impulse Waves

In the 5-3 wave pattern, 5 refers to the impulse waves. The 5-wave pattern is a trending wave pattern that moves along the overall trend. It is made up of 5 waves where Wave 1, 3, and 5 are impulse waves towards the trend, while waves 2 and 4 are retracements to the impulse waves. Out of the three impulse waves, wave 3 is usually the strongest and the longest and is ideal for trading.

  • Wave 1 is where only a small number of people take positions.
  • Wave 2 is where the institutional traders and some smart retail traders enter.
  • Wave 3 is where the mass public enter, while smart & professional traders exit their positions.

Corrective Waves

For every trending market, there is a pullback. And this retracement corresponds to corrective waves. The corrective waves are a 3-wave pattern that moves against the overall trend. It is denoted as wave ABC or abc, depending on the timeframe. The first corrective wave begins after the end of the impulse wave. Note that, the corrective wave pattern should not go beyond the area of wave 1 impulse wave. If it does happen, the waves must be counted from the beginning.

There are 21 types of corrective patterns based on their design. The three basic ones include

  • The Zig-Zag Formation
  • The Flat Formation
  • The Triangle Formation

Rules in Elliot Wave Theory

There are three rules in the Elliot wave pattern to confirm the legitimacy of the pattern. The strategies will hold true only if the following strategies are satisfied.

  • Rule 1: Wave 3 must never be the shortest impulse wave.
  • Rule 2: The Wave 2 must hold above Wave 1.
  • Rule 3: Wave 4 must never cross in the price area of Wave 1.

Even if one of the rules is not satisfied, waves must be recounted from the start.

We have also discussed different ways of trading the Forex market using the Elliot wave theory, and that lesson can be found here.

Final words

The Elliot Waves are a great tool in determining the direction of the market. One can get a clear understanding of if the market is trending or retracing. Accordingly, one can take a trading decision by adding other tools which will help in precise entries.

We hope you found the Elliot Wave theory course informative and useful. Do try this out for yourselves as well. Happy trading!

Categories
Forex Fibonacci

Fibonacci Trading and Deeper Correction

In today’s lesson, we are going to demonstrate an example where the chart produces a reversal candle at a Fibonacci level, but the price does not head towards the trend’s direction. It then makes a deeper correction. It finds its new resistance and heads towards the trend’s direction with good momentum. Let us now have a look.

The price heads towards the South with excellent bearish momentum. It produces six consecutive bearish candles, four of them having solid long bearish bodies. The sellers are to wait for the price to make a bullish correction and to produce a bearish reversal candle at the value area. Let us proceed to the next chart.


The price makes a bullish correction and produces a bearish engulfing candle. However, the price does not make a bearish breakout. It rather goes towards the North again. The last two candles come out as bullish candles. The price goes towards the North further for a deeper correction.

The chart produces a bearish Marubozu candle. The combination of the last two candles is called Track Rail. The Track Rail is one of the strongest reversal signal candles. The sellers may keep their eyes on this chart with attention. The Fibonacci traders may draw their Fibonacci levels to find out which level it is trending from.

Let us proceed to the next chart to find out what the price does.

The chart produces another bearish candle and makes a breakout at the wave’s lowest low. The Sellers then take control of the pair and drive the price towards the South at an extreme pace. The last candle on this chart comes out as an inverted hammer. It suggests that the price may keep heading towards the South. However, do not forget that the chart produces a bullish Pin Bar as well, and the last candle closes within the level of support where the Pin Bar bounces off.

Anyway, let’s draw the Fibonacci level on the chart and see how the price reacts to some levels.

The chart gives us a clearer picture. At first, the price produces the bearish reversal candle at 78.6. The asset does not make a breakout. Instead, it goes towards the North and finds its resistance at 61.8. The level produces a bearish reversal candle followed by a breakout at the wave’s lowest low. The price then hits 161.8 level with ease.

If the price makes a breakout by trending from 78.6, it may not hit 161.8 level. The price usually reverses at 138.2 if it trends from 78.6. Stay tuned. We are going to study with some live examples on this soon.


Categories
Forex Elliott Wave

How to Count Using the Elliott Wave Principle Part 1 of 3 – Advanced Level

Introduction

Wave counting is a systematic process by which the wave analyst identifies in a logical and standardized order the movement developed by the action of the market.

R.N. Elliott, in his work “The Wave Principle,” comments out that counting is not the most relevant part of the study of wave theory; however, this process empathizes that it is useful when studying the market progress across time.

Elliott, the Wave Principle, and Financial Markets

The Wave Principle, defined by R.N. Elliott, is part of the law of nature, which, when known, can make predictions without knowing the underlying causes that originated this phenomenon.

In this context, financial markets are the result of a socio-economic interaction, which reflects the psychological feeling of the participants interacting in the negotiation process.

Despite the interests of each market participant, the outcome of the trading process is reflected in a price chart.

Elliott, in his work “The Wave Principle,” detected that price tends to make repeated movements over time. 

On the one hand, there are movements that, over time, create trends. Elliott defined these movements as impulsive and are characterized by being composed of five segments.

On the other hand, Elliott described movements that oppose to impulsive moves as corrections and are composed of three internal segments.

Once the price action completes an impulsive sequence and a corrective movement, the market completes a cycle and starts a new one of similar dimension or degree

The following figure shows the complete structure of a cycle.

What We Have Studied So Far

Until now, our study of wave analysis has included the following aspects:

  • Identification of directional and non-directional movement.
  • Impulsive and corrective structure.
  • Types of corrective waves.
  • Extensions.
  • Canalization.
  • The alternation principle.
  • Validation of impulsive and corrective waves.
  • Complex corrective structures.
  • Identification and wave degrees.

The process of analyzing and identifying waves will be an integration of all these concepts, which will allow the wave analyst to make a high probability forecast for the next market movement.

The Degrees Importance

R.N. Elliott defined a set of degrees that do not obey a specific timeframe, for example, hourly chart, or 2-day temporality. But allow the wave analyst to evaluate a structural sequence that maintains a proportionality in terms of price and similar time.

Also, the use of the degrees allows us to identify, and in turn, to predict what will be the next movement that should act for the price in a given time horizon.

The following table shows the different degrees described by Elliott and the contributions incorporated by Prechter & Frost in his work “Elliott Wave Principle.”

In general, our analyses will start from the Subminuette degree.

Conclusions

In this first section, we have seen the basis of the Wave Principle developed by R.N. Elliott. Likewise, we review the structure that makes up a complete cycle and concludes with the description of the different degrees that Elliott defined to maintain a systematic order in the process of analysis.

In the next educational article, we will review the different regression rules that will allow us to systematize the counting process in the first wave count.

Suggested Readings

  • Neely, G.; Mastering Elliott Wave: Presenting the Neely Method; Windsor Books; 2nd Edition (1990).
  • Prechter, R.; The Major Works of R. N. Elliott; New Classics Library; 2nd Edition (1990).
  • Prechter, R., Frost.A.J.; Elliott Wave Principle: Key to Market Behavior; New Classic Library; 10th Edition (2005).
Categories
Forex Elliott Wave

Alternation and Extensions in the Wave Analysis – Advanced Level

Introduction

In previous articles, we discussed the concepts of alternation and extensions and their importance in wave analysis.

R.N. Elliott, in his work “The Wave Principle,” described alternation as a principle of nature. Likewise, since financial markets are the result of human activity, and consequently part of nature, they are governed by the “law of nature.”

Elliott also identified the existence of extensions as part of impulsive movements. In particular, in his Treatise, Elliott points out that extensions should appear only on one of the three motive waves and never on more than one.

In this educational article, we will review and expand on the concepts of Alternation and Extensions applied in wave analysis.

Alternation

As we have seen in previous articles, alternation can be recognized in different forms, which are detailed as follows:

  1. Price, which corresponds to vertical advance, either increasing or decreasing.
  2. Time, which corresponds to the time taken by the construction of each wave.
  3. Severity, which is the ratio of the wave to the impulsive pattern, this aspect applies only to corrective waves 2 and 4.
  4. Complexity, which refers to the number of subdivisions that the Elliott pattern has in development.
  5. Construction, an Elliott wave pattern, can be a flat, zigzag, triangle, etc.

So far, we have studied the characteristics of alternation in the first three aspects. 

In impulsive structures, they can alternate in terms of time and price. However, in corrective structures, alternation in terms of price is usually not relevant. 

However, on alternation in time, in particular, one must verify the time taken by each phase of the corrective pattern, which in general will be very different from each other. Likewise, in terms of severity, if a corrective wave produces a deep retrace to the previous impulsive wave, likely, the next corrective wave will not show a deep retrace and vice versa.

The next aspect that corresponds to the alternation principle is complexity or intricacy, which refers to the number of internal subdivisions that have an Elliott wave pattern, compared to the number of subdivisions that have the adjacent structure.

In practical terms, it will be useful for the analysis of poly-waves and multi-waves. In this way, it will be helpful for one wave to be subdivided and the other not. 

The following figure shows cases for impulsive and corrective structures.

The alternation in terms of construction corresponds to the patterns that compose an impulsive or corrective structure. 

For example, in a corrective sequence in which the first movement is composed of a zigzag pattern, the next corrective move can be any structure, minus a zigzag. 

In this context, in the real market, a typical sequence is first the appearance of a zigzag and then a movement corresponding to a flat pattern, as shown in the following figure. Likewise, if the price action develops an impulsive structure, the next movement will correspond to a corrective structure of the same degree.


Extensions

Usually, in wave analysis, the extension and subdivision concepts tend to be used interchangeably. However, Glenn Neely, in his work “Mastering Elliott Wave,” shows that both terms are independent.

On the one hand, the extension corresponds to the wave with the longest movement in favor of the trend. As we have seen in previous articles, the extended wave appears in a single wave, and this may be in the first, third, or fifth wave, but it will never be present in more than one simultaneously.

On the other hand, the term subdivision applies to the number of segments constituting a wave, which can be impulsive or corrective.

Thus, the extended wave will not necessarily be the one with the most subdivisions. Likewise, as the complexity of the wave under study increases, the level of subdivisions that constitute it will also increase.

Finally, as indicated by R.N. Elliott in his Treatise, the extended wave is a relevant factor in terms of the behavior of an impulsive wave, either by what the most complex corrective wave will be. It can also lead the wave analyst to avoid losses and obtain gains from its knowledge.

When the first wave is extended, the structural sequence has a wedge shape. In this series of waves, the ends of waves 1 and 3 and waves 2 and 4 are joined. Usually, the fifth wave will end up under the higher guideline. The structure shall be complete when the price action violates the lower guideline joining waves 2 and 4.

When the third wave is the extended one, the fourth wave should not retrace beyond 38.2% of the third wave advance. If the retrace extends beyond 38.2%, this would be indicative of a weakness in impulsive movement, and consequently, the fifth wave should not reach a new high.

Finally, when the fifth wave is the most widespread, waves 1 and 3 may be similar, the third wave being slightly longer than the first and the fourth wave the most complex corrective wave compared to the second wave. The fifth wave will have the appearance of a false rupture of the directive that joins waves 1 and 3.

Conclusions

In this educational article, we have seen the importance of the principle of alternation in wave analysis, which can provide valuable information in the study of price action.

Also, knowledge of the alternation principle can help the wave analyst to identify which wave will be extended. In particular, when the analysts look to incorporate to the trend when it is in progress.

In the next educational article, we will study the process of wave counting and counting.

Suggested Readings

  • Neely, G.; Mastering Elliott Wave: Presenting the Neely Method; Windsor Books; 2nd Edition (1990).
  • Prechter, R.; The Major Works of R. N. Elliott; New Classics Library; 2nd Edition (1990).


Categories
Forex Options Forex Videos

Forex Option Expiries Over $100,000,000 – The 10AM New York Cut!

 FX Expiries 27 04 2020

Hello everybody, and thank you for joining us for the daily FX expiries briefing video for the 10 a.m. New York cut today.

If it is your first time with us, the FX currency options market runs in tandem with the spot FX market, but where traders typically place Call and Put trades on the future value of a currency exchange rate and these futures contracts typically run from 1 day to weeks, or months.
Each day we bring you details of the notable FX option expiries where they have an accumulative value of a minimum of $100M + and where quite often these institutional size expiries can act as a magnet for price action in the Spot FX arena leading up to the 10 a.m. cut.

We will also plot the levels on to the relevant charts at the various exchange rates where there are due to expire, and also identify the levels which are in play, and where we believe there is a greater chance of the expiry maturing based on technical analysis at the time of writing, we will label them as hot, warm or cold.


So today we have Option Expires for the EURUSD Pair The levels are all in Euro amounts and are as follows:
• 1.0760 599m
• 1.0800 1.1bn
• 1.0820 504m


Also, there are also Options expiring for USDJPY pair!

The levels are all in US Dollar amounts:
USD/JPY: USD amounts

• 106.75 457m
• 107.00 1.2bn
• 107.50 874m
• 107.55 410m
• 107.60 668m
• 108.00 1.3bn
• 108.35 788m
• 108.40 521m
• 108.50 632m


Also, there are also Options expiring for EURGBP pair Just one key level which is in EURO amount

• 0.8700 775m

As stated, we have color-coded the levels on the chart from COLD WARM HOT with regard to the likelihood of the exchange rate reaching these levels at the 10 a.m. cut based on technical analysis at the time of writing.
We suggest you take the levels and plot them onto your own trading charts and incorporate the information into your own trading methodology in order to use the information to your advantage.

Remember, the higher the amount, the larger the gravitational pull towards the exchange rate maturity at 10:00 a.m. Eastern time.
For a detailed explanation of FX options and how they affect price action in the spot forex market, please follow the link to our educational video.

Categories
Forex Options Forex Videos

Make Huge Profits With Our New Free Options Based Forex Price Target Tool

P

How do forex option expiries affect price action in the spot FX market?

In this video presentation, we are going to be looking at how forex option expiries affect price action in the spot FX market.
We will be exploring how forex options work, although we will not be concentrating too much on the technicalities of how they are traded because we are more interested in how FX options expiries can be of great benefit to traders in the spot FX arena.

So what are FX Options, and what is the significance of their expiries?
FX options are essentially another way of trading forex. In effect, they are different branches of the same entity. One is traded on the spot FX, thus known as the Spot FX market, which most of you will be familiar with, and the one we are discussing today is the Future’s FX Options market, where trades are made based upon the price of a currency exchange rate at some point in the future.

So what are FX options? Options traders purchase what is called a premium, which is a contract and which gives them the right, but not an obligation to buy or sell an FX currency exchange rate at a specified price. This exchange rate is called a strike. Typically these contracts will be purchased for a future date, typically days, weeks, or even months in advance and where the contract is purchased from a market maker, which is usually an institution that offers futures contracts trading, unlike banks and brokers which offer spreads in spot forex. Contracts expire on the date that the trader chose and always at 10:00 a.m. in New York, USA. This is known as the New York Cut.


If a trader wishes to purchase a premium, for a future date, for an FX Option, where he or she believes that a chosen currency pair’s exchange rate will be above that at the time of the purchase, he or she buys a Call Option. This is an option to buy. Alternatively, if the trader wishes to purchase a premium for an option where he or she believes that the future currency pair’s exchange rate would be below that at the time of the purchase, he or she buys a put option. This is an option to sell.

So how much does the premium contract cost a trader? This will vary depending on the size of the contract and also so how far the future currency exchange rate is from the current one and the length of the future expiry date. However, futures traders often prefer this type of exposure in the FX market because they take a long term view of where exchange rates will be. And rather than swing trade to these levels in the spot FX market, they prefer to pay the price or premium for the contract upfront, and this then becomes their risk and exposure, unlike spot FX traders whose level of risk fluctuates with price action.

How do options traders make money? If on the day of the maturity of the FX options contract at 10 a.m. for the New york cut the strike rate, or currency exchange rate, Is it at or above the exchange rate for a call option, or at or below the exchange rate for a put option, then the trader is known as being in the money. If a currency exchange rate is not hit, they are out of the money. If they are out of the money, the option expires, and the contract is worthless to the buyer, and he loses the premium.

If, however they are in the money, the buyer will get to exercise the option and create a position in the market. And the seller of the contract will be the counterparty in the ongoing trade. The seller of the contract also gets to keep the premium.

So who trades FX currency options? Anybody can trade FX options, but typically we will find institutions, high net worth individuals, forex traders looking to hedge positions, forward forex traders, speculators, exporters, banks, institutions, companies with exposure in the foreign exchange market generally.

So how do FX currency options affect the spot FX market? Interestingly, when FX options expiries accumulate into large amounts, typically $100 million +, we often find that these accumulated amounts at a set currency exchange rate have somewhat of a magnetic effect to spot FX Trader in the run-up to the 10 a.m. new york cut. Although these huge amounts of options expiring at a particular level occur on an almost daily basis, it does not definitely mean that price action pertaining to a particular pair will hit the strike rate. However, some of the traders who are involved in FX options will also use the Spot FX market to hedge some of their own positions, thus using the Spot market to try and move price to where they need it to be.
Also, these currency options expiry levels with the accumulated amounts are available via certain brokers and commentators before the expiries. Thus this publicly available information is used by Spot FX traders to keep an eye out in the market in the period leading up to the expiry. Remember, the larger the amount of the expiring contracts, the more it would seem that there is a gravitational pull towards these exchange rates.

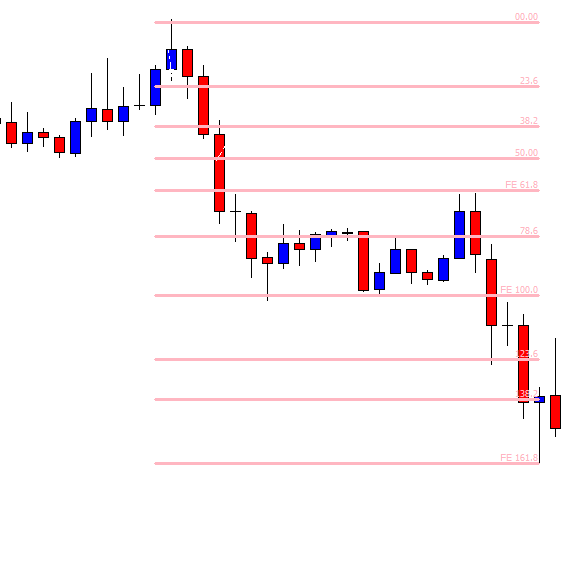
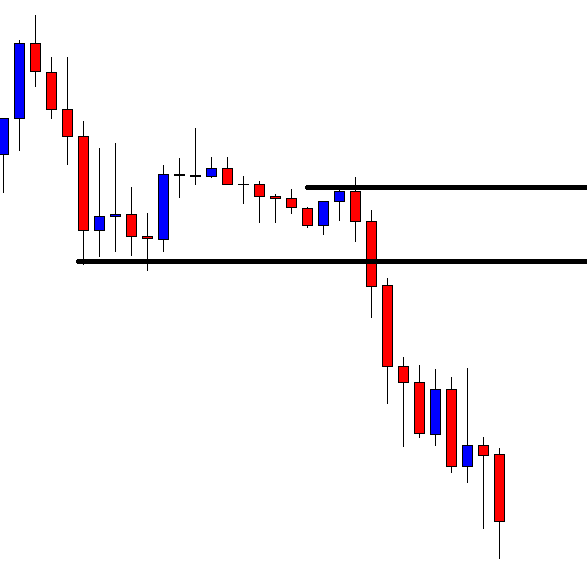
Forex.Academy will be making these levels available to you, free of charge, and they can be accessed on the options drop-down menu of our home page. For your convenience, as and when option expiries become available almost each day, we will also plot them onto a chart, as per this slide, and you will be able to view them there for your convenience.

Categories
Forex Elliott Wave

Understanding the Complexity in Wave Analysis – Advanced Level

Introduction

Financial markets are the result of human interactions where one party buys and the other sells. The results of these actions are reflected in a price chart. 

R.N. Elliott studied the interactions between these two forces that move the market. In his study, Elliott detected that specific patterns repeat themselves over time. He also identified that the price tended to move in impulsive and corrective movements.

Elliott recognized that as time progresses, the price develops movements that, in its basic unit, correspond to segments, those that have a low level of complexity. 

The complexity increases at an additional level as these segments complete a series of three or five movements, giving origin to the wave. 

Later, as a wave is completed, another movement emerges, giving course to a new wave. As this ordered sequence advances in time, the price forms structures that we could call as “poli-waves,” which Elliott defined in the form of patterns corresponding to a structure or wave of higher degree.

The interaction between different sequences of “poli-waves” or basic wave patterns, give origin to a more complex structure, which we can define as “multi-wave.” In turn, when a succession of 3 or 5 multi-waves completes, the price action creates a structure of a higher degree whose complexity level is higher. We can call this complex structure as “macro-wave.”

Multi-wave Construction

Multi-waves are complex structural series that is characterized by having at least one poly-wave in their internal structure. The type of waves can be impulsive or corrective.

Impulsive Multi-waves. They are structures in which one or several of their impulsive waves are poly-waves. Its training requirements are as follows:

  1. Of the three impulsive forward waves, only one must be a poly-wave; the other two can be simple movements.
  2. At least one of the two corrective waves can be a poly-wave, the other can be a poly-wave or a simple wave.
  3. The longer-lasting corrective wave 2 or 4 will occur just before or after the extended wave.

The following figure shows the different patterns of multi-waves of impulsive nature, being the second case, which corresponds to the third extended wave the most common.

Corrective Multi-wave. In the same way as multi-impulsive waves, the corrective multi-waves must contain specific requirements, which are described below.

  1. One or two of the waves that are divided into five waves in the longer pattern should be able to be subdivided as a poly-wave. If it has only one structure subdivided into five, it will be a Flat, while if it has two structures divided into five, it will be a zigzag pattern.
  2. The multi-wave B wave is likely a corrective poly-wave.

The following figure shows two types of corrective multi-waves.


Complex Multi-waves Construction

The complex multi-wave analysis does not differ from complex wave analysis composed of poly-waves. The difference is that complex multi-waves are composed of multi-wave groups and not poly-waves.

Macro-waves Construction

As the market develops, the structural series can be grouped as multi-waves and thus form a macro-wave

Impulsive Macro-waves. This type of structure is composed of a multi-wave in one of its three impulsive waves, while the other two will be a poly-wave. 

Corrective Macro-waves. Must contain at least one multi-wave, and another wave must be a poly-wave. If the structural series has two multi-wave, the complex structure will be a zigzag, and its formation has only one multi-wave, the corrective structure will be a flat pattern.

Conclusions

In this educational article, we have seen how, as time advances, the complexity of the waves also increases. 

However, the wave analysis whose level of complexity is higher, being it a multi-wave or macro-wave, must be realized in the same way to that studied in the wave analysis section corresponding to the intermediate level wave analysis. 

This situation leads us to conclude that the market behaves in a fractal way over time, and wave analysis does not change regardless of the proportion of time studied.

In the next educational article, we will expand on the concepts of alternation and extensions.

Suggested Readings

  • Neely, G.; Mastering Elliott Wave: Presenting the Neely Method; Windsor Books; 2nd Edition (1990).
Categories
Forex Course

106. Introduction to Elliot Wave Theory

Introduction

Elliot Wave Theory is one of the most popular strategies applied by traders. This theory works exceptionally well if read correctly. In the early 1930s, there was this professional accountant named Ralph Nelson Elliot. He was a stock market expert who analyzed the data of stocks closely for 75 years’ timeframe. He thought that markets move in random chaotic directions but later realized that they don’t. After years of analysis and research, he published a book titled The Wave Principle. This book explained in detail about the theory he had proposed.

Elliot Wave Theory

According to Elliot, the market moves in repetitive cycles. The cause for these cycles is the emotions of mass retail investors, primarily due to psychological factors. It was seen that the upward and downward swings in prices caused by the collective psychology of traders always showed a repetition in the same manner. These swings were referred to as ‘waves.’

So, if traders have a clear understanding of these repetitive cycles, one can predict future price movements. In fact, traders can identify points precisely where the market is going to reverse.

Basic Terminologies

There quite a lot of terms involved in the Elliot Wave Theory. For now, we shall the two most fundamental terms and understand others in the later lessons.

Wave

Elliot proposed that trends are formed as a result of the psychology of investors. He proved that swings formed by this mass psychology were a recurring pattern. And these swings were termed as waves. Elliot’s theory, to an extent, resembles the Dow theory, which also mentions that prices move in ‘waves.’

Fractals

Generally speaking, fractals are structuring whose split parts are like a similar copy of the whole. These structures repeat themselves even on an infinite scale. Apart from individual stocks, Elliot discovered that stock indices showed the same recurring structures. So, he moved to the futures market to analyze if the theory worked there as well.

Predicting the Market with Elliot Waves

Elliot studied the stocks in detail and concluded that predictions could be made using the characteristics of wave patterns. It is known that for a trending market, there is a pullback or correction for it. It is usually said that “what goes up, must come down.” That is, price action is divided into trends and corrections. Trends represent the main direction of the market, while corrections are against the trend.

The Elliot wave theory also uses a similar principle. There is an Impulsive wave that moves in the same directions as the larger/main trend. It always shows five waves in its pattern. Then there is a corrective wave that travels in the opposite direction of the larger trend. On a smaller scale, under each impulsive wave, five other waves can be found again. And such a pattern repeats by going into smaller and smaller scales.

Wondering what the above figure represents? To interpret it, stay tuned for the next lesson.

[wp_quiz id=”71282″]
Categories
Forex Price-Action Strategies

Good Things Come to Those Who Wait

Patience is a virtue. Forex traders need to keep patience and must not get carried away. It is not easy, but to be successful in trading, traders must be patient. A trader needs to have a sniper approach. He is to wait for the best trade setup to trigger an entry. The Forex market often produces entry with less chance. If a trader can restrain himself from taking those entries, he would be able to keep a better winning ratio. In the end, it gives him more confidence and makes him a good trader. In today’s lesson, we are going to demonstrate an example of an entry with less chance and a good entry. Let us get started.

The chart shows that the price makes a strong bullish move. Upon finding its resistance, it makes a bearish correction. It finds its support and produces a bullish engulfing candle. Such a nice price action for the buyers this is! However, it takes one more candle to make a breakout at consolidation resistance. As far as the breakout trading strategy is concerned, this is not an A+ trade setup. The price may come back down and consolidates again. Thus, it is better to skip such an entry.

The chart produces two more bullish candles, but the price does not go too further up. It rather starts having consolidation. The buyers may keep an eye on this chart to see whether it produces a bullish engulfing candle.

The chart does not take long to produce such a good-looking bullish engulfing candle closing well above consolidation resistance. This is an A+ trade setup. The buyers may trigger a long entry right after the last candle closes by setting stop loss below consolidation support and by setting take profit with 1R. Let’s proceed to the next chart to find out how the entry goes.

The chart produces another bullish candle. The last two candles suggest that the bull has taken control. It may hit the target soon.

As expected, the price hits the target. The last candle comes out as a bullish candle having an upper shadow. The price may reverse now. Anyway, the buyers have made some green pips. Their plan has worked well.

If we look back to the chart, we find that the first entry would not be that good an entry. It would make them wait too long. Often the price goes the other way and hits the stop loss. The second one comes out as an excellent entry. It does not make them wait but hits the target in a hurry. Traders must remember that if they want to avoid waiting with their entry to hit the target, they must wait and calculate well before triggering an entry.

Categories
Forex Price-Action Strategies

The Longer It Ranges, The Harder It Breaks

Price action traders usually look for entries on the chart that has a clear trend. However, even a choppy chart end up providing good entry to the traders. In today’s lesson, we are going to show how a choppy chart ends up producing a good entry. Let us get started.

The chart shows that the price has been choppy. It bounces at a level of support three times. As far as resistance is concerned, the price has a rejection at a level once and comes back down. Then, it heads towards the upside and finds its resistance getting rejection twice. The level of support seems stronger than the resistance here.

The price finds its resistance, and at the second rejection, it makes a breakout. As mentioned, the price bounces three times at the level of support. Thus, the breakout is strong as well. The sellers are to wait for the price to be held by the breakout level and a bearish reversal candle to go short in the pair.

The next candle comes out as a doji candle closing within the breakout level. The breakout comes out as a valid breakout. The sellers are to wait for the level to create a bearish reversal candle to trigger a short entry.

Here it comes. The last candle on the chart comes out as a bearish engulfing candle closing well below the last swing low. The sellers may trigger a short entry right after the candle closes by setting stop loss above the resistance and by setting take profit with 1R. Let us proceed to the next chart to find out how the entry goes.

The price heads towards the South with good bearish momentum. The price hits the take profit (1R). The last candle suggests that the price may head towards the South further. Some traders may take partial profits and let the rest of the trade run to make more pips.

The chart produces a bullish inside bar. The chart still favors the Bear. However, it may be time for the sellers to give it a second thought to close the whole trade. If we look at the chart, the price heads towards the downside and hits the target without producing any bullish candle in between. This is how it usually goes if the price makes a breakout within a long choppy market. Thus, traders may keep their eyes on the choppy charts to see whether the price makes a breakout to offer them an entry. A breakout in a choppy market is often very rewarding.

Categories
Forex Elliott Wave

Complex Corrective Waves Analysis – Advanced Level – Part 2 of 2

Introduction

In the first part of the complex corrective wave analysis article, we presented two conditions that suggest the development of a wave x. 

The first condition considers whether the second compacted corrective wave retraces less than 61.8% from the first correction. The second condition occurs if the second corrective structure retraces more than 161.8% from the first correction.

Glenn Neely, in his work “Mastering Elliott Wave,” indicates that if the first condition occurs, then the market performs a complex correction with a small wave x. While for the second case, the price action develops a complex correction with a large wave X.

Condition 1 – Complex Correction with Small Wave x.

When the wave analyst identifies a non-standard wave, there is a high probability that the wave x is smaller than 61.8% of the previous corrective phase. This type of wave tends to take the form of an impulsive sequence. However, its internal details rule out this possibility.

The non-standard structural sequence or series may have various combinations, which are detailed below:

  1. Double zigzag (5-3-5-wave x-5-3-5)
  2. Double three (5-3-5-wave x-3-3-3-3-3)
  3. Double three (5-3-5-wave x-3-3-5)
  4. Double flat (3-3-5-wave x-3-3-5)
  5. Double three (3-3-5-wave x-3-3-3-3-3)
  6. Triple zigzag (5-3-5-wave x-5-3-5-wave x-5-3-5)
  7. Triple three (5-3-5-wave x-5-3-5-wave x-3-3-3-3-3)
  8. Triple three (5-3-5-wave x-3-3-5-wave x-3-3-3-3-3)

From the above list, the triangular formation likely corresponds to a contractive triangle. On the other hand, waves x can be other corrective waves without altering the entire structure. 

The wave analyst must take into account the application of the alternation principle. In particular, the x-wave will alternate with its preceding wave. For example, if the first compact wave corresponds to a zigzag, the x-wave will be a plane or a triangle.

The following figure shows two examples of complex corrective waves that accomplish thew first condition. In particular, the case corresponds to a double zigzag, and a double three consisting of a zigzag pattern and a triangle structure.

Condition 2 – Complex Correction with Large Wave X 

When the wave analyst detects a complex correction in which the wave X is larger than the previous correction in terms of price, the entire formation will be classified as double or triple three patterns.

This structural series can have various combinations, which are detailed below:

  1. Double three (3-3-5-wave X-3-3-3-3-3)
  2. Double three (3-3-5-wave X-3-3-5)
  3. Triple three (3-3-5-wave X-3-3-5-wave X-3-3-3-3-3)
  4. Triple three (3-3-5-wave X-3-3-5-wave X-3-3-5) 

In summary, the structural series of both conditions have been listed in the most likely order of occurrence.

As in the first condition, the following figure shows two cases of double three patterns.

Conclusions

So far, we have seen the different construction characteristics of complex corrective waves and how to differentiate each type of complex wave.

In particular, we saw the two main conditions that characterize complex corrective waves.

In the following educational article, we will present the conditions associated with each particular formation.

Suggested Readings

  • Neely, G.; Mastering Elliott Wave: Presenting the Neely Method; Windsor Books; 2nd Edition (1990).
Categories
Forex Videos

Forex Price Action Noise! How To Analyse Timeframes!

aThe Problem With Price Action Noise

In forex trading, a term that is used quite often in technical analysis is market or price action ‘noise.’ Quite often, we find that price action in Any Given currency pair spends an awful lot of time sideways or consolidation motion. Or where price action seems to be rising and falling in small increments, but where these moves tend to form the basis of a trend. However, the lower you go on a time frame and especially with regard to the 1-minute and 5-minutes time frame, the more difficult it becomes in ascertaining exactly where the trend is going, whether it be a part of a bullish move or a bearish move or if it is a part of a consolidation phase.


Insert A: This is a section of price action on a 5-minute chart of the USDCAD pair. We have added two vertical bars because this is the period that we want to drill down on a little bit more.


Insert B: This is the same section, but we have added 2 points on the charts at position a and b, and where the interest rate differential is 64 pips. That is to say, had you gone short at position a the maximum you would have made had you got out at position B would have been 64 pips less your spread. And of course had you bought the pair at position A and still being in the trade at position B you would have been offside by 64, pips plus your spread.


Insert C: In this section, we have added our own channel, where we can see a lot of rise and fall and tight consolidation in periods where the price is contracting within the range, but this in itself would become difficult to trade, especially if looking for trends.


Insert D, Now scalpers, while incorporating technical tools such as statistics, might argue that a few pips could be made here and there possibly based on highs with higher highs and lower lows, etc.

Insert E, But this type of technical analysis can quickly fall out of kilter in areas such as where we have highlighted we suddenly have a lower or high which is followed by buy a higher low, where we would need a lower low in order for the pair to remain in a bearish price pattern.


Insert F. This is also complicated in the area where we have highlighted where we see candles grouped together, which are both bullish and bearish and where several are more wick than candle telling traders that neither bulls nor the bears have this pair under control at this time. This is market noise. And while such noise can be seen in all time frames, the trick is to move up to a higher one to find out where directional bias might be heading.


Insert G. However if we moved to a higher time frame, such as the 1-hour time frame here and again, look at the price action within the two horizontal lines we get some more clarity about what is really happening to this pair over the time period which we have highlighted.


Insert H, And here we can see that the price action is consolidating after a rally to the upside and where we have a V-shaped potential reversal pattern within our highlighted area.
There is an old saying which I’m sure you’ve heard of that sometimes you can’t see the wood for the trees. Well, this is a perfectly good example, where in order to avoid the noise of the lower time frames, we must always look to the higher time frames to try and ascertain what the general bias is, even if you prefer to trade the lower ones.

Categories
Forex Price-Action Strategies

Forex Price Action: Do Not Be Over Confident

Engulfing candle is the strongest reversal candle. In a bearish market, the buyers wait for a bullish engulfing candle and flip over to the minor chart to take entry. It does not usually go wrong. However, from time to time, things may not go according to traders’ expectations, even with engulfing candle. In today’s lesson, we are going to demonstrate an example of that. Let us proceed.

This is a daily chart. The chart shows that the price makes a bearish move and finds its support. It produces a bullish engulfing candle. Thus, the H4 breakout traders may flip over to the H4 chart and wait for the price to consolidate and to create a bullish engulfing candle to go long in the pair. Let us flip over to the H4 chart.

The H4 chart also looks very bullish. The price starts having consolidation. Then, it produces a hammer. It seems the chart may not take too long to produce a bullish engulfing candle breaching consolidation resistance.

The chart produces another bullish candle closing within consolidation resistance. The price heads towards the South to search for its support. It has been taking longer than the buyers’ expectations. They must not be impatient but keep their eyes on the chart.

The price finds its support and produces a bullish engulfing candle. The candle closes well above consolidation resistance. The buyers may trigger a long entry right after the last candle closes by setting stop loss below the level of support and by setting take profit with 1R. The signal candle suggests that the buyers find a good deal here. Let us proceed to the next chart to find out what the price does.

I do not think that the buyers are ready for this. The last candle comes out as a bearish inside bar, but it closes within consolidation resistance and support. It does not hit stop loss yet. The buyers still have a chance to win this. This looks ominous for them, though.

The price hits stop loss now. The last candle comes out as a bearish candle closing below consolidation support this time. All of a sudden, it becomes the sellers’ territory. The H4 buyers must avoid this chart for a while.

The lesson we get from today’s example is a chart, which looks only for the buyers’ turns into opposite within two candles. Things get changed anytime in the Forex market. Thus, traders should not be overconfident with their analysis, strategy at any point in their trading life.

Categories
Forex Market Analysis

Daily F.X. Analysis, April 21 – Top Trade Setups In Forex – Economic Sentiment in Highlights! 

On the forex front, the U.S. dollar firmed against its major peers, with the Dollar Index gaining 0.2% on the day to 99.95. The ZEW survey results of April will be released for Germany (current situation at -75.0, expectations at -42.0 expected) and the Eurozone.

The U.K. Office for National Statistics will report a jobless rate for the three months to February (steady at 3.9% expected). While in the U.S., the National Association of Realtors will report March existing home sales (5.30 million units expected).

Economic Events to Watch Today     


EUR/USD – Daily Analysis

The EUR/USD fell by nearly 0.1% to trade at 1.0865. While Spain’s central bank announced, the country’s GDP could fall by 6.8% to 12.4% this year. Later in the today, the major focus will stay on the German ZEW Current Situation Index for April will be released (-75.0 estimated).  

European stocks were mostly trading higher, with the Stoxx Europe 600 Index surging 0.7%. Both Germany’s DAX and the U.K.’s FTSE 100 added 0.5%, and France’s CAC was up 0.7%, which are somehow supporting the Euro, the single currency. 

As of now, the market participants seem very concerned about the negative impact of the oil prices Monday’s declines and keeps their eyes on it. As in result, the U.S. dollar could continue to gain ground during the Europan trading hours ahead while the S&P 500 futures are now reporting a 0.65% drop. 

The additional bearish pressure could arise from President Trump’s decision to delay immigration to the U.S. to control the coronavirus outbreak. Let’s brace to trade ZEW survey results of April will be released for Germany (current situation at -75.0, expectations at -42.0 expected) and the Eurozone. 

Daily Support and Resistance

  • S1 1.0758
  • S2 1.0813
  • S3 1.084

Pivot Point 1.0869

  • R1 1.0896
  • R2 1.0924
  • R3 1.098

EUR/USD– Trading Tips

Technically, the EUR/USD is trading with a slightly bearish bias at 1.0825, exhibiting a bearish crossover below 50 EMA, which is now extending resistance around 1.0903 level. Continuation of a selling trend below 1.0903 level can extend selling until the next support area of 1.0772, but on the way, the pair may find support around 1.0815 level. The EUR/USD is likely to find support around 1.0772, but below this, the next support prevails around 1.0652 level. The pair may find an immediate resistance level of around 1.09230, where the bullish breakout of this level can extend buying until the next resistance level of 1.1036. Conversely, we should look for selling trades below 1.0870.

GBP/USD– Daily Analysis

The GBP/USD slid 0.5% to 1.2442. Investors will focus on the U.K. jobless rate for the three months to February due later in the day (steady at 3.9% expected). The United Kingdom and European Union Brexit drama keep moving while the latest news recommending to keep a check of Britain’s £39 billion has also been underlined by the cost of dealing with coronavirus, especially the economic £250 billion rescue package announced by Chancellor Rishi Sunak to protect jobs and businesses.

At the USD front, investors prefer to choose the U.S. dollar because of its safe-haven-demand in the market due to the fears of economic fallout, which is caused by the coronavirus outbreak. The dollar index, which measures the worth of the greenback against majors, rose 0.20% to levels above 100.00.

Later today, the U.S. dollar could continue to gain ground during the Europan trading hours ahead due to high safe-haven demand in the market in the wake of intensifying coronavirus fears while the S&P 500 futures are now reporting a 0.65% drop. 

On the other hand, the reason behind the cable’s pair declines could also be the immediate rise in COVID-19 cases, with the curve still not notably peaking. It indicates that there is still a high chance that lockdowns could last longer than expected, while the Bankruptcy and bad loans will likely boost the risk-off sentiment in the market and provide further support to the U.S. dollar again.

Looking forward, traders are keenly waiting for the key U.K. data which is scheduled to release during this day ahead As well as, the coronavirus related headlines also will be key to watch for taking fresh directions in the U.S. dollar.


Daily Support and Resistance

  • S1 1.2298
  • S2 1.2374
  • S3 1.2407

Pivot Point 1.245

  • R1 1.2483
  • R2 1.2526
  • R3 1.2601

GBP/USD– Trading Tip

Taking a look at the 4-hour timeframe, the GBP/USD is trading at 1.2394 level, violating the support level of 1.2400 level. A bearish breakout of 1.2400 support area is expected to trigger a sell-off until 1.2310. The 50 periods EMA is also keeping the GBP/USD pair under pressure while extending resistance around 1.2430. Thus, the bounce off above this level can lead the GBP/USD pair towards the next resistance level of 1.2657. While bearish breakout of 1.2460 can open up further room for selling until the next support area of 1.2220. 

USD/JPY – Daily Analysis

On Tuesday, the USD/JPY is trading with a selling bias around 107.350, due to intensifying coronavirus fears as increased risk sentiment is driving the demand for the safe-haven currency. The slump in the Japanese exports for March keeps Japanese yen down, which also supports the currency pair to stay at the upside. 

The U.S. dollar extends taking bids mostly due to its safe-haven demand in the wake of intensified coronavirus fears. Considering the fresh report that the United States death toll surged over 40,000, whereas SkyNews mentions the U.K. has a bit over 16,000 people who died from the virus.

Looking forward, the North Korean leader’s health and oil moves will be key to watch, and coronavirus updates could be the driver seat for taking fresh directions. Alongside, the trader will keep their eyes on the U.S. dollar dynamics.

Daily Support and Resistance    

  • S1 105.92
  • S2 106.84
  • S3 107.44

Pivot Point 107.76

  • R1 108.36
  • R2 108.69
  • R3 109.61

USD/JPY – Trading Tips

The USD/JPY is trading slightly bearish at 107.339, having formed a descending triangle pattern on the 4-hour timeframe. The triangle pattern is extending resistance around 107.850 along with resistance around 106.980. As we know, the descending triangle pattern usually breakout on the lower side, and if this happens, the violation of 106.980 level may send the USD/JPY currency pair towards 105.850 level. 

All the best for today! 

Categories
Crypto Videos

How To Profit Trading Crypto With Elliot Wave Part 2


Elliot waves Crypto trading guide – part 2/2

The second part of the Elliot waves guide will talk about the use of Heikin Ashi candles, wave degrees as well as how to trade the Elliot wave in general.

Heikin Ashi and Elliot wave trading

If you seem to get confusing results from the chart, it’s most likely a miscalculation as far as following the rules of the Elliot wave go.

However, there is a way to track and read the chart better.

Heikin Ashi candles pair up extremely well with the Elliot wave pattern reading as they help recognize red or green candles that create a trend. This makes you respond to the market movement and distinguish trends easier.

Wave Degrees: The Waves Within Waves – explained


Each wave of the five Wave Elliott Principle consists of one larger timeframe wave. Each wave can consist of larger market cycles that even take decades to complete.

The degrees of the wave patterns have different names:
Subminuette: lasts minutes
Minuette: lasts hours
Minute: lasts days
Minor: lasts weeks
Intermediate: takes weeks to months
Primary: takes several months to a few years
Cycle: takes one to several years
Supercycle: takes multiple decades (40–70 years)


Grand Supercycle: takes multiple centuries
When it comes to cryptocurrencies, and knowing that it is a young market, large wave degrees do not exist yet. However, we have seen a pattern as big as Primary during the rise and fall of Bitcoin’s price in 2017 and 2018.
Trading the Elliot wave

Entries and Exit points

The best entry point would ideally be the start of the first wave. However, that is quite unrealistic as it can be hard to spot and recognize a wave so early. Most traders start at the bottom of the second or the start of the fourth wave. These waves are much easier to spot. As a word of caution, try not to ever buy near the top of the third wave or fifth wave.
The best exit point would be the end of the third corrective wave. However, timing this can be quite hard as these final waves might retrace to 100% of the initial pattern. For this reason, most traders choose a safer exit position, which is the place where consolidation breaks outside of the final corrective wave.

Conclusion

The Elliott Wave Principle is a highly useful chart pattern that is used by many veteran traders. It is mostly used to recognize the beginning and end of a certain trend.
Do your own research before attempting to buy and sell anything. Happy trading.

Categories
Forex Elliott Wave

Complex Corrective Waves Analysis – Advanced Level – Part 1 of 2

Introduction

Complex corrective waves are groups of waves that do not have an internal structure subdivided into three or five waves. In general, complex corrections tend to appear in waves fourth or B. Moreover, these formations are divided into two categories standard and non-standard.

Standard Type

An impulsive or corrective Standard wave formation does not imply that it is formed by a series of three or five adjacent segments. Usually, one of its corrective waves will possess a greater number of internal subdivisions creating a more extensive structure in terms of time. This condition will create a context in which can verify the alternation principle.

If the standard complex wave is in an impulsive sequence, it may be in wave 2 or 4. Otherwise, if this complex wave appears in a corrective phase, it will be between waves A and B.

The following figure shows a simplification of standard complex waves in an impulsive sequence and a corrective structure.

Non-Standard Type

Complex corrections only occur if there are at least two corrective sequences compacted in their three-wave structure and separated by a corrective formation that acts as a connector between the two corrective patterns. This type of waves must be given under certain conditions; likewise, they must meet specific rules that occur only once the waves have been compacted.

Retracement Rules

If the wave analyst found a compact corrective pattern that confirms a retrace less than 61.8%, or greater than 161.8% by the next corrective wave, and then produces another corrective wave, then the wave analyst should analyze the corrective structure as says the specifications section.

If the grouping conditions commented previously don’t meet, then the corrective structure shall be standard. In this case, the wave analyst should work the corrective sequence in the same way as discussed in the section “Corrective wave analysis – Intermediate level.”

On the other hand, the extension or duration in the time of the corrective wave doesn’t affect its analysis. A complex corrective structure can last for days and even years without this changing its structure. In this context, the wave analyst must maintain order in the use of the labels of each formation.

Non-standard Complex Wave Specifications

The first principle of a complex corrective wave implies the existence of a wave X, which acts as a connector for two standard Elliott corrective wave formations. The wave analyst should keep in mind that this point is the key to understanding non-standard patterns.

There exist two conditions to recognize the behavior of waves x.

  1. The first condition indicating the development of a wave x occurs when two compact corrective waves of a higher degree are separated by an intermediate corrective wave, which may be standard or non-standard. The first corrective wave must experience a retrace of less than 61.8% from the intermediate wave. In general, the wave x (or intermediate wave) will have a lower level of complexity than the other two corrective structures.
  2. If the price action reveals three corrective waves compacted consecutively, so that the second correction is at least 161.8% higher than the first, then it is highly likely that the second corrective structure will be a wave x. In general, the three complex waves will have the same complexity level.

If the market develops one of the two conditions commented previously, the market has likely developed a non-standard corrective formation.

Conclusions

In this educational article, we discussed the fundamental principles of a complex corrective structure and the importance of wave compaction in identifying and analyzing wave structures. 

In previous chapters, we have seen how to recognize the principle of alternation in the analysis of both impulsive and corrective waves. In this sense, the wave analyst must take into account this concept, which will allow him to identify what will be the next most likely movement.

In particular, R.N. Elliott, in his work “The Wave Principle,” defines the alternation of corrective waves and their complexity as follows “if a corrective wave is simple, the following will be complex, and vice versa.” Within a complex corrective structure, the compacted corrective patterns that compose it will also alternate with each other.

In the next article, we will look at the construction of complex corrective waves according to each condition. 

Suggested Readings

  • Neely, G.; Mastering Elliott Wave: Presenting the Neely Method; Windsor Books; 2nd Edition (1990).
  • Prechter, R.; The Major Works of R. N. Elliott; New Classics Library; 2nd Edition (1990).
Categories
Forex Daily Topic Forex Price-Action Strategies

Forex Price Action: A Losing Trade

Forex trading is considered one of the riskiest businesses. The market is volatile and it gets unpredictable from time to time. There is no trading strategy, which can guarantee one hundred per cent success. Thus, Forex traders must be mentally prepared to take losses. In today’s lesson, we are going to demonstrate an example of a losing trade.

The chart shows that the price upon finding its resistance heads towards the South with good bearish momentum. The first candle comes out as a bearish engulfing candle followed by two bearish candles. These suggest that the bear takes control. The sellers are to wait for the price to consolidate and a bearish engulfing candle to go short in the pair. Let us proceed to the next chart to find out what the price does.

The price finds its support. It produces a bullish inside bar followed by two doji candles. It seems that the price has been searching for its resistance. The sellers are to keep their eyes on this chart.

The price finds its resistance. It produces a bearish engulfing candle closing below consolidation resistance. Without any doubt, this is an A+ breakout candle. The sellers may trigger a short entry right after the candle closes by setting stop loss above consolidation resistance and by setting take profit with 1R. Let us find out how the trade goes.

It looks fantastic for the sellers. The next candle comes out as a bearish candle as well. Consecutive two bearish candles suggest that the bear is in a hurry to hit the take profit. The sellers may not have to wait too long to achieve their target as far as the price action in this chart is concerned.

Would you believe it? The next candle comes out as an inverted hammer. The upper shadow hits the stop loss. The sellers are out with their entry with a loss. That was beyond their imagination some might say. However, it happens a lot in the Forex market. Thus, traders must not be overconfident with any entry. Discipline and money management are to be maintained with every single trade.

Some traders, especially at the beginning can’t take losses easily. It bugs them up. Losing money may make them think something is wrong with their strategy. There is nothing wrong if traders want to try to develop new strategies. However, they should not just lose the belief and abandon a long proven strategy all of a sudden.

Categories
Forex Price-Action Strategies

Breakout With and Without Momentum

A Breakout without momentum often does not push the price towards the trend. The price seems to come back at the breakout level again. On the other hand, a breakout with momentum pushes the price towards the trend in most of the cases. In today’s lesson, we are going to demonstrate a chart, which has two types of breakouts. Let us get started.

The chart shows that it heads towards the North. Upon finding its resistance, it makes a bearish correction. It finds its support and produces a bullish engulfing candle. The price heads towards the North again. It makes a breakout with a candle having a long upper shadow. It is a breakout. However, the breakout takes place with two bullish candles. Let us proceed to the next chart to find out what the price does.

Despite making a breakout, the price does not head towards the North. It rather consolidates around the breakout level. The breakout level still holds the price. Nevertheless, it does not look that good for the buyers. The price may come back within those two levels and hit the lower support. Let us find out what happens next.

The price does not come back within the breakout level. It makes another breakout at consolidation resistance. It takes only one candle to make the breakout. Breakout traders want to get this kind of breakout to trigger a long entry. The buyers may trigger a long entry right after the last candle closes by setting stop loss below consolidation support and by setting take profit with 1R.

The price heads towards the North with good bullish momentum. The next candle comes out as a strong bullish candle. It suggests that the bull has taken control. It seems the price may hit 1R in a hurry as well. This is what the breakout traders want.

As anticipated, the chart produces another bullish candle and hits the target. It takes two candles to achieve 1R. It gives traders more confidence about the strategy and saves their time. They can concentrate on other charts to look for entries. It does not mean it goes like this every single time though.

The above charts show that a breakout by two candles does not generate the momentum towards the trend. However, when the breakout takes place with a single candle, the price heads towards the trend’s direction in no time. Thus, if we do not want to hang around with our entries and keep an amazing winning rate, we may take entries on a breakout that takes place with good momentum.

Categories
Forex Daily Topic Forex Price-Action Strategies

Price Action Trading and Trade Management

Trade management is such an important factor in Forex trading. Managing trades effectively saves traders from making a loss or help them secure their profit. Sometimes traders are to close their trades earlier or lock the profit. This shall be done only when trading is done on major time frames such as the H4, the daily, or the weekly, though. In today’s lesson, we are going to demonstrate an example of an early exit in the H4 chart.

The chart shows that the price makes a strong bearish move. It makes a breakout and produces a bullish inside bar. The H4 breakout traders are to wait for the price to find its resistance and produce a bearish engulfing candle to offer them a short entry. The price is at the breakout level. It seems that the breakout level is going to play a vital role here.

The chart produces a bearish spinning top and a bullish candle. However, the breakout level works as a level of resistance and produces a bearish engulfing candle closing well below consolidation support. The sellers may trigger a short entry right after the candle closes by setting stop-loss above the breakout level and by setting take profit with 1R. The signal candle suggests that the sellers do not have to wait too long to achieve their target.

As expected, the next candle comes out as a bearish Marubozu candle as well. The sellers would love to get a bit longer bearish candle. However, as long as it comes out as a bearish candle, they should be happy with it. Remember, this is an H4 chart. Thus, a bearish Marubozu candle means a lot for the sellers. It seems the price is going to take one more candle to hit the target.

The next candle comes out as a Bearish Marubozu candle as well. However, it does not hit the target 1R. A very few pips are left to achieve the target. The sellers must wait. The last candle suggests that it is only a matter of time for the sellers to reach their destination. Let us proceed to the next chart and find out what happens next.

The last candle comes out as a bullish engulfing candle. This does not convey a good message for the sellers. The price is yet to hit the target. They have some profit running in the trade. What should the sellers do here?

If it is an inside bar bullish candle, the sellers should keep holding the position to hit the target. However, the last candle comes out as a bullish engulfing candle (in an H4 chart). This means a lot for the minor intraday buyers. Thus, the best thing to do would be if the trade is closed manually, right after the last candle closes. It gets the sellers some profit, at least. Yes, the target is not achieved, and some profit is lost. Take it easy. Things go according to plan and sometimes don’t. This is what trading is all about.

Categories
Forex Price-Action Strategies

Price Action Trading: The Morning Star at a Breakout Level

Breakout is the first thing that attracts the price action traders to keep eying on a chart. Then, correction/consolidation followed by reversal candle breaching consolidation support/resistance is the signal to trigger an entry.

The breakout level plays an important role, which often becomes consolidation support/resistance and produces the reversal candle. Sometimes a breakout level produces even stronger reversal patterns such as Morning Star and Evening Star. When that happens, it attracts more traders and brings more liquidity. In today’s lesson, we are going to demonstrate an example where the breakout level holds the price as support; produces the Morning Star to offer a long entry. Let us get started.

The chart shows that the price heads towards the North with good bullish momentum. On its way, it makes a breakout at the highest high. The pair then produces a bearish reversal candle to consolidate around the breakout level. The buyers are to keep an eye on this chart. If the breakout level produces a bullish engulfing candle closing well above consolidation resistance, they may trigger a long entry.

The chart produces a Doji candle (tiny bullish body with long shadows both sides). The breakout level holds the price, for which the buyers are going to be very keen to keep an eye on this pair. If the next candle comes out as a bullish engulfing candle, it would also form a candlestick pattern called Morning Star.

The chart produces a bullish engulfing candle closing well above consolidation resistance. A bullish engulfing candle is enough to attract the buyers to go long in this chart. The combination of the last three candle forms Morning Star, which is a strong bullish reversal candlestick pattern. The buyers may trigger a long entry right after the last candle closes. Stop Loss is to be set below the breakout level and Take Profit is to be set with 1R. Let us proceed to the next chart to see how the trade goes.

The next candle comes out as a bullish candle. The buyers seem to have taken control. The price may hit the target soon.

It takes only two candles to hit the target. Traders make some green pips in a hurry. If we analyze this trade, we find

  1. The price makes a bullish breakout and comes back at the breakout level.
  2. The breakout level works as support and holds the price
  3. It produces a bullish engulfing candle closing above consolidation resistance.
  4. It produces a candlestick pattern called Morning Star as well.
Categories
Forex Basic Strategies

Pairing The ‘Gravestone Doji’ Pattern With Significant Resistance Levels

Introduction

Gravestone Doji is a bearish reversal candlestick pattern that occurs at the top of an uptrend. This pattern helps the traders to visually see where the significant resistance level is located on the price chart. The most important aspect of the Gravestone Doji pattern is its long upper shadow. The candlestick’s open, close, and low are all the same in this pattern.

The psychology behind the long upper shadow is this – In an ongoing uptrend, when the price action hits the significant resistance line, buyers exit their positions, and the price action is smacked down by the sellers. In short, the appearance of this pattern represents the losing momentum of the buyers and essentially indicates a bearish reversal in the market.

Most of the traders place their trades as soon as this pattern appears on the price chart. But that’s definitely not the right approach. Instead, we must wait for the next candle to close for the confirmation and only then take the trades. The opposite of the Gravestone Doji is the Dragonfly Doji, which appears at the bottom of a downtrend or the major support area. The below image represents the Gravestone Doji Pattern.

Trading Strategies – Gravestone Doji Pattern   

The Gravestone Doji pattern indicates that the buying trend is ending, and the market is reversing to the selling side. However, this doesn’t hold true all the time. We will be finding this pattern quite often in all the types of market conditions, and if we start trading every time we find them, we will end up on the losing side. We always need to ask our self the reason why this pattern appears in certain conditions. Is it going to reverse the market or not?

Pairing the pattern with a significant resistance level

If you find this pattern at the bottom of the range, do not trade it. But if the price action prints this pattern at the top of a range, it can be considered a sign for us to go short. Similarly, find the trending markets and look for a major resistance level where the price could possibly react. So when the price action prints a Gravestone Doji at the major resistance level, it’s a strong sign for us to go short.

In the below USD/CHF Forex chart, we can see that the price action has printed the Gravestone Doji pattern at the significant resistance level. We should be going short as soon as the Doji candle closes.

In the below image, we can see that we took a sell entry when the market printed the Gravestone Doji pattern. We have placed the stop-loss just above the resistance level. It is safer to put the stop-loss above the pattern or at the resistance line because if the price goes above the pattern, the pattern gets invalidated. We know that the Gravestone pattern indicates a market reversal, and most of the time, these reversals travel quite far. That is the reason why we go for deeper Take Profits.

In the above chart, we can see that we had exited our full positions when strong buyers showed up. This indicates that the sellers are losing their momentum, and there is no logic to continue holding our positions.

Gravestone Doji + Stochastic Oscillator

The strategy that we shared above is for aggressive traders who like to take risks. However, if you are A type of trader who needs more confirmation to pull the trigger, we suggest you follow this strategy to trade this pattern. Most of the conservative traders do have a fear in their minds that one single candle does not have the potential to reverse the market. And it is completely okay to think like that. The truth is that sometimes even a single candle can move the market, and sometimes it doesn’t. Ultimately it is your money management system that makes all the difference.

But to filter out some poor signals and to get an additional confirmation, it is advisable to use the Stochastic oscillator to confirm the probability of our trading signal. Stochastic is a range-bound indicator that oscillates between the 0 & 100 levels. When the Stochastic goes above the 70 level, it means that the market is in an overbought condition, and we can expect a change in the trend. Likewise, when it goes below the 30 levels, it means that the market is oversold are we can expect a reversal anytime soon.

The Stochastic indicator also shows the bearish and bullish divergence, which helps the traders in trading the upcoming reversals. The divergence is when the market moves in one direction, but the indicator is signaling a different direction. Now we believe that you understand the basics of trading with the Stochastic indicator. Now let’s dive into the strategy.

The strategy here we are using is simple and straight forward. First of all, identify the Gravestone Doji pattern at a significant resistance level in an uptrend. Then, apply the Stochastic indicator to the price chart and check if the indicator is at the overbought area, indicating a downside reversal. If yes, go short and place the Stop-Loss just above the pattern.

The GBP/CAD chart below indicates the appearance of the Gravestone Doji pattern in an uptrend. When the price is approaching the upper resistance level, it got smacked down immediately, and the market ended up printing the pattern. The next six candles tried very hard to break the pattern & resistance line, but nothing worked, and the price ended up rolling down. We can also observe the Stochastic indicator was at the overbought area, which is a confirmation sign for us to go short.

We have entered for a sell when both the conditions are met, and placed the Stop-Loss just above the pattern. For the Take-Profit, we choose to go for deeper targets. When the selling trend started to struggle, the Stochastic indicator was at the oversold selling conditions. At that point, we have closed our full positions for obvious reasons.

Conclusion

The trades taken based on the Gravestone Doji pattern are pretty reliable. But do not make the mistake of identifying the pattern everywhere on the price chart. The psychology behind this pattern says that the bulls drove the price to a peak point, and the sellers are comfortable in reversing the market. For booking profits, you can expect an equal move to that of a previous trend. If you are an intraday trader, make sure to exit your positions at any significant level. Although this pattern appears on all the timeframes, the reliability is higher on higher timeframes to that of lower timeframes.

We hope you find this article informative. Try trading this pattern on a demo account and master it before applying the above-mentioned strategies on the live market. Cheers.

Categories
Elliott Wave Guide Forex Elliott Wave

Intermediate Level Elliott Wave Analysis Guide

We have finished the section that covers the Intermediate Level of the Elliott Wave Analysis based on the work of Glenn Neely. These concepts are described and include the following aspects.

1.- Introduction to Intermediate Wave Analysis. In this section, we present the concept of grouping waves and how to apply them in the real market.
2.- Motive Waves Analysis. This section, divided into three parts covers the following aspects:
– The first part presents the extension concept and its application in the real market.
– The second part extends the concepts of Alternation, Equality, and Superposition, and we identified how the price action follows these rules.
– The third part presents the canalization process.
3.- Corrective Waves Analysis. This part unfolded in five parts, includes the following concepts:
– The first part reviews the rules of construction of corrective formations and the flat pattern, including its variations.
– The second part presents how to analyze the zigzag pattern and its variations.
– The third part exposes the characteristics and rules of the triangle pattern.
– The fourth part discusses the contracting triangle, including its variations, rules, and target zones.
– The fifth part dedicated to expanding triangles presents its variations and rules.
4.- Validation Rules. This two-part section exposes the next principles:
– In the first part, we learn how to validate impulsive waves.
– The second part shows how to validate corrective waves.
5.- Simplification of Wave Analysis. This last section illustrates how the compaction process can help the wave analyst to ease its analysis.

Categories
Forex Price-Action Strategies

A Classic Example of the H4 Breakout Trading

In our trading lesson, we have been demonstrating H1 breakout strategies in our last five lessons. Today, we are going to demonstrate an H4 breakout trade setup, which is a classic example of price action breakout trading. The price makes a bullish breakout at the last highest high; comes back at the breakout level and produces a beautiful bullish engulfing candle closing well above consolidation resistance to offer a long entry. Let us proceed and see how it occurs.

The chart shows that the price heads towards the North with good bullish momentum. On its way towards the North, it does not produce even a single bearish reversal. It suggests that the buyers have been very confident. It makes a breakout at the last swing high. The breakout is not explicit though. However, the price continues to go towards the North after the breakout. Then, it finds its resistance and produces two bearish reversal candles. Look at the last candle. It closes within the last highest high (breakout level), which is a flipped support now. This is one of the most important factors in price action trading. The price reacts to such levels and produces reversal candles.

As mentioned, the level produces a bullish engulfing candle closing well above consolidation resistance. The buyers may trigger a long entry right after the candle closes by setting stop loss below the level of support and by take profit with 1R. Let us proceed to the next chart how the trade goes.

The last candle comes out as a spinning top. Not a good start for the buyers, but the buyers must keep patience here. Trading on the H4 chart allows traders to manage their trade and take early exit. However, they must not think taking an early exit here. The last candle is not a strong bullish candle, but it is not a strong bearish reversal either. Let us proceed to the next chart. It may take one good candle to hit the target.

The price does not take too long to hit the target. It hits the target with the last candle. This is a classic example of trading on the H4 breakout trading. After the breakout, the price comes back at the breakout level. It produces a bullish reversal candle right at the breakout level. The bullish reversal candle comes out as an engulfing candle closing well above consolidation resistance. Price actions traders wait for the price to behave like this to take an entry.


Categories
Crypto Videos

Mastering Crypto Using The Morning Star


Trading Crypto using the Morning Star Pattern

The Morning Star pattern is a three-candle candlestick pattern that signals a bullish reversal and appears at the bottom of a downtrend. It signals a trend slowing down and a large bullish move laying the foundation for a new uptrend.
Identifying the Morning Star Pattern
Identifying the Morning Star on cryptocurrency charts requires more than just identifying the three main candles. It also requires knowledge of the previous price movement. The pattern should be identifiable if these five things occur:

The market should be posting lower highs and lower lows prior to the Morning Star formation.
The large bearish candle shows up as a result of large selling pressure as well as a continuation of the existing downtrend. Traders should be looking to take only short positions as there are no signs of a reversal yet.
The second candle is a small-bodied candle (sometimes even a Doji candle) is the first sign of market showing downtrend fatigue. This candle often gaps lower and makes a lower low. It does not matter whether the candle ends up being bearish or bullish, as it is only supposed to represent market uncertainty.
The first real sign of bullish pressure is this exact candle. It should be a big green candle followed by an increase in volume.
After a successful reversal, traders will start to enter long positions as the market posts higher highs and higher lows. However, make sure to manage the risk through the use of well-placed stops-losses.

Trading the Morning Star Pattern

The chart on the screen shows us the formation of a Morning Star pattern, where an established downtrend is leading up to the formation of the Morning Star reversal pattern.
Once the formation has completed, traders are looking for an entry point at the open of the next candle. If a trader is more conservative, they could delay their entry point until they are satisfied with how the pattern plays out.
Targets should be placed at previous resistance levels or previous areas of consolidation. Stops-losses should be placed right below the recent swing low. As there are no guarantees of this pattern playing out correctly, traders should always maintain a positive risk to reward ratio to avoid taking any substantial risk of ruining their portfolio.

Morning Star Pattern reliability

The Morning Star pattern, just like any other candlestick pattern, should be used alongside other trading tools available to the traders. Even though this pattern occurs frequently and has a fairly high chance of playing out correctly, one has to take all precautionary measures to protect oneself from the risk.

Categories
Forex Elliott Wave

How to Simplify Wave Analysis – Intermediate Level

Introduction

How to simplify wave analysis can seem a confusing task. However, if we consider the concepts we have previously studied, the process may be more straightforward. 

Until now, we have studied concepts and principles such as types of waves, internal characteristics of each kind of pattern, wave channeling rules, price and time alternation, and wave validation criteria, among other aspects.

In this section, we will see procedures in which we will transform the complexity into a basic market structure.

Waves Compaction

Compaction is the analysis process in which a sequence of adjacent segments that make up an impulse or correction structure (5 or 3) is grouped. Given the dynamic nature of price action, any Elliott wave pattern, once completed, can be labeled as impulsive or corrective. Therefore, this technique cannot be applied, while Elliott’s formation is in progress.

Once an Elliott wave pattern has been completed, the structure of the series can be compacted, which will make as a basic structure. Then, the formation we will use as a base in the following process for the analysis and compaction can be repeated.

Regrouping

Regrouping is the process you perform after compacting waves. At this stage, the wave analyst will use the compacted wave as the base structure of the following wave group and thus construct a series of larger waves, which may be standard or non-standard.

Integration

Integration is the process in which the wave analyst uses short-term compacted waves to form larger wave structures to be included in long-term charts. For example, once a short-term wave pattern is completed, this structure can be transferred with its labels to the long-term (or higher degree) chart. 

This process can be useful for information references when comparing short-term and long-term graphs to obtain a more logical and accurate idea of the next market movement.

The Principle of Complexity

This principle is useful for the classification of subdivisions of an Elliott pattern. Its usefulness lies in the possibility of combining large scale patterns and determining the relative name of the degree of each segment.

In other words, when a wave advances in the short term, it is straightforward to identify each segment and thus identify and label wave pattern. As time progresses, this wave increases its complexity, and the process of compacting waves is required. Once the wave is compacted, another wave is completed on a higher degree. 

Consequently, the complexity tends to grow as the waves increase, and they combine to give way to new waves.

The principle of complexity may not be relevant in the short-term analysis. However, as the horizon of analysis increases, the usefulness of this principle becomes essential. In this respect, the Elliott guidelines identified at the same consecutive level, have the same degree.

The Concept of Degree

Until now, we have used the term Degree superficially referring to an ambiguous time horizon as short, mid, or long term. 

In Elliott wave theory, the degree is not related to a specific timeframe, for example, 15 minutes, an hour, 5-day, etc. It is related to the order in which the different wave patterns are completed. 

R.N. Elliott, in his Treatise “The Wave Principle,” states that both labeling and degrees are not the ultimate purpose of wave analysis, but are an instrument that allows keeping an order to be maintained within the analysis process.

A wave degree is determined by the wave compacting process from the short to the long-term. Once the short term wave has been completed, it will be a segment in a higher time range or greater degree.

R.N. Elliott defined the following degrees to classify the order of market movements.

  • Subminuette
  • Minuette
  • Minute
  • Minor
  • Intermediate
  • Primary
  • Cycle
  • Supercycle
  • Grand Supercycle

The different degrees are represented in increasing order in terms of temporal magnitude. 

On the other hand, Prechter & Frost, in their work “Elliott Wave Principle,” incorporated six additional degrees, as shown in the following table.

In practical terms, to have a reference to the temporality to be used in the analysis process, when Elliott developed wave theory, the smallest data time range available corresponded to the hourly graph. Consequently, the wave analyst can begin by assigning the Subminuette degree to the wave structures that are completed in this temporality and thus advance successively from there.

Conclusions

In this article, we have seen how a systematic process can simplify the process of wave analysis.

The wave analyst can simplify the market analysis helped by the use of the compaction process, which should be realized once completed a wave pattern. Later, by using grades and labels, the wave analyst will be able to maintain a simplified order in the study and, in turn, make a forecast of the next most likely market movement.

In the following article, we’ll start the advanced level of the wave analysis with the study of complex corrective waves.

Suggested Readings

  • Neely, G.; Mastering Elliott Wave: Presenting the Neely Method; Windsor Books; 2nd Edition (1990).
  • Prechter, R.; The Major Works of R. N. Elliott; New Classics Library; 2nd Edition (1990).
  • Prechter, R., Frost.A.J.; Elliott Wave Principle: Key to Market Behavior; New Classic Library; 10th Edition (2005).


Categories
Forex Daily Topic Forex Price-Action Strategies

H1 Breakout Trading: Keep Holding Your Positions

Price action traders are to maintain discipline with their entry and trade management. As far as trade management is concerned, it varies on time frames. Trade management on the H4 chart and the H1 chart is different. A reversal candle on an H4 chart has more potential to change the existent trend. Thus, traders may need to think about an early exit. On the other hand, H1 breakout traders may keep holding their positions until it reaches the target. In today’s lesson, we are going to demonstrate an example of this.

The chart shows that the price after being bullish has rejections at a level of resistance. The price heads towards the North but does not make any breakout. It has been in the bearish correction again. Let us see whether it finds its support and makes a bullish breakout or not.

Here it comes. The price finds its support and produces a bullish engulfing candle breaching the level of resistance. This is an A+ breakout candle. The buyers are to wait for the next candle to close above the breakout candle to trigger a long entry.

The next candle comes out as a bullish candle as well. It has an upper shadow, but the last 15 candle comes out as a bullish candle. The buyers may trigger a long entry right after the last candle closes by setting stop loss below the support level and take profit with 1R.

The price heads towards the North. However, it seems that the price does not head towards the target with good bullish momentum. Moreover, the last candle comes out as a bearish engulfing candle. This is ominous for the buyers. Do not forget this is an H1 chart, and the buyers are not supposed to take an early exit. They should keep holding their position and wait for the price to do the rest.

The price gets rather choppy. It has been testing traders’ patience. It is hard to keep holding positions. However, traders must not keep looking at the chart. Meanwhile, they might as well concentrate on other charts to find out potential entries.

Patience pays back to the buyers at last. The last candle comes out as a bullish candle, which helps the buyers to reach their take profit target. In the end, the trade goes well for the buyers. It may have gone the other way, but H1 breakout traders should stick with their plan and keep discipline.

Categories
Forex Videos

Dominating Price Action! Making You A Better Trader

Dominate Price Action To Amplify Your Trading Arsenal

In this video presentation, we will be looking at price action. If you want to be a successful forex trader, you need to understand what price action is. If we had to strip forex training down to 1 single most important feature, then price action would be it. Today we are going to show you how it is applied in forex trading.
All areas of the financial markets capture the movements of any specific asset, including Forex, on a chart and where this is recorded historically. These movements can be represented as candlesticks, line charts, or bar graphs, And can be observed over varying time periods from 1-minute or 5-minute time frames, all the way up to monthly charts. This data reflects the beliefs of market participants at any given time, whether they are human or algorithm-based traders, which is shown on the charts in the form of price action.

Price action is the methodology of applying all your decisions from a price chart while adhering to some basic trading principles. Price action is often called naked trading because traders rely on the price itself in order to denote when to enter and exit trades. However, by adding a couple of moving averages and some support and resistance lines, it becomes much more easy to identify key levels of support and resistance to trade around. Ideally, as a trader, we want to try and identify tops, bottoms, and trends. And this methodology is an extremely important feature in identifying these key areas.

A couple of old adages come to mind which lends themselves very nicely to forex trading: the first one is that sometimes you can’t see the wood for the trees, and where that can be applied to Forex in so far as sometimes traders overload their screens with technical tools and they cannot really clearly identify what is happening with the price action because they are too focused on too many technical tools. And the other adage is sometimes less is more, and that applies for the same reason: by stripping away technical tools, we can only rely on price action itself, which is a key leading indicator in its own right. While in this example of the EURUSD pair, we can quite safely say that during this period of the 1-hour chart, the general trend was to the downside, but how can we pick this out by utilizing price action itself?


Example B, the Price action of a pair is in continuous motion apart from interruptions during the weekends. Otherwise, price is consolidating or moving in a sidewards direction, or it is trending higher or lower. As traders, we should be looking at what is happening with price action at any given time and then try to establish if the price is trending, or if it is in a period of consolidation, or even a pullback before a trend continuation.
Price action alone can help us determine these areas, but by adding a couple of visual supports such as some trend Lines, it just makes it more easily identifiable. For this example, we have just added two very simple lines that help us to more clearly identify levels of support and resistance. Here we can see a period of consolidation, which is qualified by price action touching, or is very close to touching at least two areas of support and resistance, which are clearly identifiable such as drawn onto our chart.
One thing is for sure that price action will breach this area at some future point. This is a key area of interest for traders.


Example C, Here we can see that the support line has been breached by a strong bearish candlestick. Traders will jump on this opportunity to go short on the pair at this point.

Example D, We subsequently see another area of consolidation and a further breach to the downside, and where traders would expect that a downtrend is in process, and they would be looking for opportunities to go short.
Whilst stochastics, MACD, and moving averages are widely used throughout the trading community, many traders feel that price alone can be relied on for identifying trade opportunities, and certainly, these couple of examples would support that.
But of course, as cautious traders, we like to stack the odds in our favor, and if that means adding a couple of extra visual technical tools that will help us well, what’s the harm in that?

Example E, Here, for example, we have added a simple 30 period moving average. Notice how the price action tends to bounce lower off of this line, while price action continues in its trend lower.

Example F, I know the world price continues to consolidate and punches lower through support lines and where support lines become lines of resistance, but all the while price is bouncing lower from the 30-period ma.


Example G, Price action also throws up another favorite for traders: highs with lower highs and lows with lower lows which identify a downtrend, and where the opposite would apply for an uptrend, where they would be looking for highs with subsequently higher highs and lows with subsequent higher lows. But again, these key areas are clearly evident on the screen, even with price action alone.

Example H, Price action Traders will also observe higher time frames, in this example, we are looking at a 4-hour chart of the EURUSD pair, traders try and establish what is going on with price action on the longer time frames because this will filter through to the lower time frames and where they will look for opportunities to jump on the overall trend should there be one.
Price action becomes repetitive, and this is because human nature in trading tells us that certain things are likely to happen at certain levels, typically key levels or round numbers, and if these things are recurring on a regular basis, human emotion would suggest that they are likely to continue to recur and therefore trading sometimes becomes a self-fulfilling prophecy where certain price action events, in the absence of fundamental reasons, is likely to continue in this vein. Price action levels become significant because market participants give significance to them.

In summarising price action who is the most significant aspect of Forex trading, and where by just using the minimum amount of technical tools you can more easily see areas of price consolidation, within resistance and support levels, and when these areas are breached we may see a continuation in price action in the direction of the breach, and by incorporating a simple moving average it can more easily help us to identify a trend. And that these very basic mechanisms are highly favored by professional and institutional traders.

Categories
Forex Daily Topic Forex Price-Action Strategies

Breakout Length: Key to Trend’s Strength

In today’s lesson, we are going to demonstrate the relation between the trend’s strength and breakout length. The breakout length usually represents one-fourth of a potential trend. If the breakout length is 25 pips, the trend may sustain up to 100 pips before making a big correction or long consolidation. It is important for breakout traders since the market often makes a breakout; confirms the breakout. However, the price does not head towards the trend direction. Let us clarify this by the examples below.

The price has been bearish upon making a bearish engulfing candle. The last swing low is quite far. This means the breakout length looks good for the sellers. The more the breakout length, the better it is for the traders.

The chart produces a bullish engulfing candle in between. This is bad for the sellers. The price may find its new resistance to produce a bearish reversal candle to make a breakout at the lowest low. This means the breakout length most probably needs to be adjusted.

The price seems to have found its new resistance here. It produces a do candle followed by a bearish engulfing candle. This means it produces an evening star. If the price heads towards the South and makes a breakout, the sellers may go short upon breakout confirmation. However, they must calculate new breakout length from the new resistance to the lowest low.

Here comes the breakout candle. This is an explicit breakout. The sellers are to wait for the price to make a breakout confirmation. If the next candle closes below the breakout candle, the sellers may trigger a short entry.

The confirmation candle looks to be an A+ breakout confirmation candle as well. However, do not forget the distance the price has already crossed. The price has crossed about 70% length considering the breakout length. Thus, the price may make a bullish correction. It usually happens when the price finds a new level of support/resistance. Let us proceed to the next chart.

The chart produces a big bullish engulfing candle, which changes the entire scenario. It happens when the price is about to make a correction. Sometimes corrective wave changes the trend. The sellers if the blindly trigger a short entry after the breakout confirmation without calculating breakout length and trend’s strength, they are to take a loss here.

Breakout strategy traders must calculate breakout length to determine how far the price could go. If it crosses more than 50% to confirm the breakout, it is better to skip such entries.


Categories
Forex Price-Action Strategies

When Price Finds New Support/Resistance

Price action traders are to be calculative and watchful. Breakout and breakout confirmation are two things that price action traders keep eyes on. Trend initiating candle is another important factor. We often see that the price upon finding its support/resistance does not make a breakout straightway. It sometimes makes a little correction and then starts trending to make a breakout. This new level of support/resistance plays a significant role in price action breakout trading. In today’s lesson, we are going to demonstrate an example of this.

The chart shows that the price after being bearish makes a bullish correction. It produces a bearish engulfing candle and drives the price towards the downside. However, look at the last candle. It comes out as a bullish engulfing candle. This means the price is to find its resistance again.

It does not take long to find its resistance. The next candle comes out as a bearish engulfing candle. The sellers are to keep their eyes on the pair to get a breakout. It seems that the price may head towards the South and make a breakout this time upon finding its new resistance.

The chart makes the breakout by the next candle. The sellers are to wait for the next candle to close below the breakout candle to trigger a short entry. Do not forget that it makes the breakout upon finding a new resistance.

The next candle comes out as a bearish candle having a long lower shadow. Thus, they should flip over to the 15 M chart to see how the last 15 M candle comes out. Despite having a long lower shadow, the last 15M candle comes out as a bearish candle too. The sellers may trigger a short entry right after the last candle closes. Stop Loss is to be set above the last resistance and Take Profit is to be set with 1R. This is why the new level of support/resistance plays a significant role.

The price heads towards the South but not with strong bearish momentum. It hits 1R though. The distance between new resistance to entry point= Entry point to Take Profit= 1R.

Whenever the price finds its new resistance/breakout, breakout traders must count those to set their stop loss and take profit level. Breakout trading needs the price to make a breakout with good momentum. If it takes any pauses before making a breakout, ignore the last support/resistance. It gives us better risk-reward as well as more chance of winning a trade.