
Introduction
Previously, we presented in a theoric way several criteria to realize wave counting, which could allow the wave analyst to foresee the likelihood next path of the market. In this educational article, we’ll analyze some examples in the real market.
Case 1 – NZDUSD Advances in a Corrective Sequence
The NZDUSD price in its hourly chart shows the progress in two consecutive corrective patterns. Our intraday analysis begins at the intraday high at 0.61305 reached on April 14th.
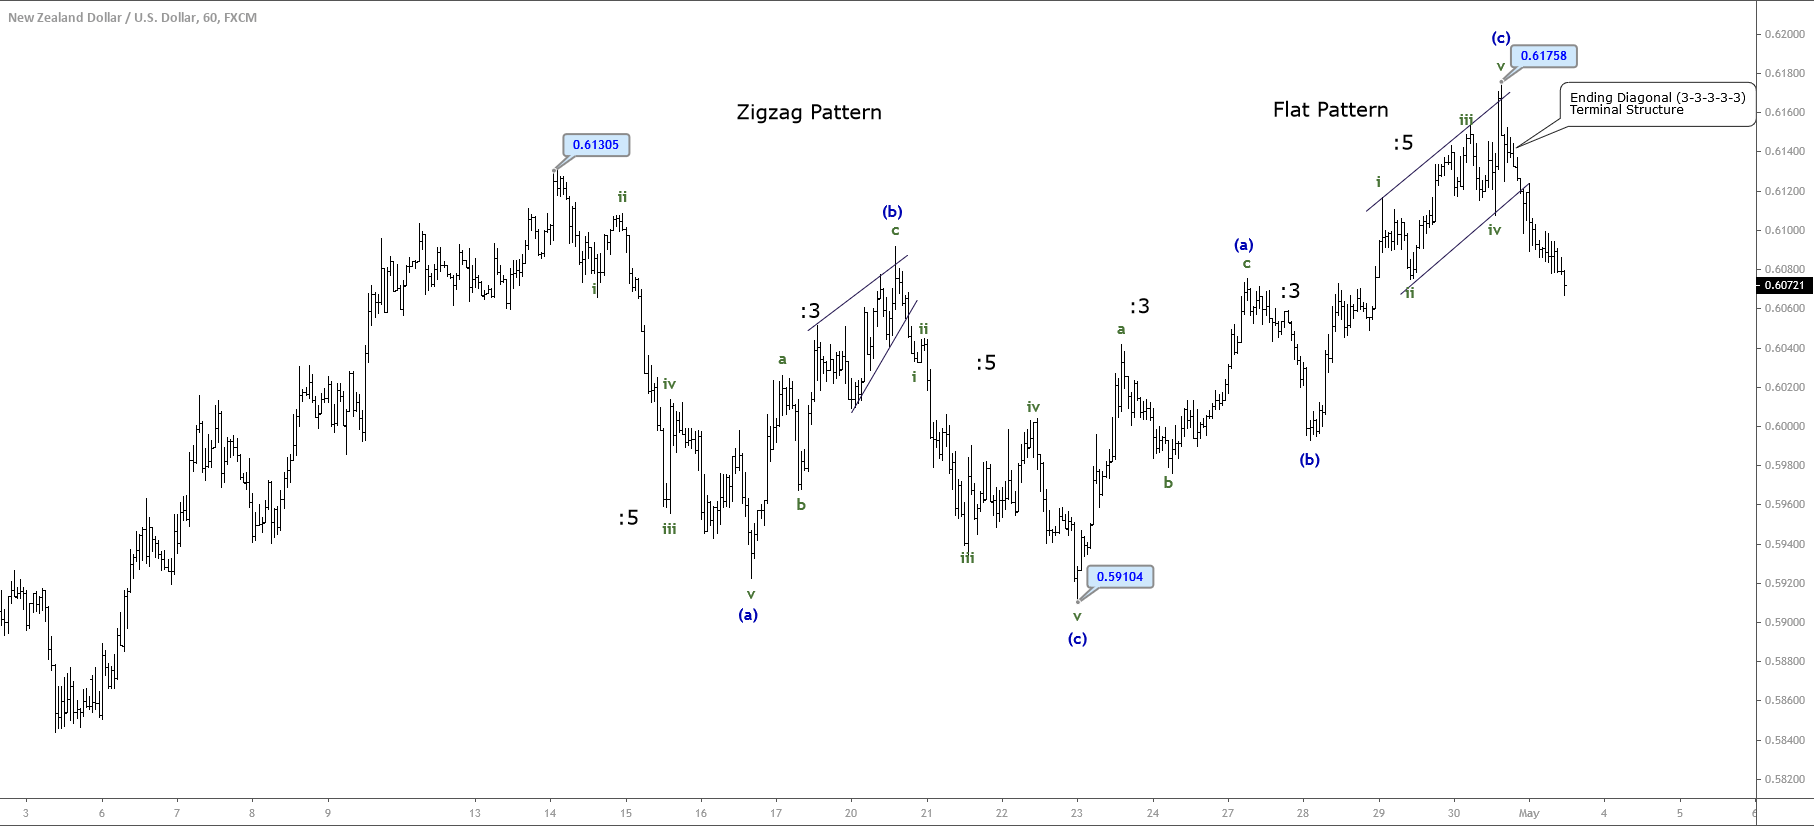
The price market reveals a decline in five internal segments of Subminuette degree identified in green. Once completed this move, the kiwi reacted bullishly, moving upward in three waves. This move ended a wave (b) of the Minuette degree labeled in blue.
Observe how the price action completed the wave (c) of Subimiuette degree, developing an ending diagonal pattern, as commented on the previous article. The breakdown of this Elliott wave formation suggests the beginning of a bearish sequence that will correspond to a wave (c) of the Minuette degree.
The bearish sequence corresponding to wave (c) ended at 0.59104 on April 23rd reveals us that NZDUSD completed a zigzag pattern of Minuette degree.
The next move, developed by the NZDUSD cross, reflected the advance as a flat pattern and ended at 0.61758 on April 30th, when the kiwi developed an ending diagonal in the same way that the wave (b) of the previous zigzag pattern.
On the other hand, from the two patterns analyzed, we note the alternation principle in the corrective sequence, while the first correction is a zigzag, the second one is a flat pattern.
Finally, the two consecutive corrective patterns, lead us to observe that NZDUSD completed a 3-3 sequence. In this context, the study of previous waves will reveal what should be the likely structure in progress and what could be the potential next move.
Case 2 – EURGBP Begins a Five-Wave Sequence from a Different Low
The second case considers the scenario when the market starts a five-wave sequence from a higher low.
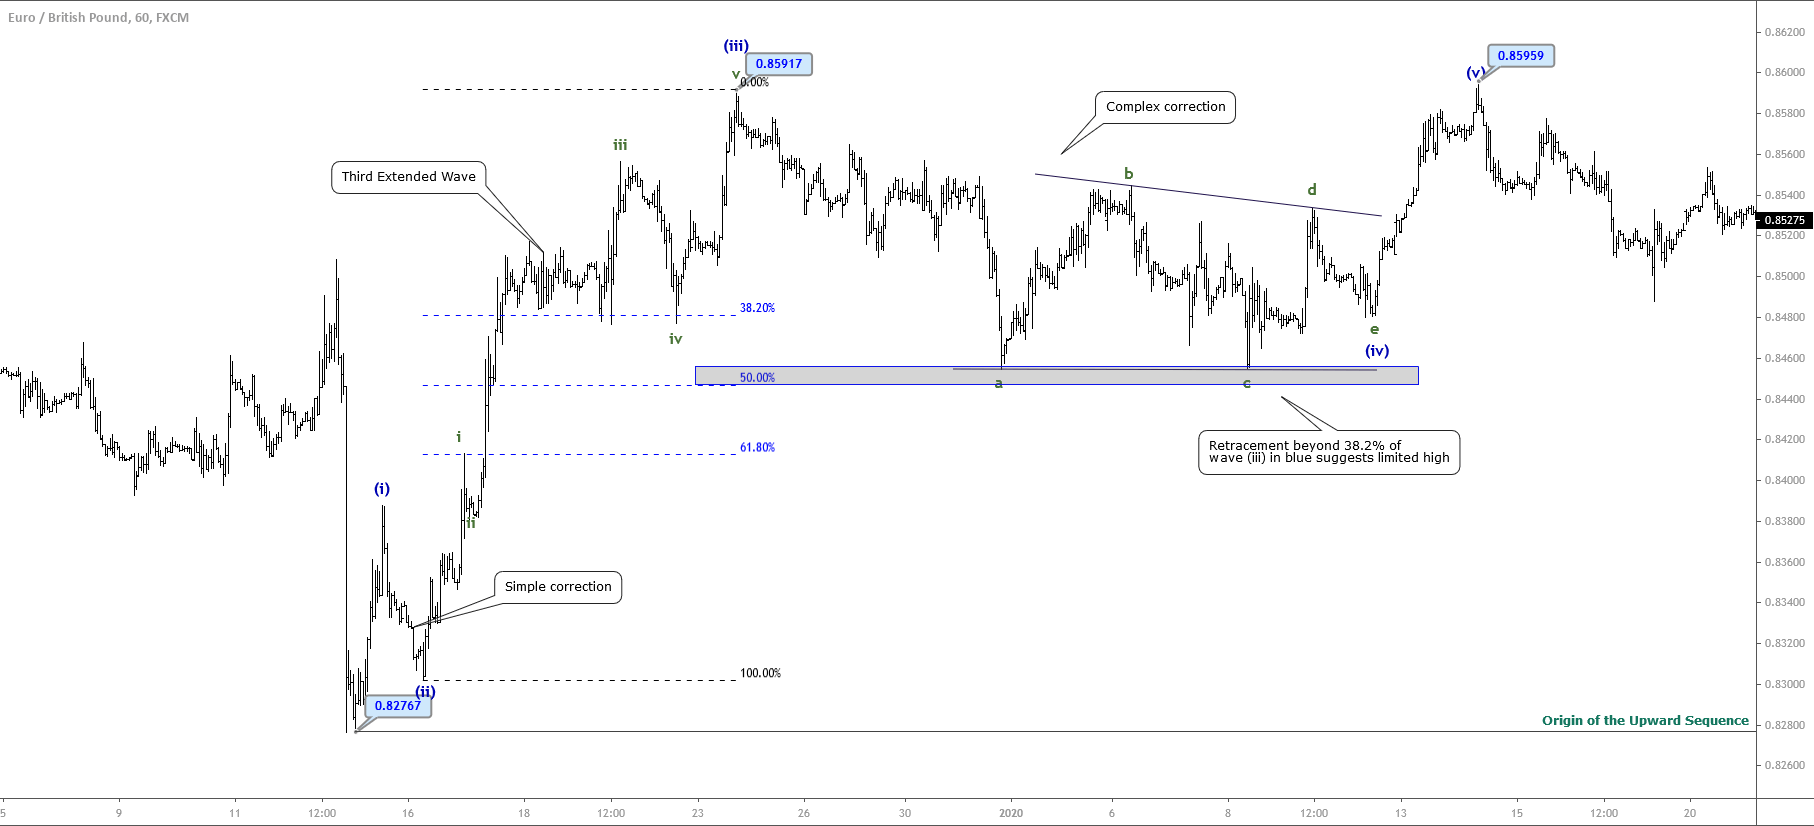
The EURGBP cross in its hourly chart shows the aggressive sell-off developed on December 12th, when the price plummeted to 0.82758. After this decline, the price consolidated and reached a slightly higher low at 0.82767 from where the cross began an impulsive movement identified as wave (i) of Minuette degree labeled in blue.
Once the second wave ended, EURGP realized a third extended wave, which boosted the cross until 0.85917 reached on December 23rd.
In this case, we observe the alternation principle in action. As the second wave is a simple correction. In consequence, the fourth wave must be a complex correction. In fact, from the chart, we observe that EURGBP developed a triangle pattern, which retraced beyond 38.2% of the third wave of Minuette degree. This context leads us to conclude that the cross should not reach a new higher high.
In this sense, the price action realized a limited higher high, which topped at 0.85959 last January 14th, from where it started to decline.
Conclusions
In this educational article, we showed a group of examples. In the first one, corresponding to the NZDUSD cross, we learned how the price action tends to end in ending diagonal patterns.
In the same way, we observed the alternation principle applied in corrective waves, while the first corrective structure corresponded to a zigzag, the second formation built a flat pattern.
In the second chart, we observed that an impulsive sequence not necessarily will begin in the lowest (or highest) level of the price chart. This context makes us remember that an Elliott wave structure could finish developing a failure in the wave 5 or C.
On the other hand, the retracement experienced by the third extended wave beyond the 38.2% warned us about the exhaustion of the bullish momentum. This context provides us a signal of the limited potential next move corresponding to the fifth wave.