Categories
Crypto Market Analysis

Daily Crypto Review, Apr 1 – Crypto Outperforming Traditional Markets in Q1

The cryptocurrency market had a pretty stable day as most cryptos consolidated within previously achieved levels. Bitcoin is currently trading for $6,341, which represents a decrease of 1.23% on the day. Meanwhile, Ethereum gained 1.08% on the day, while XRP gained 1.13%.

ICON took the position of today’s most prominent daily gainer, with gains of 15.80%. Nervos Network lost 8.51% on the day, making it the most prominent daily loser.

Bitcoin’s dominance dropped almost a whole percent over the past 24 hours. Its value is now 64.69%, which represents a 0.78% difference to the downside when compared to yesterday.

The cryptocurrency market capitalization did not move much throughout the day. Its current value is $179.50 billion. This value represents a decrease of $0.41 billion when compared to the value it had yesterday.

What happened in the past 24 hours

Digital payments company PayPal posted a new job listing, where it seeks to hire an Anti-Money-Laundering and Blockchain Strategy director that will work in their Global Financial Crimes (GFC) division.

The new director, which will be based in New York, will be in charge of evaluating the use cases of blockchain for the prevention of financial crimes.

Honorable mention

Bitcoin vs. the Traditional markets

April 1 brings us to the Q2 2020, as well as reports and analyses on how assets performed in Q1. Nikkei 225 was down 20%, which represents the worst quarter since 2008. The FTSE fell 14% for the period, which its second-worst quarterly performance ever. The S&P 500 lost 18% to close out Q1 2020, which is its worst quarterly performance since 1938.

While cryptocurrencies operate 24/7 and don’t exactly have quarters, it is important to look at them as well and compare the crypto market’s performance with the performances of other assets. The crypto market was down just 10% for 2020’s first three months, which is significantly less than the aforementioned traditional markets.

However, despite its relative resilience, bitcoin (and the rest of the market) has been trending downward along with traditional markets, which shows some form of correlation. This correlation across all assets can be explained by the saying that “macro matters more than micro.”

_______________________________________________________________________

Technical analysis

_______________________________________________________________________

Bitcoin

Bitcoin had a pretty stable day as there was no real volume to push the price up or down. The largest cryptocurrency by market cap still trades within a range, bound by $6,640 to the upside and $5,960 to the downside. As the price could not break the resistance level, we can expect a slow decline towards the support level if nothing changes on a macro level.


Bitcoin’s volume was steady and low in the past 24 hours. Its RSI level is currently at the value of 50.

Key levels to the upside                    Key levels to the downside

1: $6,640                                           1: $5,960

2: $6,850                                           2: $5,000

3: $7,085                                            3: $4,300


Ethereum

Ethereum spent the day with virtually no fluctuations. Its chart is mostly consisting of doji candles, hammer and inverted hammer candles, meaning that there is low volume, as well as great price direction indecisiveness. Ethereum gained just slightly over 1% on the day, which was just catching up to Bitcoin’s gains, which happened the day before. Ethereum most likely won’t move without Bitcoin moving first and deciding its direction.


Ethereum’s volume is extremely low, while its RSI value is currently at 53.

Key levels to the upside                    Key levels to the downside

1: $168                                                1: $128

2: $178.6                                            2: $122.5 

3: $185                                                3: $100


Ripple

XRP had a great day, even though its price gains do not show it. The third-largest cryptocurrency managed to get out of the descending range, which it was in for around a week. The price broke the upper trend line and then successfully retested the line, which held well.


XRP’s volume increased greatly during the retest of the trend line, while the rest of the day passed without much volume. Its RSI is currently at 54.

Key levels to the upside                    Key levels to the downside

1: $0.19                                             1: $0.165

2: $0.2                                               2: $0.147

3: $0.205                                             3: $0.1

Categories
Forex Market Analysis

Descending Trendline Resisting Crude Oil’s Bullish Bias – Get Set for Selling! 

The WTI crude oil prices slid further, as the Trump administration extended social-distancing guidelines through April 30, leading traders to expect lower fuel consumption ahead. U.S. Nymex crude oil futures shed a further 6.6% to $20.09 a barrel, the lowest level since February 2002. Brent tumbled 8.7% to $22.76.

Crude oil prices are still facing selling pressure, even after the fresh, positive news in the market. The continued concerns about the global economic slowdown from the coronavirus pandemic kept giving some support to the U.S. dollars as a safe-haven demand. 

The negative correlation between the U.S dollar and commodities are keeping the WTI prices in a selling mode. During the beginning of this week, physical demand for WTI and its prices fell globally. 


WTI Crude Oil – Daily Technical Levels

Support Resistance 

20.95       22.42

20.13       23.06

18.66       24.53

Pivot Point 21.59

The WTI crude oil prices are facing resistance at 21.90, which is extended by the downward trendline. On the lower side, support stays at 19.45 level, which is also extended by horizontal support level. The MACD is suggesting bearish bias along with all the fundamentals in the market. Today we can look for adding selling trades below 20.75 with a target of 19.40. Good luck! 

Categories
Forex Price-Action Strategies

Shallow Consolidation to Skip, Deep Consolidation to Go For

In price action trading, consolidation length is a vital factor. The deeper the consolidation, the further the price goes towards the trend. Sometimes, shallow consolidation takes the price towards the trend direction as well. However, we may skip taking entry when the price makes a shallow consolidation. In today’s lesson, we are going to demonstrate an example of these in the same chart.

This is a daily chart. The price after being bearish produced a bullish engulfing candle. The breakout trading strategy traders are to wait for the price to consolidate and produce another bullish engulfing candle to offer them entry.

The price consolidates with a doji candle followed by a bullish engulfing candle. It makes a shallow consolidation. Moreover, the bullish engulfing candle has a long upper shadow. The buyers may skip taking the entry. Let us proceed to the next chart.

The chart shows that the last candle comes out as a bearish candle. If the price consolidates from here, it is going to be a deep consolidation. Let us wait for a bullish engulfing candle closing well above consolidation resistance to trigger a long entry.

Here it comes. The chart produces a bullish engulfing candle closing well above consolidation resistance. The buyers may trigger a long entry right after the candle closes. The last swing high is quite far, offering more than 1R.

The next candle comes out as a bullish candle as well. The candle has a long upper and a lower shadow. Nevertheless, it is a bullish candle. It looks good for the buyers. The price keeps going towards the North with good momentum. It looks the price hits the last swing high easily.

It does not take more than two candles to hit the last swing high. The last candle suggests that the price may go further up. However, the buyers may consider closing their entry or at least take partial profit. The plan has worked wonderfully well for the buyers.

In this chart, we have seen a shallow and a deep consolidation together. Both have offered entries. However, to be safe, we need to stick with the breakout trading strategy’s rule. We may skip taking entry when the price makes shallow consolidation. In most cases, shallow consolidation brings less liquidity. It means it often goes wrong. On the other hand, if the price makes a deep consolidation followed by an engulfing reversal candle, we may trigger an entry.

Categories
Forex Videos

Win More Forex Trades With The Speculative Sentiment Index!

.Speculative Sentiment Index Index (SSI)

In this presentation, we will be looking at the speculative sentiment index and its significance in the forex market. If you have been researching some of the technical indicators that Traders use, such as the stochastic oscillator or perhaps the Bollinger bands or MACD, you will realize that the majority of them are lagging indicators. That is to say that the data they imprint on our computer screens are based on the previous or historical data, which it uses to plot the various graphs, moving averages and plot lines onto our charts.

Although this information, when carefully analyzed, helps us to determine to a great degree the potential future movements of price action, the very nature of such lagging indicators does not necessarily tell us what is happening at this very moment in time. Whereas price action, which is itself one of the only few leading indicators of price direction, does.
Although this does limit our trading ability to a certain extent, professional traders learn to marry the two together in order to tip the scales in their favor when it comes to pulling the trigger on trades.

Of course, the absolute perfect solution would be if we all traded the same way at the same time. This would be a perfect solution, but of course, it does not happen like this, because of the many different time frames being traded and the many different types of traders, from scalpers to intraday and swing to long term traders. But what if we could take a snapshot of what other traders are doing at any given time, and if we knew what they were doing, and if we could see statistically whether they were more long or more short on a particular pair, this would give us an added advantage, would it not?
This is exactly where the speculative sentiment index comes into play. It should be considered as a leading indicator, along with price action, and incorporated with your other technical tools to help you decide when to trade. So let’s take a look at how it works.


Example A, The speculative sentiment index or SSI is the accumulative trading positions data, which is captured in real-time by various brokers, as there is no central exchange.


Example B, The broker will then filter the information and offer it in graph format where each pair tells traders whether there are more buyers than sellers or vice versa. The information is provided as a ratio between the two groups.


Example C, If we know that there are more buyers or sellers on a particular currency pair that we are interested in trading, it can help to influence us either to take the trade or maybe even to wait on the sidelines. But one of the problems with the SSI is that the information will very likely differ from broker to broker, and from time frame to time frame, in which case it might be advisable for you to check two or three SSi’s on various brokers to help give you a clearer overall picture of which way price action is leaning.


Example D, Some SSiI’s provide more information than others. For example, you might expect to see the positioning, including the ratio of long to short.


Example E, The open interest


Example F, And the change between long and short positions

The more information, the better your decision-making processes will be.


Example G, Next we are going to look at how to use the SSI.


Example H, The positioning statement is one of the most utilized aspects of the SSI report.


Example I, Here we can see the numbers of traders who are long or short on a pair, and in this example, we can see that this broker offers the change in open interest, which is currently – 2.8% for the EURUSD pair. So for every one trader that is holding a long trade in this pair, there are 2.81 traders who are holding short positions. Any position that shows a minus in front of the number represents the number of short positions, while readings that are above zero represent the number of traders who are net long in the pair.

Although the SSI is a leading indicator, it is considered to be contrarian, that is to say, that the information that is supplied by the broker should be used to trade against the retail traders with currently open positions.

Example I, The rationale behind the contrarian aspect of this indicator using the 2.8% of EURUSD traders as an example who are short, means that eventually, the sellers will need to close those positions – by buying the pair to exit and because we know there is only one buyer for every 2.8 sellers, this position will eventually turn as the sellers close out their traders and leave a buying void behind them. And the opposite would apply if there were more buyers than sellers. To maximize the reversal potential of this indicator, it is advised to use it when there is a high ratio of change between the buyers and sellers.

Please remember to check SSI’s on a regular basis because some of them will be updated by the broker on a daily time frame basis, whereas some will update them once an hour or even every 20 minutes. It is important that if you decide to use this information to trade that it is as up-to-date as possible. Only then will it help you to determine whether a particular currency pair is bullish or bearish.

Categories
Forex Basic Strategies

Trading The ‘London Session’ Like A Professional Technical Trader

Introduction

In total, there are five major trading sessions in the Forex market, and we have already discussed the New York Breakout Strategy. In this article, let’s learn the best way to trade the Forex London session.   The London session is one of the biggest market movers because a lot of trading volume for instrument trading occurs in this session. The volume of the instrument essentially means the total amount of money that moves the market in any particular session.

Most of the financial centers and major banks start their day around the London session. These banks and institutions try to accommodate their clients in this session alone. This is one of the reasons why the price action is quite volatile and aggressive in this session. In other words, for retail traders, the London session is a prime window to make huge profits from the market. Because of the higher the volatility, the more the trading opportunities.

In this article, we will be sharing some of the proven techniques that can you can use to trade the London Session. The key to finding success while trading the London session is to be extremely disciplined. It is crucial to follow the rules of the strategy and do the required analysis before the London opening. If we miss our entries at the time of the London opening, we can’t expect a second chance to get back with the trend.

London session opens at 8 AM GMT. If you are not aware of the exact time when the London sessions open, you can make use of the Forex Time Zone Converter to accurately find the opening of this session in your local time.

London Session – Breakout Trading Strategy

We have backtested the strategies that have been mentioned below. The results revealed that most of the time, these strategies provide trading opportunities during the first three hours of the London session. Sometimes, the volatility picks up 30 minutes before the opening of the London suggest. But we always recommend you activate your trades only after the opening of the London session.

  1. Find out any currency pair which is in a strong uptrend.
  2. Price action must hold below the resistance line if the market is ranging before the opening of the London session.
  3. Wait for the breakout to happen in the London session.
  4. Let the price action hold above the breakout to confirm if the breakout is valid.
  5. Take a buy entry.
  6. Place the stop-loss below the breakout line.
  7. Take-profit can be placed at the next resistance area.

The same is the opposite in a down-trending market and when we are willing to go short.

Identifying The Currency Pair

The below AUD/CHF Forex pair represents an up-trending market.

Confirming The Breakout

We can see a breakout happening at the opening of the London session. This indicates that the big players are now ready to move the market. The price action held above the breakout line, indicating that the breakout is real. Going long at this point will be a good idea.

Entry, Stop-Loss & Take-Profit

In the below image, you can see that we have taken a buy position right after the breakout in the London session. The stop-loss is placed just below the recent low, and we chose the higher timeframe’s major resistance area to place our take-profit. A lot of traders believe that if they use this strategy to trade the London session, they must close their positions on the very same day. But that’s a wrong perception as we should be deciding that depending on the market conditions. It is logical to hold your positions until the price reaches our desired take-profit area.

London Breakout + MACD Indicator

In this strategy, we have used the MACD indicator to trade London breakouts. MACD is a celebrity indicator which is popular among most of the professional traders. MACD stands for Moving Average Convergence and Divergence. This indicator consists of two lines; the first one is the MACD line, and another one is known as the second line. MACD is a trend following indicator which is used to identify the overbought and oversold market conditions.

The strategy here is to wait for the breakout to happen right after the opening of the London session. At the time of breakout, check if the MACD indicator is at the oversold area. If yes, it is a clear indication for us to go long. If the MACD is above the zero lines, it is even a greater sign as it indicates that the ongoing trend is strong. Anticipating bullish moves from this point will be a good idea.

The below price chart represents the AUD/CAD Forex pair, and we can see the market is in an uptrend.

In the below image, it is clear that the MACD lines crossed over precisely when the breakout happened at the London opening. This is a clear indication for us to look out for buy opportunities in this currency pair.

We went long right after the breakout in the London session as it was confirmed by the MACD crossover.  We have placed the stop-loss just below the resistance line. We can set the stop-loss order according to our trading style. If you are a confirmation trader, wait for the things to be in your favor to make an entry and use a wider stop-loss. If you are an aggressive trader, the stops below the recent candle are good enough.

If you are a conservative trader, the stops we placed in the below example is good enough. We always suggest you close your positions at the next resistance area. You can follow that process for this strategy as well. Here in this example, we tried to be a bit creative and closed our positions when the MACD indicator gave us an opposite signal. When the MACD indicates that the market is in an overbought condition, it means that the buyers are exhausted now, and it’s time for us to go short. You can see the bearish moment in the market right after we have booked our entire profits.

Conclusion

Both of the strategies mentioned above are simple and easy to use to trade the London market. If you are a beginner, we suggest you practice them first on a demo account. London breakout often gives reasonable risk to reward trades, and most of the trade results can be seen within a few hours. Make sure to follow all the rules of the above strategies to have the edge over the market. All the very best.

Categories
Forex Elliott Wave

Analyzing the Triangle Pattern – Intermediate Level – Part 1

The triangle is a corrective pattern that has five internal segments. In this educational article, we will review how to analyze the triangle formation.

Triangles and their Characteristics

Within the set of corrective structures defined by R.N. Elliott, triangle formations are more complex to analyze compared to flat and zigzag patterns. This complexity occurs because there is no specific time span that marks the end of this structure.

Despite the complexity of the triangles, it is the most common Elliott pattern to find in the real market. The knowledge of this formation will help wave analysts to understand the price position within the market.

Construction Rules

The construction rules defined for the triangle pattern are detailed as follow:

– Triangles have five internal waves, regardless of the complexity of the inner segments.
– A complete three-wave corrective structure builds each part that makes up the triangle.
– The triangle can have a bullish or bearish inclination. However, its internal structure should not change.
– The triangle has six reference points of the same degree, the origin of wave A, and the end of waves A, B, C, D, and E. From these six extremes, the wave analyst should only channel four points through the contraction lines. The points to consider are the end of wave A with the end of wave C and the end of wave B with the end of wave D.
– The base-line of the triangle is the line that joins the end of waves B and D, and its function is similar to the guideline that joins waves 2 and 4 in an impulsive wave.

The following figure represents the construction model of the triangle pattern.

As can be noted, the triangle pattern tends to appear in a fourth wave or a wave B, in some exceptional cases, this pattern could appear in a second wave.

GBPUSD Consolidates in a Triangle Sequence

The next figure illustrates the GBPUSD pair in its 4-hour timeframe. In the chart, we observe that the Cable rallied since September 03rd when the price found its bottom at level 1.19589.

Once the GBPUSD pair moved in three waves identified in green, the fourth wave consolidated sideways, developing an expanding triangle.

The triangle pattern reveals the alternation principle in terms of time and price.

The GBPUSD pair alternated in terms of time being the triangle pattern more extended in comparison with the second wave. In the same way, the retracement developed by the second wave is sharp compared with the narrow correction realized by the fourth wave.

JP Morgan Consolidated in a Triangle Pattern

The chart below shows JP Morgan Chase & Co (JPM) in its log-scale 2-day timeframe. The ticker JPM developed a bullish impulsive sequence subdivided in five waves from early 2016 when the price found buyers at $52.50 per share.

In the same way, the third wave that was formed corresponds to an extended wave, which makes us conclude that the first and fifth waves will not be extended, and they will be similar in terms of price, time, or both. In this case, both waves are identical in terms of time.

On the other hand, we observe that JPM consolidated developing an expanding triangle pattern with a slight bearish bias. Besides this structural bias, the internal sequence is respected by the price action.

Also, we distinguish the wide extension of the triangular sequence, which moved from late February 2018 until mid-August 2019, when JPM ended its internal wave E labeled in green.

Once JPM completed its fifth internal segment, the price action continued its previous bullish trend and soared to record highs at $141.10 per share.

Conclusions

From the cases analyzed, we can verify the Genn Neely’s affirmation that suggests that “the triangle pattern is a common formation that appears in the market.”

Also, we verified how the alternation principle works in the real market, while a corrective wave is simple, the other will be complex.

Finally, according to the examples reviewed, the triangle pattern could appear independently of the market analyzed,  as on currencies, stocks, indices, etc.

In the next article, we will review the different variations of the triangle pattern.

Suggested Reading

  • Neely, G.; Mastering Elliott Wave: Presenting the Neely Method; Windsor Books; 2nd Edition (1990).
Categories
Forex Market Analysis

Daily F.X. Analysis, March 31 – Top Trade Setups In Forex – Consumer Confidence Under Spotlight! 

On Tuesday, the market is mostly focusing on the major and medium impact economic events due to come out from the Eurozone and the United States. In the U.S., the Conference Board will publish March Consumer Confidence Index (110.0 expected). The Market News International will release March Chicago PMI (40.0 expected). S.P./Case-Shiller will report the 20-City Composite Home Price Index for January (+0.4% on month expected). 

Economic Events to Watch Today     


EUR/USD – Daily Analysis

The EUR/USD retreated 1.0% to 1.1029, snapping a five-day rally. Official data revealed that the eurozone’s Economic Confidence Index slid to 94.5 in March (91.6 expected) from 103.4 in February. 

Later today, the eurozone’s March CPI (+0.6% on-year estimated) and German jobless rate (5.1% expected, 5.0% in February) will be reported. The global equities recovered last week, as in result, the greenback weakened its bid tone and helped EUR/USD rise from 1.0636 to 1.1148. 

That was mainly due to the U.S. Federal Reserve declaring an open-ended asset purchase program, and the U.S. Senate passed a special $2 trillion fiscal relief package. 

Italy marked as the second-highest country of confirmed cases in the world after the United States (105,470). Total cases are 92,472 confirmed, marking up the highest death rate in the world. 

The eyes will be on the risk market sentiment, which could turn pro-risk, as the China data released in Asia showed the manufacturing activity recovered sharply to above-50 levels or expansion territory.

The risk-on rally could weaken the safe-haven demand for the U.S. dollar and send EUR/USD higher. On the data front, the German Import Price Index for February and the Unemployment Rate is scheduled to release with the preliminary Eurozone Consumer Price Index for March. Besides this, the U.S. Consumer Confidence and the Chicago Purchasing Managers’ Index are also scheduled to release.

Daily Support and Resistance   

  • S1 1.0862
  • S2 1.0958
  • S3 1.1002

Pivot Point 1.1054

  • R1 1.1099
  • R2 1.1151
  • R3 1.1247

EUR/USD– Trading Tips

Technically, the EUR/USD is trading slightly bearish at 1.099, having an immediate support level of around 1.0947. The major currency pair has formed a bullish channel which is supporting the EUR/USD pair around 1.1060, and below this, the next support is likely to be found around 1.1000. 

On the higher side, the EUR/USD pair is facing resistance at 1.1150 area. Bullish crossover of 1.1060 area can open further room for buying until 1.1185 level. Whereas, the chances of a bearish bias will remain strong if the pair continues to hold below 1.1060 level today. On the lower side, the target is likely to stay at 1.0947 and 1.0885. 


GBP/USD– Daily Analysis

The GBP/USD dropped 0.7% to 1.2364. We haven’t seen much movement in the GBP/USD as the United Kingdom continues to struggle efforts and seems very close to open the world’s biggest hospital, which built-in 10-days. They are also ordering approximately 15,000 ventilators more while saying that it needs to cope with the coronavirus outbreak.

The global news agency, Guardian, indicates the risk for the European Union citizens who have made their houses in the U.K. illegally. Whereas, Dr. Jenny Harries, deputy chief medical officer for England, said during his daily press conference on Sunday that the current limitations and lockdowns in the U.K. could continue for six months.

At the USA front, U.S. President Donald Trump did not suggest the overall lockdown in the country and said no to nationwide stay-at-home order while helping to continue the previous day’s risk-on tone. As in result, the U.S. ten-year treasury yields and most Asian stocks flashing green and mark moderate gains by the press time.

Looking forward, the final figures of the U.K.’s fourth quarter (Q4) GDP, expected to march 0.0% initial forecast, will likely offer fresh direction ahead of the U.S. data. However, news regarding the Brexit and the virus updates will be kay to watch.

Daily Support and Resistance

  • S1 1.2131
  • S2 1.2256
  • S3 1.2319

Pivot Point 1.238

  • R1 1.2444
  • R2 1.2505
  • R3 1.263

GBP/USD– Trading Tip

Technically, the GBP/USD is trading sideways around within a narrow trading range of 1.2275 – 1.2425. Since the Sterling has already crossed over 1.2275 resistance area, this is now going to work as a support. The MACD is still heading into the bullish zone, suggesting strong chances of buying the GBP/USD pair.

On the 4 hour timeframe, the GBP/USD pair is pretty much likely to find resistance around 1.2520, along with support around 1.2278. In the case of market breaks bellow 1.2278, we may see GBP/USD prices heading into the selling zone until 1.2100 and 1.2005. Whereas, the chances of buying remains solid over 1.2275 until 1.2520.


USD/JPY – Daily Analysis

The USD/JPY currency pair found on the bullish track and rose to 108.72, mainly because the risk sentiment remains positive. The slight recovery in the greenback also keeps the pair higher. Elsewhere, the traders gave a little attention to Japan’s data-dump. 

Right now, the USD/JPY is currently tradings at 108.52 and consolidates in the range between the 107.78 – 108.72. However, the currency pair also took from the U.S. policymaker’s statement.

At the data front, Japan’s February month data dump, including Retail Sales, Industrial Production and Unemployment Rate, overall flashed upbeat signals. Whereas the Retail Sales (YoY) surprised markets by crossing -1.2% forecast to 1.7%, the preliminary figures of Industrial Production (MoM) also increased above 0.1% expected to 0.4%. While the Unemployment Rate remained stable at 2.4% with Job/Applicants Ratio returning below 1.47 forecast to 1.45.

At the U.S. economic front, U.S. President Donald Trump did not suggest the total lockdown in the country and suggested no to nationwide stay-at-home order while helped to continue the previous day’s risk-on tone. As in result, the U.S. ten-year treasury yields gain 5-basis points (bps) to 0.72%, and most Asian stocks flashing green and mark moderate gains by the press time. Consequently, the USD/JPY pair is exhibiting bullish and bearish biases both. Let’s look at the technical side. 

Daily Support and Resistance

  • S1 105.89
  • S2 106.85
  • S3 107.35

Pivot Point 107.82

  • R1 108.31
  • R2 108.79
  • R3 109.76

USD/JPY – Trading Tips

Technically, the USD/JPY is trading at 108.270, heading north to examine the resistance level of around 108.615. At the moment, the USD/JPY pair is consolidating within a narrow range, where the upper limit is 108.500, and the lower limit stays at 107.150. 

The USD/JPY may face a bullish pressure in the wake of the bullish engulfing candle, which has been formed on the 4-hour chart around 108.500 area. Such a pattern represents the dominance of bulls in the market. Consequently, the bullish breakout of 108.650 resistance level can lead the USD/JPY prices higher towards 109.750 level. Until then, we should look for doing choppy trading by selling below 108.600 and buying over 107.250. All the best for today!  

Categories
Crypto Market Analysis

Daily Crypto Review, Mar 31 – Opera browser openly supporting crypto; Markets in the green as BTC pushes towards $6,640

The cryptocurrency market has recovered from the downside push as Bitcoin regained strength and reconquered $6,000. In the past 24 hours, almost every single crypto was in the green. Bitcoin is currently trading for $6,419, which represents an increase of 6.53% on the day. Meanwhile, Ethereum gained 3.21% on the day, while XRP gained 2.4%.

Energi took the position of today’s most prominent daily gainer, with gains of 18.77%. There were no big losers on the other side as only two cryptos out of the top100 managed to be in the red. Status lost 1.444% on the day, making it the most prominent daily loser.

Bitcoin’s dominance dropped half a percent over the past 24 hours. Its value is now 65.47%, which represents a 0.56% difference to the downside when compared to yesterday.

The cryptocurrency market capitalization steadily increased over the course of the day. Its current value is $180.91 billion. This value represents an increase of $6.9 billion when compared to the value it had yesterday.

What happened in the past 24 hours

A web browser Opera now enables its users to access decentralized web pages with the .crypto domain extension. They made it possible through a partnership with Unstoppable Domains. This will allow users to access and surf decentralized websites, as well as to make cryptocurrency payments.

Honorable mention

Tron

Tron (TRX) founder Justin Sun posted a tweet announcing the release of Djed on Mar 28. Djed is a system for collateralized loans that he described as “something new.” However, the Djed platform was immediately criticized by the market as many think it is a copy of MakerDAO (MKR).

_______________________________________________________________________

Technical analysis

_______________________________________________________________________

Bitcoin

Bitcoin quickly and efficiently recovered from its most recent push down as its price regained previous levels. The largest cryptocurrency by market capitalization went over $6,000 yesterday, while it established its position today and even made a push towards new highs (namely the immediate resistance of $6,640). However, the push failed due to a lack of volume. Bitcoin’s future is still uncertain mostly due to external difficulties the world is facing rather than Bitcoin’s internal problems.


Bitcoin’s volume was somewhat higher than yesterday, but still at low levels. Its RSI level on the 4-hour chart is just above the middle of the range.

Key levels to the upside                    Key levels to the downside

1: $6,850                                           1: $5,960

2: $7,085                                           2: $5,000

3: $7,420                                            3: $4,300


Ethereum

Bitcoin’s downturn pushed Ethereum below the $128 support level, but as Bitcoin recovered, so did Ethereum. The second-largest cryptocurrency by market cap regained its previous support level and pushed higher up. The lack of volume prevented it from even reaching the $139 resistance level, forcing the price to consolidate within the range. Ethereum will most likely keep following Bitcoin’s price movements in the short term.


Ethereum’s volume is currently lower than the previous week’s volume, as well as overall. Its RSI level is just below the mid-range, with a value of 49.

Key levels to the upside                    Key levels to the downside

1: $168                                                1: $128

2: $178.6                                            2: $122.5 

3: $185                                                3: $100


Ripple

XRP passed over the $0.165 resistance level over the weekend, which was a great milestone towards establishing a stable price. However, the most recent downturn brought its price below this key level yet again. XRP quickly recovered and regained $0.165 as Bitcoin increased in price and pulled the whole market with it. However, the short-term future does not look good for XRP if it keeps trading within the descending range, making lower lows and lower highs.


XRP’s volume is on the same level as it was the previous week, while its RSI level is slowly descending. At the time of writing, its RSI has a value of 50.5.

Key levels to the upside                    Key levels to the downside

1: $0.19                                             1: $0.165

2: $0.2                                               2: $0.147

3: $0.205                                             3: $0.1

Categories
Forex Signals

USDCAD to retest 1.4500 level


USDCAD 1 Hour Chart

The pair has been consolidating between 1.40 and 1.41 and has breached the upper resistance level. With oil prices further in the red today and with recent price action in USDCAD failing to reach the key 1.40 handle traders will be looking for a retest of the highs around 1.45 and maybe beyond.

This is a typical consolidation pattern that traders look for with at least two attempts for price to break out of the consolidation range.

Coupled with President Trump deciding not to put New York into lockdown which has given the US Dollar a small lift in the current session and adds to our theory that this set up should prevail and price action in the pair should continue to trend higher.

Key levels are:


  • Entry: 1.4140 Long position taken,
  • Stop Loss: 1.3995
  • Target: 1.4525

Risk:

Categories
Forex Course

90. The ATR Indicator & Its Corresponding Trading Strategy

Introduction

ATR (Average True Range) is a popular volatility indicator in the market. It is used to find how much the instrument moves on an average over a given period of time. This indicator is introduced by J. Welles Wilder Jr. in his book, ‘New Concepts in Technical Trading Systems.’ Apart from ATR, this book also includes some of the most famous technical indicators such as RSI, ADX, and Parabolic SAR, etc.

The ATR indicator was originally developed to trade the commodities market, but it has been modified in such a way that it could be widely used for stocks, indices, and the Forex market as well. This indicator is not developed to indicate the price direction. Instead, it is used to measure the volatility of the instrument, which is caused by the gaps, up & down moves. ATR is a boundless indicator, unlike the other indicators we learned till now. Higher the ATR level, higher is the market volatility, and lower the ATR level, lower is the volatility of the underlying asset.

Below is an illustration of how this indicator looks on a price chart.

Trading With The ATR Indicator

The image below represents the ATR indicator on a GBP/AUD Forex chart. The orange box indicates the pullback phase, and at this phase, we can see the ATR indicator keeps going down. This means that there is currently low volatility in this pair. Conversely, the uptrend in the Green box indicates high ATR value. This means the big players are back in the business, and they are accumulating big chunks. As a result, the instrument is quite volatile. Furthermore, the yellow box again shows a decline in volatility.

Traders can use this indicator to get an idea of how far the price of an asset is expected to move on a daily basis. We suggest you use this way of trading only on higher timeframes such as daily, weekly, and monthly. If the last closed candle of a daily chart shows 50 ATR value, it means that the last candle has moved 50 pips, and we can expect the next day price movement to move similarly.

First of all, we must find out the ATR value of the last closing candle on the daily chart. Then we can look for buy/sell opportunities at the opening of a new day’s candle. The profit target should be based on the last day’s ATR value. Some traders also use double the value of the ATR indicator to place their take-profit orders. It all depends on what kind of trade you are. If the ATR value is 50, we can go for 50 pip target (conservative move), or you can even go for the 100 pip target (aggressive move)

We can also use the ATR indicator for placing Stop-loss orders. When the ATR gives us the value of the present day, we can use those values to place the stop-loss orders below or above our entry points. If the market hits the stop-loss, it means that the daily price range is moving in the opposite direction. Hence we must exit our positions as soon as we can. The major benefit of placing the stop-loss orders by using the ATR value is that we can avoid the ‘market noise.’ That is, the unusual up and down moves will not stop us out.

Changing the Settings of this Indicator affects its Sensitivity

The standard setting of this indicator is 14, which means the ATR indicator will measure the market based on the last 14 candles. If we use a setting lower than 14, it makes the indicator more sensitive, and it will show us a choppier ATR line. On the other hand, a setting above 14 makes the indicator less sensitive to the price action and shows smoother reading.

In short, most of the Traders use the ATR indicator to check the market volatility and to place the stop-loss & take-profit orders. The higher value of the indicator implies that we must go for deeper stops, and the low value means we must go for smaller stops.

That’s about the ATR indicator and its use cases. Try using this indicator to check the market volatility and place accurate stop-loss orders. There are traders who use this indicator to enter the market as well, but those are advanced strategies that we will be discussing in the future. Cheers.

[wp_quiz id=”68339″]
Categories
Forex Signals Forex Videos

Free Signal Service! Forex Academy Are Putting Our Money Where Our Mouth Is!


Welcome to our Brand-new Live Signal Table!


In its effort to help traders learn while profiting from the Forex markets, Forex Academy is proud to offer its users our premium Live Signal table at an unbeatable price: 100 percent free!

The fact it is free to all who subscribed to our notification service does not mean ours is a C-quality service. We have a team of top traders who will continuously watch the market to deliver top-quality trade ideas for you. The resulting trades can be monitored live in our signals section, which will show you the current situation of live trades and the total pip count gained or lost by our traders.


Table guide

In the image, we can see the information provided:Date/time shows the Date and time when the trader created the signal. But that does not mean the signal is live. That will depend on the order type of the signal.

We can create several order types. These are shown in the Order Type column.

The different orders are the following:

Spot buy, Spot Sell: these two are market orders. In this case, the signal is live at the moment shown by the Date/Time column.

Buy Stop, Sell Stop: These are pending orders meaning the order is pending until the price reached the stop level. The price on a buy-stop order is placed above the current market level, whereas a Sell-Stop order is placed below the current market price. a Stop order is a usual way to capture a breakout.

Buy Limit, Sell Limit: These are also pending orders.  In this case, a limit order intends to capture an entry at a pullback of the price. That means a buy limit order is usually below the current price, and a sell limit is above the current price.

To recap: If the order is spot, the signal becomes live immediately. If the order is pending, it is, well, pending, and it will be live at the moment the stop or limit condition is fulfilled.


The Asset column tells the information of the currency pair

The Method column will link to the article explaining the trade idea, which will describe the technical details and main levels. We also will include the risk per lot, mini- and micro-lot, so you can adapt the position size to your current trading account balance.

Then the table shows the price entry, stop-loss, and take profit levels. This will completely define the trade.

The R/R  column is the Reward-to-risk ratio. This is a key metric for the long-term profitability of any system, and we like our signals to show ratios higher than one, preferably two or more. However, if the likelihood of the trade is high, we can present R/R of 1.


Price shows the current live price of the assets of the table. Closing Date/time will show the closing time of the trade. If the trade is closed, the price column will display its closing price. If the trade is still open, the field shows nothing.

The Pips column shows the total pips gained or lost.. If lost, the price box is red-colored. On assets with positive pips, the box is green-colored. The figures shown are updated in the current live trades. On closed trades, it shows the final pip count.


The Notifications

Our interested users can subscribe for notifications for free, as said earlier. The members of our subscription list will receive push notifications for the following events:

When a new signal is published

When a pending signal becomes live

When a stop-loss is hit, and the trade is closed

When the take-profit is hit, and the trade is closed

When we manually close the trade


How to subscribe

The subscription is quite simple. You don’t need to supply any information. Just click the notification bell located at the bottom right of the Signals page and you’re done. It will touch you every time there is a novelty in the Signals section, as mentioned earlier.

Do not doubt and subscribe!

Categories
Crypto Market Analysis

Daily Crypto Review, Mar 30 – Bitcoin back above $6,000 as Trump publicly supports printing $6.2 trillion

The cryptocurrency market, as it could not break the immediate resistances ahead, had a leg down over the weekend. The market stabilized with Bitcoin at above $6,000 for now. Bitcoin is currently trading for $6,223, which represents an increase of 1.34% on the day. Meanwhile, Ethereum gained 0.41% on the day, while XRP lost 1.28%.

Energi took the position of today’s most prominent daily gainer, with gains of 10.57%. On the other side, Steem lost 8.34% on the day, making it the most prominent daily loser.

Bitcoin’s dominance stayed at virtually the same place when compared to Friday’s value. Its value is now 66.03%, which represents a 0.13% difference to the downside when compared to before the weekend.

The cryptocurrency market capitalization took a big hit in the past 24 hours due to a sharp move down. Its current value is $174.01 billion. This value represents an increase of $13.06 billion when compared to the value it had on Friday.

What happened in the past 24 hours

Bitcoin (BTC) gains more and more support after the US President Donald Trump appeared to say he fully supported manipulating the dollar by printing $6.2 trillion.

Trump defended the Federal Reserve for printing more than $6 trillion with the words “It’s our money, we are the ones, it’s our currency,” which got quite a backlash.

Honorable mention

Ethereum

Data published the co-founder Covalent (an Ethereum analysis firm) Ganesh Swami announced that DeFi transactions are increasing its share of Ethereum block space, which goes at the expense of ETH transfers.

Swami said that the gas costs incurred by Ethereum transactions went up progressively.

_______________________________________________________________________

Technical analysis

_______________________________________________________________________

Bitcoin

After not being able to break the $6,850 resistance for quite some time, a leg down from Bitcoin was to be expected (check our previous reports). The largest cryptocurrency by market capitalization fell below $6,000 psychological support (and $5,960 support level), but quickly recovered and stayed above it. Bitcoin is currently trading at just above $6,200.


Bitcoin’s volume is average when compared to the previous week, while its RSI level on the 4-hour chart went from severely oversold to the middle of the range.

Key levels to the upside                    Key levels to the downside

1: $6,850                                           1: $5,960

2: $7,085                                           2: $5,000

3: $7,420                                            3: $4,300


Ethereum

Ethereum went through a similar price path as Bitcoin did. Its price fell down below the $128 support level as bulls could not break the $139 reliably, but quickly recovered and went above the support level. It is currently trading at above $130, where it looks pretty safe from any downturns in the short-term.


Ethereum’s volume is on the same low levels as it was the previous week. Its RSI level has risen to the middle of the value range after almost reaching oversold territory during the price drop.

Key levels to the upside                    Key levels to the downside

1: $168                                                1: $128

2: $178.6                                            2: $122.5 

3: $185                                                3: $100


Ripple

XRP received a great surge in volume as its price rose above the $0.165. The weekend brought bad news for XRP as bears took over and brought its price below the key level of $0.165. However, the third-largest cryptocurrency quickly overcome the downtrend and went back up above this key level.


XRP’s volume increased greatly during the spike, while the rest of the volume is average when compared to the past week. Its RSI level is on the upswing, currently passing the value of 55.

Key levels to the upside                    Key levels to the downside

1: $0.19                                             1: $0.165

2: $0.2                                               2: $0.147

3: $0.205                                             3: $0.1

Categories
Forex Daily Topic Forex Price-Action Strategies

Long Shadow in Breakout Confirmation Candle

In price action trading, breakout, as well as confirmation candle’s attributes, plays a significant role. In today’s lesson, we are going to demonstrate an example of how the upper/lower shadow of a breakout confirmation candle plays a role in offering us an entry. Let us get started.

This is an H1 chart. The chart shows that the price makes a strong bearish move. It finds its support. Having a bounce, it goes towards the North. The last candle suggests that the price may have found its resistance too. If it makes a breakout at the level of support, upon getting breakout confirmation, the sellers may go short in the pair.

The price heads towards the South but not with good momentum. It takes only one candle to make a breakout. The sellers must wait. Let us find out what happens next.

Here it comes. The last candle breaches through the level of support. It has a lower shadow, but it closes well below the level. The sellers are to wait for the second important factor, which is breakout confirmation.

The next candle comes out as a bearish candle closing well below the breakout candle’s lowest low. In naked eyes, the sellers may trigger a short entry right after the last candle closes. However, the confirmation candle has a long lower shadow. To be sure about it, we may flip over to the 15 M chart. Let us have a look at the 15 M chart.

Look at the last 15M candle. This is a bullish pin bar, which is a strong bullish reversal candle. The 15 M traders may push the price towards the North. It means the H1 sellers may have to wait to reach the target. That may even end up being a losing trade. Let us flip over to the H1 again.

The last candle comes out as a bullish corrective candle. Usually, the price goes down after a breakout confirmation in such a setup. It this case, it does not. It may keep pushing towards the North even further. Let us find out what happens next.

The last candle comes out as a bullish corrective candle. Usually, the price goes down after a breakout confirmation in such a setup. It this case, it does not. It may keep pushing towards the North even further. Let us find out what happens next.

Yes, the price heads towards the North further. The last candle breaches through the breakout level as well. This does not look good for the H1 sellers. It all starts with a long lower shadow (in a selling market).

Whenever we see a long lower/upper shadow in an H1 chart, we may check it with the 15 M chart. If the last 15 M candle is a strong reversal candle (for opposite trend), we may skip taking the entry.

Categories
Forex Assets

Asset Analytics – Analyzing The GBP/DKK Currency Pair

Introduction

GBP Pound sterling, also known as the pound, is the official currency of the United Kingdom and many others. The sterling is the fourth most-traded currency in the forex market. Where in DKK is known as The krone and sometimes Danish crown. It is the official currency of Denmark, Greenland, and the Faroe Islands.

GBP/DKK is the abbreviation for the Pound sterling against the Danish crown. In the Forex, one currency is quoted against the other. Here, the first currency(GBP) is the base currency, and the second(DKK) is the quote currency. The GBPDKK is classified as exotic-cross currency pair.

Understanding GBP/DKK

In Forex, to find out the relative value of one currency, we need another currency to compare. The market value of GBPDKK determines the strength of DKK against the GBP that can be easily understood as 1GBP is equal to how much DKK, so if the exchange rate for the pair GBPDKK is 8.3430. It means that we need 8.3430DKK to buy 1 GBP.

If the value of the base currency goes down, the value of the quote currency goes up and vice versa.

Spread

Forex brokers have two different prices for currency pairs: the bid and ask price. The bid price is the selling price, and ask is the buy price.

The difference between the ask and the bid price is called the spread. The spread is how brokers make their money.

ECN: 39 pips | STP: 42 pips

Fees

A Fee is simply the commission we pay to the broker on each position we open. There is no fee on STP account models, but a few pips on ECN accounts.

Slippage

slippage refers to the difference between the trader’s expected price and the actual price at which the trade is executed. It can occur at any time but mostly happens when the market is fast-moving and volatile. Also, sometimes when we place a large number of orders at the same time.

Trading Range in GBP/HKD

The amount of money you will win or lose in a given amount of time can be assessed using the trading range table. This is a representation of the minimum, average, and maximum pip movement in a currency pair. This can be evaluated simply by using the ART indicator combined with 200-period SMA.

Procedure to assess Pip Ranges

  1. Add the ATR indicator to your chart
  2. Set the period to 1
  3. Add a 200-period SMA to this indicator
  4. Shrink the chart so you can assess a significant period
  5. Select your desired timeframe
  6. Measure the floor level and set this value as the min
  7. Measure the level of the 200-period SMA and set this as the average
  8. Measure the peak levels and set this as Max.

GBP/DKK Cost as a Percent of the Trading Range

The cost of trade mostly depends on the broker and varies based on the volatility of the market. This is because the total cost involves slippage and spreads apart from the trading fee. Below is the representation of the cost variation in terms of percentages. The comprehension of it is discussed in the following sections.

ECN Model Account

Spread = 39 | Slippage = 3 |Trading fee = 5

Total cost = Slippage + Spread + Trading Fee = 3 + 39 + 5 = 47

STP Model Account

Spread = 42 | Slippage = 3 | Trading fee = 0

Total cost = Slippage + Spread + Trading Fee = 3 + 42 + 0 = 45

Trading the GBP/DKK

The GBP/DKK is an exotic-cross currency pair and is a volatile market. For instance, the average pip movement on the 1H timeframe is only 333 pips. DKK is considered to be an emerging pair.

Note that the higher the volatility, the lower is the cost of the trade. However, this is not an advantage as it is risky to trade highly volatile markets. Also, the larger/smaller the percentages, the higher/lower are the costs on the trade. So, we can infer that the prices are higher for low volatile markets and high for highly volatile markets.

It is recommended to trade when the volatility is around the minimum values. The volatility here is low, and the costs are a little high compared to the average and the maximum values. But, if you’re priority is towards reducing costs, you may trade when the volatility of the market is around the maximum values.

Categories
Forex Videos

Forex! How To Make Money During The Coronavirus At Home


How to earn a living during the Coronavirus while stuck in isolation

There is no shying away from the fact that we are currently living in unprecedented times. With governments across the world instructing businesses to close their doors, forcing people out of their jobs, as well as being ordered into self-isolation, which will leave many people facing huge debts, and many will go broke with some people losing their businesses and even their homes.


This is not fear-mongering; this is an absolute fact. The world is facing a global recession and a financial meltdown. And things will not improve until such time as the virus has been beaten and vaccines are made available. And because of the unknown nature of the virus and the fact that vaccines can take many months to bring to the market, the dilemma that faces the world is that this is too much of an unknown to be able to say when things will return to normal.
However people are adaptable and will search for opportunities to make a living, and the old adage “invention is the mother of necessity” springs to mind, and where people will reinvent themselves with new business opportunities and where because they will mostly be in isolation those opportunities can only arise online.
Therefore, isn’t it about time that you considered working in the forex industry? Because no matter what happens, the money markets continue to operate even during crises such as we are faced with at the moment.


The benefits of working in the forex industry are that you can set up a business quickly and with very little setup costs. Indeed, all you need is a decent computer and internet connection and then choose a broker who to trade currencies with, and whereby your initial outlay can be as little as $200 in order to start trading, although ideally, you would need to put up at least $1000 in order to be able to realistically begin to make a decent living.


The forex market is the largest financial market in the world and is open 24-hours a day five days a week and where anybody can participate. Even during this crisis many institutions and professional traders, all the way down to retail traders, make money by using chart patterns they see on their computer screens to tell them when currencies – which are always traded in pairs – are too high or too low against their counterparts and therefore may be ready to rise or fall. Traders simply bet on the rise or the fall in currency pairs in order to make a profit. Effective tools can be implemented to minimize losses.

The forex market is a global market and is not centralized, and therefore nobody owns it. Transaction costs are low, and here at Forex Academy, we have an abundance of educational material where you can learn all about trading in the forex market, and we can even show you how to open a risk free demo account to practice what you learn with us before you risk your money for real.

The many articles, posts, and videos have been written by professional financial traders who trade the markets even during these difficult times, and want to share their success with you so that you can have an opportunity during these dark times to learn how to successfully trade forex.

Categories
Forex Assets

Exploring The GBP/HKD Forex Exotic Currency Pair

Introduction

GBP Pound sterling, also known as the pound, is the official currency of the United Kingdom and many others. It is one of the oldest currencies and is further divided into pence. Where in HKD is known as Hong Kong Dollar, and it is the official currency of Hong Kong. One HKD is divided into 100 cents.

GBP/HKD is the abbreviation for the Pound sterling against the Hong Kong Dollar. Here, the first currency (GBP) is the base, and the second currency (HKD) is the quote currency. It is classified as an exotic-cross currency pair.

Understanding GBP/HKD

In Forex, to find out the relative value of one currency, we need another money to compare. The market value of GBP/HKD determines the strength of HKD against the GBP, i.e., It can simply be understood as 1GBP is equal to how much HKD, so if the exchange rate for the pair GBPHKD is 9.254. It means that we need 9.254 HKD to buy 1 GBP. If the value of the base currency goes down, the value of the quote currency goes up and vice versa.

Spread

Forex brokers have two different prices for currency pairs: the bid and ask price. The bid price is the selling price, and ask is the buy price. The difference between the ask and the bid price is called the spread. The spread is how brokers make their money. For this currency pair, the spread values for ECN & STP brokers are as follows.

ECN: 33 pips | STP: 36 pips

Fees

A Fee is simply the commission we pay to the broker on each position we open. There is no fee on STP account models, but a few pips on ECN accounts.

Slippage

Slippage refers to the difference between the trader’s expected price and the actual price at which the trade is executed. It can occur at any time, but it mostly happens when market orders are placed during high volatile conditions. It may also occur when large orders are placed at a time.

Trading Range in GBP/HKD

The amount of money we win or lose in a given amount of time can be assessed using the trading range table. The following table is a representation of the minimum, average, and maximum pip movement in a currency pair. This can be assessed very easily by using the Average True Range (ATR) indicator combined with 200-period SMA.

Procedure to assess Pip Ranges

  1. Add the ATR indicator to your chart
  2. Set the period to 1
  3. Add a 200-period SMA to this indicator
  4. Shrink the chart so you can assess a large time period
  5. Select your desired timeframe
  6. Measure the floor level and set this value as the min
  7. Measure the level of the 200-period SMA and set this as the average
  8. Measure the peak levels and set this as Max.

GBP/SGD Cost as a Percent of the Trading Range

The cost of trade varies based on the volatility of the market. This is because the total cost involves slippage and spreads apart from the trading fee. Below is the representation of the cost variation in terms of percentages. The comprehension of it is discussed in the coming sections.

ECN Model Account

Spread = 33 | Slippage = 3 |Trading fee = 5

Total cost = Slippage + Spread + Trading Fee = 3 + 15 + 5 = 41

STP Model Account

Spread = 36 | Slippage = 3 | Trading fee = 0

Total cost = Slippage + Spread + Trading Fee = 3 + 19 + 0 = 39

Trading the GBP/HKD Currency Pair

The GBPHKD is an exotic-cross currency pair and is a normal ranging market. For instance, the average pip movement on the 1H timeframe is only 49 pips. Note that the higher the volatility, the lower is the cost of the trade. However, this is not an advantage as it is risky to trade highly volatile markets.

Also, the larger/smaller the percentages, the higher/lower are the costs on the trade. So, we can infer that the costs are higher for low volatile markets and high for highly volatile markets. To reduce our risk, it is recommended to trade when the volatility is around the minimum values. The volatility here is low, and the costs are a little high compared to the average and the maximum values. But, if your priority is towards reducing costs, you may trade when the volatility of the market is around the maximum values.

Advantage from Limit orders

When orders are executed as market orders, there is slippage on the trade. But, with limit orders, there is no slippage as such. Only trading fees and the spread will be taken into consideration to calculate the total costs. This method will bring down the cost significantly.

Categories
Forex Price-Action Strategies

Forex Price Action: Trendline Breakout Strategy

In today’s lesson, we are going to demonstrate an example of trendline breakout trading. Price action trading is mainly based on support/resistance and breakout. It does not mean that support/resistance is only horizontal. A trendline works as support/resistance as well. Let us now proceed and find out how a trendline breakout offers entry.

The price has been bearish by obeying a down-trending trendline. The price has rejection at the trendline four times. Now, it is the sellers’ territory. However, one bullish candle may change the game.

Here it is. One big bullish candle breaches through the trendline’s resistance closing well above it. Usually, trendline breakout traders wait for the price to come back at the trendline again and get a reversal candle to take entry. This is the safest thing to do in trendline breakout trading.

The chart shows that the price heads towards the North for two more candles and comes down for a correction. Trendline’s resistance becomes support now, which is what happens with horizontal support/resistance. The buyers are to wait for a bullish reversal candle to go long in this chart. Typically, a bullish engulfing candle is the best reversal candle to go long as far as the trendline breakout trading strategy.

The chart produces two doji candles. These are reversal candles. However, look at the last candle. This is a bullish engulfing candle; thus, the buyers may go long right after the candle closes. Stop loss is to be set below the new support.

The next candle comes out as a bullish candle too. This looks good for the buyers. Since the price makes a breakout, confirms the breakout, and produces a bullish engulfing candle, it may make a new higher high. However, the safest option to set take profit is at the last swing high.

The price heads towards the North with good bullish momentum. The price hits the last swing high in a hurry. It gets us 2R here. As long as it offers us 1R, we shall go with it. If it offers less than 1R, we may skip taking the entry. The last candle comes out as a bullish candle. It suggests that the price may make a bullish breakout. That is another game. If we want to take a long entry upon the next bullish breakout, it would be based on a horizontal breakout trading strategy.

Trendline breakout trading is quite simple and rewarding. Stay tuned to get to more about trendline breakout trading strategy in our fore coming lessons.


Categories
Forex Fundamental Analysis

Understanding ‘Core Inflation’ & It’s Impact On The Forex Price Charts

Introduction

Core inflation is the change in the price of the goods and services that do take food and energy into account. It is referred to as ‘core’ because it represents the most accurate illustration of the underlying inflation trends. The reason for the exclusion of food and energy is due to its high volatility. They change so often that they may depict an inaccurate reading of the inflation rate. And the commodity market is the sole cause behind the volatility, as it extensively traded all day.

Why Exactly Food and Energy are Excluded

As already mentioned, Food and Energy are exempted from the calculation of core inflation because the volatility in these markets is too high. This reduces the accuracy of the core inflation rates. Food and energy are considered as the most necessary staples; that is, their demand does not change even if there is a price hike. For instance, let’s say the gas prices rise due to the rise in oil prices. But this rise will hardly affect you as you’ll still need to fill up your tank in order to drive your vehicle. Similarly, you will not become hesitant to go to the grocery store because the prices have risen.

Oil and gas are commodities that are traded on the exchange market where people can buy and sell them. The commodity traded bid on the oil prices when they suspect a fall in supply or a rise in demand. Also, the thick that war will bring down the supply of oil. With this assumption and analysis, they buy at the present price and anticipate a higher price in the future. And this is enough to pump up the oil prices in the market. And if things don’t go as per the plan, the prices fall when they sell. Hence, this creates high volatility in the market.

The food prices are dependent on the prices of gas. The food prices tend to rise along with the gas prices because transportation of the food is dependent on trucking. When the oil prices rise, the effect can be seen in the gas price a week later. And if the gas prices maintain its uptrend, the effect of it can be observed on the food prices a few weeks later.

Measuring Core Inflation

The core inflation is measured by both the Consumer Price Index (CPI) and the core Personal Consumption Expenditure Index (PCE). The PCE is the depiction of the prices of goods and services purchased by consumers in the United States. Also, since inflation determines the trend in trend in the rising prices, the PCE is a vital metric in assessing inflation. However, both PCE and CPI are considered to be very similar as both help in determining the inflation in the economy.

CPI and PCE – Which is the Preferred Measure?

It is observed that PCE tends to provide inflation rates that are less affected by the short-term price changes, which is why the Federal Reserve prefers the PCE index over the CPI. The Bureau of Economic Analysis (BEA), a division of the Department of Commerce, measures the rates by using the existing gross domestic product (GDP) data, which helps in determining the overall trend in the prices. The GDP gives the measure of the total production of goods and services. In addition, BEA takes in the monthly Retail Survey data and compares it with the consumer prices generated by the CPI. In doing so, the data irregularities are removed, which helps in providing long-term trends.

Why is Core Inflation Important?

It is important to asses core inflation because it determines the relationship between the price of the goods and services and the level of the consumer income. If there is an increase in the price of the goods and services and no proportional increase in consumer income, consumer buying power will decrease. So, we can conclude that inflation causes the value of money to depreciate compared to the prices of goods and services.

However, if the consumer income increases, but the price of the goods and services remains unchanged, consumers will theoretically have money buying power. Moreover, there will be an increase in the investment portfolio, which leads to asset inflation. And this can generate additional money for consumers to spend.

Core Inflation and its Impact on the Economy and Currency

Core inflation has both a subtle and destructive effect on economic growth. It is said to be subtle because an increase of one or two percent takes quite a while. However, this can have a positive effect at this rate as well. People purchase goods and services beforehand, knowing that price will rise in the near future. Hence, this increase in demand stimulates economic growth. And since currency depends directly on the economy, the price of the currency rises as well.

Inflation can have a negative effect on the economy, as well. That’s because people will have to spend how much ever high price on food and gas, as they are the essentials. This brings down other consumer sectors in the market because people tend to spend less here. Their businesses are less profitable now. This imbalance in the market lowers the economic output.

Reliable sources of data for Core Inflation

The core inflation rate is released by the countries’ statistics board. For most countries, it is released on a monthly basis. And the reports are in terms of percentages. Below is a list of sources of core inflation data for different countries.

EURUSDAUDGBP  For other world countries, you may access those reports here.

How does Core Inflation Affect the Price Charts?

Until now, we understood the definition of Core inflation and its impact on the economy and the currency. Here we shall see the immediate effect of the currency pair when the reports are released. For our example, we will be taking the U.S. dollar for our reference. The core inflation rate in the U.S. is released by the U.S. Bureau of labor statistics. The frequency of the announcement of data is monthly.

Below is the core inflation data released by the U.S. Bureau of labor statistics for the month of February. But, the data for it is announced in the first week of March. We can see that the core inflation has turned to be 2.4 percent, which is 0.1 percent higher than the previous month and the forecasted value. Now, let’s see how this value has affected the U.S. Dollar.

EUR/USD | Before the Announcement – (March 11, 2020 | Before 12:30 GMT)

Below is the chart of the EUR/USD on the 15min timeframe just before the release of the news.

EUR/USD | After the Announcement – (March 11, 2020 | After 12:30 GMT)

Below is the same chart of EUR/USD on the 15min timeframe after the release of the news. The news candle has been represented in the chart as well. It is evident from the chart that the news did not have any effect on the currency pair. Though the reports showed an increase in the core inflation, there was hardly any drastic pip movement in the pair. Also, the volatility was below the average, and the volume was low. With this, we can come to the conclusion that the core inflation rate did not impact the EUR/USD.

GBP/USD | Before the Announcement – (March 11, 2020 | Before 12:30 GMT)

GBP/USD | After the Announcement – (March 11, 2020 | After 12:30 GMT)

Consider the below chart of GBP/USD on the 15min timeframe. We can see that the news candle was a bearish candle. That is, the news was positive for the U.S. Dollar. However, if we were to check on the volatility of the market, the volatility when the news came out was at the average value. Seeing the volume bar corresponding to the candle, it wasn’t high as such. Hence, the core inflation did not impact the GBP/USD.

Traders who wish to trade this pair can freely go ahead with their analysis as the news has a very light impact on the USD.

USD/CAD | Before the Announcement – (March 11, 2020 | Before 12:30 GMT)

USD/CAD | After the Announcement – (March 11, 2020 | After 12:30 GMT)

Below is the USD/CAD candlestick chart on the 15min timeframe after the release of the news. The news showed an increase in the core inflation rate by 0.1 percent. In the chart, we can see that the report turned out to be positive for the USD. In fact, the news candle actually broke the supply level and went above it. Compared to EUR/USD and GBP/USD, the core inflation had a decent impact on USD/CAD. However, the volatility was at the average mark, and the volume didn’t really spike up.

Conclusion

Core inflation is an economic indicator that measures the inflation of an economy without considering food and energy. This is because of the high volatility in the food and energy market. The core inflation rates are usually taken from the CPI or the PCE. This is an important indicator as it determines the relationship between the price of goods and services and consumer income.

It also gives an idea of the current economy of a nation. However, when it comes to its effect on the currency, there is not much impact on it. So, conservative traders can trade the markets without fearing the release of the news, as there is no drastic rise in the volatility of the markets.

Categories
Forex Course

89. Identifying Trading Signals Using The ‘ADX’ Indicator

Introduction

The ADX indicator is created by a technical analysis legend, ‘J Welles Wilder.’ ADX (Average Directional Index) shows how strong the market is trending in any direction. This indicator doesn’t have a negative value, so it is not like the oscillators that may fluctuate above and below the price action. The indicator gives a reading that ranges between 0 and 50 levels. Higher the reading goes, stronger the trend is, and lower the reading goes, weaker the trend is.

The ADX Indicator Consists of Three Lines.

  1. The ADX Line.
  2. The DI+ Line. (Plus Directional Movement Index)
  3. The DI – Line. (Minus Directional Movement Index)

The chart above is the visualization of the ADX indicator. We can see the green line (DM+), the Red Line (DM-), and the Yellow Line. (ADX)

Trend Direction and Crossovers

Buy Example

To take a buy trade using this indicator, the first requirement is that the ADX line should be above the 20 level. This indicates that the market is in an uptrend. We go long when the DI+ crosses the DI- from above as it indicates a buy signal.

The chart below is the EUR/AUD Forex pair, where we have identified a buy trade using the ADX indicator. As we can see, the market was in an uptrend, and it is confirmed by the ADX line going above the 20 level. At the same time, we can also see the crossover happening between the DI+ and DI- lines of this indicator. This clearly indicates a buying trade in this pair.

The stop-loss placed below the close of the recent candle is good enough, and we must exit our position when the ADX line (yellow line) goes below the 25 level.

Sell Example

The first requirement to take a seeling position using the ADX indicator is that the ADX line must be below the 20 level. This indicates that the market is in a downtrend. We go short when the DI+ line crosses the DI- line from below as it indicates a sell signal.

The below chart of the GBP/USD Forex pair indicates a sell signal. In a downtrend, when the ADX line (yellow line) goes below the 20 level, it confirms the strength of the downtrend. At the same time, when the DI+ crosses the DI-  from below, it shows that the sellers are ready to resume the downtrend.

Breakout Trading Using The ADX Indicator

This strategy is similar to the crossover strategy that is discussed above. However, we are adding the price action breakout part to it. The idea is to go long when the ADX line is above the 20 level and when the DI+ crosses the DI- line from above. Also, the price action must break above the major resistance level to confirm the buying signal.

As we can see, in the below USD/CAD Forex chart, when the ADX line goes above the 20 level, it indicates that the uptrend is gaining strength. It also means that we can expect a break above the resistance line soon. When the price action broke above the resistance line, we can see the crossover on the ADX indicator. This clearly indicates a buy trade in this currency pair.

We can exit the trades when the opposite signal is triggered. Most of the time, breakout trades travel quite far. So if your goal is to ride longer moves, exit your position when the momentum of the uptrend starts to die or when the price action approaches the major resistance area.

That’s about the ADX indicator and related trading strategies using this indicator. If you have any questions, please let us know in the comments below. Cheers!

[wp_quiz id=”68035″]
Categories
Forex Signals

Double Top for Cable

This is a Double top formation in the cable pair, where price action hit the key 1.2300 area on two occasions and where the UK Prime Minister Boris Johnson has tested positive for the Covid-19 virus. 

Traders will be looking for price action to move lower because of the double top and also because of the bad news regarding the Prime Minister, although his symptoms are said to be not serious and certainly we all wish him a speedy recovery and hope he remains in control of the United Kingdom 

This is also based on the fact that cable has rallied over 1000 pips recently to reach the high recent high of just over the 1.2300 handle, and where we will expect some profit-taking. Also taking into consideration the dollar index has come off its highs and is currently reversing some of its recent losses, and this would help us in a hypothesis where the cable pair should now move lower.


Risk::


Standard Lot $1200


Mini Lot $120


Micro Lot $12

Categories
Forex Market Analysis

Daily F.X. Analysis, March 27 – Top Trade Setups In Forex – Weaker Dollar In Play! 

The greenback fell against its major peers, with the Dollar Index dipping 0.7% on the day to 100.94, down for a 4th consecutive session. France’s INSEE will release March Consumer Confidence Index (91 expected).

The U.S. Commerce Department will report February personal spending (+0.2% on month expected) and personal income (+0.4% on month expected). The University of Michigan (UOM) will report its final rea1dings of the March Consumer Sentiment Index (90.0 expected).

 Economic Events to Watch Today    


EUR/USD – Daily Analysis

The EUR/USD rallied 1.5% to 1.1047, posting a four-day winning streak. The risk-on market sentiment is also pushing the U.S. Dollar lower and sending the pair higher. The recovery in the risk-sentiment came after the U.S. Senate approved of the original $2 trillion fiscal stimulus package.

A series of economic fundamentals drove the pair, and even today market is likely to move on news. In particular, the U.S. initial jobless claims are expected to have risen to 1,000K from the preceding week’s 281K figure in the week ended March 20. 

If jobless claims fall in the 2 to 3 million range, which seems fairly possible, we will likely see a notable sell-off in the greenback. In that case, the EUR/USD currency pair could find a bid over the 50-day moving average at 1.10. 

On the other hand, the EUR/USD currency pair will also take cues from the Kansas Fed Manufacturing Activity index for March. The European Union’s upcoming emergency meeting to discuss further steps to combat the virus will be essential to watch. 

Markets are assuming that the Eurozone is going for a deep slowdown, and they need aggressive stimulus to stop the fallout from the virus outbreak. Later today, eyes will be on France’s INSEE, which is due to release March Consumer Confidence Index (91 expected).

Daily Support and Resistance

  • S1 1.0673
  • S2 1.0835
  • S3 1.0935

Pivot Point 1.0997

  • R1 1.1097
  • R2 1.1159
  • R3 1.1321

EUR/USD– Trading Tips

The EUR/USD is trading bullish at 1.1025, having an immediate support level of around 1.0947. The bullish channel has already been violated on the higher side, and it’s supporting is the bullish bias in the EUR/USD pair. On the higher side, the EUR/USD pair is facing resistance at 1.1070 area. 

Bullish crossover of 1.1070 area can open further room for buying until 1.1194 level. Whereas, the chances of a bearish bias will remain strong if the pair continues to hold below 1.1070 level today. On the lower side, the target is likely to stay at 1.0947 and 1.0885. 

GBP/USD– Daily Analysis

The GBP/USD surged 2.6% to 1.2192. The Bank of England said, after announcing a rate cut and additional bonds purchase last Thursday, it can expand asset purchases further if necessary. On the other hand, official data showed that U.K. retail sales declined 0.3% on month in February (+0.2% expected).

The policymakers could be called with the 24-hour prior notice to vote on the coronavirus support package on Friday. On the U.S. front, the coronavirus fears in the U.S. also increased with the death losses crossed 1,000 figures and an increase of 12,000 cases recorded in the single day on Wednesday.

The Bank of England (BOE) failed to offer any fireworks due to a lack of resources while disappointing U.K. Retail Sales, to 0.0% from 0.8% YoY forecast, also couldn’t recall the bears.

Later today, the U.S. Commerce Department will report February personal spending (+0.2% on month expected) and personal income (+0.4% expectation). The University of Michigan will report Consumer Sentiment Index (90.0 expected).


Daily Support and Resistance

  • S1 1.1339
  • S2 1.1535
  • S3 1.1662

Pivot Point 1.1731

  • R1 1.1858
  • R2 1.1927
  • R3 1.2122

GBP/USD– Trading Tip

The GBP/USD has violated the double top resistance level of 1.1945, and the pair now trades around 1.2180, the level which is marked as horizontal resistance. Today, the bullish breakout of the 1.2300 level can open the buying trend until the next resistance level of 1.2338 (50% Fibo level) and 1.2510 level, which accounts for a 61% retracement. On the lower side, the Cable can find support around 1.2035 and 1.1930. Let’s look for buying trades over the 1.1945 support level and selling below 1.2350 today. 

USD/JPY – Daily Analysis

The USD/JPY currency pair flashing red and hit the session low near the 108.50, mainly due to broad-based U.S. Dollar weakness. While the greenback continues to lose its ground in the wake of the U.S. relief package. At the time of writing, the USD/JPY is trading at 108.78 and consolidates in the range between the 108.25 – 109.72. 

However, the currency pair faced rejection at 109.72 in early Asia and dropped below the 100-day average support at 109.00 a few minutes before press time to hit a session low of 108.55.

Whereas, the major Asian equity indices like Japan’s Nikkei, Hong Kong’s Hang Seng and South Korea’s Kospi are flashing green.

It is worth to mention that the traders did not give much more attention to the Japanese Yen demand. So, the reason behind the pairs declines is the broad-based greenback weakness. The dollar index, which tracks the value of the greenback against majors, is currently trading at weekly lows near 99.30, having declined by nearly 200 pips on Thursday.

The U.S. dollar continues to lose its ground due to the unprecedented fiscal and monetary stimulus by the U.S. government and the Federal Reserve in the last five days.


Daily Support and Resistance

  1. S1 106.51
  2. S2 108.16
  3. S3 108.75
  4. Pivot Point 109.8
  5. R1 110.4
  6. R2 111.45
  7. R3 113.09

USD/JPY – Trading Tips

On Friday, the demand for safe-haven assets such as gold and Japanese yen has surged in the wake of an increased number of coronavirus cases around the globe. Consequently, the USD/JPY pair has dropped to trade at 108.350, down from the 109 level. On the 4 hour chart, the USD/JPY has violated the bullish channel, which is now suggesting bearish bias in the USD/JPY. 

The USD/JPY prices are holding around the next support level of 108.350, and around this level, we can expect USD/JPY to bounce off until 109.850. But in case, the USD/JPY exhibits a bearish breakout below 108.350 level; the pair may drop further until 106.450. 

All the best for today!  

Categories
Crypto Market Analysis

Daily Crypto Review, Mar 27 – XRP recording double-digit gains as Ripple Labs donates $200,000 to fight COVID-19

The cryptocurrency market is still in consolidation mode, with most cryptocurrency prices at almost the exact same level that they were yesterday. Bitcoin is currently trading for $6,574, which represents an increase of 0.6% on the day. Meanwhile, Ethereum gained 1.01% on the day, while XRP gained a solid 7.28%.

Quant took the position of today’s most prominent daily gainer, with gains of 31.45%. On the other side, EDC Blockchain lost 29.88% on the day, making it the most prominent daily loser.

Bitcoin’s dominance decreased by slightly less than 1% over the past 24 hours. Its value is now 66.16%, which represents a 0.88% difference to the downside when compared to yesterday’s value.

The cryptocurrency market capitalization was a bit more turbulent in movements in the past 24 hours than it was the day before. Its current value is $187.07 billion. This value represents an increase of $2.8 billion when compared to the value it had yesterday.

What happened in the past 24 hours

A report announced by the derivatives analysis firm Acuiti has shown a growing interest in supporting and listing crypto assets among trading firms. The study surveyed 86 companies from the buy-side, sell-side, as well as prop trading groups.

The survey showed that 26% of these firms had adopted cryptocurrencies in one way or another.

Honorable mention

Ripple

Ripple Labs announced that they had made a donation of $200,000 on Mar 25, going to two different non-profit organizations. These donations are made with the intention to aid the fight to contain the coronavirus throughout the US.

Ripple Labs stated that half the funds will go to the Tipping Point Emergency’s Response Fund, while the other half will go to the Silicon Valley Community Foundation’s COVID Regional Response Fund.

_______________________________________________________________________

Technical analysis

_______________________________________________________________________

Bitcoin

Bitcoin did not show any major volatility throughout the day, but has made a couple attempts to break its immediate resistance of $6,850. All of the attempts were, however, quickly stopped as the resistance was too much to handle with such low volume. If the pattern of failing to get above resistances continues, we might see a move down and retest of the support level.


Bitcoin’s volume is at the same level as it was the day before, while its RSI level fell down to 56.

Key levels to the upside                    Key levels to the downside

1: $6,850                                           1: $6,640

2: $7,085                                           2: $5,960

3: $7,420                                            3: $5,000


Ethereum

Ethereum has not moved much, but all the moves it made were with deliberation. The second-largest cryptocurrency by market capitalization tried to break the $139 resistance level, which is only recently showed any significance. It did manage to go above it, but quickly returned below, where it is at at the time of writing.


Ethereum’s volume is just barely higher than yesterday, while its RSI level is currently at the value of 54. We are not listing the $139 resistance as a key level, as it is still considered a pivot point (as well as too insignificant historically).

Key levels to the upside                    Key levels to the downside

1: $168                                                1: $128

2: $178.6                                            2: $122.5 

3: $185                                                3: $100


Ripple

XRP, unlike the other two aforementioned cryptocurrencies, had quite a splendid day. Its price reached double-digit gains as it jumped from $0.16 all the way up to $0.18. However, the bulls could not take the price any higher, and the move ended there. XRP has fallen slightly since then and is currently trading at around $0.171.


XRP’s volume increased greatly during the price spike. While it has descended since, it is still higher than the average volume for the past week. XRP’s RSI level has left the overbought territory on the 4-hour chart and is currently sitting at the value of 62.5.

Key levels to the upside                    Key levels to the downside

1: $0.19                                             1: $0.165

2: $0.2                                               2: $0.147

3: $0.205                                             3: $0.1

Categories
Forex Signals

GBP/USD Breaks over Double Top Pattern – Buckle Up for Buying

The GBP/USD trades bullish around 1.2030 in the wake of less dovish than expected monetary policy decisions. The central bank left the interest rate unchanged at 0.10%. However, it has warned that the measure and term of the economic collapse arising from the coronavirus pandemic will be “wide and dramatic but should eventually prove short-lived.”

The BOE Monetary Policy Committee (MPC) fixes monetary policy to reach the 2% inflation mark and whereby advocates to support growth and employment. In that context, its challenge over recent weeks has been to return to the severe economic and financial disorder produced by the spread of Covid-19.


Technically, the GBP/USD pair has violated the double top resistance level of 1.1930 level on the 4-hour chart. Closing of candles above this confirms bullish breakout and opens up further room for buying until 38.2% Fibonacci resistance level of 1.2135. At the same time, the MACD is also staying in a bullish zone. Support can be found around the 1.1946 zones.

Entry Price: Buy at 1.20286
Take Profit 1.21686
Stop Loss 1.19086
Risk/Reward 1.17

Profit & Loss Per Standard Lot = -$1200/ +$1400
Profit & Loss Per Micro Lot = -$120/ +$140

Categories
Forex Videos

A Black Swan Event, No, It’s A Flock! – How To Trade During The Crisis!

A Black Swan Event, No, It’s A Flock

We are undoubtedly in the worst economic crash the global economy has seen since WW2, and the financial impact may be even more far-reaching. With the financial markets in turmoil and no end in sight, maybe we should pause and take a look at what’s happened over the last few weeks and see if it can give any pointers to future direction, especially within the forex space.
In January, in our video on How to guard your financial assets against the Coronavirus outbreak, we warned that stock indices across the globe would come under continued selling pressure. Although the virus was mostly contained to China, it wasn’t possible, at that time, to predict the terrible crash that we have seen. It was only really when the virus took hold of Italy and broke out in Hong Kong and South Korea, that market jitters forced investors to see the potential of this deadly outbreak and begin selling stocks. Nonetheless, anybody who heeded our advice may well have reduced their exposure to stocks and been financially better off as a result.

Example A

In our February video about How to trade the Australian Dollar and The Convid-19 Pandemic Black Swan Event, again, we called it correctly. With Australia heavily exposed in China, it was highly likely that the Aussie dollar came under extreme selling pressure against the Dollar and that is exactly what happened and where we have seen highs of 0.70 in AUDUSD to a sharp decline to 0.54

Example B

We also warned that New Zealand, whose GDP is heavily dependent on their exports into China, may find that their currencies come under selling pressure too. It has also seen a huge decline against the Dollar from 0.6750 to a low of 0.5490.

Example C

We warned that countries such as Japan and Switzerland would find that their currencies grew stronger due to their safe-haven status. And where USDJPY declined from 112.20 to a low of 101.00 initially, before reversing due to concerns about the virus on the GDP of Japan.

Example D

We saw USDCHF tumble from 0.9855 to a low of 0.9160 and warned that the Swiss National Bank would likely intervene in the markets to drive the value of their currency lower for export purposes. That is exactly what happened.
We also warned that all of this could only mean one thing for the US dollar: it’s directional bias will be to the upside. Again, that’s exactly what happened with the Dollar index at highs around the 102.00 level against the Forex Majors.

Example E

So where to from here? Well, let’s just take a look at the 1-hour chart of the GBPUSD chart from Friday, 20th March. The Arrows show that there was extreme price action, which amounted to over 1400 Pip swings in this pair for this one-day period. This is almost unprecedented in financial trading. It can only tell us that the markets are thinning in volume and leverage and that institutional traders will be largely standing on the sidelines because as the crisis deepens the UK government, just like other western governments, are closing down, albeit temporarily, businesses that produce gross domestic product income revenues. All of that income has suddenly evaporated and gone out of the window. We are now in a situation where governments are financially bailing out business sectors, and they are doing that through borrowing. The burden of the debt that will grow and grow, month after month, as the crisis continues, cannot be predicted, and in fact, the repercussions will be the basis of a secondary crisis which will emerge at the end of the epidemic, due to overburdening debt caused by a virus, while countries and their workforces get back to normal in order to reimburse governments’ coffers in the form of taxation.

And nobody can predict when this virus will be contained enough for the markets to steady themselves. It will only happen when good news emerges, and this does not look at all possible or likely in the short term.
Therefore as institutional and professional traders are waiting on the sidelines and reducing leverage, we would advise retail forex traders to also exert extreme caution in trading these markets while the current crisis persists.

Categories
Forex Assets

Trading The GBP/THB Forex Exotic Pair

Introduction

GBP

Pound sterling, also know as the pound, is the official currency of the United Kingdom and many others. The Pound sterling is the oldest currency and even the fourth most-traded currency in the foreign exchange market, after the United States dollar, the euro, and the Japanese yen.

THB

Thai Bhat is the official currency of Thailand. It’s divided into 100 satangs, According to Bloomberg, the Thai baht was the world’s best-performing currency in 2018, and since then, Thai baht is the 10th most frequently used world payment currency.

GBPTHB is the abbreviation for the Pound sterling against the Thai baht. Here, the GBP is the base currency, and the THB is the quote currency. It is classified as an exotic-cross currency pair.

Understanding GBP/THB

In Forex, to find the relative value of one currency, we need another money to compare. The market value of GBPTHB determines the cost of THB that is required to buy one GBP. It can simply be understood as 1GBP is equal to how much THB, so if the exchange rate for the pair GBPTHB is 1.6894. It means that we need 38.92 THB to buy 1 GBP.

Spread

Forex brokers have two different prices for currency pairs: the bid and ask price. Here the “bid” price at which you can SELL the base currency, and The “ask” price is at which you can BUY the base currency. Hence, the difference between the ask and the bid price is called the spread. The spread is how brokers make their money. Some broker Instead of charging a separate fee for trading, they already have the fees inbuilt in the spread.

ECN: 28 pips | STP: 31 pips

Fees

A Fee is simply the commission you pay to the broker on each position you open. There is no fee on STP account models, but a few pips on ECN accounts.

Slippage

slippage refers to the difference between the trader’s expected price and the actual price at which the trade is executed. It occurs when market orders are placed during high fast-moving, highly volatile as well as when large orders are placed at a time.

 Trading Range in GBP/THB

The amount of money you will win or lose in a given amount of time can be assessed using the trading range table. This is a representation of the minimum, average, and maximum pip movement in a currency pair.

Procedure to assess Pip Ranges

  1. Add the ATR indicator to your chart
  2. Set the period to 1
  3. Add a 200-period SMA to this indicator
  4. Shrink the chart so you can assess a large time period
  5. Select your desired timeframe
  6. Measure the floor level and set this value as the min
  7. Measure the level of the 200-period SMA and set this as the average
  8. Measure the peak levels and set this as Max.

GBP/THB Cost as a Percent of the Trading Range

The cost of trade varies based on the volatility of the market. This is because the total cost involves slippage and spreads apart from the trading fee. Below is the representation of the cost variation in terms of percentages. The comprehension of it is discussed in the next sections.

ECN Model Account

Spread = 28 | Slippage = 3 |Trading fee = 5

Total cost = Slippage + Spread + Trading Fee = 3 + 28 + 5 = 36

STP Model Account

Spread = 31 | Slippage = 3 | Trading fee = 0

Total cost = Slippage + Spread + Trading Fee = 3 + 31 + 0 = 34

Trading the GBP/THB

The GBPTHB is an exotic-cross currency pair and is a normal ranging market. For instance, the average pip movement on the 1H timeframe is only 82 pips. Note that the higher the volatility, the lower is the cost of the trade. However, this is not an advantage as it is risky to trade highly volatile markets.

Also, the larger/smaller the percentages, the higher/lower are the costs on the trade. So, we can infer that the prices are higher for low volatile markets and high for highly volatile markets.

To reduce your risk, it is recommended to trade when the volatility is around the minimum values. The volatility here is low, and the costs are a little high compared to the average and the maximum values. But, if you’re priority is towards reducing costs, you may trade when the volatility of the market is around the maximum values.

Categories
Forex Market Analysis

Daily F.X. Analysis, March 26 – Top Trade Setups In Forex – U.K. Monetary Policy In Focus! 

The greenback weakened against its major rivals, with the U.S. Dollar Index dropping 0.7% on the day to 100.94, down for a fourth straight session. For now, the focus shifts to the major economic events which will be releasing through the day. 

The Bank of England (BOE) will hold its monetary policy meeting, after a rate cut and additional bonds purchase announced last Thursday (March 19). The European Central Bank will publish the Eurozone’s M3 money supply in February (+5.2% on-year expected).

Germany’s GfK Consumer Confidence Index for April will be released (7.5 expected). France’s INSEE will release March indicators on business confidence (97 expected) and manufacturing confidence (93 expected).

Economic Events to Watch Today    


EUR/USD – Daily Analysis

The EUR/USD jumped 0.9% to 1.0888, posting a three-day rebound. Most of the moment, the pair was driven by a series of economic fundamentals, and even today market is likely to move on news. In particular, the U.S. initial jobless claims are expected to have risen to 1,000K from the preceding week’s 281K figure in the week ended March 20

If jobless claims fall in the 2 to 3 million range, which seems fairly possible, we will likely see a notable sell-off in the greenback. In that case, the EUR/USD currency pair could find a bid over the 50-day moving average at 1.10. On the other hand, the EUR/USD currency pair will also take cues from the Kansas Fed Manufacturing Activity index for March. 

Meanwhile, the European Union’s upcoming emergency meeting to discuss further steps to combat the virus will be essential to watch. Markets are assuming that the Eurozone is going for a deep slowdown, and they need aggressive stimulus to stop the fallout from the virus outbreak.

Looking forward, the European Central Bank will release its monthly Economic Bulletin while the weekly Initial Jobless Claims, Goods Trade Balance, and Q4 Gross Domestic Product (GDP) data from the U.S. will be key to watch.

Daily Support and Resistance

  • S1 1.0531
  • S2 1.0673
  • S3 1.0742

Pivot Point 1.0815

  • R1 1.0885
  • R2 1.0957
  • R3 1.11

EUR/USD– Trading Tips

On Thursday, the EUR/USD is trading bullish at 1.0935, having an immediate support level of around 1.0890. The bullish channel that you can see in the chart above is also supporting the bullish bias in the EUR/USD pair, and it’s supporting the direct currency pair at 1.0890. 

Closing of the bullish engulfing candle and three bearish two-hourly candles above 1.0890 support is signifying a bullish breakout, which can lead the pair towards 1.0959 resistance level. While the bearish breakout of 1.0890 can lead the EUR/USD prices towards 1.0780. Let’s consider staying bullish above 1.0890 today with an initial target of 1.0950. 

GBP/USD– Daily Analysis

The GBP/USD climbed 0.6% to 1.1833. Official data showed that U.K. CPI grew 1.7% on year in February as expected, compared with a 1.8% growth in January. Later today, the Bank of England will hold its monetary policy meeting, after a rate cut and additional bonds purchase announced last Thursday. Also, U.K. retail sales data for February will be released (+0.2% on month estimated).

The policymakers could be called with the 24-hour prior notice to vote on the coronavirus support package on Friday. On the U.S. front, the coronavirus fears in the U.S. also increased with the death losses crossed 1,000 figures and an increase of 12,000 cases recorded in the single day on Wednesday.

Later in the day, the Bank of England will hold its monetary policy meeting, after a rate cut and additional bonds purchase announced last Thursday (March 19). While the U.K. Retail Sales are expected to remain unchanged at 0.80% YoY but any major chances likely offer a new direction to the GBP/USD prices. The U.K. Office for National Statistics will report February retail sales (+0.2% on month expected).

Daily Support and Resistance

  • S1 1.1339
  • S2 1.1535
  • S3 1.1662

Pivot Point 1.1731

  • R1 1.1858
  • R2 1.1927
  • R3 1.2122

GBP/USD– Trading Tip

The GBP/USD has violated a broad trading range of 1.1400 – 1.1885, and the pair now trades around 1.1930, the level which is marked as a triple top. The Bank of England’s rate decision today will play a major role in determining it’s a trend. Today, the bullish breakout of the 1.1930 level can open the buying trend until the next resistance level of 1.2185 (38.2% Fibo level) and 1.2300 level, which accounts for a 50% retracement. On the lower side, the Cable can find support around 1.1665 and 1.1445. Let’s look for buying trades over the 1.1945 resistance level and selling below the same today. 

USD/JPY – Daily Analysis

During Thursday’s early Asian session, the USD/JPY dropped to a session low of 110.45 from the high of 111.30 after the market sentiment shifts, mainly due to the United States Congress, which failed to come together and agree on relief package plan after facing recent hurdles. While the broad-based USD weakness also undermines the currency pair. 

At the moment, the USD/JPY is trading at 110.52 and consolidates in the range between the 110.38 – 111.31. However, the safe-haven Japanese yen is continuing its bullish move, which seen in early Asia sessions due to fresh losses in the U.S. stock futures.

The risk-off market sentiment strengthened, pushing the futures tied to the S&P 500 futures lower. At press time, the index futures are reporting a 1% decline. On the other hand, the coronavirus outbreak is not showing any sign of slowing down in the U.S., Japan, and European countries. 

There was a sharp rise in cases in Tokyo and gave a warning about the lockdown, which eventually strengthing the risk-off market sentiment and boosting the safe-haven Japanese yen.

Daily Support and Resistance    

  • S1 107.85
  • S2 109.43
  • S3 110.32

Pivot Point 111.02

  • R1 111.91
  • R2 112.6
  • R3 114.19

USD/JPY – Trading Tips

The intensified safe-haven demand has started driving the bearish trend in the USD/JPY currency pair as it trades at 110.350, down from 111 level. On the 4 hour chart, the USD/JPY was trading in a bullish channel, which supported the USD/JPY prices around 110.650. Since this level has already been violated, now it’s going to work as a resistance for the USD/JPY. 


As forecasted earlier, a bearish breakout of 110.600 can lead its prices toward 109.600 level, and that’s what the market is trying to do now. The USD/JPY prices are heading towards the next support level of 109.850, and around this level, we can expect USD/JPY to bounce off a bit. However, in case of a bearish breakout of 109.850 level, the pair may drop further until 108.450. 

All the best for today!  

Categories
Crypto Market Analysis

Daily Crypto Review, Mar 26 – The calm before the storm? Cryptocurrency price analysis

The cryptocurrency market had a pretty steady day when it comes to price movements. Most cryptos remained at their levels of 1 day ago. Bitcoin is currently trading for $6,652, which represents a decrease of 0.78% on the day. Meanwhile, Ethereum lost 2.75% on the day, while XRP lost 1.17%.

EDC Blockchain took the position of today’s most prominent daily gainer, with gains of 871.81%. On the other side, Swipe lost 12.67% on the day, making it the most prominent daily loser.

Bitcoin’s dominance has increased over the past 24 hours. Its value is now 67.04%, which represents a 0.39% difference to the upside when compared to yesterday’s value.

The cryptocurrency market capitalization did not move much in the past 24 hours. Its current value is $184.21 billion. This value represents a decrease of $0.14 billion when compared to the value it had yesterday.

What happened in the past 24 hours

Bitcoin mining difficulty dropped by 15.95% in the past 24 hours. This is the second-largest decline in its history. Bitcoin price plummeted more than 50% percent last time a decline like this happened.

Though this is not a surefire way to determine the price direction, it is very much possible that Bitcoin will go down some more in the short-term.

Honorable mention

GRAM

Cardano launched Ouroboros Hydra, its off-chain scalability protocol on Mar 25. This protocol has gone live after five years of development.

The protocol increased scalability greatly for the Cardano blockchain. On top of that, it is using very little storage on the network’s nodes. Hydra could theoretically scale to 1,000,000 transactions per second.

_______________________________________________________________________

Technical analysis

_______________________________________________________________________

Bitcoin

Bitcoin had a pretty stale day price-wise, as it did not move almost at all from yesterday. The largest digital currency by market cap is still trading just below the $6,850 resistance level without much fluctuation. While its price is above the weekly 200-period moving average, if the price doesn’t move to the upsidein the next couple of days, we can expect a leg down towards lower $6,000’s, or even lower.


Bitcoin’s volume drastically reduced from yesterday, while its RSI level dropped slightly towards the middle of the value range, currently being at the value of 56.

Key levels to the upside                    Key levels to the downside

1: $6,850                                           1: $6,640

2: $7,085                                           2: $5,960

3: $7,420                                            3: $5,000


Ethereum

Ethereum has almost mirrored the movements of Bitcoin for the past 24 hours. The second-largest cryptocurrency had close to no movement on the day, with its price being right below the $139 resistance line. However, the only change from yesterday is exactly the $139 level. While it was undecided whether the price will end up below or above it yesterday, it is quite clear that Ethereum will trade below this level for the time being.


Ethereum’s volume also dropped severely from yesterday, while its RSI level is currently at the value of 51.

Key levels to the upside                    Key levels to the downside

1: $168                                                1: $128

2: $178.6                                            2: $122.5 

3: $185                                                3: $100


Ripple

XRP had a bit more movement than Bitcoin and Ethereum in the past 24 hours. Namely, its price moved down to $0.157 but quickly recovered to its previous level of around $0.16. XRP is trading between the resistance of $0.165 and support of $0.147 for five days now, without any signs of going up or down.


XRP’s volume decreased slightly over the past 24 hours, while its RSI level dropped to 53.

Key levels to the upside                    Key levels to the downside

1: $0.165                                            1: $0.147

2: $0.19                                              2: $0.1

3: $0.2                                              

Categories
Forex Signals

GBP/JPY to Gain Support Over Upward Trendline – Buying Limit!

The Japanese cross currency pair GBP/JPY has dropped to trade at 130.300 as investors are moving towards safe-haven assets such as gold and Japanese yen. At the same time, traders seem to cash out from Sterling, causing it to tumble to its lowest level on record versus the currencies of the United Kingdom’s major trading partners.

It seems like the effects of the coronavirus pandemic proceed to shred through markets. Besides this, the British Consumer Prices Index, which is also known as inflation, surged to 1.7% in the month of February 2020. Comparing it to the previous month, the CPI figure is down by 0.1% from 1.8% in January 2020, and it has also been weighing on the GBP/JPY.


Technically speaking, the GBP/JPY is likely to test the support level of 129.650, which is extended by a bullish trendline. At the same level, the 50 periods exponential moving average is also supporting the Japanese cross.

While the resistance becomes a support level holds around 129.120. So to be more secure, we are looking to place a buy limit at 130.330 with a stop loss below 129.750 and take a profit of around 131.850.

Buy Limit 130.335

Take Profit 131.875

Stop Loss 129.735

Risk/Reward 2.57

Profit & Loss Per Standard Lot = -$530/ +$1,380

Profit & Loss Per Micro Lot = -$53/ +$138

Categories
Forex Elliott Wave

How to Analyze the Zigzag Pattern – Intermediate Level

The zigzag pattern is a three-wave structure that has a limited number of variations. In this educational post, we’ll present how to analyze the zigzag pattern under an intermediate level perspective,

The Elliott’s Zigzag Pattern

R.N. Elliott, in his work The Wave Principle, described the zigzag as a corrective formation that follows an internal sequence defined by 5-3-5.

The wave analysis analyst should consider that corrective patterns are not easy to recognize while the structure is not complete; however, it results revealing and useful to make forecasts once the formation is complete.

Zigzag Construction

Glenn Neely, in his work Mastering Elliott Wave, describes the zigzag construction as follows:

  1. Wave A shouldn’t retrace beyond 61.8% of the impulsive wave.
  2. Wave B should retrace at least 1% of wave A, but shouldn’t exceed 61.8% of wave A.
  3. Wave C must finish at least slightly beyond the end of wave A.
  4. If wave B retraces more than 61.8% of wave A, thus the movement developed doesn’t correspond to the end of wave B. In this case, the move realized correspond to a segment of a complex wave B.

The following figure illustrates the steps of the zigzag pattern construction previously described.

Types of Zigzag

According to the extension of wave C, the zigzag pattern would be classified as normal, extended, or truncated.

Normal zigzag: In this case, wave C can reach between 61.8% to 161.8% extension of wave A. Concerning wave B, this segment doesn’t retrace more than 61.8% of wave A, and wave C shouldn’t extend beyond 161.8% of wave A.

Truncated zigzag: This formation is less frequent than the other two zigzag pattern variations. Further, wave C shouldn’t be lower than 38.2% of wave A, but not greater than 61.8% of wave A. 

Once wave C ends, the next path should retrace at least 81% of the entire zigzag formation. According to Neely, this pattern it is likely that appears in a triangle structure.

Extended zigzag: This variation is characterized by having a more prolonged wave C than the other two models, which surpasses the 161.8% of wave A, being similar to an impulsive sequence. 

Once completed the wave C, the next path tends to retrace at least 61.8% of wave C.

Canalization Process

To canalize a zigzag formation, the wave analyst should pay attention to wave A and the end of wave B. 

The canalization process begins with the trace of a base-line linking the origin of wave A with the end of wave B, then using this line, a parallel line is projected at the end of wave A.

If the wave analyst encounters a zigzag pattern, then the corrective formation could move inside the channel, violate it, but never move in a tangent way to the channel. If it occurs, then the corrective sequence may correspond to a complex correction.

Finally, once the price violates the base-line O-B, we can conclude that the zigzag pattern ended.

NASDAQ e-mini and its Zigzag Pattern

The following figure represents to NASDAQ in its 12-hour timeframe. The chart reveals the upward process that the technologic index developed in the Christmas rally of 2018 at 5,820.50 pts.

The impulsive bullish sequence completed its internal five-wave moves at 7,879.50 pts on April 24th, 2019, from where the price began to develop a corrective zigzag pattern.

As illustrated in the last figure, the wave (a) in blue looks as a five-wave structure that ended at 7,290 pts on May 13th, 2019. The second leg of the zigzag pattern advanced close to 61.8% of the wave (a), which accomplishes the requirement of zigzag construction.

The next bearish path, corresponding to wave (c) produced a second decline in five waves and dropped beyond the 61.8% and below 161.8% of (a) which lead us to conclude that the type of zigzag pattern is normal.

At the same time, we observe that the price didn’t violate the lower line of the descending channel. However, once NASDAQ soared above the upper line of the descending channel, the corrective structure ended, giving way to the next upward motive wave.

Conclusion

In this educational article, we reviewed the characteristics of the zigzag pattern and how the wave analysts can differentiate from another kind of corrective formation. 

At the same time, the Fibonacci tools represent a useful way to validate what structure develops the market. In this context, this knowledge will allow the wave analyst to identify potential zones of reaction, which would enable us to incorporate into the trend.

In the next article, we will review the triangle pattern and how to recognize its variations.

Suggested Readings

  • Neely, G.; Mastering Elliott Wave: Presenting the Neely Method; Windsor Books; 2nd Edition (1990).
  • Prechter, R.; The Major Works of R. N. Elliott; New Classics Library; 2nd Edition (1990).
Categories
Forex Videos

How To Use A Hedging Strategy To Trade Double Tops and Bottoms

How To Use A Hedging Strategy To Trade Double Tops and Bottoms

In this video, we are going to show you how to set up a hedging strategy to trade double tops and bottoms. The idea is to set up two trades simultaneously where one trade will act as an immediate execution trade, and where all the technicals are telling us that price action will go in a certain direction. And the second trade will act as an insurance policy should price action ignore our technical analysis setup, and in which case, we will then capture price action as it moves in the opposite direction.
In the following examples, we are looking for price action reversals, which will form the basis of our technical analysis; and therefore our belief is that we will be looking for price action to have peaked, or bottomed out, and then reverse. Our secondary trade, which will act as an insurance policy, will be set up on the basis that price action has simply pulled back and then continues in the direction of the original trend.
Before we move ahead with our setups, let’s quickly remind her selves of the kind of setup we are looking for a double top scenario.

Example A


Example A, shows us that for a double top formation we need a peak, followed by a pullback to what is referred to as a neckline which acts as a line of support, followed by a second peak which must be at the same exchange rate as the previous peak, and then confirmation of the double top pattern occurs once price action breaches the neckline for a second time.

Example B

Example B, The reverse is true for the double bottom scenario. We have a bottoming out of a pear followed by a reversal to a neckline, which acts as an area of resistance and where price action forms a second bottom at or around the same exchange rate as the previous bottom and then a reversal back to the neckline, which previously acted as an area of resistance and where price action punches through and this line which then acts as an area of support before we see a continuation in the reversal of price action, which confirms the double bottom pattern.

Example C


Example C, the following is how we set up the double top hedge. First of foremost, we need to wait for price action to pull away slightly from our second peak and go short at this point with a stop loss a couple of pips above whichever peak was the highest of the move. Should price action continue lower than our neckline, the double top formation will be confirmed, and we can ride the downward move. If price action reverses from the support line, this will confirm an area of consolidation in which case we can bring into play a protective stop out in front of our entry, and at least we will not have lost any money on this trade.

Example D


Example D, The hedging strategy set up is where we place a buy limit order a couple of pics above the stop loss from the first trade, with a slightly larger stop loss which must be a couple of pics below show the previous support or neckline, and in this case, we expect that price action will continue with the original upwards trend. For this trade, we must have a minimum target equal to the amount of pips that were lost in trade one in order to keep our profit and loss in check. However, naturally, we want to let the trade run on as much as possible.

Example E


Example E, In the double bottom hedging strategy, we will simply need to reverse the trade setup for the double top. In which case, we would go long as soon as price action reverses from our second bottom line. With a tight stop loss a few pips below the lowest point of both bottoms. If price action then goes on to reverse back from the neckline to form a third bottom, we can close the trade out with a small profit. But the double bottom confirmation pattern will be confirmed once the neckline is preached, and price action continues in an upward trend.

The hedging strategy consists of a sell limit order just below the stop loss of the first trade and where the stop loss for hedging strategy must be a couple of pics below the neckline.
This hedging strategy should be reserved for timeframes or 15-minutes, and above this is where we will find the most amount of pips to be made. This is not to be considered as a scalping strategy.

Categories
Forex Assets

Trading The GBP/SGD Exotic Currency Pair

Introduction To GBP & SGD Pairs

GBP

Great Britain Pound is also known in some contexts as the pound or sterling. It is the official currency of the United Kingdom and many British overseas territories. It is subdivided into 100 pence. The Pound Sterling is the oldest currency in continuous use, and also the fourth most-traded currency in the Forex market, after the United States dollar, the euro, and the Japanese yen.

SGD

The Singapore dollar is Singapore’s official currency, and it is divided into 100 cents. This currency is the thirteenth most traded currency in the world by value.

GBPSGD is the abbreviation for the Pound sterling against the Singapore Dollar. It is classified as an exotic-cross currency pair. In this currency pair, the GBP is the base currency, and the SGD is the quote currency.

Understanding GBP/SGD

In Forex, in order to find out the relative value of one currency, we need another currency to compare. It shows how much the GBP (the base currency) is worth as measured against the SGD (quote currency). It can simply be understood as 1GBP is equal to how much SGD. So if the exchange rate for the pair GBPSGD is 1.6894. It means that one GBP costs 1.6894 SGD.

Spread

The spread is the difference between the Bid (Sell) price and the Ask (Buy) price of an asset. The spread is how brokers make their money. Some broker Instead of charging a fee for performing a trade, the cost is built as a difference between the buy and sell prices of the currency pair.

ECN: 15 pips | STP: 19 pips

Fees

A Fee is simply the commission we pay to the broker on each position we open. There is no fee on STP account models, but a few pips on ECN accounts.

Slippage

Slippage is the difference between the price at which the trader wants to execute the trade and the price at which the trade is effectively executed. Slippage can occur at any time but is mostly happens when the market is very Volatile.

Trading Range in GBP/SGD

The amount of money we will win or lose in a given amount of time can be assessed using the trading range table. This is a representation of the minimum, average, and maximum pip movement in a currency pair.

Procedure to assess Pip Ranges

  1. Add the ATR indicator to your chart
  2. Set the period to 1
  3. Add a 200-period SMA to this indicator
  4. Shrink the chart so you can assess a large time period
  5. Select your desired timeframe
  6. Measure the floor level and set this value as the min
  7. Measure the level of the 200-period SMA and set this as the average
  8. Measure the peak levels and set this as Max.

GBP/SGD Cost as a Percent of the Trading Range

The cost of trade varies based on the volatility of the market. This is because the total cost involves slippage and spreads apart from the trading fee. Below is the representation of the cost variation in terms of percentages. The comprehension of it is discussed in the coming sections.

ECN Model Account

Spread = 15 | Slippage = 3 | Trading fee = 5

Total cost = Slippage + Spread + Trading Fee = 3 + 15 + 5 = 23

STP Model Account

Spread = 19 | Slippage = 3 | Trading fee = 0

Total cost = Slippage + Spread + Trading Fee = 3 + 19 + 0 = 22

Trading the GBP/SGD currency pair

The GBPSGD is an exotic-cross currency pair and is a normal ranging market. For instance, the average pip movement on the 1H timeframe is only 62 pips. Note that the higher the volatility, the lower is the cost of the trade. However, this is not an advantage as it is risky to trade highly volatile markets.

Also, the larger/smaller the percentages, the higher/lower are the costs on the trade. So, we can infer that the costs are higher for low volatile markets and high for highly volatile markets.

To reduce the risk, it is recommended to trade when the volatility is around the minimum values. The volatility here is low, and the costs are a little high compared to the average and the maximum values. But, if you’re priority is towards reducing costs, you may trade when the volatility of the market is around the maximum values.

Also, we can take advantage of the Limit orders to reduce costs. When orders are executed as market orders, the risk of slippage always persists. But, with the help of limit orders, we can completely avoid slippage, thereby reducing the overall trading cost. When slippage is Zero, only trading fees and the spread will be taken into consideration to calculate the total costs. Hence, it brings down the cost significantly.

Categories
Forex Price-Action Strategies

If Price finds New Level of Support/Resistance

To measure risk-reward, price action traders must identify the level of support/resistance accordingly. It gets tricky sometimes. In today’s lesson, we are going to demonstrate an example of that.

This is an H1 chart. The chart shows that the price has a bounce at a level. Upon producing a bullish engulfing candle, it heads towards the North. It finds its resistance and produces a bearish engulfing candle followed by another bearish one. If it makes a breakout and confirms the breakout, the sellers may trigger short entry by setting stop-loss above the level of resistance and take profit with 1R.

The price does not make a breakout, but it heads towards the North. The sellers must wait to find out what happens next. It may go back to the level of resistance, have a rejection at double top, and make a breakout.

It may even make a breakout from here. Let us find out from the next chart what happens.

The price finds its resistance at a new level. It produces a bearish engulfing candle again. If it makes a breakout at the level of support and confirms it, it would be a short signal.

The chart produces a bearish candle, which breaches the level of support. If the next candle closes below the last candle, the sellers may trigger a short entry.

The next candle confirms the breakout. The sellers may trigger a short entry right after the candle closes. Question is where do they set their stop loss and take profit? Do they use the new level of resistance to set stop loss and take profit or use the old one? We find out the answer in a minute.

The price heads towards the South with good bearish momentum. Trade setup works as well as it usually does in breakout trading strategy. The price keeps making lower lows, and it seems it may go further down. However, since the price makes an upward correction before making the breakout, we may consider the second level to set our stop loss. We may set our take profit with 1R by measuring the same number of pips from the entry point to stop loss as well. This provides fewer pips as a reward, but to be safe with an entry like this, we may do this. The price often makes a consolidation, or it makes a correction (once it hits 1 R from the new resistance/support) after such breakout. A correction/consolidation sometimes leads towards a trend reversal as well. Thus, there is no point in taking a loss for hunting some extra pips. Always remember ‘safety first.’

Categories
Forex Market Analysis

Daily F.X. Analysis, March 25 – Top Trade Setups In Forex – Brace for U.K. Inflation Figures! 

The U.S. stocks soared on news of Congress is close to passing a substantial coronavirus relief bill. The sentiment was further boosted by President Donald Trump’s comments that he would like the U.S. economy to reopen by Easter in mid-April. The Dow Jones Industrial Average surged 2113 points (+11.4%) to 20,704, its biggest one-day percentage gain since 1933. The S&P 500 jumped 209 points (+9.4%) to 2,447, and the Nasdaq 100 rose 546 points (+7.8%) to 7,553. 

Later today, February durable goods orders (preliminary reading, -1.0% on month expected) will be reported. 

Economic Events to Watch Today    


EUR/USD – Daily Analysis

The EUR/USD advanced 0.8% to 1.0809. The Markit Eurozone Manufacturing PMI slid to 44.8 in March (39.0 expected) from 49.2 in February and Services PMI sank to 28.4 (39.5 expected) from 52.6. 

The EUR/USD currency could drop below the 1.08 if the coming German IFO Expectations Index for March disappoints expectation of 82, strengthening recession fears. Apart from this, U.S. Durable Goods data for February is also scheduled to release. 

The traders need progress soon in the global market; otherwise, the risk assets may suffer another selloff, boosting haven demand for the U.S. dollar. At press time, the S&P 500 futures are reporting a 1.4% drop. 

The U.S. dollar continues trading in the red territory against majors, as shown by the 0.3% drop in the dollar index. Federal Reserve’s unlimited quantitative easing plan has decreased pressure in funding markets and bought time for the politicians. 

The headlines regarding coronavirus and stimulus package by the Federal Reserve will be key to watch. Eyes will be on the German IFO Expectations Index for taking new directions.

Daily Support and Resistance 

  • S1 1.0531
  • S2 1.0673
  • S3 1.0742

Pivot Point 1.0815

  • R1 1.0885
  • R2 1.0957
  • R3 1.11

EUR/USD– Trading Tips

On Wednesday, the EUR/USD is trading sideways, forming higher’s high and higher’s a low pattern, which indicates stronger chances of a bullish bias in the market. The EUR/USD is trading around 1.0815, and it’s forming neutral candles while trading in an upward channel, which may support the pair around 1.0775. 

On the higher side, the EUR/USD pair may face resistance around 1.0880, and above this, the pair has the potential to target the next resistance level of 1.0930 while the EUR/USD has odds of staying bearish below 1.0920 to target 1.0805.


GBP/USD– Daily Analysis

The GBP/USD surged 2.1% to 1.1789 after the U.K. government ordered lockdown measures to stop coronavirus spreading. On the other hand, the Markit U.K. Manufacturing PMI fell to 48.0 in March (45.0 expected) from 51.7 in February, and Services PMI dipped to 35.7 (45.0 estimated) from 53.2.

The GBP/USD currency pair may drop to their lowest level if the UK CPI data releases sluggish while a surprise positive figures could help the pair extend its fresh recovery rally from the multi-year low.

The Consumer Price Index published by the Office for National Statistics is a gauge of price moves by the comparison among the retail prices goods and services. The purchasing power of GBP is slowed down by inflation.

The CPI is a leading indicator to measure inflation and show changes in purchasing trends. Usually, a high figure is understood as positive (or bullish) for the GBP, while a sluggish figure is seen as negative (or Bearish). Let’s look at the technical side of the market. 

Daily Support and Resistance

  • S1 1.1339
  • S2 1.1535
  • S3 1.1662

Pivot Point 1.1731

  • R1 1.1858
  • R2 1.1927
  • R3 1.2122

GBP/USD– Trading Tip

The direct currency pair GBP/USD maintains a broad trading range of 1.1400 – 1.1885 for another day as traders seem to wait for the U.K. Inflation today and Bank of England’s rate decision tomorrow. Today, the bullish breakout of the 1.1889 level can open the buying trend until the next resistance level of 1.2185 (38.2% Fibo level) and 1.2300 level, which accounts for a 50% retracement. On the lower side, the Cable can find support around 1.1665 and 1.1445.

A bearish breakout of 1.1425 level can lead the Cable towards the next support area of 1.1050. The MACD is tossing above and below zero as investors are unable to determine the trend of the market. 

USD/JPY – Daily Analysis

During the Wednesday early Asian session, the USD/JPY currency pair found on the bullish track and hit the session high near 111.58, mainly due to the recovery in the market risk sentiment because the United States policymakers agreed on COVID-19 bill. The USD/JPY is trading at 111.48 and consolidates in the range between the 110.75 – 111.56. 

After the two-days of disappointment, the Senate Democrats and Republicans ultimately agreed on the Trump administration-backed stimulus package plan. However, the raised expectations of the expected $2 trillion package to control the deadly virus impact and fresh strategy of reducing coronavirus (COVID-19) cases from Italy also improved the market risk sentiment.

Whereas, the United States 10-year treasury yields rose 4-basis points (bps) to 0.853% while the U.S. stock futures also decreased earlier losses. The Asian stocks flashing green and marked slight gains by the press time, which show’s drop in demand for safe-haven assets such as gold and Japanese yen.

For the time being, the traders are keenly awaiting the details of the voting as well as the times of the package for taking additional direction. However, the U.S. Durable Goods Orders for January and additional coronavirus headlines will be key to watch.


Daily Support and Resistance    

  • S1 107.85
  • S2 109.43
  • S3 110.32

Pivot Point 111.02

  • R1 111.91
  • R2 112.6
  • R3 114.19

USD/JPY – Trading Tips

Technically, the safe-haven currency pair USD/JPY hasn’t changed a lot as it continues to consolidate around 111.300. On the 4 hour chart, the USD/JPY has formed a bullish channel that is still intact, and it’s pretty much likely to support the USD/JPY prices around 110.650. 

A bearish breakout of 110.600 can lead its prices toward 109.600 level. The USD/JPY prices towards the next support level of 108.350, and around this level, we can expect USD/JPY to bounce off again. Conversely, the pair faces resistance around 111 and 112.190 today. Let’s stay bullish above 109.650 and bearish below the same level today. 

All the best for today!  

Categories
Crypto Market Analysis

Daily Crypto Review, Mar 25 – BTC failing to break above $7,000; What to expect next?

The cryptocurrency market attempted to go up and reach new highs but failed to do so as Bitcoin couldn’t break above the $6850 resistance successfully. Bitcoin is currently trading for $6,682, which represents a decrease of 0.63% on the day. Meanwhile, Ethereum lost 1.48% on the day, while XRP lost 0.02%.

ZEON took the position of today’s most prominent daily gainer, with gains of 272.17%. On the other side, Molecular Future lost 11.20% on the day, making it the most prominent daily loser.

Bitcoin’s dominance has increased over the past 24 hours. Its value is now 66.65%, which represents a 0.26% difference to the upside when compared to yesterday’s value.

The cryptocurrency market capitalization increased over the past 24 hours, with a current value of $184.35 billion. This value represents an increase of $4.7 billion when compared to the value it had yesterday.

What happened in the past 24 hours

Blockchain analysis firm Coin Metrics found out that even though Bitcoin was experiencing tough times (especially the one when its price had the biggest daily loss in the last seven years), stablecoins bloomed.

This company released its State of the Network report on Mar 23. Stablecoins gained a lot of the market share, which everyone could see. However, spreads on spot and futures markets widened, while transfer fees went up as people rushed to deposit coins.

Honorable mention

GRAM

A United States District Court has ruled against Telegram for the issue of using GRAM tokens without declaring that they are securities prior to the ICO.

Prior to that, the Securities and Exchange Commission’s requested a preliminary injunction, to which the Court answered that it finds that the SEC has shown great likelihood of success in proving the contracts and understandings at issue. This would be including the sale of 2.9 billion Grams to 175 purchasers which netted Telegram $1.7 billion.

_______________________________________________________________________

Technical analysis

_______________________________________________________________________

Bitcoin

Bitcoin had somewhat a turbulent day, with its price going from all the way to $7,000 and then back down to $6500, only to stabilize at just sligtly higher levels than yesterday. The largest cryptocurrency did not manage to break the $6,850 resistance successfuly, so the bears stepped in and brought the price back down. BTC is now holding below $6,850 and above $6,640. This move might be percieved as a fakeout above $6,850 and the market might look for a leg down towards the low $6,000’s or lower.


Bitcoin’s volume did not increase during the spike, which is quite interesting. Its RSI level is currently at the level of 62.

Key levels to the upside                    Key levels to the downside

1: $6,850                                           1: $6,640

2: $7,085                                           2: $5,960

3: $7,420                                            3: $5,000


Ethereum

Ethereum is currently fighting for where it will go next. Its price is stuck right at the $139 level, not knowing whether it will go up or down. However, a break to any side will not be as significant as the moves that Bitcoin makes, and could only bring the price up or down so far.


Ethereum’s volume is still at extremely low levels, while its RSI level is currently just above the mid-point of the value range, sitting at the value of 57.

Key levels to the upside                    Key levels to the downside

1: $168                                                1: $128

2: $178.6                                            2: $122.5 

3: $185                                                3: $100


Ripple

XRP had a day of virtually no movement. However, this is not quite due to its price, not wanting to move. The third-largest cryptocurrency was trading right below the $0.165 level, constantly failing to break it. This exact thing happened in the past 24 hours as well, as the price kept trying to go above the resistance, failing, and then going back to its previous levels.


XRP’s volume saw no increase or decrease on the day, while its RSI level is currently at 57.

Key levels to the upside                    Key levels to the downside

1: $0.165                                            1: $0.147

2: $0.19                                              2: $0.1

3: $0.2                                              

Categories
Forex Signals

USDCAD SHORT

This is a classic head and shoulders pattern where the neckline has been breached, and we expect the price to fall to our target line, which is a previous line of support.

Risk:

Standard Lot = £800

Mini Lot: $80

Micro Lot: $8

1 Hour Chart is used In This Trade.

The head and shoulders formation is a classic technical analysis pattern that professional Traders use in order to determine future price action.

In our setup, we have multi-year highs for this pair,  followed by a decline in price action to an area of support around the 1.4150  the key level, which will become our profit target.

Since pulled back from the original multi-year high around the one 1.4700 level, the price has consolidated into our head and shoulders formation, which consists of a left-hand peak and a pullback followed by a higher peak and a pullback and the third peak which again is lower than the second and similar to the first, where price action on each occasion pulls back to an area of support which is called a neckline.

When the neckline is breached, it confirms the setup, and that is where we have gone short. This offers a strong signal to traders that price action will continue down, at least to the previous area of support. And this is the hypothesis for our trade setup, where we have set in place a tight stop loss, just above the neckline, and where we have a generous win to lose ratio.

Categories
Forex Market Analysis Forex Signals

Upward Trendline Supports the EUR/USD – Who’s Up for Buying?

The EUR/USD is showing sideways trading in between the narrow trading range of 1.0885 – 1.0770. On the hourly chart, the EUR/USD has formed an upward channel, which is a key setup right now. If the EUR/USD manages to break below 1.0775 area, we may see further selling in the pair until the next support level of 1.0720. Conversely, the closing of candles above 1.0770 can drive a bullish trend until 1.0850 and even higher towards 1.0885. 


Looking at the leading indicators, the MACD mixed bias as the histograms are tossing above and below 0. However, the stronger economic figures from the Eurozone are somewhat supporting the EUR/USD pair. 


As per the recent reports from the European Union, the German business activity declined distinctly in March, mostly led by a record contraction in the country’s service sector. But traders understand that this slowdown in manufacturing data is mostly due to the increased number of coronavirus cases, and this will get better as soon as markets resume business activities. 


Considering this, we have opened a buying signal with the following specifications:


Entry Price 1.07915 

Stop Loss 1.07515 

Take Profit 1.08515

Risk & Reward Ratio: 1: 1.2

Profit & Loss Per Standard Lot = -$400/ +$600

Profit & Loss Per Micro Lot = -$40/ +$60

All the best ^Stay tuned for more updates! 

Categories
Forex Fundamental Analysis

‘Labor Force Participation Rate’ & It’s Impact On The Forex Market

What is the Labor Force Participation Rate?

Labor force participation rate can be defined as the group of the population who are between the age of 16 and 64 in the economy that is currently employed or unemployed (seeking employment). The other set of the population, including the ones who are still undergoing studies, people who are above the age of 64, and the housewives, do not fall into the labor force participation rate. As far as the formula for this concerned, it is the sum of all the employed people and the people seeking employment divided by the total noninstitutionalized, civilian working-age population*.

LFPR = Labor Force / Civilian Non-Institutionalized Population

Where Labor Force = Employed + Unemployed

Working-age population – this is the population of people in an area that is considered to be capable of working in a predetermined age range criterion.

More about Labor Force Participation Rate

The LFPR is a measure to evaluate the working-age population in an economy. This working-age population is a dataset of only those people who are between the age of 16-64.

Since the LFPR involves the calculation of the number of employed and unemployed people, this indicator is closely related to the unemployment rate. The LFPR is a vital metric when the economy is under recession or is slowing down. This is when the people get their eye caught into the unemployment data.

When the market is under recession, the labor force participation rate tends to go down. The reason to account for it is simple. At the time of recession, the economic activity is feeble, which results in fewer jobs across the nation. This, in turn, discourages the people from focusing on their employment and hence leads to a lowering of the participation rate. In addition, the participation rate is an important factor in understanding the unemployment rate.

The group of people who are not interested in working or are in some sort of insignificant type of job is not included in the participation rate. But, when it comes to the understanding of the unemployment rate in detail, we do take the participation rate into account. A population that has a majority of them who are aging, it can have a negative impact on the economy of any country. And this is when the labor participation rate comes into play. If the value is on the higher side, this is a good sign for the economy. But, for smaller values, the countries need to be cautious of their economies. This is the reason, both participation rate, as well as the unemployment rate, must be looked carefully into and simultaneously to get a clear understanding of the overall employment status in the economy.

What do the trends have to say?

Consider the above chart representing the labor force participating rate in the U.S. for two over two decades from 2000 to the present year. Defining as per the chart, the labor force participation rate is the population of people who are able to work as a percentage of the total population.

Going behind the specified period, the rate increased from 1960 to 2000, as women came into the picture of the workforce. At the beginning of 2000, the rate peaked at 67.3 percent. But, due to the recession that happened the very next year, the rate dropped to 65.9 percent by April 2014. Similarly, the recession in 2008, lowered the labor force participation rate even more to 62.3 percent by October 2015. In the coming years, though there wasn’t any significant financial crisis, the rate had risen only to 62.9 percent.

The primary implication to drop could be the falling of the supply of workers. So now, fewer works should manage to negotiate for higher wages. But things turned out to be different. The income inequality increased, and as a result, the average income workers were hit hard. And understandably, they could not put up a competition with robots. Moreover, businesses replaced capital equipment instead of hiring more labor as they found it be cost-effective.

The consistent falling rates of the labor force participation can be boiled to the four points listed below:

  • An aging population
  • Long-term unemployment, leading to structural unemployment
  • Increased opioid dependency
  • Sickness to the extent that they cannot work

How the ‘Labor Force Participation Rate’ Impacts the Economy?

The countries whose population has a skilled and mobile labor force that can adapt to the changing business needs, tend to have a good labor force and stable participation rate.

Investment in human capital plays a role in the valuation of the LFPR. When countries invest more in human capital and stand better than the crowd (rest of the countries), their economy tends to stay above the average mark.

Labor mobility acts as a great add-on to the labor force as well as the economy. The nations with mobile workers have the skill set to negotiate workers, change employers, and start new businesses. The U.S. is one such example of the same. They are much better than other developed countries when it comes to moving to find a job.

Impact of Labor Force Participation Rate on the Currency

The labor force participation rate determines the population in an economy who are employed and unemployed in a certain predefined age range. And this goes hand in hand with the unemployment rate of an economy. Hence, we can conclude that the impact of the currency from LFPR correlates with the unemployment rate.

A rise in the labor force participation rate implies an increase in the participation rate. And this is a positive sign for the economy of a country. Thus, an increase in the participation rate can lead to an appreciation in the value of a currency.

Contrarily, a downfall in the labor force participation rate implies that the labor force is dropped due to the bad performance of an economy. This typically happens during recession times. Therefore, to sum it up, a decline in the LFPR could indicate a negative effect on the currency.

Reliable Sources for Statistics on Labor Force Participation Rate

Firstly, the frequency of release of reports on the Labor Force Participation Rate is 30 days. All the data is expressed as a percent.

Below is a list of links through which one can access the participation rate data for different countries. The information that can be retrieved from the sources are as follows:

  • Actual, previous, highest, and lowest data
  • Graphical statistics for a period of more than 25 years
  • Forecast

USD | GBPEUR

For the rest of the countries, you may click the link here to access the reports.

Impact of Labor Force Participation Rate Announcement on the Price Charts

Now that we’ve understood pretty much on the theoretical concepts of Labor Force Participation Rate, let’s get a little technical and see how the reports of this economic indicator affect the prices of the currency. Basically, we will be seeing the movement in the charts before the release of the news and then observe its effects after the release of the news.

As already mentioned, this data is released on a monthly basis for most of the countries. For our discussion, we shall be considering the LFPR of the United States. That is, we will be analyzing how the LFPR affects rates of the U.S. Dollar.

Consider the below report released by the U.S. Bureau of Labor Statistics. The Labor Force Participation Rate in the United States has remained unchanged at 63.4 percent in February 2020. Note that, though the data is released in March, in reality, it is the reports for the month of February.

Now that we know the actual value is the same as the previous data, as well as the forecasted data, let us examine how it has affected the prices of the U.S. Dollar.

EUR/USD | Before the Announcement (March 6, 2020)

Consider the EUR/USD chart on the 15min timeframe. At this point in time, we can see that the market is in an uptrend and is presently moving sideways. Let’s see how the price is affected when the news comes out the next candle.

EUR/USD | After the Announcement (March 6, 2020)

Below is the same chart, but after the announcement of the news. The news candle is clearly represented in the chart as well.

We can see that after the news was released, the candlestick left a small wick on the top and a long wick on the bottom and closed a few pips below the open price. We can infer that the news didn’t much create a drastic move in the market. This is because the actual rate was the same as the previous rate. However, the volatility of the market showed an increase. The ATR indicator indicated that the current market volatility was ten pips. But, the volatility after the news release jumped to 27 pips. The volume too increased after the release of the news, which can be seen at the bottom of the chart.

This also means that the news could not really affect the current trend of the market. So, traders can still look out to buy entries after the release of the news. For instance, the wick in the bottom could be interpreted as the strength of the buyers in the market.

GBP/USD | Before the Announcement (March 6, 2020)

Below is the chart of GBP/USD on the 15min timeframe. The market is in an uptrend and currently is at the support (black line). We need to see if the news will respect the support or will break through it.

GBP/USD | After the Announcement (March 6, 2020)

Below is the same chart of GBP/USD after the announcement of the news. We can see that the news was positive for the USD. However, the USD wasn’t strong enough to break below the support. And this was because the actual value was the same as the previous value.

Coming to the volatility, the average volatility was ten pips, and when the news came out, the volatility increased 16 pips, which was decently above the average value. There was a slight increase in the volume as well.

As far as trading this pair is concerned, we can prepare to go long when a doji-like candle was formed at the support area.

Conclusion

Labor Force Participation rate is that economic indicator that measures the workforce of a country by considering a specific age group. As mentioned, the LFPR and the unemployment rate are closely related to each other. That is, for assessing the unemployment rate, having an idea about the participation rate is quite vital. The labor force participation rate has a good weightage in the valuation of the economy of a nation. It has its effects on currencies as well. So, this indicator turns to be handy for economists as well as traders and investors.

Categories
Forex Assets

Everything About The EUR/RUB Forex Asset

Introduction

The EUR/RUB is the abbreviation of the Euro Area’s Euro against the Russian Ruble. This is an exotic-cross currency pair. The volatility and volume in this pair are good enough for traders to day trade this currency. Here, the EUR is the base currency, and the RUB is the quote currency.

Understanding EUR/RUB

The price in the exchange market of the EUR/RUB specifies the value of RUB that is needed to purchase one Euro. It is quoted as 1 EUR per X RUB. For example, if the value of EUR/RUB is 85.769, this much of Rubles are required to buy one Euro.

Spread

The price of buying is not the same as the price for selling. One must pay the ask price for buying and bid price for selling. And the difference between the bid price and the ask price is called the spread. This value varies based on the type of execution model used by the broker.

ECN: 42 pips | STP: 44 pips

Fees

Like in the stock market where you pay commission on both sides of your trade, in the forex market as well, you must pay few pips of fee for your trade. This could be between 5-10 pips. Note that the fee on STP accounts is nil.

Slippage

Due to the volatility in the market and the broker’s execution speed, there is a difference in the price at which you execute the trade and price, which is actually given by the broker. This is known as slippage.

Trading Range in EUR/RUB

The depiction of the minimum, average, and maximum volatility in the market for different timeframes is given in the below table. These values help us in assessing the risk of trade for a specified time frame.

Procedure to assess Pip Ranges

  1. Add the ATR indicator to your chart
  2. Set the period to 1
  3. Add a 200-period SMA to this indicator
  4. Shrink the chart so you can assess a large time period
  5. Select your desired timeframe
  6. Measure the floor level and set this value as the min
  7. Measure the level of the 200-period SMA and set this as the average
  8. Measure the peak levels and set this as Max.

EUR/RUB Cost as a Percent of the Trading Range

The cost of trade changes as the volatility of the market also changes. In the below tables, we have illustrated the cost variation in the trade-in different timeframes and volatilities for both ECN and STP model account.

ECN Model Account

Spread = 42 | Slippage = 3 |Trading fee = 3

Total cost = Slippage + Spread + Trading Fee = 3 + 42 + 3 = 48

STP Model Account

Spread = 44 | Slippage = 3 | Trading fee = 0

Total cost = Slippage + Spread + Trading Fee = 3 + 44 + 0 = 47

Trading the EUR/RUB

The EUR/RUB is one of the most traded exotic-cross currency pairs. The volatility in this pair is pretty high. However, a retail trader can still trade it.

Consider the above two volatility tables. We can see that the values are large in the min column and small in the max column. This means that the costs are more when the volatility is low, and less when the volatility is high.

Traders looking to trade with low cost can consider trading when the volatility is high. And traders who need low volatility will have to bear higher costs. There are traders who look for a balance between the two. Such traders can trade when the volatility of the market is around the average values. This will ensure enough volatility as well as low costs.

Another simple way to reduce cost is by placing orders using limit and stop instead of the market. This will take away the slippage on the trade. Hence, this will reduce the total cost of the trade. So, in our example, the total cost will reduce by three pips.

Categories
Forex Videos

Develop An Unbeatable Forex Trading Strategy – Round 1

Develop An Unbeatable Forex Trading Strategy

Example 1: In this session, we are going to be discussing trading strategy as this is something that new traders find difficult to develop and implement without deviation.


Any forex strategy should be a systematic step-by-step procedure for how and when to use specific tools when a sequence of analysis needs to be developed.
Typical components of any strategy should include the following:


Example 2: The types of analysis tools we will be using. Whether it’s technical, fundamental, or both, it is something that will always be personal and based on your preferences. Now, although preferences are important specific analysis tools will have a generally higher success rate, and you should take some time to learn out of your comfort zone to improve on your weaknesses. You should have a clear order setup before you as to when and how you apply these analysis tools.


Example 3: next, you will want to have a clear picture of the timeframes, and trading windows will need to use. It’s no good trading an unsocial trading window that encroaches on your sleep and day-to-day responsibilities, and in addition, we want to use the same timeframe to implement our analysis tools while considering the type of trader we want to become. For instance, scalpers will rarely use the daily time frame because they are looking for quick in and out trades based on the technical analysis of the lower time frames.
For the longer time frame Traders, it would be beneficial to scan through the pairs that you are interested in trading in order to ascertain the key levels of support and resistance enable to drill down using your technical tools to look for potential trade entries and exits.
No matter what type of trader you want to be, it is important to consider fundamental factors which might impact on your trading, or assist your decision-making such as economic data releases, interest rate decisions, and key political events. In which case, you want to keep an eye on the economic calendar for the day or even week ahead.
We want to establish what high probability trades are available based on our technical and fundamental analysis. When developing a trading strategy, we need to implement all of these features and stick to them rigidly in order to achieve consistent trading profitability. Should any part of the strategy fail for any reason, we will need to make adjustments accordingly in order to make the trading strategy more fail-proof.


Example 4: What types of orders will you be using. If you are unable to be available during the times where you would normally need to trigger a buy or sell, you must make use of pending orders. If you’re trading news and have plenty of time on your hands, you may want to enable one-click trading to quickly enter the market based on data releases. This will all factor into your larger plan, and you should write down every detail. The purpose of strategy development is to increase your probability of success through research, development, and application, just as any other commercial business would go through in their model.


Example 5: We can’t talk about developing a successful strategy without looking at risk management in great detail. Risk management is the key most important aspect of a financial traders toolbox. Trying to determine what your risk appetite is while training can initially be very difficult.


Example 6: You need to consider your available balance, the pair being traded, pip worth, lot size, and other factors. You should never be trading with money you actually need because this will play with your emotions and put enormous psychological pressure on your trading, especially when things are not going your way.
Those who consistently make money in forex trading might not necessarily have more winning trades than losing trades. A part of being a consistently winning trader is knowing when to let the losing trades go and exit quickly, with as little loss as possible, while optimizing those winning trades and letting them run on as long as possible, through careful trade management, in order to maximize the amount of pips to be one. This comes down to the risk to reward ratio and to accept losses in accordance with your strategy. And as well as accepting your profits in accordance with your training strategy. Remember, we are looking for a consistent strategy without deviation. A common mistake of new traders is to quickly take profits and let losing trades run. As a consequence of this, they need to accept a higher risk to reward ratio than professional traders. Professional Traders will typically use a set percentage of risk on every single trade. The larger the accounts size, the smaller the percentage of risk should be. For example, you could have a trade with a risk to reward ratio of 1 to 3, where one equates to 3% of your bank. You could think to take that 3% and split it into three entries. Those three entries may have varying profit levels.


Example 7: Let’s look at the strategy checklist and add any of these components to your own strategy if you have not done so already. Be patient, test your strategy on a demo account over a period of 2 to 3-months and tweak and adjust as necessary because if it doesn’t work on a demo account, it certainly will not work on a real money account.
Successful Traders will look at the amount of money they can lose as well as the money they can make. Do not fall into the same trap as many Traders and simply bury your head in the sand when you are needed in a losing trade. Stop losses are the best way to implement against trades that run away from you. Having a frugal mindset will protect you against losses and bad decision making.
In every trade that you enter, you must have two things on your mind: at what point do you get out if it becomes a losing trade and at what point do you get out of a winning trade.
One thing is for sure when trading, there will be trades that you get stopped out of, and they then turn around and become what would have been winning trades, there will be trades that you will be stopped out of, and they will continue to have moved against you, and you will be grateful for your stop loss, and there will be trades that you get out of having taken your profit, only for them to continue on for hundreds of more pips. This is all a part of trading. It is all about sticking to

your methodology and trading strategy, making money consistently, looking for the next set up, and fighting on. Do not dwell on losses, do not dwell on what might have been, simply carry on with your strategy and remember the old adage: if it ain’t broke don’t try and fix it.

Categories
Forex Signals

Profit from our Brand-New Signals Section!

Dear members,

It is a great pleasure to present our new Signal Table section. In this section, a team of successful traders will be continuously observing the financial markets to put at your disposal trading signals of the highest quality.
Each signal will be waved to everyone subscribing to our notifications. In addition, each signal will show a link to a short article with the explanatory arguments, the levels of input, stop-loss. Take profit, and the risk per lot, mini-lot and micro-lot will also be included. We initially expect to deliver about 5-6 trading ideas per day for you to choose from.
The table will be refreshed almost live, so it will show the pips gained or lost on every trade, and also to total pip balance.
This is a great effort to bringing you the best possible trade ideas totally free of charge!
Access our free Signal Table section, and click the bell located at the bottom right of the table for notifications to your device.

Risk Management

Please note that the financial markets are risky, so be smart and start slow. Trade only the money you can afford to lose.
As we said, on each trade idea, we are going to show the risk levels per micro-, mini-lot, and lot. That is for you to help you with the management of your position size.
It is advisable not to trade in excess of 2 percent of your current balance. Let’s review with an example.
There, we see the following information:
EUR/USD Trading Signal

Entry Price:  1.07839
Stop Loss: 1.07439
Take Profit 1.08239

R/R Ratio 1:1

Risk of 1  Standard Lot: $400
Risk of 1 Mini Lot: $40
Risk of 1 Micro Lot: $4

Let’s assume a trader has a current trading balance of $1000. how much to trade to fulfill the 2 percent rule?

Two percent of $1000 is $20. Since the risk per Micro Lot is $4, the trader should trade no more than five micro-lots.

Drawdown

The max expected drawdown when risking 2 percent of your account on each trade can be up to 20 percent of your trading balance. If you think this is too much for you, please consider cutting your trade size in half for a max drawdown below ten percent.
We wish you all very successful trading!
Access our free Signal Table section, and click the bell located at the bottom right of the table for notifications to your device.
Categories
Forex Market Analysis

Daily F.X. Analysis, March 24 – Top Trade Setups In Forex – Eyes on Manufacturing PMI Figures! 

The U.S. Dollar Index regained bullish bias at 102.81, while U.S. stock scored daily downside limits. Federal Reserve Bank of St. Louis President James Bullard said U.S. jobless rate might soar to 30% in the second quarter, and the Fed can provide more support if necessary. The U.S. official data showed that existing home sales amounted to an annualized rate of 5.77 million units in February, higher than expected.

Later today, eyes will be on the U.K. and U.S. manufacturing figures, which have the potential to price action

Economic Events to Watch Today    


EUR/USD – Daily Analysis

This morning, EUR/USD fell 0.2% to 1.0673, following a 0.4% gain on Friday. Later today, the eurozone’s March Consumer Confidence Index (-14.0 expected) will be released. The EUR/USD pair may cross the strong resistance level if the risk-off market sentiment gets more worsens ahead. Eventually, it will likely fuel deeper losses in the greenback and may increase demand for the common currency.

The EUR/USD currency pair may come under pressure in the coming European session if the Eurozone and German preliminary Manufacturing PMIs for March ignore expectations. The data is expected to surprise on the lower side, in the wake of the coronavirus outbreak and may show investors how much economy is affected by the COVID-19 impact.

Looking forward, the traders will keep their eye on the Eurozone and German preliminary Manufacturing PMIs for taking fresh direction, and it will likely leave the impact on the pair movement ahead. As well as, the United States and Federal Reserve incomplete deal-related headlines also will be key to watch.

Daily Support and Resistance

  • S1 1.043
  • S2 1.0592
  • S3 1.0678

Pivot Point 1.0753

  • R1 1.0839
  • R2 1.0914
  • R3 1.1075

EUR/USD– Trading Tips

The EUR/USD traded bearishly as it as violated and closed below horizontal support becomes a resistance level of 1.0990. The EUR/USD is trading around 1.0750, and it’s forming a lower-lows pattern on the 4-hour chart, which mostly drives a continuation of a selling trend. 

Right now, the EUR/USD is trading at 1.0720, consolidating in a narrow trading range of 1.0817 – 1.0660. The EUR/USD is facing hurdles around 1.0817, and above this, the pair has the potential to target the next resistance level of 1.0930. While the EUR/USD has odds of staying bearish below 1.0920 to target 1.0805. On the daily chart, a violation of 1.0605 can extend the selling trend until 1.0550.


GBP/USD– Daily Analysis

The GBP/USD retreated 0.7% to 1.1557, after a 1.4% rally in the prior session. The GBP/USD pair slipped due to a stronger dollar after the U.S. official data showed that housing starts posted at an annualized rate of 1.599 million units in February (1.500 million units expected). The U.K.’s emergency coronavirus legislation will also reach the House of Lords for additional discussion before turning into the law some time by the end of the week.

However, the risk-sentiment continues to flash green with the U.S. ten-year treasury yields, S&P 500 Futures, and Asian stocks are all on their ways to recover the latest losses; while the headline Manufacturing and Services PMIs from the U.K. and the U.S. are likely to move into the contraction phase, with readings below 50.00. 

Looking forward, the traders will keep their eye on the Flash Manufacturing PMI and FPC Meeting Minutes for taking fresh direction. As well as, the United States and Federal Reserve incomplete deal-related headlines also will be key to watch.


Daily Support and Resistance

  • S1 1.105
  • S2 1.1318
  • S3 1.1456

Pivot Point 1.1586

  • R1 1.1724
  • R2 1.1853
  • R3 1.2121

GBP/USD– Trading Tip

On Tuesday, the GBP/USD continues to consolidate in a broad trading range of 1.1400 – 1.1885 as the trend of the market isn’t clear. On the higher side, the bullish breakout of the 1.1885 level can open the buying trend until the next resistance level of 1.2185 (38.2% Fibo level) and 1.2300 level, which markets 50% retracement while the pair has solid chances of bouncing off over 1.1450 level. 

A bearish breakout of 1.1425 level can lead the Cable towards the next support area of 1.1050. The MACD is tossing above and below zero as investors are unable to determine the trend of the market. 


USD/JPY – Daily Analysis

At the starting of Tuesday’s Asian session, the USD/JPY currency pair hit the bearish track. They dropped to an intra-day low of 110.10, representing 0.69% losses mainly due to broad-based greenback weakness after rising expectations of further delays in the US COVID-19 bill. The USD/JPY is trading at 110.53 and consolidates in the range between the 110.09 – 111.30. Moreover, the currency pair gave little attention to the preliminary readings of Japan’s Jibun Bank PMIs and continued its declining streak.

At the data front, the preliminary readings of March month Jibun Bank Manufacturing PMI dropped below 47.6 to 44.8 in March. Moreover, the Services index dropped from 46.8 before 32.7, the lowest since September 2007. After the U.S. Senators’ failure to receive the much-awaited coronavirus (COVID-19) package bill, U.S. President, Vice President and Treasury Secretary tried to confirm traders that the stimulus package will be agreed soon. Still, he did not succeed in hiding fears of further delays in the relief package. 

However, the report came that the Senate is not expected to vote on the Bill today too, and indicated further delays in President Trump’s ‘major’ response to the coronavirus.

On the positive side, the U.S. inflation expectations recovered slightly from the record low after the latest Federal Reserve statement that there is no limit to their Quantitative Easing program. 

Daily Support and Resistance    

  • S1 105.08
  • S2 107.59
  • S3 109.24

Pivot Point 110.1

  • R1 111.75
  • R2 112.61
  • R3 115.13

USD/JPY – Trading Tips

The USD/JPY pair has shown a slight bearish movement, falling from 110.65 level to 109.580. On the 4 hour chart, the USD/JPY has formed a bullish channel that is still intact, and it’s pretty much likely to support the USD/JPY prices around 109.650. 

A bearish breakout of 109.600 level can lead the USD/JPY prices towards the next support level of 108.350, and around this level, we can expect USD/JPY to bounce off again. Conversely, the pair faces resistance around 111 and 112.190 today. Let’s stay bullish above 109.650 and bearish below the same level today. 

All the best for today!  

Categories
Crypto Market Analysis

Daily Crypto Review, Mar 24 – Bitcoin recording double-digit gains as it reaches $6,500

The cryptocurrency market managed to pull its weight to the upside as Bitcoin surged and recorded double-digit gains in the past 24 hours. Bitcoin is currently trading for $6,488, which represents an increase of 10.73% on the day. Meanwhile, Ethereum gained 8.91% on the day, while XRP gained 6.27%.

Bytecoin took the position of today’s most prominent daily gainer, with gains of 17.64%. On the other side, Steem lost 1.82% on the day, making it the most prominent daily loser. At the moment, it seems that the market moves as a whole (or at least in the same direction) and that not many cryptos differ from this rule.

Bitcoin’s dominance has increased over the past 24 hours. Its value is now 66.39%, which represents a 0.41% difference to the upside when compared to yesterday’s value.

The cryptocurrency market capitalization increased over the past 24 hours, with a current value of $180.28 billion. This value represents an increase of $3.5 billion when compared to the value it had yesterday.

What happened in the past 24 hours

Democrats in the US House of Representatives are looking to implement the US-made digital dollar in order to streamline payments to its citizens outside of the traditional financial system. This idea has come up as many people were in need of some form of a stimulus package as a response to the economic crisis caused by the COVID-19 outbreak.

Honorable mention

MakerDAO

The MakerDAO (MKR) has recently announced an auction to recover the DAI collateral debt. This auction is almost complete, even with the procedure suffering some technical setbacks. The MakerDAO community largely remains optimistic as they think that Maker is handling the situation quite well.

_______________________________________________________________________

Technical analysis

_______________________________________________________________________

Bitcoin

Bitcoin managed to pull itself out of the falling price by creating lower lows pattern. The largest cryptocurrency soared above $6,000 once it broke the $5,960 resistance. The price was, however, stopped by the $6,640 resistance. Bitcoin is now consolidating right below this key level, trading at around $6,500 at the time of writing.


Bitcoin’s volume increased slightly during the price surge, while its RSI reached above 60 values on the 4-hour timeframe.

Key levels to the upside                    Key levels to the downside

1: $6,640                                           1: $5,960

2: $6,850                                           2: $5,000

3: $7,085                                            3: $4,300


Ethereum

Ethereum followed Bitcoin price-wise and increased in value as well, though not quite as much. The second-largest cryptocurrency has broken its $128 resistance quite quickly and moved towards future resistances. However, a new key resistance level has formed at the $139 level, which stopped the price from increasing twice in the past 24 hours.


Ethereum’s volume increased only during the duration of the candle, which brought its price over $128, while the rest of the day went by with regular volume. Its RSI level increased and is now at a value of 55.5.

Key levels to the upside                    Key levels to the downside

1: $168                                                1: $128

2: $178.6                                            2: $122.5 

3: $185                                                3: $100


Ripple

XRP increased in price as well over the past 24 hours. However, a pattern that is present for a couple of runs (to the upside as well as the downside) is that XRP did not break any support or resistance levels. XRP couldn’t get past the $165 level and is now trading at the $158.5 level, performing consolidation.


XRP’s volume increased only slightly when compared to the past couple of days. Its RSI level increased to the value of 55.

Key levels to the upside                    Key levels to the downside

1: $0.165                                            1: $0.147

2: $0.19                                              2: $0.1

3: $0.2                                              

Categories
Forex Videos

How To Profit From Double Top Formations In Forex

How To Profit From Double Top Formations In Forex

In this presentation, we will be looking at the technical analysis chart pattern known as a double top. Being able to recognize this formation or pattern and the information it provides us with will help to trade more effectively.

Double top patterns one of the many pillars of technical trading structures and should be incorporated into your trading knowledge base. Double top identification and understanding can further enhance your technical analysis when trading the forex market,y helping us see more than just support and resistance levels.

Example A

So what exactly is a double top? It will include two high points within the market, which generally signify an impending bearish reversal. There will usually be a decline in price between two high points. After the first peak has formed, there will be a retracement to a certain degree, before another rally to the upside. The second peak usually forms at the same level or slightly below the first peak, although occasionally it might breach the level of the first peak before price action reverses.

Example B (OR EXAMPLE C)

Here we can see that after a rally to the upside to peak one, price action reverses to our line of support line, often called a neckline between the two peaks, before the second push higher to peak number 2, and where price action reverses from this area, suggesting unsustainable buying pressure and that we should expect a reversal. And where price action goes on to breach the previous level of support, with a strong bearish candlestick, this is confirmed as a double top formation. And where price action subsequently comes back after some brief consolidation, with mixed small shaped candlesticks suggesting a lack of direction and where the previous level of support becomes an area of resistance and hence the continuation downwards which adds to our belief and support for this technical setup.

Example D

On the flip side, we have the double

bottom formation. This setup is identical to the double top in its theory and execution of trading. However, it is simply in reverse, In which case the exact same rules apply, But it is simply the mirror image of the double top. In this case, we would expect a bullish signal once the neckline is broken.

Example E

So here, for example, we can see a push down in price action to our first bottom, before price reverses to the neckline, which acts as an area of resistance, and where price subsequently comes down again to our second bottom, and where price action again returns to the neckline and breaches it and where this prior area of resistance becomes an area of support, and where price action continues to the upside from.
So to sum up, we are looking for two peaks at a similar height and where price action reverses between them to a neckline or area of support, which subsequently becomes breached after reversing from the second peak.
Secondly, we should make sure that the peaks are not too small because we prefer them on larger time frames of 15 minutes or higher because that is where we would expect larger amounts of pips to be made from this successful trade setup. This type of setup should be used in conjunction with a stochastic or ma CD to support double top or double or bottom formation.

One of the biggest problems with technical trading is that sometimes these patterns appear obvious in hindsight and that quite often we will miss opportunities and of course this can be very frustrating when you are always missing the mark. These patterns appear on our chats and often can be difficult to decipher when the market is moving, and with the pressure of placing trades sometimes, we simply miss these setups. There are two ways of going about solving this problem, and both have their pros and cons. We can either anticipate the formation before it occurs or wait for confirmation to trade the potential reversal. This will always be down to your appetite for risk, your personality as a trader, and your competence at understanding the nature of the forex market. Reactive traders who are playing the safer game have the advantage of simply seeing the pattern occur and trading it accordingly with the downside to this, which is that part of the trade has already been missed. This can equate to larger potential stop losses and less pips being made as the move continues.

Traders who have gotten into the sell or buy during the second peak or bottom phase of the setup will enjoy the comfort of having tighter stop losses, which should be placed a few pips above or below the first peak or first bottom. And of course, they will be able to claim more pips.

As with anything in forex trading, these things are a matter of trial and error and consistency, and therefore practice and observation will pay dividends in the long run.

Categories
Forex Fundamental Analysis

Impact of Unemployment Rate On A Nation’s Economy & It’s Currency

Introduction

The unemployment rate is a fundamental indicator of macroeconomics. Before getting into defining the unemployment rate, let’s first understand what even unemployment is. Later, we shall get deep into understanding the unemployment rate and its effects on the economy and the currency (using price charts).

What Is Unemployment?

To put it in simple terms, Unemployment is a scenario where a person is constantly looking for work but is unable to find it. So, works are considered to be unemployed if they do not work but are capable and are willing to do so. This is a great factor in determining the health of the economy. And the measure of unemployment is what is termed as the unemployment rate.

Understanding Unemployment Rate

The unemployment rate can be defined as the percentage of unemployed workers in the total labor force, where the total labor force comprises of all the employed and unemployed citizens within an economy. Mathematically, it is the number of labor force divided by the number of unemployed people. And as mentioned, to be considered unemployed, the person must have an active history of them looking for jobs. So, if you’ve given up looking for a job or work, you will not be considered unemployed.

More about Unemployment

Unemployment is a vital economic indicator as it indicates the inability of the workforce to obtain work to contribute to the productive output of the economy. The simple implication of unemployment would be less total production than that could have been possible. Also, an economy with high unemployment would have lower growth output with disproportional fall in the requirement for basic consumption.

On the flip side of things, a low unemployment rate implies that the economy is producing goods almost at its full capacity, having a commendable output, and rising standard living standards. Talking it further, an extremely low unemployment rate would mean an overheating economy and signs for inflationary pressures. It could be a hard time for businesses that would be in need of additional workers.

Types of Unemployment

Now that the definition of unemployment is clear, let us go ahead and understand how economists have classified unemployment. Unemployment is broadly classified into two types, namely, voluntary and involuntary. Voluntary unemployment is the case when the person has quit the job voluntarily in search of another job. But, in the case of Involuntary unemployment, the person has been fired by the organization. Now, the person must look for other employment. Voluntary and involuntary unemployment can be further divided into four types.

  • Frictional Unemployment
  • Cyclic Unemployment
  • Structural Unemployment
  • Institutional Unemployment
Frictional Unemployment

Frictional Unemployment is the most obvious type of unemployment. This occurs when a person is in between jobs. When a person quits a company, it takes some time to search for a new job. However, this unemployment is typically short-lived. Moreover, this type of unemployment does not really cause problems for the economy. Frictional unemployment is something natural, as ideally, it is not possible to find a job right after a person leaves a job.

Cyclic Unemployment

Unemployment varies based on the cycles of the economy is termed as cyclic unemployment. During the course of economic growth and declines, there is variation in the number of unemployed workers. For example, during economic recessions, unemployment rises, and during economic growth, unemployment decreases.

Structural Unemployment

This type of unemployment causes due to the advancements in the technology, or the structure through which the labor markets operate. The technological advancements could be the automation of manufacturing or the use of automobiles in place of horse-drawn transport. Such things lead to unemployment because there is no requirement of labor for it.

Institutional Unemployment

The consequence of permanent or long-term institutional factors and incentives in the economy could be unemployment. Such unemployment is called institutional unemployment. Some of the factors leading to institutional unemployment include

Government policies
  • High minimum wage floods
  • Generous social benefit programs
  • Restrictive occupational licensing laws
Labor market phenomena
  • Efficiency labor
  • Discriminatory hiring
Labor market institutions
  • A high rate of unionizations

How the Unemployment Rate Affects the Economy

We know that the unemployment rate is a vital indicator, as it gauges the joblessness in an economy. This, in turn, gauges the economic growth rate as well.

The unemployment rate economic indicator is a lagging indicator. This indicator does not predict that the market is going to rise or go under recession, but it measures the effect of the economic events. Based on the event, this indicator makes a move. For example, the unemployment rate does not rise until the recession has officially begun. But, a point to note is that the unemployment rate continues to rise even after the recession starts to fade away.

There are two reasons for it. One of them is that the companies are reluctant to lay off their people when the economy takes a downside. For large companies, it might take a few months to come up with a layoff plan. Secondly, the companies are more reluctant to hire new workers until they have a confirmation that the economy has stepped into the expansion phase of the business cycle.

For example, during the well-known financial crises that happened in 2008, the recession actually began during the first quarter of the year. The US GDP had 1.8 percent. Until May 2008, the unemployment rate was 5.5 percent. But, when the recession came down, and the economy started to do well, the unemployment rate hit 10.2 percent in October 2009.

So, with this, we can entitle the unemployment rate as a powerful confirmation indicator rather than a lagging indicator. For example, if the other leading indicators are already showing an expansion in the economy, and the unemployment rate has started to decline, then you are confident that the companies are yet again going to hire people.

Unemployment Rate and its Impact on the Currency

As already discussed, unemployment signals the economic growth of a country. If the economy is doing is bad, then then the unemployment rate rises. And if the economy is growing fairly, the unemployment rate declines. When it comes to currency, it is proportional to the economic growth of a country. This, in turn, implies that unemployment is inversely proportional to the value of the currency.

Frequency of the release of the Unemployment rate

The unemployment rates are released by the Bureau of Labor Statistics on Friday of every month. Typically, the present values are compared with the previous month’s values. Sometimes, a year-to-year comparison is made as well.

Dependable Sources of Information 

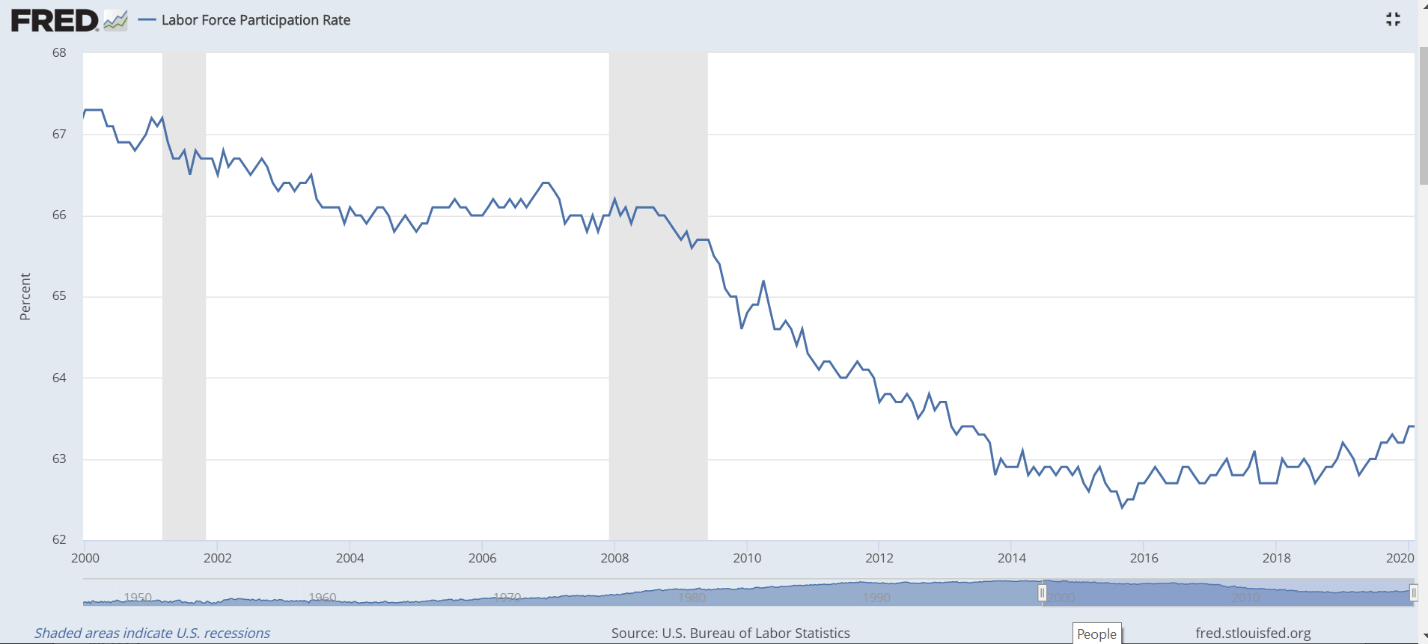
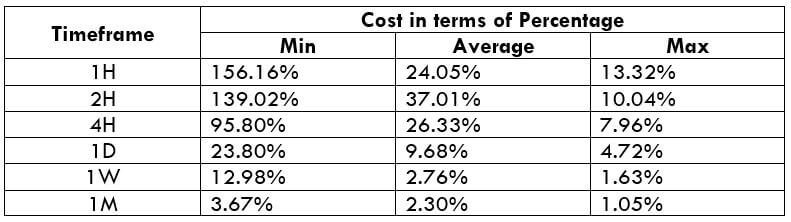
With the list of sources mentioned below for different countries, one can obtain valuable statistical information on the unemployment rates. Specifically speaking, one can get a visual representation of the historical values over a period of as high as 25 years. Apart from that, users get access to information regarding the actual, previous, highest, lowest unemployment rates as well.

USD | CAD | CHF | AUD | JPY | EUR | GBP

How the ‘Unemployment Rate’ News Release Affects the Price Charts?

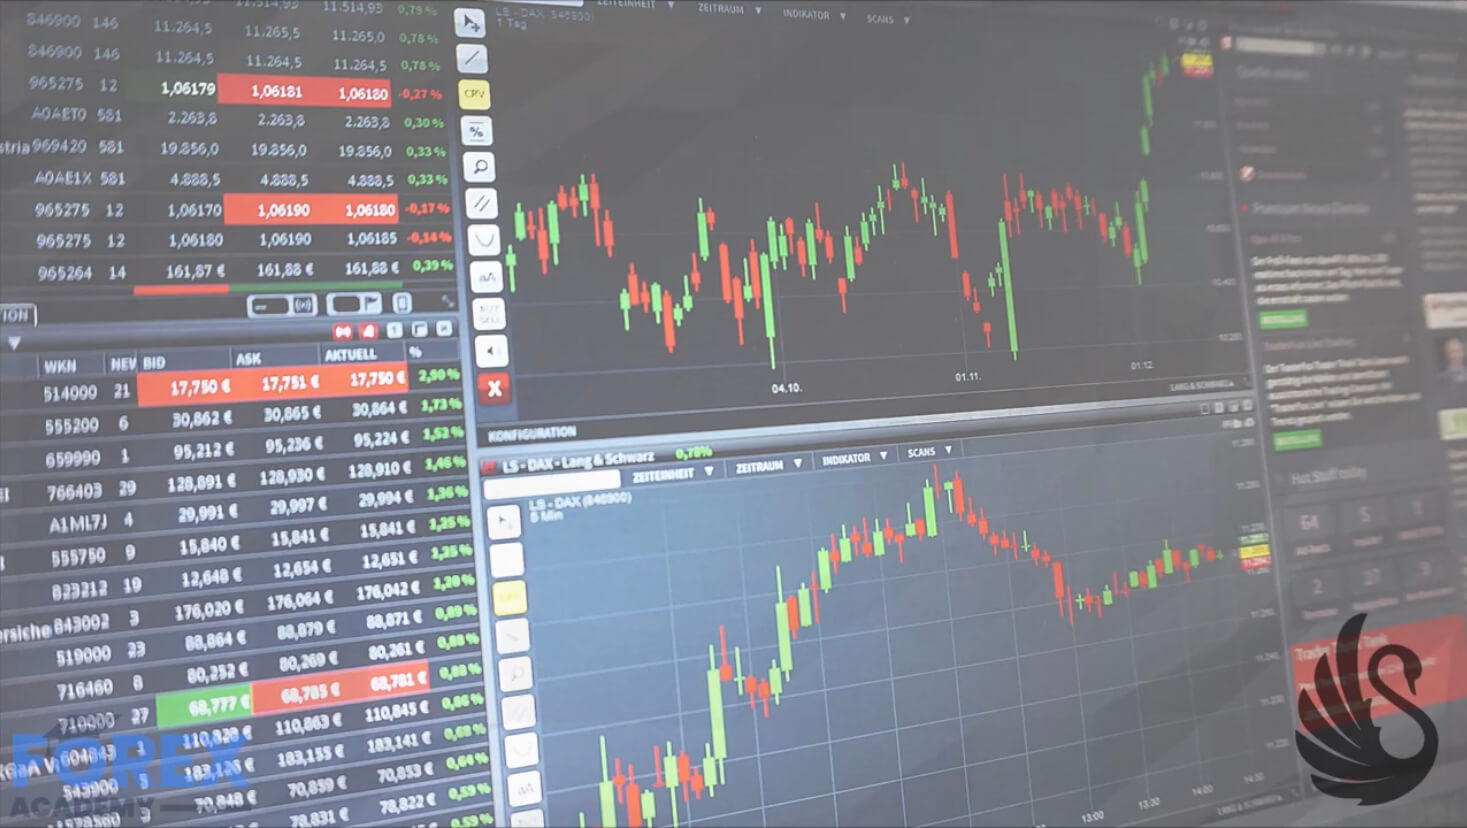
Now that we have a good amount of theoretical information on the Unemployment rate, let’s get a little technical. In this section, we shall analyze how the prices of the currencies are affected after the release of the reports.

As mentioned, the reports on the unemployment rate are released by the Bureau of Labor Statistics on a monthly basis, typically on Fridays. As a usual effect, it is said that the actual data less than the forecasted data is good for the currency.

Also, note that, as per sources (Forex factory), this news is expected to have a high impact on the currency. For our illustration, we have taken into account of the Unemployment rate of the US released on 7th February.

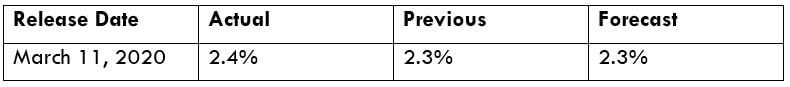
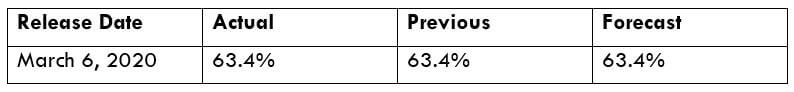
In the below image, we can see that the Actual percentage is 3.6%, which is 0.1% higher than the forecasted percentage (3.5%). Also, it is higher than the previous month’s value. So, we can conclude that the unemployment rate in the US has increased in February compared to January.

When it comes to the effect on the forex exchange market, we can expect the US dollar to drop as the unemployment rate has increased (which is not good for the economy).

Now, let’s see its effect on few USD charts by pairing it with other major currencies.

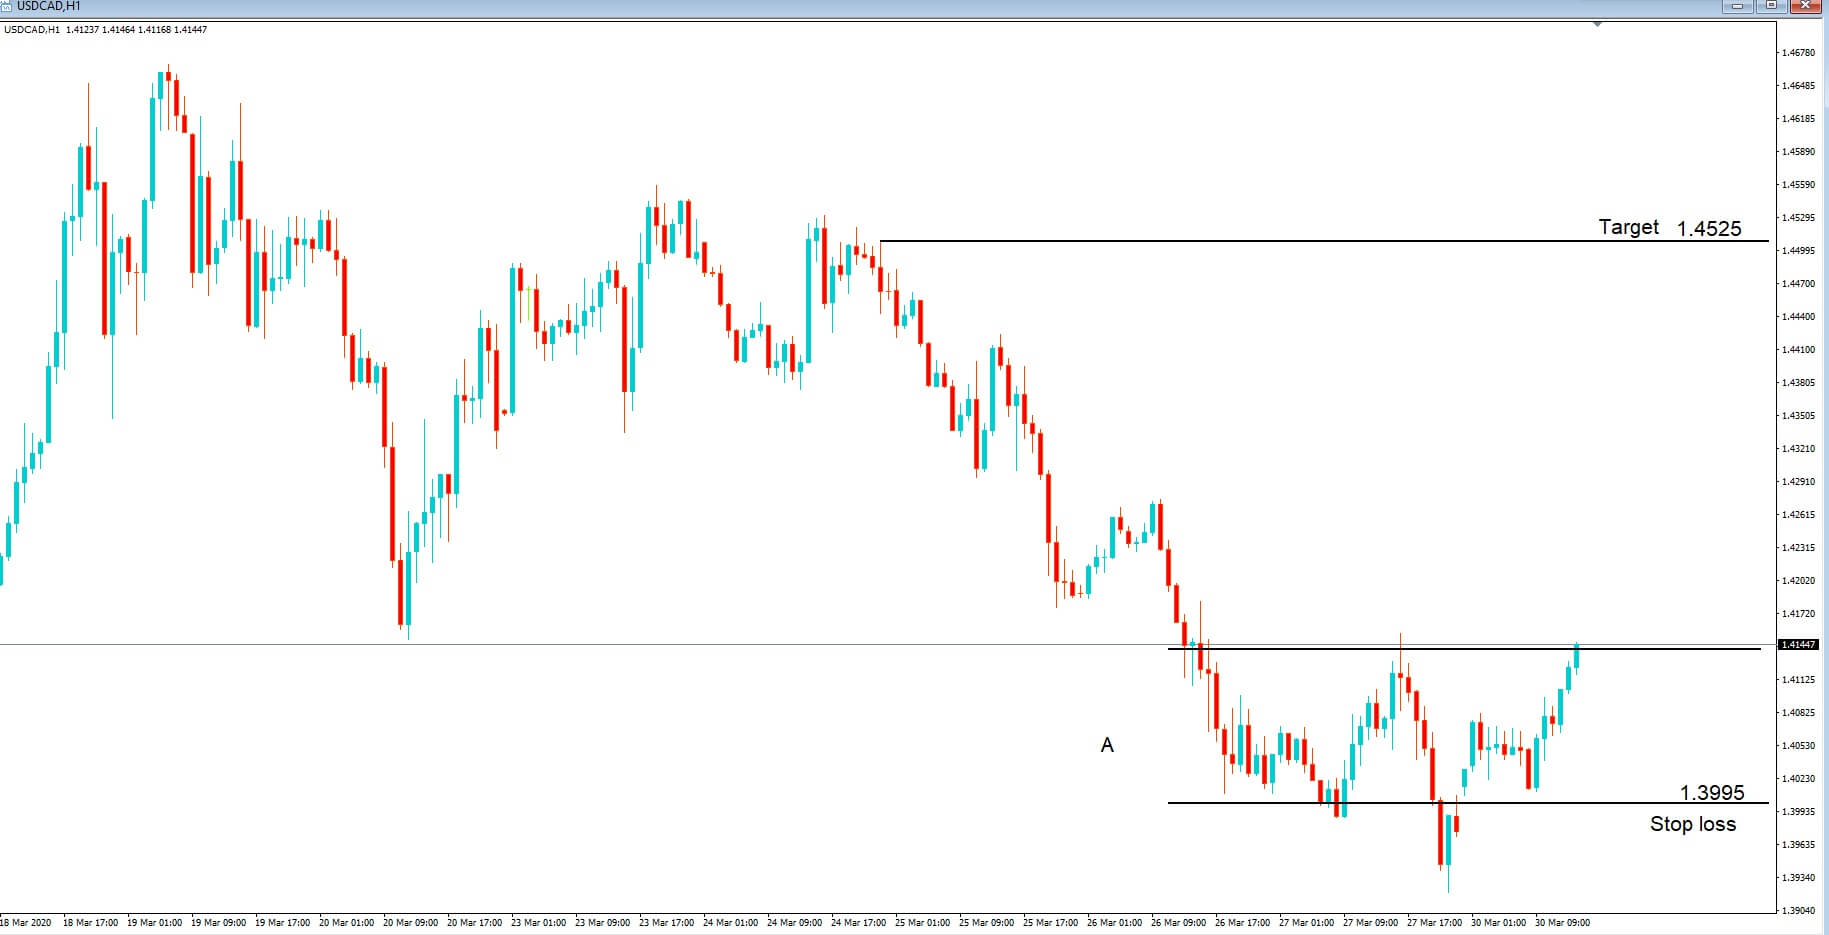
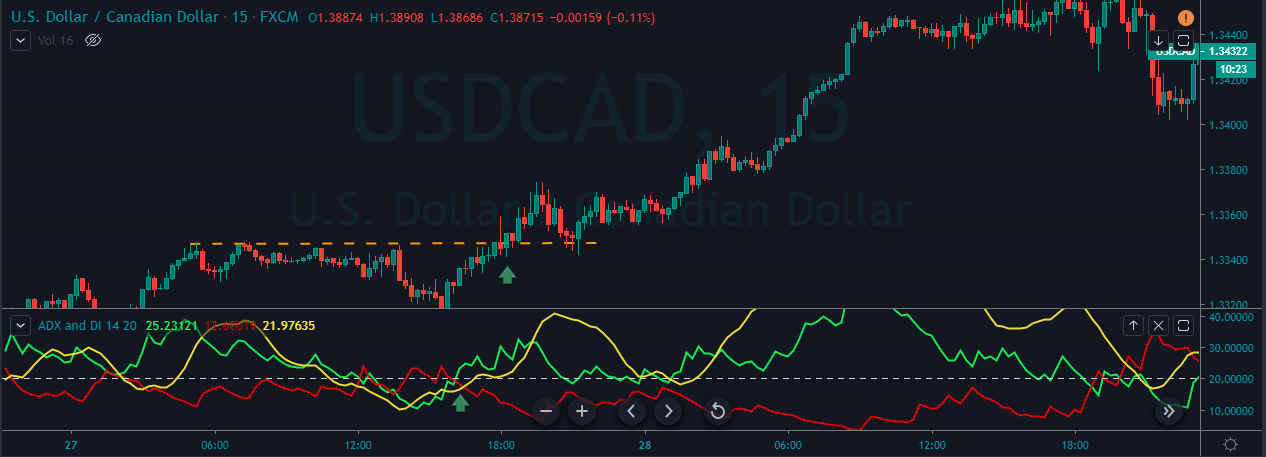
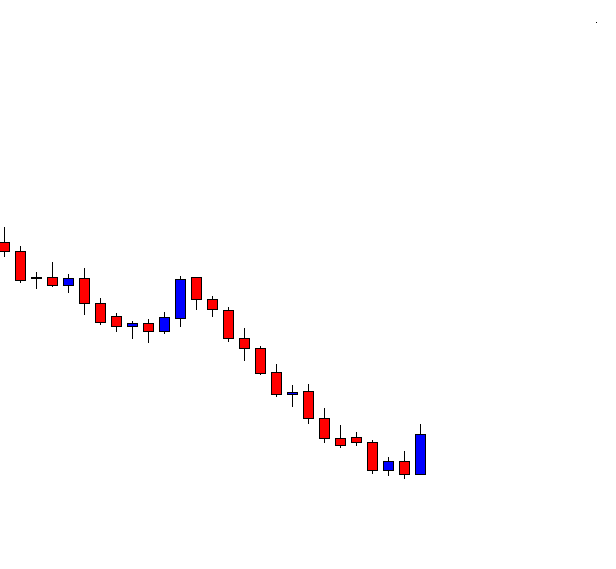
USD/CAD | Before Announcement – 7th February

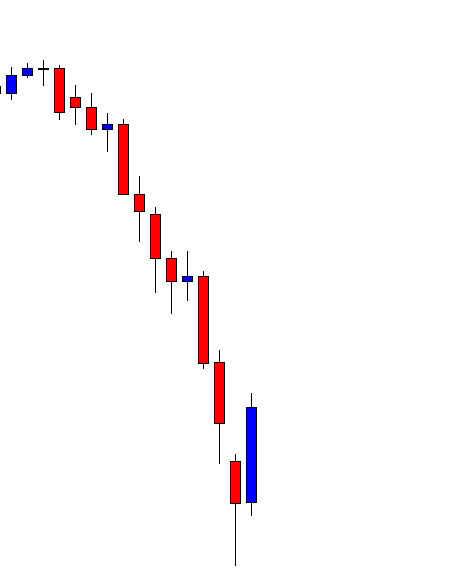
Below is the candlestick chart of USD/CAD on the 15min timeframe. If we were to look at the recent trend, we could see that the market is in an uptrend. Now, we need to see if the trend continues after the release of the news or reverses its direction.

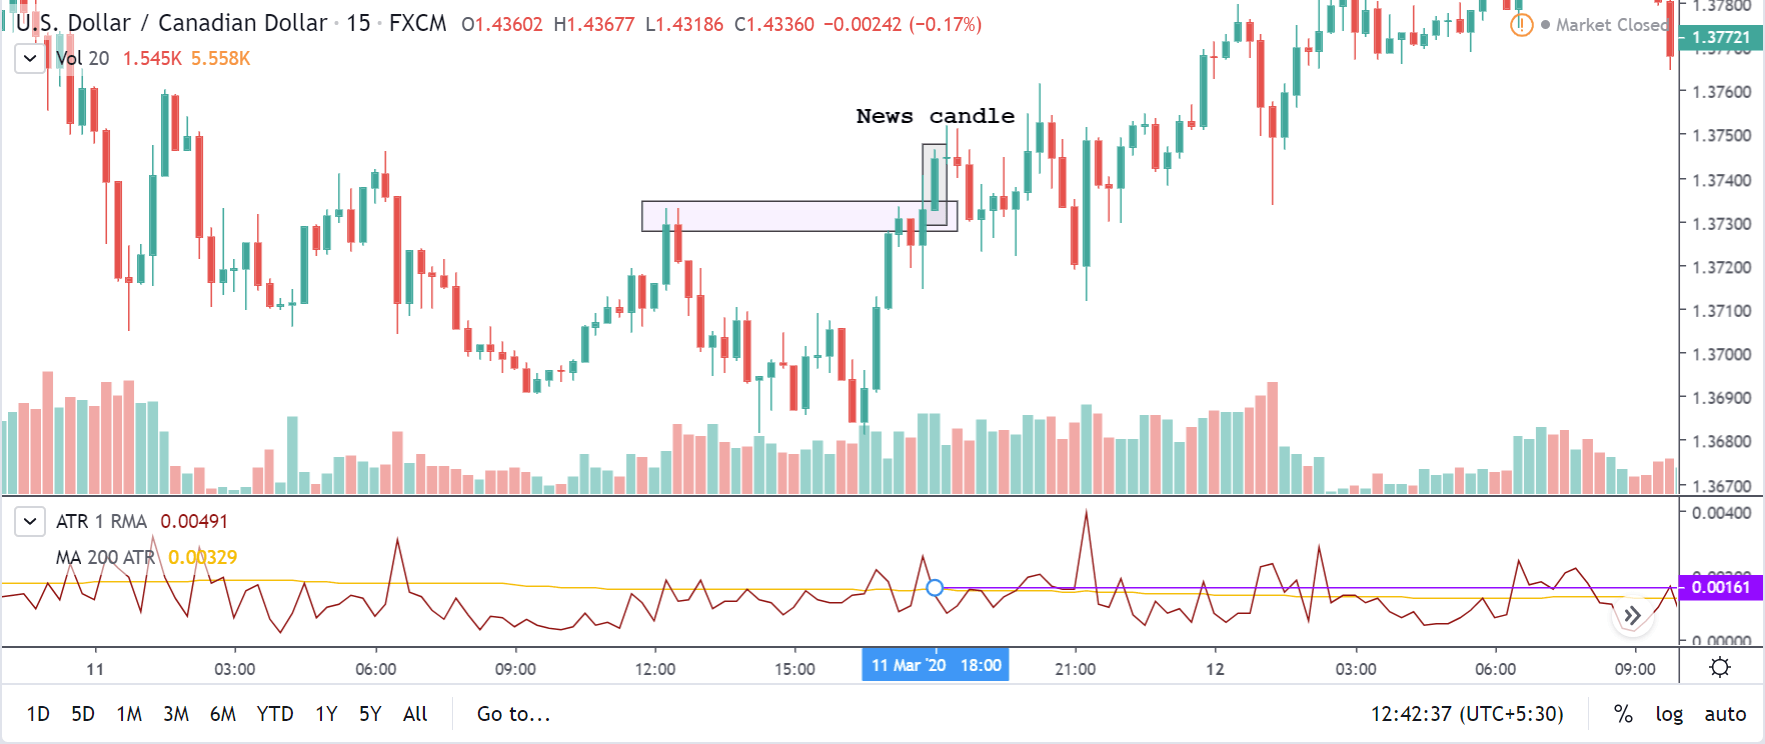
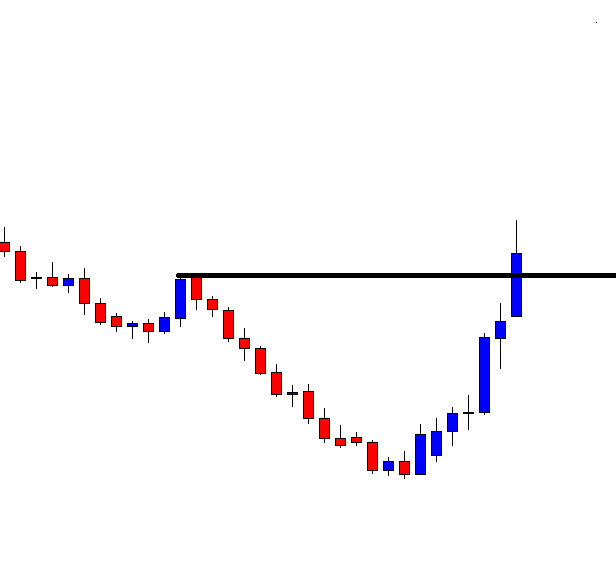
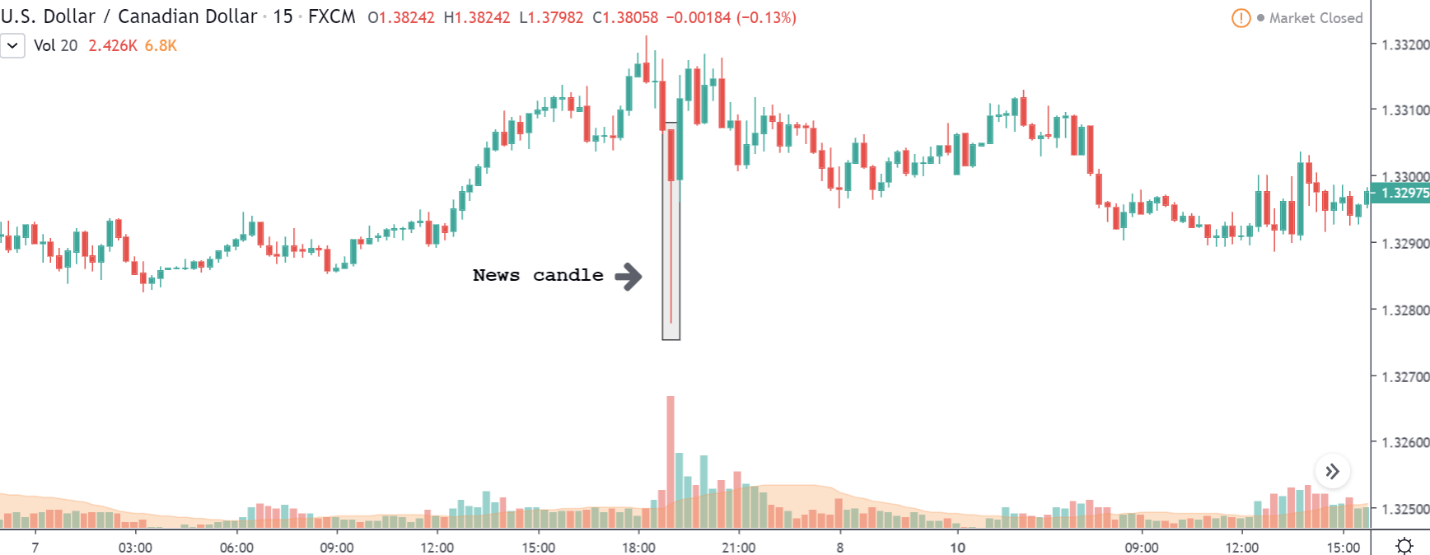
USD/CAD | After Announcement – 7th February

Below is the candlestick chart of USD/CAD on the 15min timeframe after the release of the news. The news candle is indicated as shown. We can see that when the news was released, the market just plunged down. Here, we can infer that the market moved as the way we expected it to move. Also, the volatility surged up when the news came out. If you look at the volume indicator as well, we can see that the volume shot up high.

However, in hindsight, the market recovered from the drop and left a wick on the bottom. With this, we can conclude that the drop in price was consumed by the strong buyers. The buyers did not let sellers reverse the market.

EUR/USD | Before Announcement – 7th February

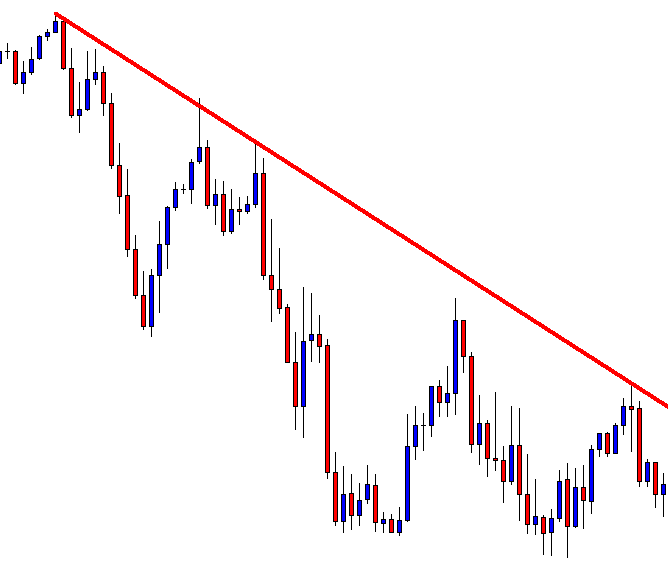
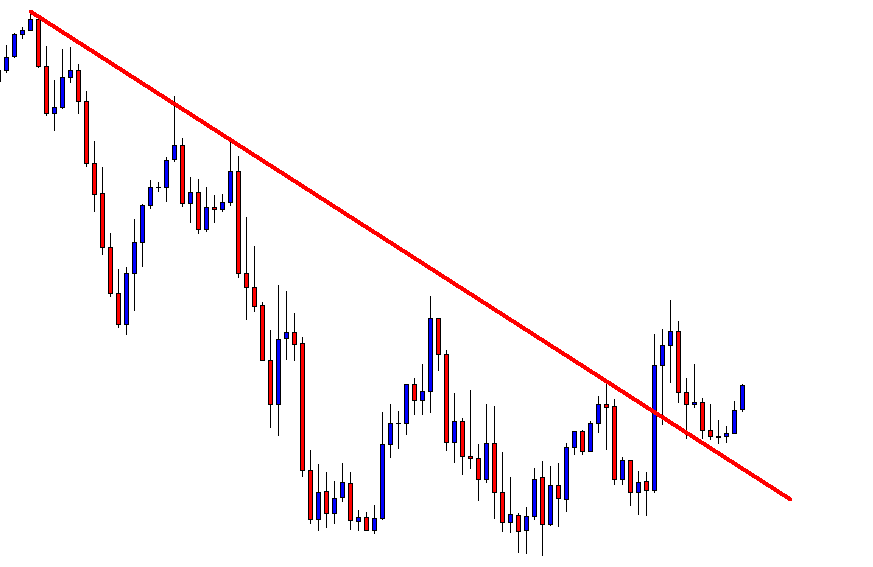
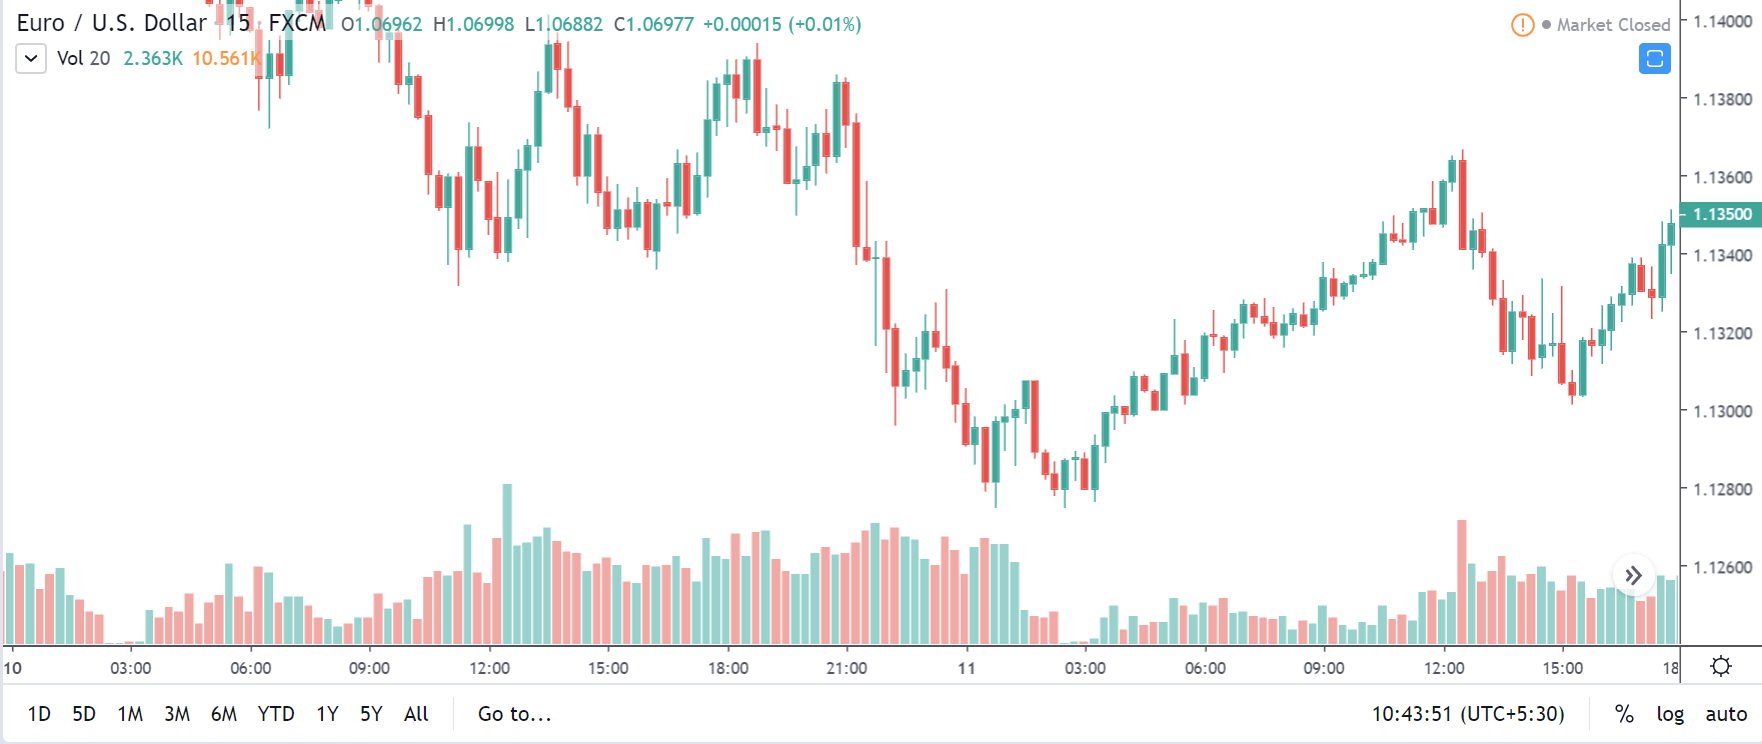
In the below chart of EUR/USD, we can see that the market is in a downtrend, where the purple line represents the support and resistance line. Currently, before the release of the news, the market is in the S&R area. We need to see how the market will react after the news.

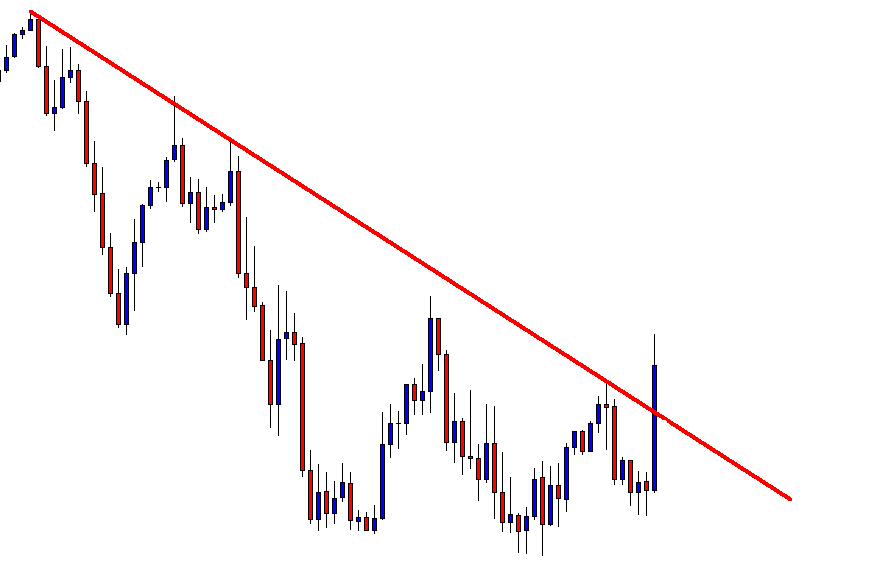
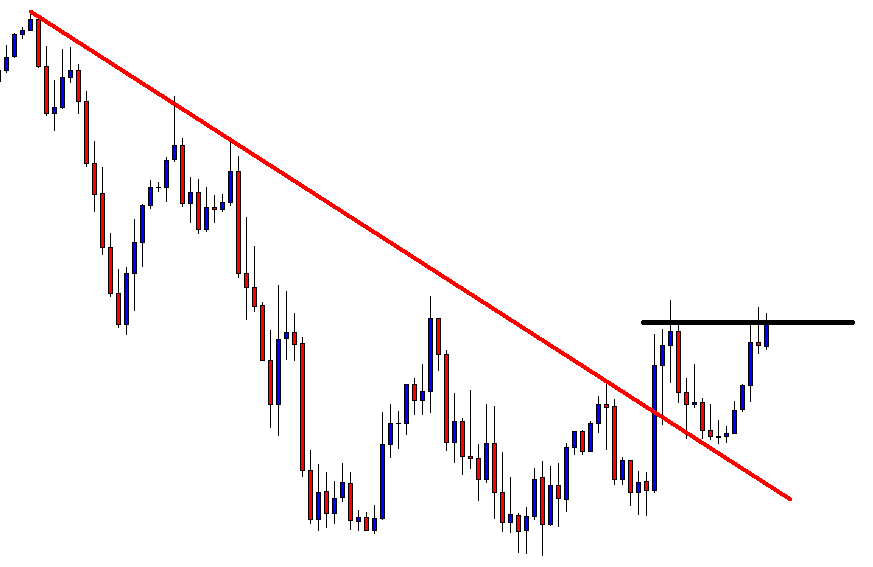
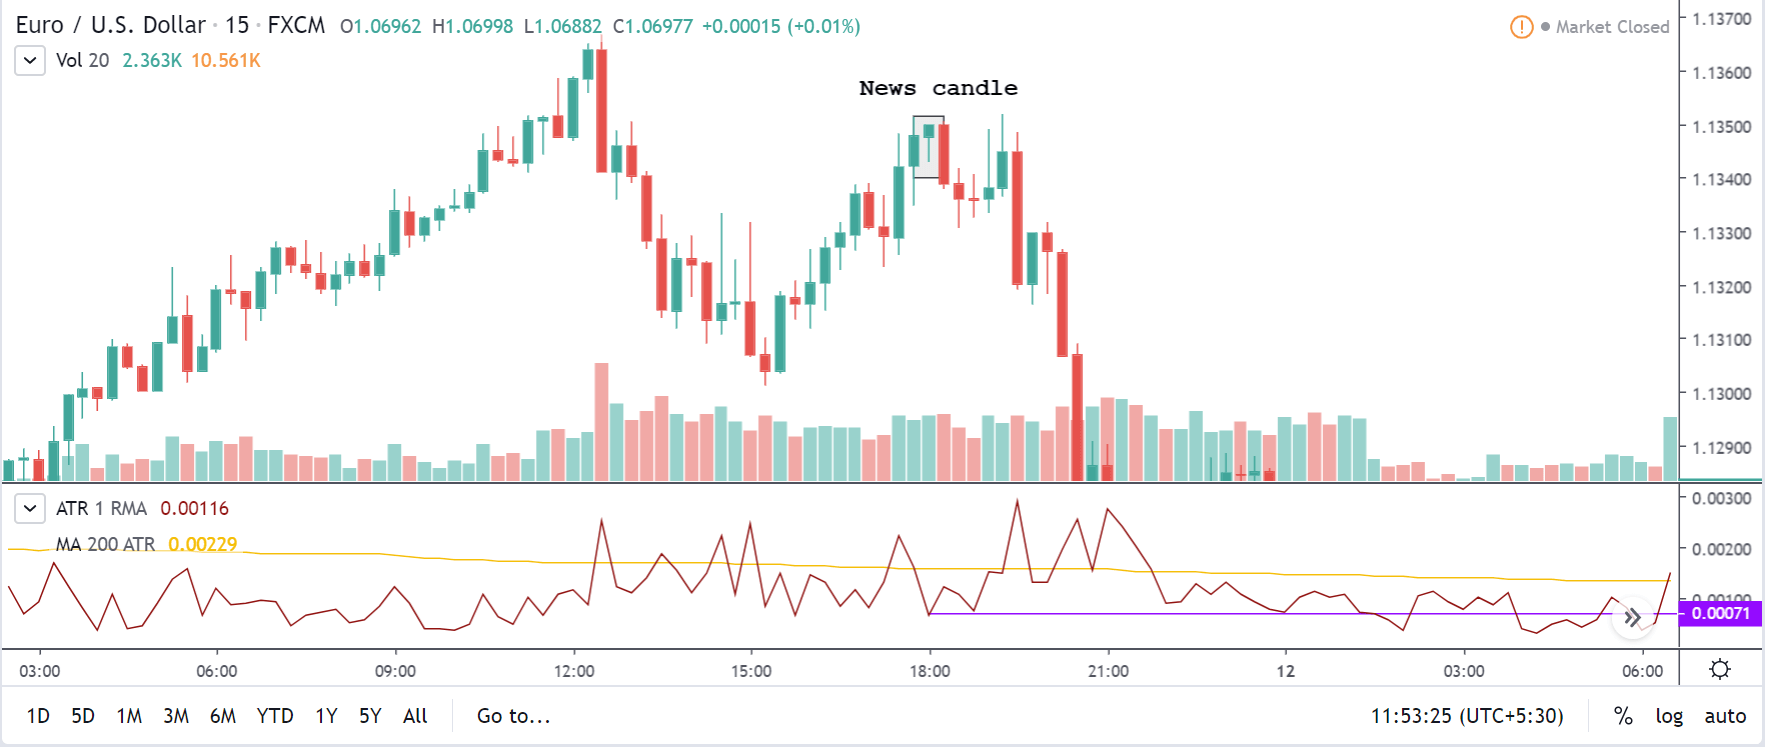
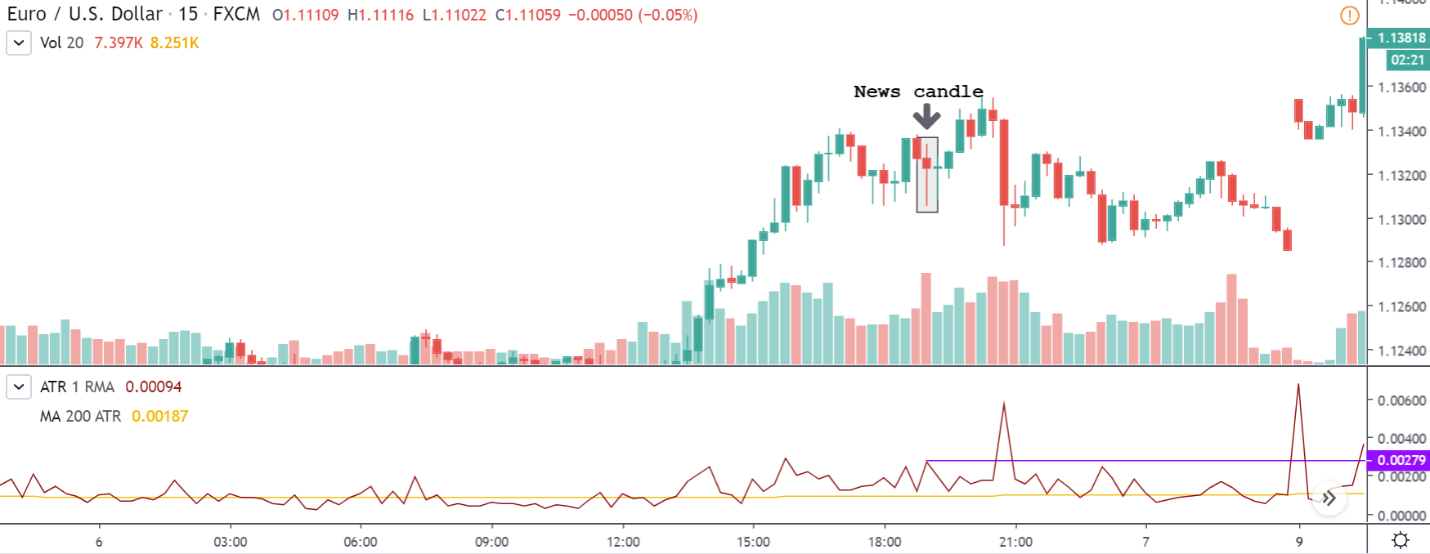
EUR/USD | After Announcement – 7th February

When the news was announced, we can see that the market went up, came down, and closed below the open price. There was strength from both sides, and the volatility was pretty high. If you look at the volume bar corresponding to the news candle, we can see that the volume too was high at that point in time.

In this currency pair, EUR is the base currency, and USD is the quote currency. According to the impact of the news, the market was supposed to shoot up. The market did try to go higher but got rejected by the sellers. So, basically, the seller’s market was more dominated than the news in this case.

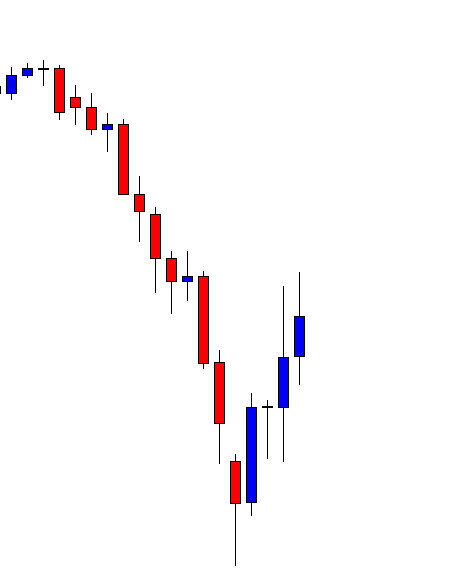
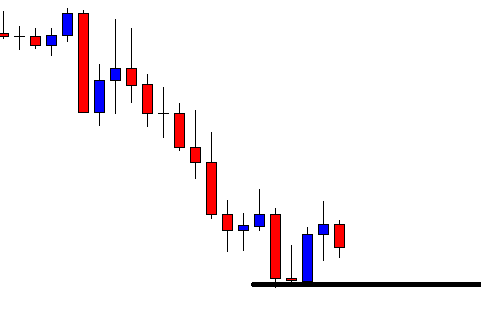
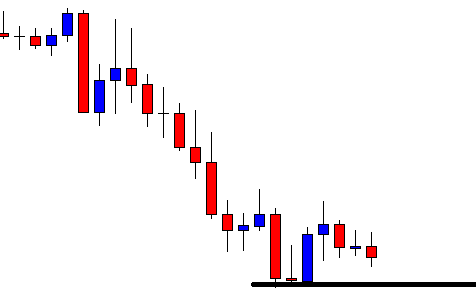
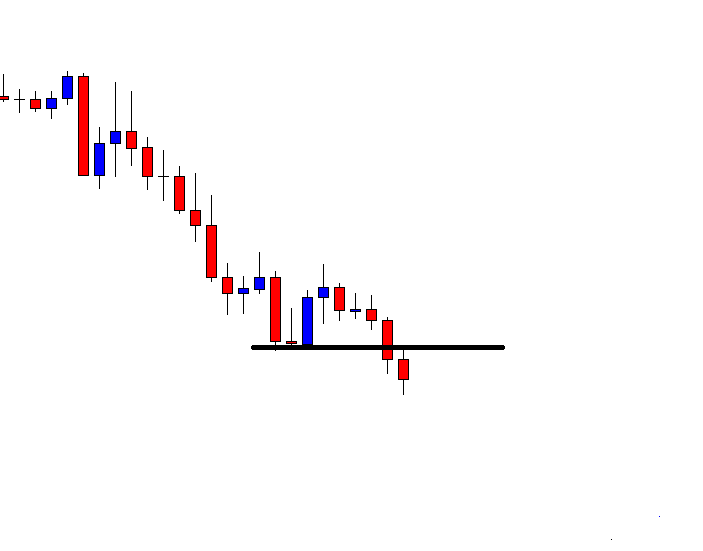
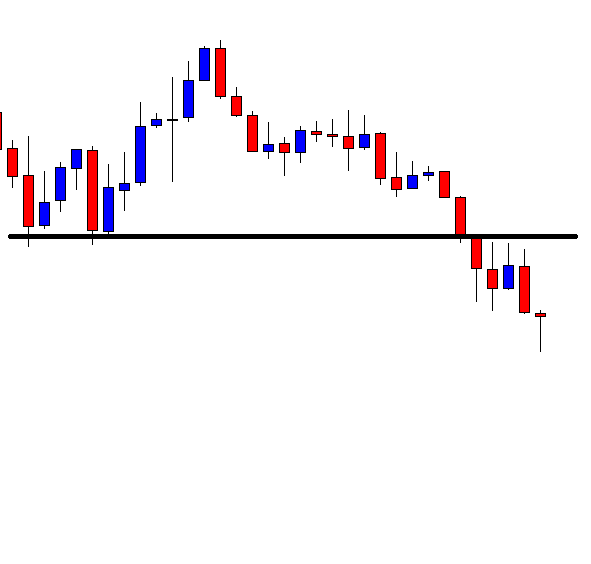
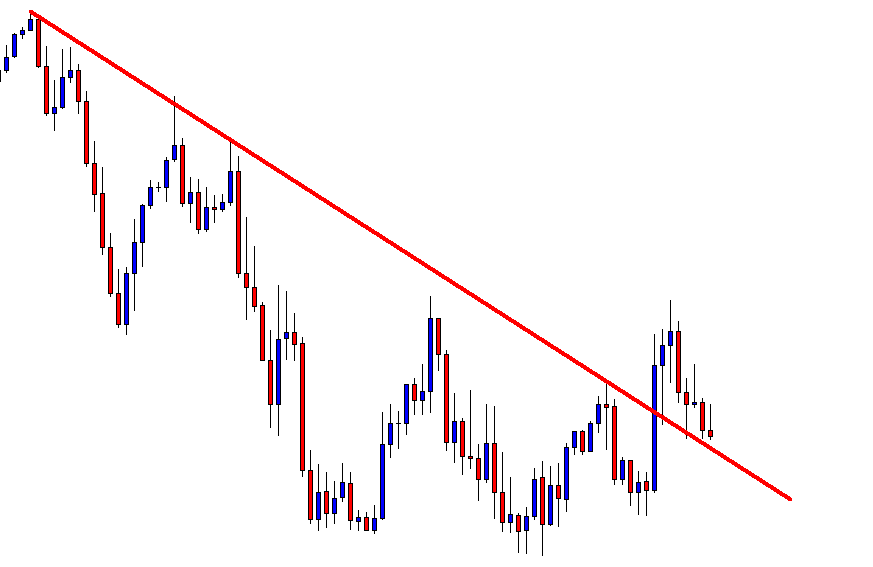
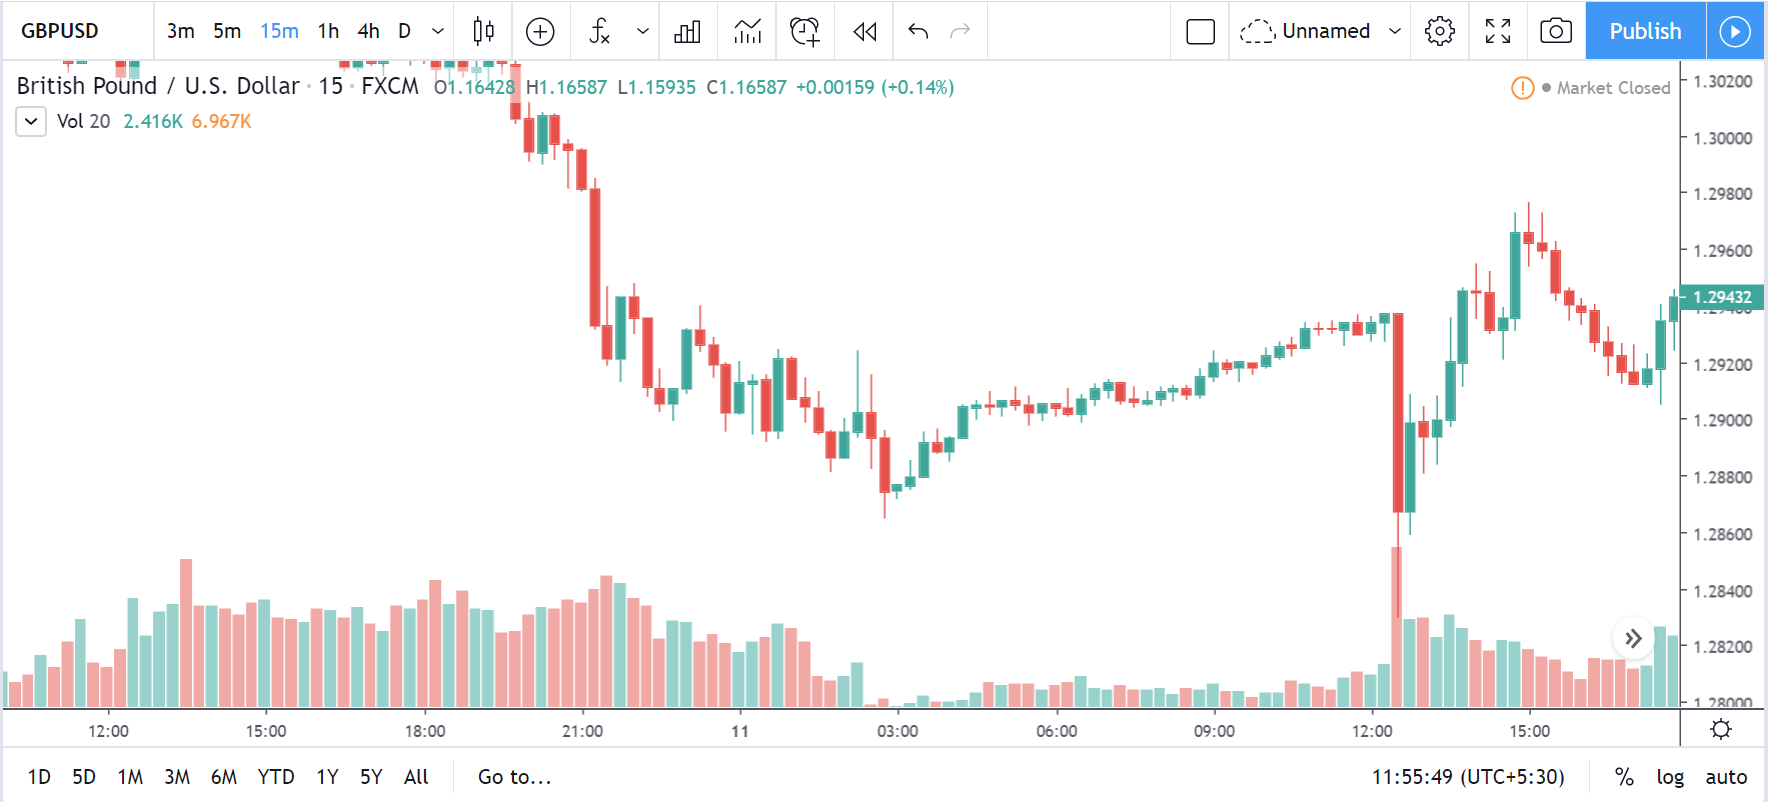
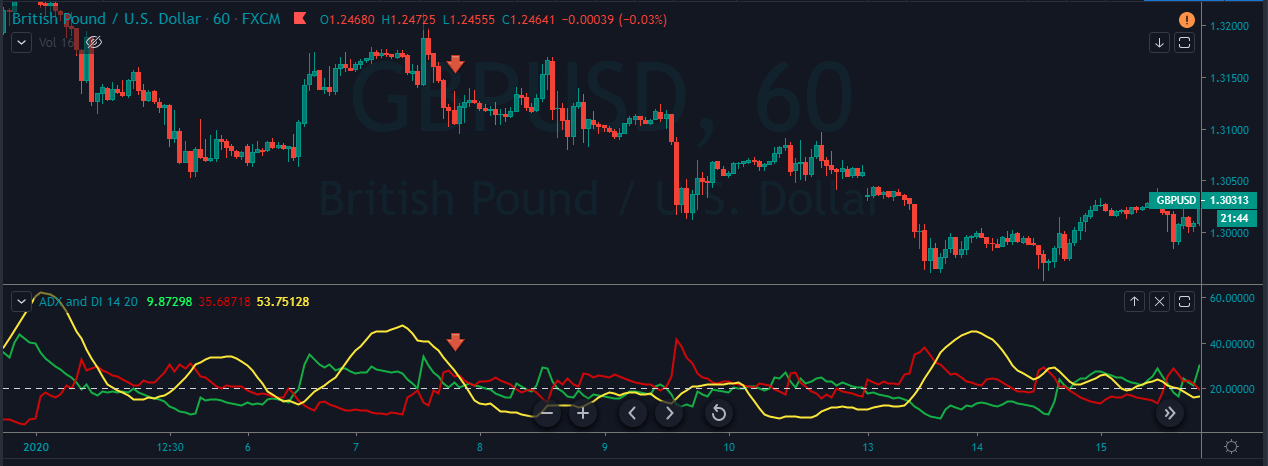
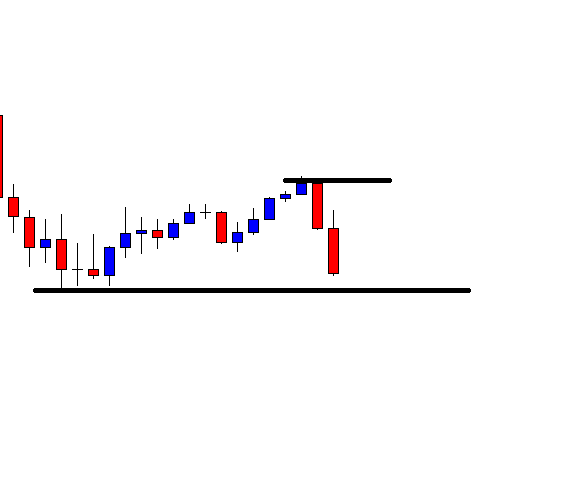
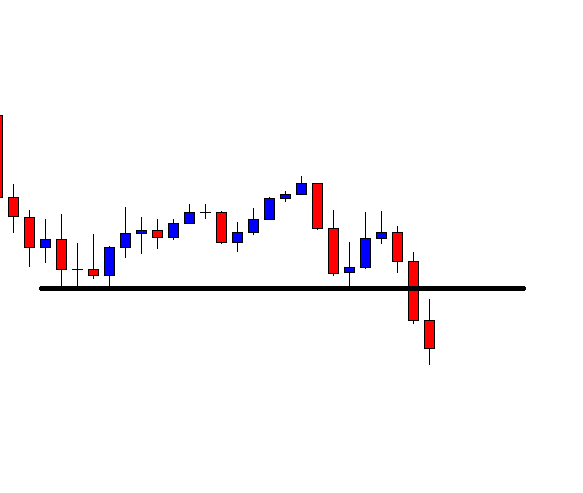
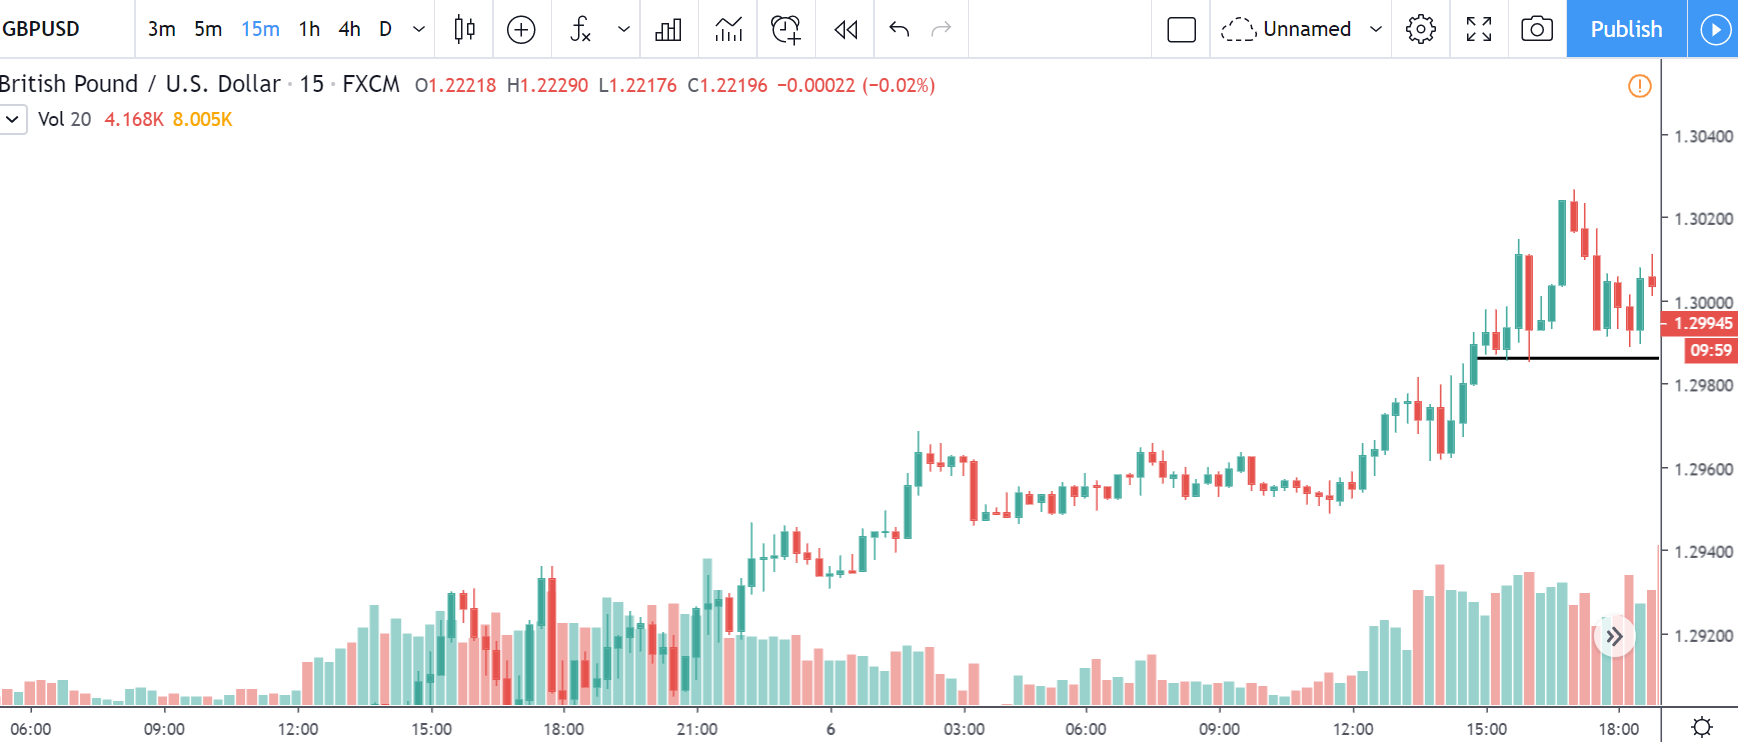
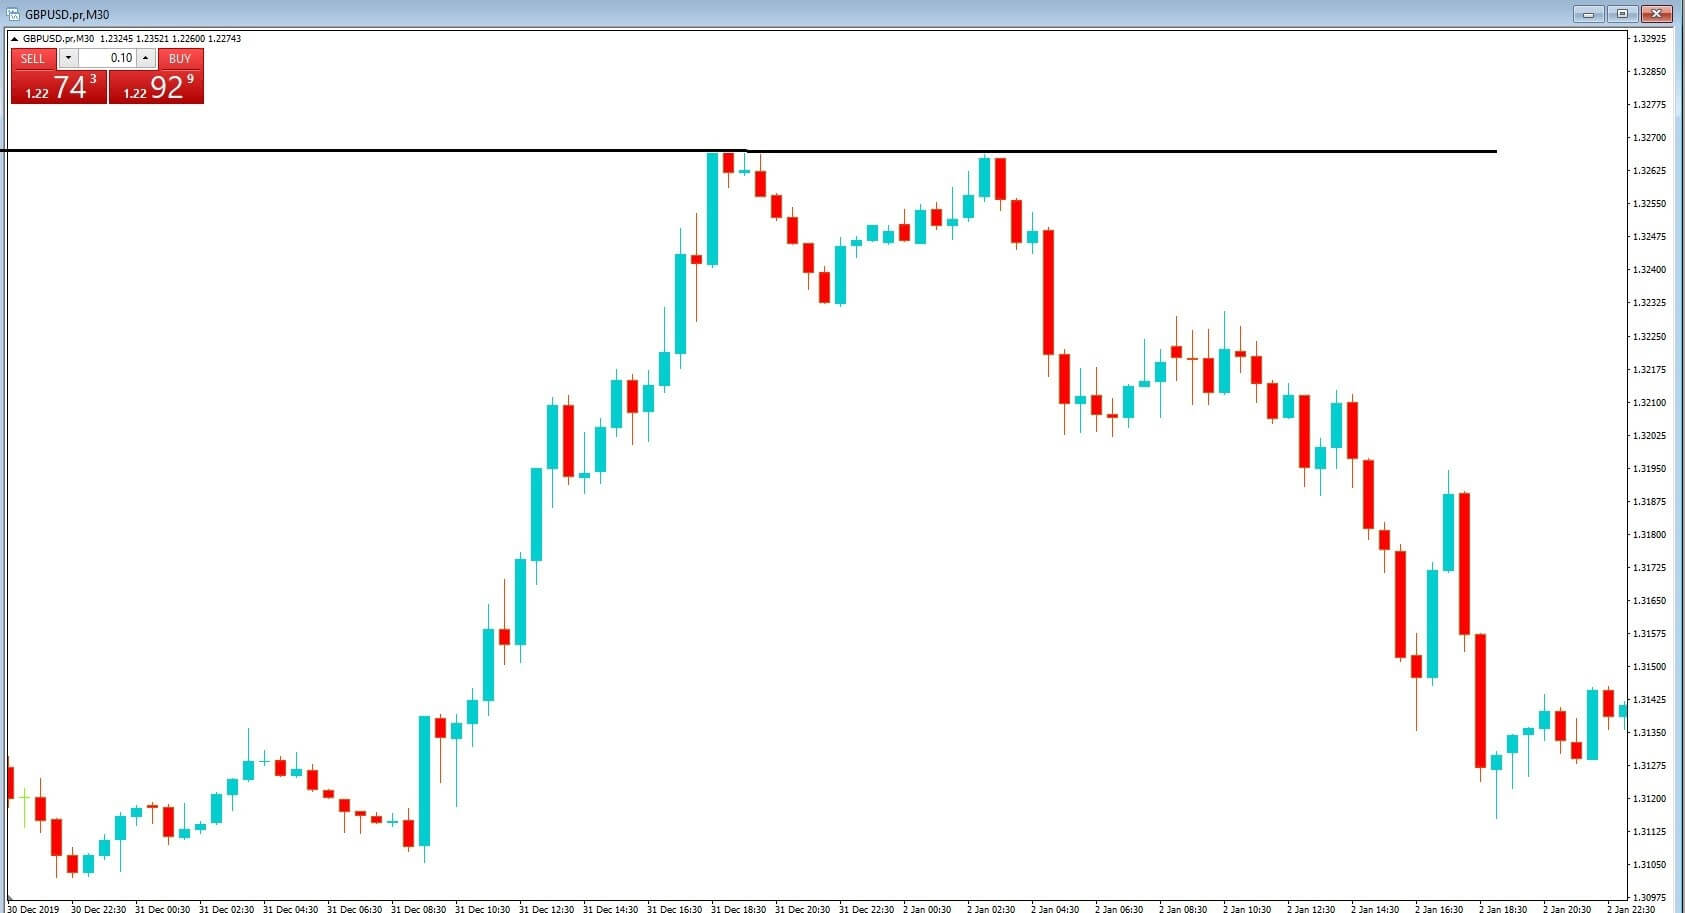
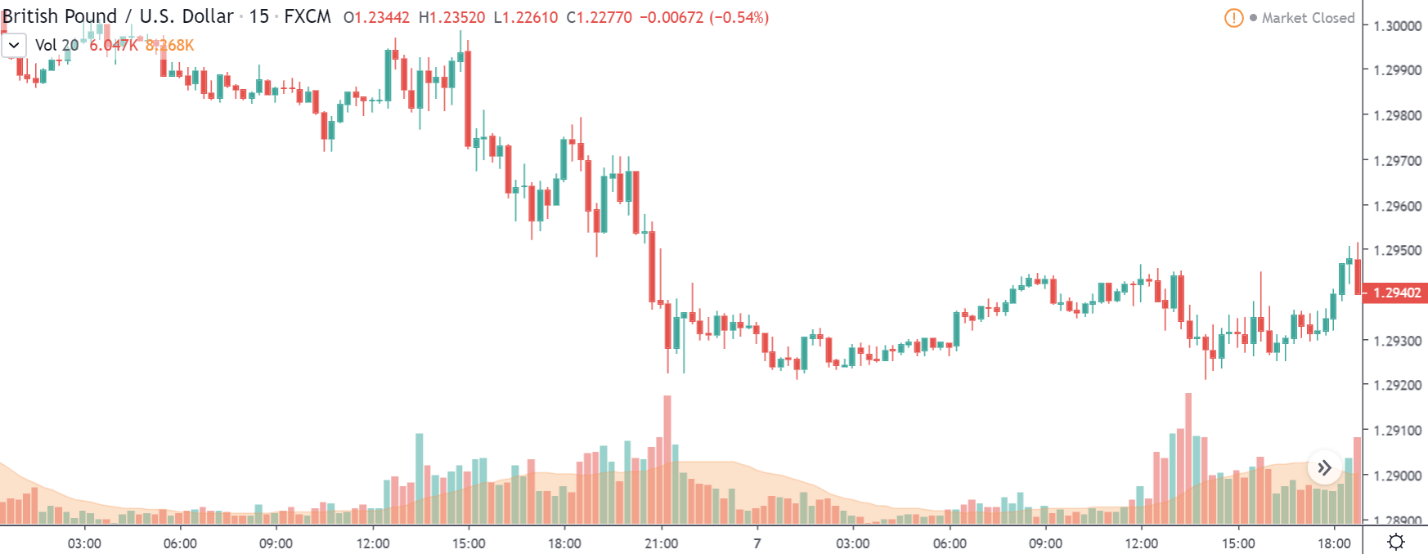
 GBP/USD | Before Announcement – 7th February

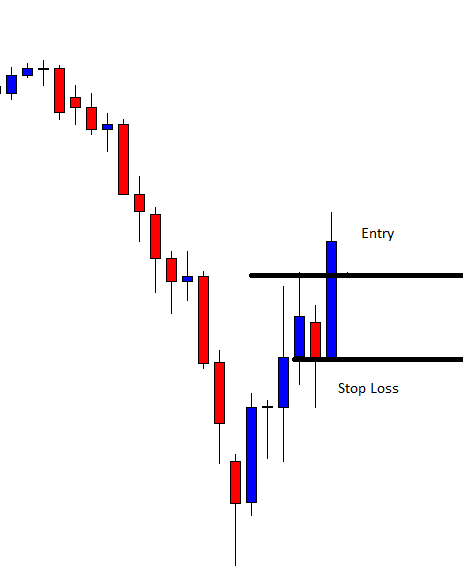
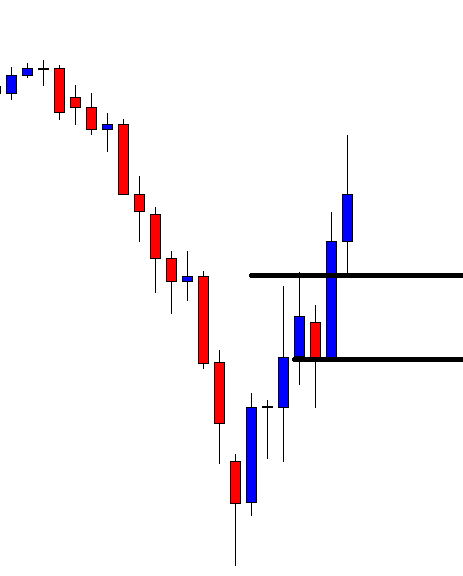
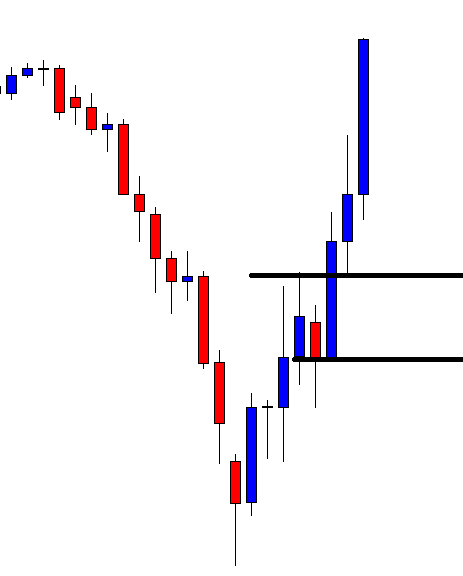
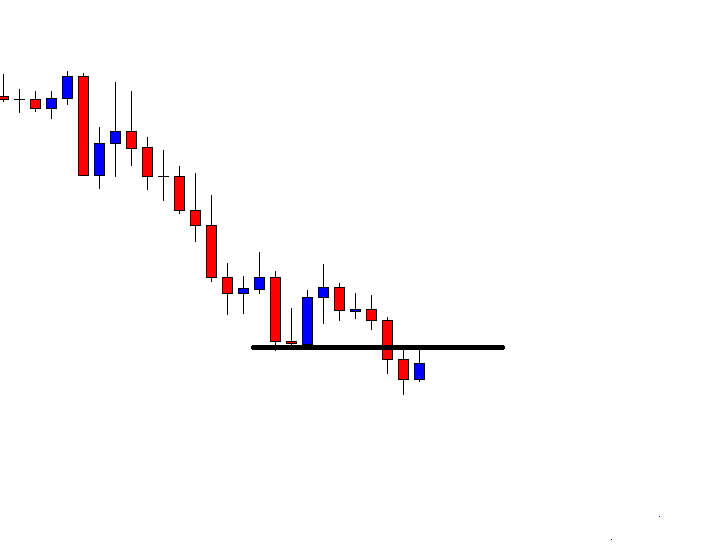
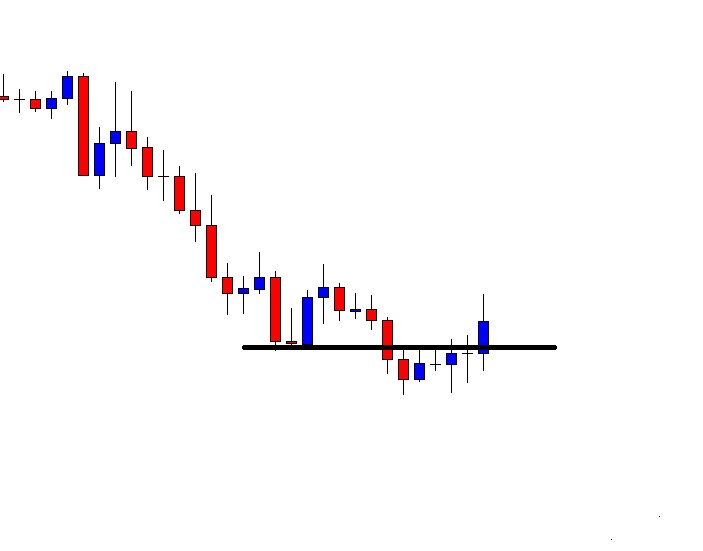
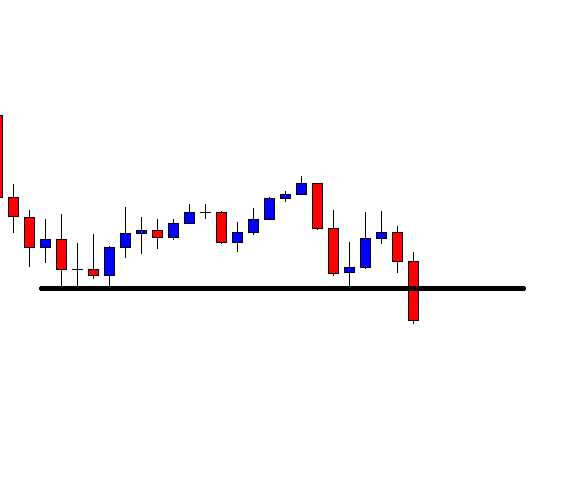
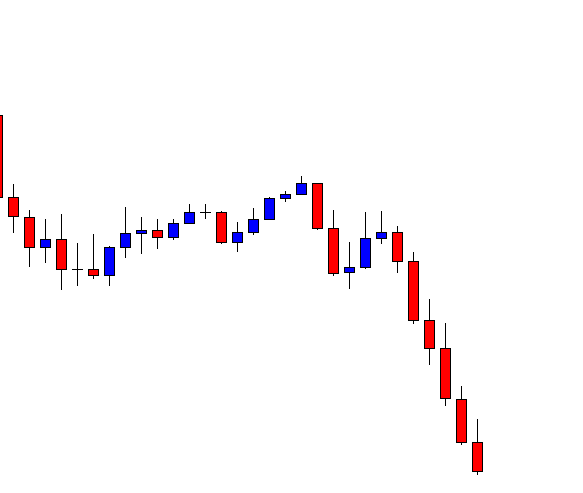
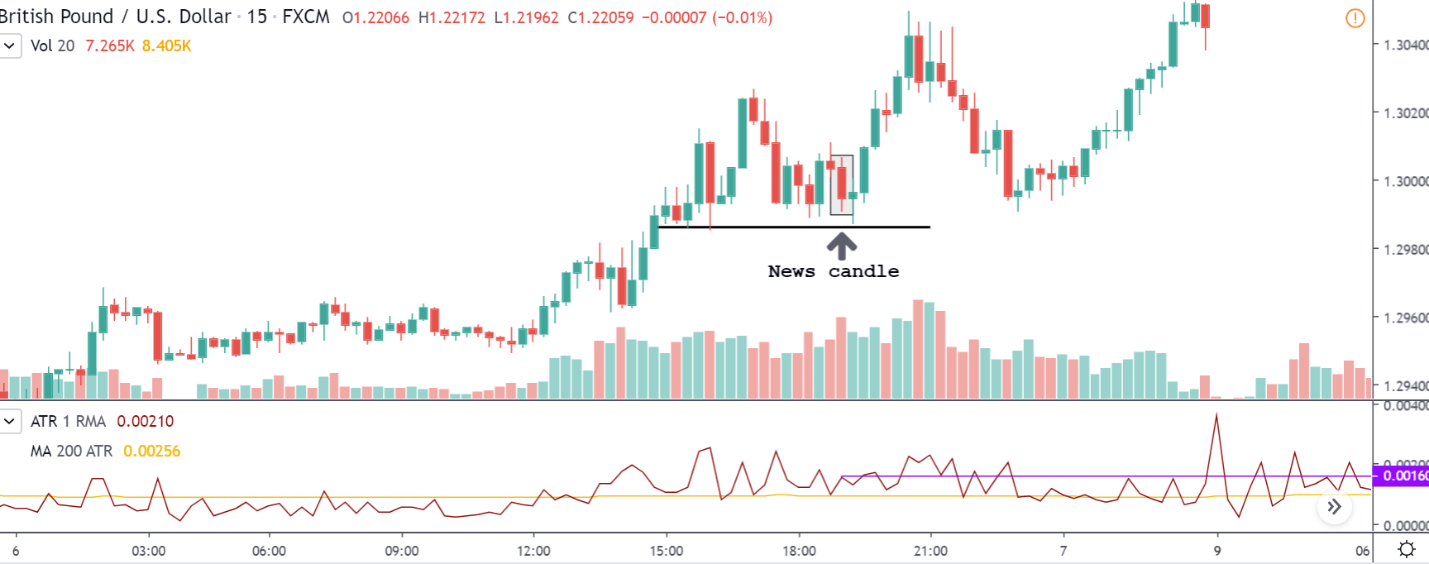
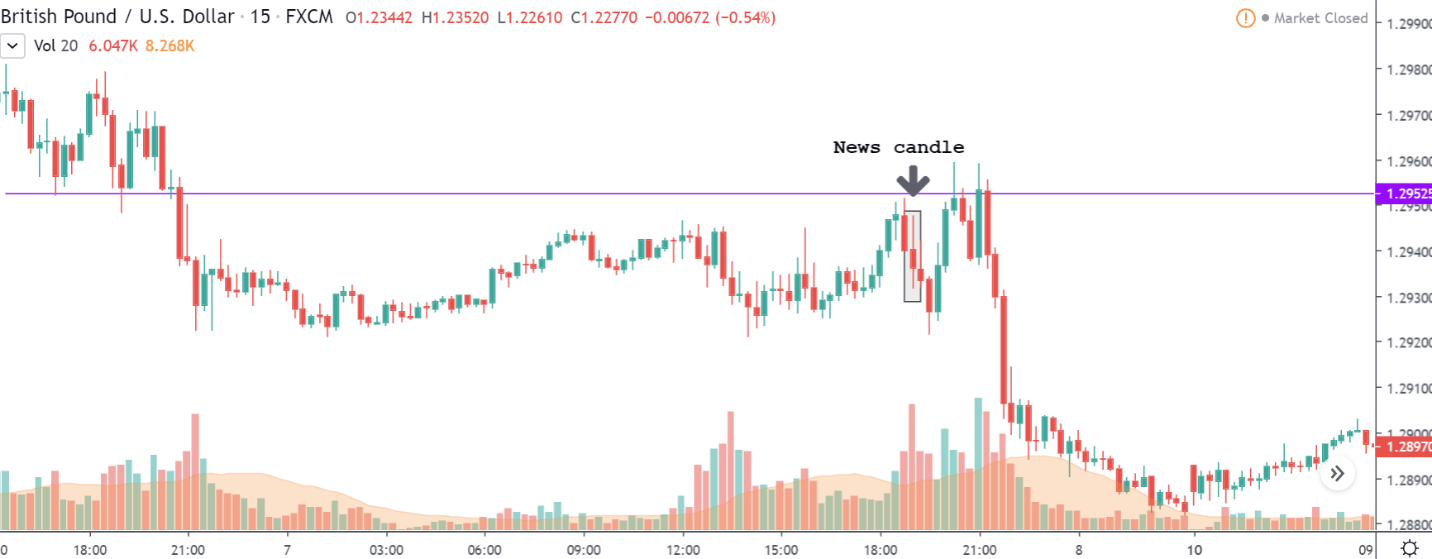
GBP/USD | After Announcement – 7th February

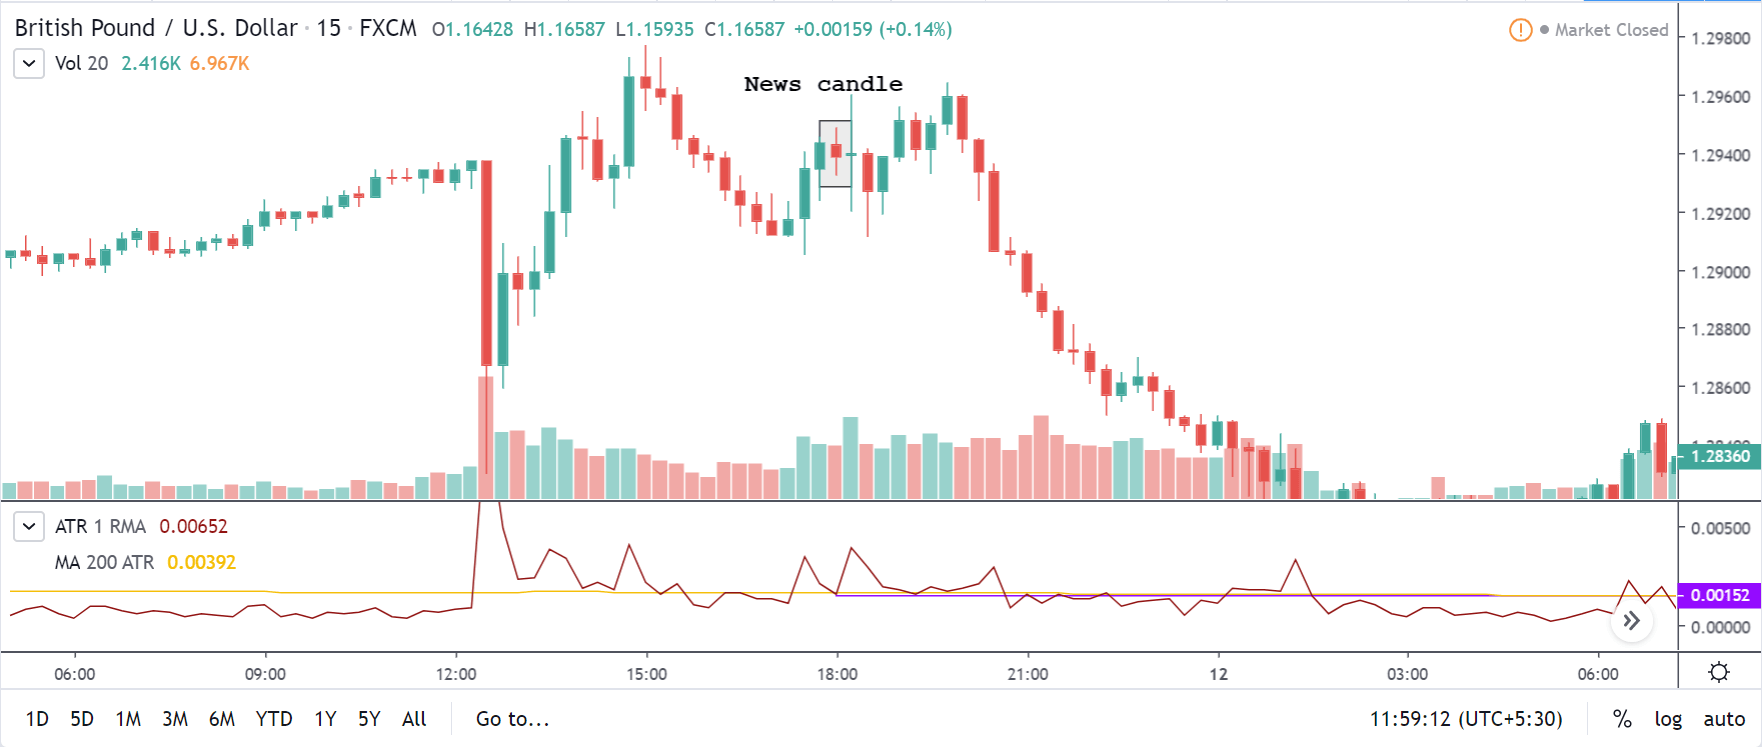
Below is the chart of GBP/USD on the 15min timeframes after the release of the news. We can see that this chart is very similar to the EUR/USD chart. The news candle initially shot up, but came down and closed red. The volatility during this time was quite high, which can be inferred from the corresponding volume bar below. And according to the news, the market was supposed to go north, but the market continued its downtrend.

Bottom line

The unemployment rate, though a lagging indicator, should not be taken for granted. It is as vital as the other economic indicators such as GDP, inflation rate, interest rate, etc. Employment is one of the primary reasons for the economies do well. Economies with high unemployment rates are being hit hard. Coming to the investors’ and traders’ point of view, one must keep an eye on the rate of this indicator and treat it as a powerful confirmation tool rather than just a lagging indicator.

Categories
Forex Course

86. Learning To Trade Using The Dependable ‘Stochastic Oscillator’

Introduction

Stochastic is a momentum indicator that was developed in the late 1950s by ‘George Lane.’ This indicator does not follow the volume or price of the underlying instrument; instead, it measures the speed and momentum of the price action. As a result, the indicator changes its direction before the price itself. This makes the Stochastic a leading indicator in the market.
We can change the sensitivity of this indicator to the market movement by adjusting the settings. Stochastic is a bounded indicator which oscillates between the 0 to 100 level. When the indicator reaches the 70-level, it indicates the overbought markets, and when it goes below the 30-level, we can assume that the market is in an oversold condition. The bullish and bearish divergences on the Stochastic indicator help us in anticipating the upcoming price reversals.

Trading Strategies Using The Stochastic Oscillator

Oversold & Oversold Areas

This is the basic yet powerful Stochastic strategy that is widely used by most of the traders. The idea is to go long when the indicator reverses at the oversold area and go short when it reverses at the overbought area. Let’s understand this with an example.

The image below is an NZD/CAD Forex price chart. It represents two buying and one selling opportunity in an uptrend. These trades are solely taken based on the strategy that we discussed above.

We have placed the stop-loss just below the recent candle and close our position when the market gave an opposite signal. The market circumstances don’t matter as this indicator can be used in any situation. The crucial thing is to follow the rules of the indicator very well.

If the indicator generates a buy signal, only take buy entries, and when it says sell, only consider selling opportunities. If we are in a buy trade and if the indicator represents a sell trade, that is the time to close our position. Never be rigid and ignore the indicator signals to hold the position for extended targets. If that happens, we will be on the losing side.

Stochastic Indicator + Bollinger Bands

Bollinger band is a leading indicator, and it consists of two bands, which are above and below the price action. This indicator also has the centerline, which is a Moving Average. The bands of the indicator expand and contracts according to market volatility. They expand if the volatility is more and contract when the volatility is less.

Buy Example

First of all, find an uptrend in any Forex pair. When the price action hits the lower Bollinger Band, see if the Stochastic indicates the oversold market condition. If it does, it means that the sellers now have a hard time to go lower and taking buy entries from here will be a good idea.

As you can see in the below image, the EUR/AUD was in an uptrend. During the pullback phase, the Stochastic reaches the oversold area, and the price action hits the lower Bollinger Band. This is an indication to go long in this pair. As we have activated our trade, the price action blasts to the north. We can close our position when the Stochastic indicator reaches the overbought area. If you want to ride longer moves in the trending market, exit your position at the major resistance area.

Sell Example

First of all, find a downtrend in any Forex pair. When the price action hits the upper Bollinger Band, see if the Stochastic is indicating overbought market conditions. If it does, it means that the buyers now have a hard time to go higher and taking sell entries from here will be a good idea.

The image below is the EUR/CHF Forex pair, and the pair was in an overall downtrend. During the pullback phase, the price action turned sideways. But when the price action hits the upper Bollinger Band and the Stochastic indicator reverses at the overbought area, it is a sign to go short in this pair.

We can place the stop-loss just above the upper Bollinger band, and the take-profit must be at the higher timeframe’s support area. If you are an intraday trader, close your positions when both the indicators give an opposite signal.

That’s about Stochastic indicator and related trading strategies. If you have any doubts, let us know in the comments below. Cheers.

[wp_quiz id=”67442″]
Categories
Forex Daily Topic Forex Price-Action Strategies

Keeping an Eye on Some Levels Comes Handy

Forex price action trading requires a clearer chart. Traders are to keep an eye on candlesticks’ attributes, consolidation, reversal candle, and support/resistance levels. The last swing high and the last swing low are two levels that traders must count. However, the price often reacts to certain levels, where it reacts heavily earlier. We may keep an eye on those closely since they often offer entries. In today’s lesson, we are going to demonstrate an example of that.

The chart produces a bullish engulfing candle after being bearish for a long time. The buyers still hold the key. However, the sellers may keep start eyeing on the pair as well. The chart shows a pullback level in its bearish wave. The highest high is further up, though. Thus, if the price makes a bullish move from here, it would be a big one.

The price heads towards the North with good bullish momentum. The buyers are to wait for the price to consolidate and produce a bullish signal candle to go long on the pair. A level of resistance (drawn level) is nearby. The price may consolidate around the level. Thus, this is time for the buyers to keep an eye in the pair closely.

The price does not consolidate around the level of resistance, but it makes a breakout.  Some traders may think that they have wasted time here by keeping an eye on the pair, which is never right. In Forex trading, we need to invest money and time. After such a breakout, the price usually keeps going towards the trend’s direction for one or two more candles before having consolidation. Do not forget, it often consolidates around the breakout level and offers entry.

The chart produces one more bullish candle followed by a bearish candle. The last candle closes within the breakout level. This means the price is having consolidation around the breakout level. If the chart produces a bullish engulfing candle closing consolidation resistance, the buyers are going to push the price towards the North.

The buyers crave for getting such a good–looking bullish candle to go long from here. The equation is simple here. The buyers may trigger a long entry right after the candle closes. Let us find out how the entry goes.

The price heads towards the North with good bullish momentum. The buyers achieve their 1R easily here. The highest high is further up. Thus, it may remain bullish for some more candles.

The price may consolidate and offer entry at any level when it is trending. However, it tends to consolidate around some particular levels often. By spotting them out, we may make our trading life a bit easier.

Categories
Forex Elliott Wave

Corrective Waves Analysis – Intermediate Level – Part 1

Corrective waves are formations produced between two impulsive movements. In this educational article, we’ll see the standard corrective patterns defined by R.N. Elliott.

The Basic Structure

R.N. Elliott, in his treatise, defined corrections as a movement that develops against the trend built by motive waves.

Corrective formations characterize themselves by having three internal segments. Its analysis process tends to be more difficult than on motive waves, due to different variations that can arise while the movement is in progress.

However, the corrective structure will be clear once the formation completes its internal sequence. In this context, the wave analyst has to be patient as the price action advances.

Rules Construction

In simple words, if price action doesn’t endorse the rules of an impulsive wave, as commented in our previous articles (read more), then the market advances in a corrective structure.

The basic, or standard, corrective patterns defined by Elliott are as follows:

  • Flat (3-3-5)
  • Zigzag (5-3-5)
  • Triangle (3-3-3-3-3)

Similarly as the alternations on impulsive waves, corrective waves also alternate in terms of price and time.

Price: This kind of alternation applies only to the zigzag pattern. Wave A will alternate with B in terms of price; wave B will be a 61.8% or lower than the wave A length.

Time: The alternation in terms of time acquires more relevance. In particular, if the first segment elapses a specific length of time, the second leg will advance in a related 61.8% or 161.8% of the time spent by wave A.

Finally, the third segment will last similar to one of the previous sections or be 61.8 or 161.8% span of one of the two earlier waves.

Flat Pattern

The flat pattern is characterized by having an internal subdivision that follows a 3-3-5 sequence. The next figure shows its structure.

Likely, its most important characteristic is that among the standard corrective formations, this pattern has the broadest kind of variations.

The construction process and its basic rules are as follows:

Once price completes its first movement against the trend, and its form holds an internal three-segment subdivision, the recovery developed by the next sequence has to be, also formed by three internal waves that advance at least 61.8% of the first decline.
Finally, the price progression of the C wave must be over 38.2% greater than wave A.

The flat pattern has several variations defined in terms of the strength of its wave B, wave C, or both.

To understand what type of flat formation and its depth the market is developing, we should trace two parallel horizontal lines from the A wave extremes. Thus, based on the obtained evidence, we can conclude that:

  1. If wave B moves between 61.8% and 81%, the flat pattern develops a weak wave B. In this case, the wave C should be at least 61.8% of wave B.
  2. If wave B moves between 81% and 100%, then the flat pattern advances in a normal wave B. In this scenario, there are two options for wave C, the failure, and the extended wave C.
  3. Finally, if wave B extends over 100% to 127.2% of the A wave, then we are in the presence of a strong wave B. In this case, waves A and C should be similar in terms of price.

The U.S. Dollar Index and its Flat Pattern

The U.S. Dollar Index (DXY), in its 2-hour chart, shows the progression that price developed in five waves from June 25th, 2019 low at 95.84.

The five-wave sequence identified in green was completed on July 09th at 97.59, from where the Greenback began to retrace in three waves. The figure reveals that after having completed the first decline identified as wave “a” in green, DXY bounced slightly over 81% of wave a, which makes us conclude that the U.S. Dollar index runs in a potential normal flat pattern.

The next decline corresponds to wave c; the figure shows that once pierced slightly below the end of wave a, the price found fresh buyers at 96.67 completing the three-wave sequence of the flat pattern.

Conclusions.

In this educational article, we review the concepts of corrective waves and its rules of construction. Similarly, we presented how corrective waves alternate in terms of price and time. These new concepts of alternation add to the definitions given in our basic level article on corrective waves.

On the other hand, we presented the flat pattern that the Dollar Index has recently developed and how this formation did not achieve the Fibonacci levels as stated by Gleen Neely in his work “Mastering Elliott Wave.”

In the next article, we will present the zigzag pattern and its analysis process.

Suggested Readings

  • Neely, G.; Mastering Elliott Wave: Presenting the Neely Method; Windsor Books; 2nd Edition (1990).
  • Prechter, R.; The Major Works of R. N. Elliott; New Classics Library; 2nd Edition (1990).
Categories
Forex Market Analysis

Daily F.X. Analysis, March 23 – Top Trade Setups In Forex – Fundamentals Side Remains Light! 

During Asian trading hours Monday, the ICE U.S. Dollar Index regained strength at 102.81, while U.S. stock futures hit daily downside limits. Federal Reserve Bank of St. Louis President James Bullard said U.S. jobless rate might soar to 30% in the second quarter, and the Fed can provide more support if necessary.

Later in the day, the European Commission will release the eurozone’s March Consumer Confidence Index (-14.0 expected). In the U.S., the Federal Reserve Bank of Chicago will post February National Activity Index (-0.29 expected).

Economic Events to Watch Today    


EUR/USD – Daily Analysis

This morning, EUR/USD fell 0.2% to 1.0673, following a 0.4% gain on Friday. Later today, the eurozone’s March Consumer Confidence Index (-14.0 expected) will be released. The German IFO Business Climate Index dropped to 87.7 in March (88.0 expected) from 96.0 in February.

Moving on, the greenback may come under pressure and may allow EUR/USD to extend the recovery seen in the Asian session if the risk market further recovers in the European trading hour ahead. After the announcement of stimulus, the ECB President Christine Lagarde showed a willingness to use all essential tools to stop the negative impacts of the deadly virus. 

Moving on, the EUR/USD pair may cross the strong resistance level if the risk-off market sentiment gets more worsens ahead. Eventually, it will likely fuel deeper losses in the greenback and may increase demand for the common currency.

The economic calendar is light today with the German Bundesbank’s monthly report is scheduled to release during the European trading session. Therefore, the traders may also take cues from the Eurozone Consumer Confidence for March and the Chicago Fed National Activity Index for February for new directions.

Daily Support and Resistance

  • S1 1.0335
  • S2 1.0529
  • S3 1.0615

Pivot Point 1.0723

  • R1 1.0809
  • R2 1.0917
  • R3 1.1111

EUR/USD– Trading Tips

On Monday, the major currency pair EUR/USD traded bearishly as it as violated and closed below horizontal support becomes a resistance level of 1.0990. The EUR/USD is trading around 1.0750, and it’s forming a lower-lows pattern on the 4-hour chart, which mostly drives a continuation of a selling trend. 

Right now, the EUR/USD is trading at 1.0720, consolidating in a narrow trading range of 1.0817 – 1.0660. The EUR/USD is facing hurdles around 1.0817, and above this, the pair has the potential to target the next resistance level of 1.0930. 

While the EUR/USD has odds of staying bearish below 1.0920 to target 1.0805. On the daily chart, a violation of 1.0605 can extend the selling trend until 1.0550.


GBP/USD– Daily Analysis

The GBP/USD retreated 0.7% to 1.1557, after a 1.4% rally in the prior session. During the previous week, the Bank of England lowered its benchmark rate by 15 basis points to 0.10%. It announced that it would increase its holdings of U.K. government bonds and sterling non-financial investment-grade corporate bonds by GBP200 billion, to counter the economic shock caused by the coronavirus.

The GBP/USD pair slipped due to a stronger dollar after the U.S. official data showed that housing starts posted at an annualized rate of 1.599 million units in February (1.500 million units expected).

On the other hand, the U.S. Senate’s failure to pass the much-awaited COVID-19 Bill sent the Treasury yields and Asian stocks down. Apart from this, the conference by the G20 Finance Ministers may also offer some intermediate clues, and it will be key to watch. In contrast, the US Chicago Fed National Activity may also give some meaningful inspiration.

The PM’s Chief adviser Dominic Cummings faced criticism about supporting herd immunity. Therefore any progress in the story could also entertain the GBP/USD traders. 

Daily Support and Resistance

  • S1 1.0953
  • S2 1.1333
  • S3 1.1492

Pivot Point 1.1713

  • R1 1.1872
  • R2 1.2094
  • R3 1.2474

GBP/USD– Trading Tip

On Monday, the GBP/USD prices are consolidating in a broad trading range of 1.1400 – 1.1885. Yet, the trend of the market isn’t clear as investors are waiting for a solid fundamental to drive further movement in the market. On the higher side, the bullish breakout of the 1.1885 level can open the buying trend until the next resistance level of 1.2185 (38.2% Fibo level) and 1.2300 level, which markets 50% retracement while the pair has solid chances of bouncing off over 1.1450 level. A bearish breakout of 1.1425 level can lead the Cable towards the next support area of 1.1050. The MACD is tossing above and below zero as investors are unable to determine the trend of the market. 


USD/JPY – Daily Analysis

During the early Asian session, the USD/JPY currency pair flashing red and dropped below the 110 marks, representing 0.73% losses on the day mainly due to the U.S. Senate’s failure to pass the much-awaited COVID-19 Bill triggered the strong risk-off market sentiment. 

The Japanese yen is now finding bids as a safe-haven demand has sent the USD/JPY pair lower. The USD/JPY is trading at 110.08 right now, and it continues to consolidate in the range between the 109.67 – 111.260. However, the USD/JPY was initially trading near 111.25 on Friday, due to broad-based USD strength.

Despite positive signals from U.S. President Donald Trump, the Senate declined to pass the much-awaited incentive to control the deadly virus impact. This news initially sent the U.S. equity futures to the limit down.

The President of the Federal Reserve Bank of Minneapolis, Neel Kashkari, followed the role of St. Louis Federal Reserve President James Bullard, who expected the 2nd-quarter (Q2) GDP to decrease by 50% and the increase in Unemployment Rate to 30%. Meanwhile, the Minneapolis head mentioning that the Fed has unlimited cash to support the financial system. As a result, they are trying to support the U.S. dollar.

On the other hand, the coronavirus (COVID-19) fears continue to increase because numbers of the death toll from the U.S. and Italy rising day by day. The 36 cases reported in New Zealand, which is currently taking the market’s attention. Lastly, Japanese media signaled that the Asian countries might soon ban entries of U.S. travelers.

Daily Support and Resistance    

  • S1 105.08
  • S2 107.59
  • S3 109.24

Pivot Point 110.1

  • R1 111.75
  • R2 112.61
  • R3 115.13

USD/JPY – Trading Tips

On Monday, the USD/JPY pair has shown a slight bearish movement, falling from 110.65 level to 109.580. On the 4 hour chart, the USD/JPY has formed a bullish channel that is still intact, and it’s pretty much likely to support the USD/JPY prices around 109.650. 

A bearish breakout of 109.600 level can lead the USD/JPY prices towards the next support level of 108.350, and around this level, we can expect USD/JPY to bounce off again. Conversely, the pair faces resistance around 111 and 112.190 today. Let’s stay bullish above 109.650 and bearish below the same level today. 

All the best for today!  

Categories
Crypto Market Analysis

Daily Crypto Review, Mar 23 – Bitcoin uncertainty amid worldwide COVID-19 economy shutdown

The cryptocurrency market spent the weekend falling down, possibly indicating a further drop towards the lows of the end of 2018/start of 2019. Bitcoin is currently trading for $5,922, which represents a decrease of 6.28% on the day. Meanwhile, Ethereum lost 7.21% on the day, while XRP lost 5.67%.

UNUS SED LEO took the position of today’s most prominent daily gainer, with gains of 1.62%. On the other side, Hedera Hashgraph lost 16.12% on the day, making it the most prominent daily loser.

Bitcoin’s dominance has increased over the weekend. Its value is now 65.98%, which represents a 0.55% difference to the upside when compared to Friday’s value.

The cryptocurrency market capitalization decreased over the weekend, with a current value of $166.74 billion. This value represents a decrease of $3.03 billion when compared to the value it had on Friday.

What happened in the past 24 hours

Catherine Coley, the CEO of the US branch of Binance, revealed that the coronavirus quarantine in Asia led to increased trade volumes. She announced this statistic during a Bloomberg interview, where she also talked about the increasing correlation between Bitcoin and the S&P 500.

On the subject of the increased correlation between Bitcoin and the S&P 500, Coley said that both the traditional markets as well as the cryptocurrency market are playing out a well-known long-term cycle.

Honorable mention

Tezos

The Tezos Foundation announced that they would settle a $25 million consolidated class-action lawsuit. This will settle more than two years of fighting in court. The foundation chose to settle due to the time and financial expenses that would keep piling up.

The settlement proceedings are currently pending court approval.

_______________________________________________________________________

Technical analysis

_______________________________________________________________________

Bitcoin

While most analysts claim that Bitcoin has not gone under the $5,900 level and therefore stabilized above it, they fail to notice that it might be more plausible that Bitcoin is facing resistance at the $5,960 level. If this is the case, then Bitcoin fell under one of its key support levels over the weekend. However, this does not signal that it will keep going further down. That being said, the situation in the world economy alongisde the coronavirus outbreak does not bring good news to any market, cryptocurrency included.


Bitcoin’s volume decreased over the weekend, while its RSI level is currently near the middle of the value range, sitting at the value of 47.

Key levels to the upside                    Key levels to the downside

1: $5,960                                           1: $5,000

2: $6,640                                           2: $4,300

3: $6,850                                            


Ethereum

Ethereum, as a cryptocurrency that is highly correlated to Bitcoin and its movement, did not differ much from the largest cryptocurrency by market cap. Ether’s price fell under the $128 support level but found its stability near the $122.5 support. Ethereum is now trading in the middle of the range, bound by these two key levels.


Ethereum’s volume decreased over the weekend, while its RSI level is currently at the value of 44.

Key levels to the upside                    Key levels to the downside

1: $128                                                1: $122.5

2: $168                                              2: $100 

3: $178.6                                                


Ripple

XRP fell below its $0.165 support level over the weekend after just briefly going over it. The third-largest cryptocurrency is, again, trading between the levels of $165 to the upside and $0.1 to the downside. The only change in terms of key levels seems to be that XRP now responded to a pre-2017 support level of $0.147.


XRP’s volume is on extremely low levels, while its RSI level is currently at the value of just above 44.

Key levels to the upside                    Key levels to the downside

1: $0.165                                            1: $0.147

2: $0.19                                              2: $0.1

3: $0.2                                              

Categories
Forex Assets

Understanding The EUR/EGP Exotic Currency Pair

Introduction

The Euro Area’s euro against the Egyptian Pound is abbreviated as EUREGP. This is an exotic-cross currency pair in the forex market. In this pair, the EUR is the base currency, and the EGP is the quote currency.

Understanding EUR/EGP

The market price of the EUREGP depicts the value of EGP that is equivalent to one euro. It is simply quoted as 1 EUR per X EGP. So, for example, if the market price of this pair is 17.8341, then exactly 17.8341 Egyptian Pounds is required to purchase one Euro.

Spread

The difference between the bid price and the ask price is referred to as the spread. These two values are set by the brokers. Hence, it is different for different brokers. The spread also varies based on how the orders are executed.

ECN: 100 pips | STP: 111 pips

Fees

The fee is simply the commission paid on the trade. There is no fee on STP execution model but a few pips on the ECN execution model. However, the fee absence on STP accounts is usually compensated by higher spreads.

Slippage

Slippage is the difference between the price which was wanted by the trader and the price the broker actually gave the trader. It is typically not possible for brokers to give the exact price intended by the traders due to reasons:

  • Broker’s trade execution speed
  • Market volatility

Trading Range in EUR/EGP

Trading range is an illustration of the pip movement in a currency pair for different timeframes ranging from 1H to 1M. These volatility values help in assessing the risk involved in a trade. Basically, it acts as an effective risk management tool. Another application to it is discussed in the subsequent section.

Procedure to assess Pip Ranges

  1. Add the ATR indicator to your chart
  2. Set the period to 1
  3. Add a 200-period SMA to this indicator
  4. Shrink the chart so you can assess a large time period
  5. Select your desired timeframe
  6. Measure the floor level and set this value as the min
  7. Measure the level of the 200-period SMA and set this as the average
  8. Measure the peak levels and set this as Max.

EUR/EGP Cost as a Percent of the Trading Range

This is a very helpful application of the trading range. In the cost as a percent of the trading range, we combine the volatility values with the total cost on the trade and observe how the cost varies for changing volatilities.

ECN Model Account

Spread = 100 | Slippage = 10 |Trading fee = 3

Total cost = Slippage + Spread + Trading Fee = 10 + 100 + 3 = 113

STP Model Account

Spread = 111 | Slippage = 10 | Trading fee = 0

Total cost = Slippage + Spread + Trading Fee = 3 + 111 + 0 = 114

Trading the EUR/EGP

The EUR/EGP is an exotic-cross currency pair. This pair is highly volatile, but the trading volume is pretty low. However, this pair can still be traded in certain situations.

Firstly, we can see that the spreads on this pair are high. This is because the volatility in this pair is very high. For example, the average pip movement in the 1H timeframe is over 400 pips. So, we can’t really say that the spread of this pair is high.

Consider the table representing the variation in the costs. We can see that the percentages are highest in the min column. And the values are considerably small in the average and max column. If we were to interpret this, the cost of the trade reduces as the volatility of the market increases. So, based on the type of trader you are, you can choose to enter the market. For example, if you’re concerned about the high costs, then you may trade when the volatility of the market is at its peak. If you’re a conservative trader who needs petty low volatility, then you may use it during low volatilities, but you’ll have to bear high costs for it.

Furthermore, there is a way through which you can bring down your existing cost on the trade. This is simply by executing trades using limit or stop orders instead of the market. In doing so, the slippage will be nullified. So, in our example, the total cost would reduce by ten pips.