Categories
Forex Assets

Exploring The ETH/USD Pair & The Relative Costs Involved

Introduction

Trading cryptocurrencies is similar to trading in the Forex market, but the only difference being, both base and quote currencies are not fiat currencies. In crypto pairs, one of them is a virtual currency, and the other is a fiat currency. ETH/USD is a cryptocurrency pair, which is an abbreviation for Ethereum against the US Dollar. Participants can trade them via Forex brokers or through cryptocurrency exchanges.

Understanding ETH/USD

The value of ETHUSD represents the value of the US Dollar that is required to purchase one. It is quoted as 1 ETH per X USD. For instance, if the market price of ETHUSD is 170.46, then around 170 US Dollars are needed to buy one ETH.

ETH/USD Specifications 

Spread

The difference between the bid price and the ask price marked by the brokers is called the spread. Spread is the main source of revenue for brokers. Spread on major and minor currency pairs is typically very low. But, in cryptocurrencies, the spread is usually high. Below are the spread values of ECN & STP accounts for the ETH/USD pair.

  • Spread on ECN: 200 pips (2 USD)
  • Spread on STP: 250 pips (2.5 USD)

Fee

A Fee is applicable only on ECN accounts and the pro accounts of brokers. Typically, it is between 40-50 pips.

Slippage

Slippage is the difference between the price at which a trader opened a position and the price given by the broker. Due to the high volatility of the market and slow execution by the brokers, slippage occurs.

Trading Range in ETH/USD

Below is the representation of the volatility from minimum to maximum for ETHUSD in different timeframes. These numbers are very helpful in assessing one’s risk on a trade.  

Procedure to assess Pip Ranges

  1. Add the ATR indicator to your chart
  2. Set the period to 1
  3. Add a 200-period SMA to this indicator
  4. Shrink the chart so you can assess a large time period
  5. Select your desired timeframe
  6. Measure the floor level and set this value as the min
  7. Measure the level of the 200-period SMA and set this as the average
  8. Measure the peak levels and set this as Max.

ETH/USD Cost as a Percent of the Trading Range

With the application of the volatility values with the total cost on the trade, the variation in the cost of a trade can be assessed. To do so, the ratio between the total cost and volatility is taken and expressed in terms of a percentage.

The magnitude of the costs represents how high the costs are. If the percentages are large, it indicates high costs and vice versa.

ECN Model Account

Spread = 200 | Slippage = 15 |Trading fee = 45

Total cost = Slippage + Spread + Trading Fee = 15 + 200 + 45 = 260

STP Model Account

Spread = 250 | Slippage = 15 | Trading fee = 0

Total cost = Slippage + Spread + Trading Fee = 15 + 250 + 0 = 265

Trading the ETH/USD

Cryptocurrencies can be traded just like any other asset. In ETHUSD, the volatility is good enough for both short-term and long-term traders. Though the volatility values appear to be high, they don’t have a large reflection on your profit/loss. This is because, unlike forex currencies where one lot was equivalent to 100,000 units of the base currency, one lot in ETHUSD represents only 10 units of ETH.

From the above volatility table, it is seen that the costs are more when the volatility of the market is low and is less when the volatility is high. So, trading this pair majorly depends on the type of trader you are. For example, scalpers might trade when the volatility is high to get the greatest number of pips in a short amount of time. If they do so, they can get the benefit of lower costs.

In general, costs on a trade can be reduced by placing orders as ‘limit’ or ‘stop.’ In such orders, the slippage becomes nil. Hence, the total cost would be brought down to a good extent. The cost variations for limit orders or stop orders are given below for your reference and comparison.

ECN Model Account (Using Limit Orders)

Spread = 200 | Slippage = 0 |Trading fee = 45

Total cost = Slippage + Spread + Trading Fee = 0 + 200 + 45 = 245

Categories
Forex Videos

Dominating Price Action! Making You A Better Trader

Dominate Price Action To Amplify Your Trading Arsenal

In this video presentation, we will be looking at price action. If you want to be a successful forex trader, you need to understand what price action is. If we had to strip forex training down to 1 single most important feature, then price action would be it. Today we are going to show you how it is applied in forex trading.
All areas of the financial markets capture the movements of any specific asset, including Forex, on a chart and where this is recorded historically. These movements can be represented as candlesticks, line charts, or bar graphs, And can be observed over varying time periods from 1-minute or 5-minute time frames, all the way up to monthly charts. This data reflects the beliefs of market participants at any given time, whether they are human or algorithm-based traders, which is shown on the charts in the form of price action.

Price action is the methodology of applying all your decisions from a price chart while adhering to some basic trading principles. Price action is often called naked trading because traders rely on the price itself in order to denote when to enter and exit trades. However, by adding a couple of moving averages and some support and resistance lines, it becomes much more easy to identify key levels of support and resistance to trade around. Ideally, as a trader, we want to try and identify tops, bottoms, and trends. And this methodology is an extremely important feature in identifying these key areas.

A couple of old adages come to mind which lends themselves very nicely to forex trading: the first one is that sometimes you can’t see the wood for the trees, and where that can be applied to Forex in so far as sometimes traders overload their screens with technical tools and they cannot really clearly identify what is happening with the price action because they are too focused on too many technical tools. And the other adage is sometimes less is more, and that applies for the same reason: by stripping away technical tools, we can only rely on price action itself, which is a key leading indicator in its own right. While in this example of the EURUSD pair, we can quite safely say that during this period of the 1-hour chart, the general trend was to the downside, but how can we pick this out by utilizing price action itself?


Example B, the Price action of a pair is in continuous motion apart from interruptions during the weekends. Otherwise, price is consolidating or moving in a sidewards direction, or it is trending higher or lower. As traders, we should be looking at what is happening with price action at any given time and then try to establish if the price is trending, or if it is in a period of consolidation, or even a pullback before a trend continuation.
Price action alone can help us determine these areas, but by adding a couple of visual supports such as some trend Lines, it just makes it more easily identifiable. For this example, we have just added two very simple lines that help us to more clearly identify levels of support and resistance. Here we can see a period of consolidation, which is qualified by price action touching, or is very close to touching at least two areas of support and resistance, which are clearly identifiable such as drawn onto our chart.
One thing is for sure that price action will breach this area at some future point. This is a key area of interest for traders.


Example C, Here we can see that the support line has been breached by a strong bearish candlestick. Traders will jump on this opportunity to go short on the pair at this point.

Example D, We subsequently see another area of consolidation and a further breach to the downside, and where traders would expect that a downtrend is in process, and they would be looking for opportunities to go short.
Whilst stochastics, MACD, and moving averages are widely used throughout the trading community, many traders feel that price alone can be relied on for identifying trade opportunities, and certainly, these couple of examples would support that.
But of course, as cautious traders, we like to stack the odds in our favor, and if that means adding a couple of extra visual technical tools that will help us well, what’s the harm in that?

Example E, Here, for example, we have added a simple 30 period moving average. Notice how the price action tends to bounce lower off of this line, while price action continues in its trend lower.

Example F, I know the world price continues to consolidate and punches lower through support lines and where support lines become lines of resistance, but all the while price is bouncing lower from the 30-period ma.


Example G, Price action also throws up another favorite for traders: highs with lower highs and lows with lower lows which identify a downtrend, and where the opposite would apply for an uptrend, where they would be looking for highs with subsequently higher highs and lows with subsequent higher lows. But again, these key areas are clearly evident on the screen, even with price action alone.

Example H, Price action Traders will also observe higher time frames, in this example, we are looking at a 4-hour chart of the EURUSD pair, traders try and establish what is going on with price action on the longer time frames because this will filter through to the lower time frames and where they will look for opportunities to jump on the overall trend should there be one.
Price action becomes repetitive, and this is because human nature in trading tells us that certain things are likely to happen at certain levels, typically key levels or round numbers, and if these things are recurring on a regular basis, human emotion would suggest that they are likely to continue to recur and therefore trading sometimes becomes a self-fulfilling prophecy where certain price action events, in the absence of fundamental reasons, is likely to continue in this vein. Price action levels become significant because market participants give significance to them.

In summarising price action who is the most significant aspect of Forex trading, and where by just using the minimum amount of technical tools you can more easily see areas of price consolidation, within resistance and support levels, and when these areas are breached we may see a continuation in price action in the direction of the breach, and by incorporating a simple moving average it can more easily help us to identify a trend. And that these very basic mechanisms are highly favored by professional and institutional traders.

Categories
Forex Course

98. Do You Know There Are Four Types of Pivot Points?

Introduction

In all the previous lessons of pivot points, we considered the traditional pivot points. But this is not the only type of pivot points that are existing. There are three other types to it as well. In this lesson, we shall cover the four different types of pivot points that exist.

Types of Pivot Points

The four types of pivot point are mentioned as follows:

  • Traditional Pivot point
  • Woodie Pivot point
  • Camarilla Pivot point
  • Fibonacci Pivot point

Since we’ve already discussed the traditional pivot point in detail, we shall be concentrating on the rest of the types. Note that, in all the different types of pivot points we will be studying, the only difference is the calculation of the pivot point levels. As far as the concept to trade using these pivot points is concerned, it remains the same as the traditional approach.

Woodie Pivot Point

The Formulae

Pivot point (P) = (High + Low + 2Close) / 4

First Resistance (R1) = (2 x P) – Low

Second Resistance (R2) = P + High – Low

First Support (S1) = (2 x P) – High

Second Support (S1) = P – High + Low

From the above formulas, we can notice that the way of calculations is pretty different from that of the traditional type. In the traditional, we considered the difference between High and Low to calculate support and resistance levels. But, in this case, consider the range as well as the close of the previous day. Some traders prefer this over the traditional pivots because it gives more weightage to the close price of the previous day.

Camarilla Pivot Points

The Formulae

P = (High + Close + Low) / 3

S1 = Close – ((High – Low) x 1.0833)

S2 = Close – ((High – Low) x 1.1666)

S3 = Close – ((High – Low) x 1.2500)

S4 = Close – ((High – Low) x 1.5000)

R4 = Close + ((High – Low) x 1.5000)

R3 = Close + ((High – Low) x 1.2500)

R2 = Close + ((High – Low) x 1.1666)

R1 = Close + ((High – Low) x 1.0833)

If we look closely, we can infer that the support and resistance levels are calculated using the range and the close price similar to the Woodie calculation. The only major difference being, in Camarilla, four levels of Support and Resistance is calculated and is multiplied by a multiplier.

The theory with which Camarilla was created is based on the concept that the price has a natural tendency to return to the mean (here, close of the previous day). So, the simple strategy here is to sell when the price reaches the R3 or R4 level and buy when the price bottoms to S3 or S4 level. However, if the price breaches the S4 or R4 level, it indicates a strong trend in the market.

Fibonacci Pivot Points

The Formulae

P = (High + Low + Close) / 3

S1 = P – ((High – Low) x 0.382)

S2 = P – ((High – Low) x 0.618)

S3 = P – ((High – Low) x 1.000)

R3 = P + ((High – Low) x 1.000)

R2 = P + ((High – Low) x 0.618)

R1 = P + ((High – Low) x 0.382)

For calculating Fibonacci level, the pivot point level is calculated using the traditional method. Then the Support and Resistance levels are obtained by finding the product of the previous day’s range and the corresponding Fib level. The most used Fib levels are 38.2%, 61.8%, and 100%. Finally, adding/subtracting this value with the pivot point yields the Support and Resistance levels.

All of these indicators will be available with most of the brokers and charting tool software. Consider trying all of these pivot points on a demo account and use the ones that work the best for you. This hence brings us to the end of this lesson as well as the concepts involved in the pivot points. In the next lesson, we’ll summarize this topic and move ahead with another interesting technical analysis tool. Cheers!

[wp_quiz id=”70131″]
Categories
Forex Market Analysis

Daily F.X. Analysis, April 10 – Top Trade Setups In Forex – U.S. CPI Under the Spotlight! 

The greenback dropped broadly due to the downbeat U.S. Initial Jobless Claims data release, which showed that the weekly new claims exceeded 6 million for the second straight time last week. The fresh fears of economic difficulty, indicated by the Fed Chair Powell, also keeps the USD lower, which leads a 0.06% drop in the U.S. dollar to trade at 99.46, having hit a daily high at 99.63 in early Asia. Today, the major focus of traders will be on the U.S. inflation report as most of the market is off due to good Friday. Let’s take a look at the technical and fundamental’s outlook.

Economic Events to Watch Today     


EUR/USD – Daily Analysis

The single currency EUR gained a slight bullish momentum against the U.S. dollar on reports that the U.S. jobless claims performed worst than expected. A day before, the European Union finance ministers failed to agree on a coronavirus relief package. Meanwhile, the Bank of France sees the first-quarter GDP shrinking 6% from the previous quarter, the most significant decline since World War II, amid nationwide lockdown due to the coronavirus outbreak.

On the other hand, the EUR currency got supported by multiple factors, the figures of newly infected peoples and death toll showing a sign slowing down across the hotspots in Europe and boosted the sentient around the shared currency. In the meantime, the Eurogroup finally reached a half a trillion euros virus rescue package gave further support to the common currency bulls.

Looking forward, the USD moves and virus updates will continue to play an important role. Traders will keep their eyes on the Fed’s Mester’s speech, the U.S. Consumer Price Index (CPI), and the G20 energy ministers meeting for the fresh trading sentiment.

Daily Support and Resistance

  • S1 1.0685
  • S2 1.0796
  • S3 1.0862

Pivot Point 1.0907

  • R1 1.0973
  • R2 1.1018
  • R3 1.1129

EUR/USD– Trading Tips

The EUR/USD has violated the asymmetric triangle pattern, which is leading; it’s price further higher towards the next resistance level of 1.0960. The pair was following 1.0922 – 1.0765 trading, which is now likely to give support to the EUR/USD pair. At this moment, the EUR/USD is holding at 1.0940, having an immediate support level of around 1.09110, where the bearish breakout of this level can extend selling until the next support level of 1.0846 and 1.07990.

The MACD has crossed over 0, converting the bearish sentiment into bullish. At the same time, the 50 periods exponential moving average is also keeping the EUR/USD in a bullish mode, extending an immediate resistance around 1.08996. So, let’s consider taking buying trades above 1.0907 to target 1.0970 today. 


GBP/USD– Daily Analysis

The GBP/USD rebounded for a second straight session, gaining 0.4% to 1.2392. U.K. government spokesman James Slack said Prime Minister Boris Johnson is in a stable condition and responding to coronavirus treatment in hospital. 

The reason behind the GBP strength could also be the fresh pessimism surrounding Brexit date because the new Labour Party shadow Chancellor Anneliese Dodds asked ministers to beware putting “ideology over the national interest. Whereas, the U.K. Express conveyed the headlines indicating the Transition period delay could cost U.K. taxpayer £26 billion a year.

On the other hand, the U.S. Federal Reserve (Fed) Chair Jerome Powell expecting downbeat economics during the 2nd-quarter (Q2) of 2020 before expecting the recovery in the second half of the year.

As in result, Japan’s TOPIX recently rose to 1,424, up 0.56%, while stocks in China remain mixed by the reporting time. Looking ahead, traders will keep their focus on the coronavirus updates for intermediate direction. However, the expectedly downbeat U.S. inflation figures for March will likely keep the pair strong.

Daily Support and Resistance    

  • S1 1.2187
  • S2 1.231
  • S3 1.2381

Pivot Point 1.2432

  • R1 1.2504
  • R2 1.2555
  • R3 1.2678

GBP/USD– Trading Tip

The GBP/USD soars to trade around 1.2496 but still holds within a sideways channel. The GBP/USD sideways channel is supporting the GBP/USD pair around 1.220 and along with resistance around 1.2490.

Considering the weakness in the U.S. dollar, the chances of selling remains low, but the bullish bias remains solid over 1.2500 level. Violation of this can lead the GBP/USD prices until 1.2720. The MACD and 50 EMA are also supporting the bullish bias, so let’s consider taking buying trades over 1.2432 with a target of 1.2500 first and then buying over 1.2500 to target 1.2610. 


USD/JPY – Daily Analysis

Today in the early Asian session, the USD/JPY currency pair dropped to 108.33, mainly due to the risk-off market sentiment in the wake of intensified concerns about coronavirus (COVID-19). The fresh declines in the U.S. dollar, which are based on downbeat data and depressed signals from the Fed Chair, keeps the pair lower.

The USD/JPY is currently trading at 108.39 and consolidates in the range between the 108.33 – 108.61. At the USD front, the greenback dropped broadly due to the downbeat U.S. Initial Jobless Claims data release, which showed that the weekly new claims exceeded 6 million for the second straight time last week.

The fresh fears of economic difficulty, indicated by the Fed Chair Powell, also keeps the USD lower; as in result, the U.S. dollar index drops 0.06% to 99.46, having hit a daily high at 99.63 in early Asia.

At the coronavirus front, as per the latest report, the 427,460 cases of coronavirus registered an increase of 32,449 cases from its previous count and said the number of deaths also rose 1,942 to 14,696. It should also be noted that the Centers for Disease Control and Prevention (CDC) earlier announced ‘no sail’ order to all cruise ships. As in result, the U.S. continues marked as the world’s second-worst affected nation due to the virus after Italy.

Daily Support and Resistance    

  • S1 107.84
  • S2 108.34
  • S3 108.59

Pivot Point 108.85

  • R1 109.09
  • R2 109.35
  • R3 109.86

USD/JPY – Trading Tips

The USD/JPY’s symmetric triangle pattern has already been violated, which was supporting the pair around 108.570. Closing of candles below this level is suggesting bearish bias among traders, which can lead the USD/JPY, the safe-haven currency pair, towards the next support level of 107.850. The 50 EMA is also suggesting a bearish bias for the USD/JPY pair. 

On the higher side, the support level 108.500, which got violated earlier, is going to work as resistance now, and it may offer us selling traders in the USD/JPY today.  The USD/JPY may exhibit buying until 108.580, and violation of this can open more room for buying until 108.8500. On the lower side, support continues to hold around 107.850. Let’s look for selling traders below 108.550 today.  

All the best for today! 

Categories
Crypto Market Analysis

Daily Crypto Review, Apr 10 – Canada launching a BTC fund; Cryptos retesting support levels

The cryptocurrency market had a slightly red day as it consolidated and tested slightly lower prices overall. Bitcoin is currently trading for $7,133, which represents a decrease of 2.08% on the day. Meanwhile, Ethereum lost 3.84% on the day, while XRP lost 2.11%.

Dash took the position of today’s most prominent daily gainer, with gains of 7.03%. Seele lost 11.05% on the day, making it the most prominent daily loser.

Bitcoin’s dominance increased a tiny bit. Its value is now 64.56%, which represents a 0.31% difference to the upside when compared to yesterday.

The cryptocurrency market capitalization went down slightly in the past 24 hours. Its current value is $204.27 billion. This value represents a decrease of $4.22 billion when compared to the value it had yesterday.

What happened in the past 24 hours

Canadian asset manager 3iQ announced that they would finally launch a fund tied to Bitcoin on the Toronto Stock Exchange. This news came after three years of legal issues.

‘The Bitcoin Fund’ started trading yesterday. It listed almost 1.5 million Class A ‘QBTC.U’ shares the exchange on April 9. The fund’s company shares are currently trading for somewhere around $11 each.

Honorable mention

Ethereum

Investors seem to be liking Ethereum, as some of them are ready to pay five times more than its price. Grayscale Ethereum Trusts offers Ether at a 515% premium, and people still like it.

It costs $90.55 to buy one share in the Grayscale Investments’ Ethereum Trust. However, this share currently only holds $16.10 worth of Ether.

_______________________________________________________________________

Technical analysis

_______________________________________________________________________

Bitcoin

Bitcoin has spent the day consolidating and dropping in price slightly. However, things do not look well as Bitcoin is taking a retest of the lows with slightly increased volume. While it is currently trying to breach $7,000 and trade under it, nothing is settled yet.


Bitcoin’s volume is slowly increasing, while its RSI is currently at the value of 40.

Key levels to the upside                    Key levels to the downside

1: $7,420                                           1: $7,085

2: $7,750                                           2: $6,850

3: $8,000                                            3: $6,640


Ethereum

Ethereum spent the past 24 hours trying to establish a price above the $168 support level. However, the latest push down broke the level, and ETH went below $168. It looks like the second-largest crypto will retest at least the $158 level, if not more.


Ethereum’s volume skyrocketed during the price drop, while its RSI level is at 46.

Key levels to the upside                    Key levels to the downside

1: $168                                                1: $158

2: $178.6                                            2: $147.5 

3: $185                                                3: $139


Ripple

XRP spent the past couple of days fighting to stay above $0.2. However, the tight range between $0.2 and $0.205 was not enough for XRP, so the price had to move somewhere. A slight increase in bearish presence brought the price down to rested the $0.19 levels and solidified XRP’s position below $0.2. The level seems to be holding up nicely so far, which means that $0.19 will not fall unless the volume increases dramatically.


XRP’s RSI level has been dropping for the past couple of days, now being at 45.

Key levels to the upside                    Key levels to the downside

1: $0.2                                                1: $0.19

2: $0.205                                            2: $0.165

3: $0.227                                             3: $0.147

Categories
Forex Market Analysis

Crude Oil Boosts Amid Massive Output Cut Sentiment – OPEC Meeting In Focus! 

A day before, the WTI crude oil prices were boosted by reports that massive output cuts would be agreed upon when OPEC and its allies, including Russia, meet later today. U.S. Nymex crude oil futures jumped to trade $27.09 a barrel. 

Meanwhile, the U.S. Energy Information Administration reported that crude oil production in the country sank to a six-month low of 12.4 million barrels per day last week. The agency also said crude oil stockpiles increased 15.2 million barrels, much higher than a build of 8.4 million barrels expected.

Declining demand due to coronavirus fears and lockdowns, Russia’s announcement comes at a suitable time. Whereas, the Energy Information Administration (EIA) said overnight that the U.S. crude oil inventory has grown by 15.2 million barrels for the week ending April 3, against analyst expectations of a 9.37-million-barrel build. The American Petroleum Institute (API) also estimated a build of 11.9 million barrels yesterday. 

OPEC meeting will likely be more successful than their meeting in March, where they failed to agree to continue supply cuts and fueled a price war between Saudi Arabia and Russia.

Apart from the OPEC+ meeting, energy ministers from the Group of 20 major economies are expected to meet in order to find new ways to help ease the impact of the COVID-19 pandemic on global energy markets.

Daily Support and Resistance

  • S1 24.14
  • S2 26.37
  • S3 27.77

Pivot Point 28.59

  • R1 30
  • R2 30.82
  • R3 33.05

Crude oil is on a bullish run, trading around 27.15 level. The U.S. oil is likely to face immediate resistance around the triple top level of 28.86. Today, crude oil may find immediate support around 25.45 level, and above this, the WTI crude oil prices can show a bullish bias until 28.85 resistance. A bullish breakout of 28.85 level can lead WTI prices further higher until the next resistance area 30.22. The bullish bias remains dominant, and we should look for buying trading over 26.15 today. Good luck!

Categories
Forex Assets

BTC/USD – Trading Costs Involved While Trading This Crypto-Fiat Pair

Introduction

Apart from currencies pairs, exchanges allow trading of cryptocurrencies as well. Cryptocurrencies can be bought and sold in the exchange market through Forex brokers. Trading cryptocurrencies can be closely related to Forex trading but not stock trading. This is because cryptos are traded as pairs and not individually. In this series, we will be analyzing the trading costs involved while trading cryptocurrencies that are paired with fiat currencies (Ex: USD).

BTC/USD is a cryptocurrency pair where BTC stands for Bitcoin, and USD stands for US Dollar. This pair is traded through Forex brokers as CFDs, or through cryptocurrency exchanges where cryptos are bought and sold exclusively.

Understanding BTC/USD

The price of BTC/USD in the exchange market represents the value of the US Dollar equivalent to one 1 Bitcoin. It is quoted as 1 BTC per X USD. For example, if the current market price of BTCUSD is 7356.50, then it can be said that one Bitcoin is equal to the US $7356.50.

BTC/USD specifications

Spread

Spread is the difference between the bid and the ask price in the exchange market. It is determined by the brokers and exchanges, and it hence varies from time to time. Typically, the spreads for trading cryptocurrencies are very high. In recent years, the spread of coins having two decimal places is between 1500-6000 pips. The approx. spread on ECN and STP accounts are given below.

  • Spread on ECN: 3000 pips (30 USD)
  • Spread on STP: 3050 pips (30.5 USD)

Fees

The fee is simply the commission paid for the position a trader takes. It is charged only for ECN and Pro accounts and not for STP accounts. For our analysis, we shall keep the fee at 45 pips.

Slippage

Slippage is the difference between the price at which a client executed trade and the price which was actually given by the broker. This difference occurs either because of high market volatility or speed of trade execution.

Trading Range in BTC/USD

The trading range is the representation of the pip movement in the pair for different timeframes. The values are calculated using the average true range indicator. And the procedure to assess it is given below as well.

Procedure to assess Pip Ranges

  1. Add the ATR indicator to your chart
  2. Set the period to 1
  3. Add a 200-period SMA to this indicator
  4. Shrink the chart so you can assess a large time period
  5. Select your desired timeframe
  6. Measure the floor level and set this value as the min
  7. Measure the level of the 200-period SMA and set this as the average
  8. Measure the peak levels and set this as Max.

BTC/USD Cost as a Percent of the Trading Range

Cost is a factor that varies with the change in the volatility of the market. By finding the ratio between the total cost and volatility, the variation in the costs is measured.

ECN Model Account

Spread = 3000 | Slippage = 25 |Trading fee = 45

Total cost = Slippage + Spread + Trading Fee = 25 + 3000 + 45 = 3070

STP Model Account

Spread = 3050 | Slippage = 25 | Trading fee = 0

Total cost = Slippage + Spread + Trading Fee = 25 + 3050 + 0 = 3075

The Ideal way to trade the BTC/USD

It is a general impression that trading cryptos are very risky because of its high volatility. But it is not completely true. To clear the misconception, consider the following example.

The pip value of BTC/USD per lot is 0.01 USD. That is, for every pip up or down, you will gain or lose 0.01 USD. The average pip movement in the 1H timeframe is 9100 pips. So, if you trade one lot of BTC/USD, you will win or lose about $0.01 x 9100 = $91 in a time frame of one hour. Hence, though the pip movement seems to be high, the profit/loss remains within decent boundaries.

Considering the cost variation in the above tables, it can be inferred that the costs are more for low volatile markets and less for a highly volatile market. But, the cost for average volatility acts as a median. Hence, trading when the volatility is around the average values is recommended. Furthermore, costs can be lowered by trading via limit orders instead of market orders. In doing so, the slippage on the trade will be nullified and will not be included in the total cost. In the above example, the total cost would reduce by 25 pips.

That’s about the trading costs involved while trading the BTC/USD pair. We will be discussing more Crypto/Fiat pairs in the upcoming articles. In case of any queries, let us know in the comments below. Cheers!

Categories
Forex Course

97. Where Are The Pivot Point Levels Put To Use?

Introduction

In our previous two discussions, we enlightened you with different strategies for using the pivot points. If you noticed, there we focused only on the pivot support and resistance levels. We didn’t really touch base on the Pivot Point (P) level. So, in this chapter of pivot points, we shall understand how the pivot point level is useful.

The usefulness of Pivot Point

The pivot point is used to measure market sentiment. Yes, with pivot points, we can even gauge the sentiment of the market. In other words, the pivot point helps us determine the direction of the market. It tells us in which direction is the money flowing in the market. So, basically, it indicates the trend of the market. Now, let’s take a few examples to understand the use of pivot points.

What does a Pivot Point tell us?

We know that the pivot point determines the type of market we are in. Inferences are made when the price falls below or above the pivot point.

  • When the market breaks below the pivot point (P), it indicates a bearish market or a market where the sellers are under control.
  • When the market breaches above the pivot point (P), it indicates a bullish/buyer’s market.

Bearish Example

Consider the chart below representing the GBP/JPY on the 15min timeframe. The pivot points are indicated as shown. Initially, we can see that the market was holding above the Pivot Point (P). Later in the day, it broke below the pivot point and then continued to move south. Also, it didn’t even respect the support levels. From this, we can conclude that the support levels do not work every single time. It perfectly fine when it is combined with other tools of analysis. However, a breakout trader would’ve profited the most from it.

Most importantly, one must not use this pivot point level as a tool to enter a trade. It is only an indicator that determines the sentiment of the market. It only tells us if the buyers are showing interest in the currency pair or the sellers. And with information in hand, we use other trading techniques to time the market.

Bullish Example

In the below chart, we can see that the market was trading below the pivot point level. Then it shot up and broke the pivot level as shown. This marks the start of an uptrend. And it is clearly visible that the market headed north by breaking through R1 as well as R2. But at R3, it found resistance. Now since the market is trending up, one can look at the price drop from R2 as a discount and anticipate buying at the R2 level, which is ‘resistance turned support.’

Similarly, traders can determine the direction of the market using the pivot point level and time their entry based on other technical tools and ideas. We hope you found this lesson informative and interesting. Cheers!

[wp_quiz id=”69915″]
Categories
Forex Market Analysis

Daily F.X. Analysis, April 09 – Top Trade Setups In Forex – Brace for High Impact Events! 

On the forex front, the U.S. dollar stabilized against its major peers on Wednesday, as the ICE Dollar Index gained 0.2% on the day to 100.16. Eyes will remain on the German Federal Statistical Office, which is due to report February trade balance (16.5 billion euros surplus expected) and current account balance (17.0 billion euros surplus expected).

The U.K. Office for National Statistics will post February monthly GDP (+0.1% on month expected), industrial production (+0.1% on month expected), manufacturing production (+0.1% on month expected) and trade balance (1 billion pounds surplus expected).

Economic Events to Watch Today     


 EUR/USD – Daily Analysis

The EUR weakened against the U.S. dollar on reports that European Union finance ministers failed to agree on a coronavirus relief package. EUR/USD slid 0.3% to 1.0862.

German leading institutes expect the country’s GDP to slump 9.8% in the second quarter compared with the prior quarter and drop 4.2% for the whole year, citing the coronavirus pandemic. Meanwhile, the Bank of France sees the first-quarter GDP shrinking 6% from the previous quarter, the largest decline since World War II, amid nationwide lockdown due to the coronavirus outbreak.

Moving on, the shared currency may face deeper losses if a discussion about the stimulus package again fails to happen on the day or end on a sour note. It’s worth noting that the ECB is already running a negative interest rate policy and a massive asset purchase program. As a result, markets are increasingly expecting governments to do their bit by providing fiscal stimulus. 

Looking forward, the ECB minutes, which are scheduled to happen at 11:30 GMT, are expected to repeat downside risks to the economy and willingness to do more if required. On the data front, Germany is set to report trade figures for the month of February at 07:00 GMT. 

Daily Support and Resistance

  • S1 1.0742
  • S2 1.08
  • S3 1.0829

Pivot Point 1.0858

  • R1 1.0887
  • R2 1.0917
  • R3 1.0975

EUR/USD– Trading Tips

The EUR/USD continues trading within a symmetric triangle pattern, which is keeping the pair within 1.0922 – 1.0765 trading zone. At this moment, the EUR/USD is holding at 1.0866, having an immediate support level of around 1.0835, where the bearish breakout of this level can extend selling until the next support level of 1.07990 and 1.0765.

The MACD has still tossing above and below 0, converting the bearish sentiment into bullish. At the same time, the 50 periods exponential moving average is also keeping the EUR/USD in a neutral mode, extending an immediate resistance around 1.08856. So, let’s consider taking selling trades below 1.0835 to target 1.0775 and bullish above the same to target 1.0910 and 1.0970 today.

GBP/USD– Daily Analysis

The GBP/USD rebounded for a second straight session, gaining 0.4% to 1.2392. U.K. government spokesman James Slack said Prime Minister Boris Johnson is in a stable condition and responding to coronavirus treatment in hospital. 

Later today, U.K. monthly GDP data and manufacturing production for February will be released (both +0.1% on month expected). Whereas, the market risk sentiment getting heavy due to the rise in the U.S. cases, marked as a second highly infected nation, after Italy, in the world. 

As in result, early Asia risk-on sentiment, mainly due to U.S. President Donald Trump’s push for restarting the economy, failed to extend while the U.S. 10-year treasury yields dropped 2-basis points to 0.746% with stocks in Asia flashing mixed results.  

Looking ahead, the traders may not give any major attention to the U.K.’s data-dump comprising Manufacturing Production, Industrial Production, and monthly GDP due to being before the virus outbreak period. 

However, the weekly release of U.S. Jobless Claims and speech from the Federal Reserve Chairman Jerome Powell will be essential to watch. Apart from this, virus updates will not lose its importance and will be essential to watch for new directions.

Daily Support and Resistance

  • S1 1.2104
  • S2 1.2236
  • S3 1.2315

Pivot Point 1.2368

  • R1 1.2447
  • R2 1.25
  • R3 1.2632

GBP/USD– Trading Tip

On Thursday, the GBP/USD soars to trade around 1.2398 within a sideways channel. The channel is supporting the Cable at 1.220 and along with resistance around 1.2490. The release of GDP figures from the U.K. can help drive a breakout in the market. In the case market breaks bellow 1.2278, we may see GBP/USD prices heading into the selling zone until 1.2100 and 1.2005. 

Whereas, the chances of buying remains solid over 1.2275 until 1.2520. The MACD and 50 EMA are also supporting the neutral bias, so let’s consider taking buying trades over 1.2368 with a target of 1.2470 and sell trades below 1.2368  

USD/JPY – Daily Analysis

During Thursday’s Asian session, the USD/JPY currency pair flashing green and continued its previous session recovery rally toward above the 109.00 level. The currency pair rose from 108.60 to 109.06, mainly due to the recent risk reset market sentiment. 

Currently, the USD/JPY is currently trading at 108.94 and consolidates in the range between the 108.80 – 109.06. However, the Japanese yen earlier weakened caused by risk-on market sentiment in the wake of expectation of further stimulus and an easy run for the favorite candidate for the U.S. President’s post.

During the Newyork trading session, the attention was on the Federal Reserve Open Market Committee’s minutes of the unscheduled meeting on March 15. The minutes indicated anxiety about the virus and the extremely large degree of uncertainty. There was a muted reaction to the minutes because they didn’t show anything that hasn’t already been priced in by market traders. They just decided to cut the benchmark rate to nearly zero and restart bond-buying programs.

Moreover, Japan’s Prime Minister Abe has announced a state of emergency in Tokyo and 6-other provinces. He plans to control the economic fallout of COVID-19 as well as a substantial fiscal stimulus package. The package, worth ¥16.5trn, equates to 20% of GDP. Consequently, the USD/JPY currency pair is moving nowhere as investors seem confused about whether to buy USD/JPY over a stronger dollar or sell over the increased safe-haven appeal. 

As per the latest comments from the U.S. and Japanese policymakers also indicated that more stimulus to control the coronavirus (COVID-19) is on their way. On the flip side, Bernie Sanders turned from the U.S. Presidential Candidate’s race, giving an edge to the market favorite Joe Biden and helping to improve the trading sentiment.

Daily Support and Resistance    

  • S1 107.84
  • S2 108.34
  • S3 108.59

Pivot Point 108.85

  • R1 109.09
  • R2 109.35
  • R3 109.86

USD/JPY – Trading Tips

On Thursday, the USD/JPY’s symmetric triangle pattern continues to play due to a lack of high impact economic events. Choppy sessions continue to trade around 108.884, and it’s strictly following a narrow trading range of 108.650 – 107.250. The technical side of USD/JPY is mostly the same as the USD/JPY’s pair continues to find support around 108.700. On the 4 hour timeframe, the Japanese pair has closed a bullish engulfing candle over 50 EMA, which is suggesting odds of more buying in the USD/JPY currency pair. The USD/JPY may exhibit further room for buying until 109.680, and violation of this can open more room for buying until 110.500 and 111.450. On the lower side, support continues to hold around 108.750. Let’s look for buying traders over 108.850 today.  

All the best for today! 

Categories
Crypto Market Analysis

Daily Crypto Review, Apr 9 – BCH surges after halving, BSV outperforming

The cryptocurrency market had a slow day, losing a bit of its value while it consolidated. Bitcoin is currently trading for $7,289, which represents a decrease of 0.77% on the day. Meanwhile, Ethereum lost 1.35% on the day, while XRP lost 0.76%.

Seele took the position of today’s most prominent daily gainer, with gains of 20.9%. CyberVein lost 12.12% on the day, making it the most prominent daily loser.

Bitcoin’s stayed at the same place dominance-wise. Its value is now 64.25%, which represents a 0.01% difference to the upside when compared to yesterday.

The cryptocurrency market capitalization did not change much in the past 24 hours. Its current value is $208.49 billion. This value represents a decrease of $0.85 billion when compared to the value it had yesterday.

What happened in the past 24 hours

The Cardano Foundation made an announcement that they will be partnering with the South African National Blockchain Alliance. This partnership aims to explore further ways to strengthen (mostly blockchain) technology’s adoption all throughout South Africa.

According to the official announcement, Cardano will be using blockchain technology to boost socio-economic growth throughout South Africa.

Honorable mention

BCH/BSV

Bitcoin Cash completed its first block reward halving on Wednesday, Apr 9. The halving created a price surge, with the coin gaining 11.2% on the day.

Bitcoin SV made a bit of a stronger move, with its block halving on schedule for Friday, Apr 10. However, the cryptocurrency gained 19.4% in the same time period as Bitcoin Cash and outperformed it despite not completing the block reward halving yet.

_______________________________________________________________________

Technical analysis

_______________________________________________________________________

Bitcoin

Bitcoin has spent the day consolidating. The volume was low and the price action was almost non-existent. The largest cryptocurrency by market cap is showing that it will take a lot of work to get past $7,420, as it endured every attempt of breaking it so far (and there were many). This is a perfect time for traders to use their ranging market strategies.


Bitcoin’s volume is significantly lower than yesterday, while its RSI dropped to 60

Key levels to the upside                    Key levels to the downside

1: $7,420                                           1: $7,085

2: $7,750                                           2: $6,850

3: $8,000                                            3: $6,640


Ethereum

Ethereum spent the past 24 hours retesting the $168 support level that it went above during the most recent price surge. The support level held up well, and ETH is currently secure above it. As the retesting is still in play, we can’t rule out the option of price falling below the $168 level and retesting $158. However, there probably won’t be any chance of the price going down further due to the lack of volume.


Ethereum’s volume gradually reduced to extremely low levels, while its RSI went back down to 64.

Key levels to the upside                    Key levels to the downside

1: $178.6                                             1: $168

2: $185                                              2: $158 

3: $193.6                                            3: $147.5


Ripple

XRP fought to stay between a tight range of $0.2 and $0.205. However, while the $0.2 level did get recognized, it did not pose a big threat to the price. After a while, bulls and bears moved almost freely throughout the 0.2 zone. The price is currently just below $0.2. There are no indications of the direction of the movement yet. Still, with the volume at this low level, the chance of going above $0.205 or below $0.19 is almost non-existent.


XRP’s RSI level dropped from the oversold territory and is currently at 61.

Key levels to the upside                    Key levels to the downside

1: $0.2                                                1: $0.19

2: $0.205                                            2: $0.165

3: $0.227                                             3: $0.147

Categories
Forex Market Analysis

Gold Choppy Session Continues – Ascending Triangle Supports! 

On Wednesday, gold is keeping bullish momentum over rising coronavirus death toll hammered risk sentiment. At the same time, the trader awaits the announcement of the U.S. Federal Reserve’s policy conference minutes for hints on additional stimulus measures. Gold edged 0.1% to $1,650.40 during the U.S. session. 

One of the reasons behind gold’s bullish bias is ongoing tensions around the globe. The UK PM Boris Johnson is in ICU, which is driving uncertainty from the British markets. Moreover, Japan’s Prime Minister Abe has announced a state of emergency in Tokyo and 6-other provinces and plans to control the economic fallout of COVID-19 as well as a huge fiscal stimulus package. The package, worth ¥16.5trn, equates to 20% of GDP. 

Meantime, European leaders are discussing policy tool-kit, which has probably worth up to €540bn (3.8% of GDP). However, it will be interesting to get a broad agreement between European leaders on the debt mutualization plan since the very nation is introducing stimulus plans, which makes their currencies weaker. Consequently, traders switch to precious metal gold. 

Daily Support and Resistance

Support Resistance

1,628.08 1,687.6

1,592.25 1,711.3

1,532.73 1,770.83

Pivot Point 1,651.78

Gold prices are trading with a bullish bias around 1,649 level, having supported over previously violated ascending triangle resistance become support level of 1,636. We can see a series of neutral candles over 1,636 level, which is suggesting indecision among traders. However, the upward trendline and 50 periods EMA on the 4 hour time is demonstrating a chance of bullish trend continuation in the market. 

On the higher side, gold may find immediate resistance around 1,655, and bullish breakout of this may offer buying until 1,671. While support continues to hold around 1,636. Let’s consider taking bullish trades over 1,640 levels to target 1,662 and 1,671. Good luck!

Categories
Forex Assets

Understanding The GBP/HUF Exotic Currency Pair

Introduction

GBP stands for British Pound Sterling, and it is the 4th most traded currency in the Foreign Exchange market after USD, EURO and YEN. It is the official currency of the United Kingdom and some other countries like Jersey, South Georgia, and Guernsey. Whereas HUF stands for Hungarian forint, and it is the official currency of Hungary.

GBP/HUF

We know that the currencies in the Forex market are traded in pairs. GBP/HUF is the abbreviation for the Pound sterling against The Hungarian Forint. In this case, the first currency (GBP) is the base currency, and the second (HUF) is the quote currency.

Understanding GBP/HUF

To find the relative value of one currency in the Forex market, we need another currency to compare. If the value of the base currency goes down, the value of the quote currency goes up and vice versa. The market value of GBP/HUF determines the strength of HUF against the GBP. It can be easily understood as 1GBP is equal to how much of HUF. So if the exchange rate for the pair GBP/HUF is 414.425, it means we need 414.425 HUF to buy 1 GBP.


Spread

Forex brokers have two different prices for currency pairs: the bid and ask price. Here the “bid” price at which we can SELL the base currency, and The “ask” price is at which we can BUY the base currency. Hence, the difference between the ask and the bid price is called the spread. Some brokers, instead of charging a separate fee for trading, they already have the fees inbuilt in the spread. Below are the ECN and STP for the pair GBP/HUF.

ECN: 57 pips | STP: 60 pips

Fees

When we place any trade, there is some commission we need to pay to the broker. A Fee is simply that commission that we pay to the broker each time we execute a position. The fee also varies from the type of broker we use; for example, there is no fee on STP account models, but a few pips on ECN accounts.

Slippage

Slippage alludes to the difference between the expected price at which the trader wants to execute the trade and the price at which the trade is being executed. It can occur at any time but mostly happens when the market is fast-moving and volatile. Also, sometimes when we place a large number of orders at the same time.

Trading Range in GBP/HUF

The trading range is a tabular representation of the pip movement in a currency pair for different timeframes. Using this, we can assess the risk on a trade for each given timeframe. A trading range essentially represents the minimum, average, and maximum pip movement in a currency pair. This can be evaluated easily by using the ATR indicator combined with 200-period SMA.

Procedure to assess Pip Ranges

  1. Add the ATR indicator to your chart
  2. Set the period to 1
  3. Add a 200-period SMA to this indicator
  4. Shrink the chart so you can assess a significant period
  5. Select your desired timeframe
  6. Measure the floor level and set this value as the min
  7. Measure the level of the 200-period SMA and set this as the average
  8. Measure the peak levels and set this as Max.

GBP/HUF Cost as a Percent of the Trading Range

The cost of trade mostly depends on the broker and varies based on the volatility of the market. This is because the total cost involves slippage and spreads apart from the trading fee. Below is the representation of the cost variation in terms of percentages. The comprehension of it is discussed in the following sections. We will be looking into both the ECN model and the STP model.

ECN Model Account

Spread = 57 | Slippage = 3 |Trading fee = 5

Total cost = Slippage + Spread + Trading Fee = 3 + 57 + 5 = 65

STP Model Account

Spread = 60|Slippage = 3 | Trading fee = 0

Total cost = Slippage + Spread + Trading Fee = 3 + 60+ 0 = 63

Trading the GBP/HUF

The GBP/HUF is an exotic-cross currency pair, and the volatility in this pair is decent. As seen in the Range table, the average pip movement on the 1-hour time frame is 205. Here in the GBP/HUF pair, HUF is an emerging currency. We must know that the cost of trade decreases ad the volatility od the pair increases. But this should not be considered as an advantage because it is risky to trade high volatile markets as the price keeps fluctuations.

For instance, in the 1-hour timeframe, the maximum pip range value in this pair is 343 pips, and the minimum pip range value is 27 pips. When we compare the fees for both the pip movements, we find that for 27 pip movement fees is 270.74%, and for 343 pip movement, the fess is only 18.95%.

So, we can confirm that the prices are higher for low volatile markets and high for highly volatile markets. Hence we must always try to make our entries and exits when the volatility is minimum or average than to that of maximum values. But if your preference is absolutely towards reducing your trading costs, you may trade when the volatility of the market is around the maximum values.

Categories
Forex Course

96. Trading Breakouts using Pivot Points

-Introduction

We know that pivot points are no different from the typical support and resistance levels. We also saw how these levels were respected when trading a ranging market. But, could it used to trade breakouts? Let’s find out in this lesson.

Just like your normal Support and Resistance, the pivot levels don’t hold forever. At one point or the other, the price breaks out from these levels. In our range strategy, we always hit buy at the support and sell at the resistance. But there are times the market breaks from these levels and stops us out. When such things happen, we can develop another plan ready for the same and take advantage of it.

In the trading community, there are two types of traders: aggressive traders and conservative traders. And the approach to trade breakouts is different for both. So, we made two strategies to benefit the aggressive as well as the conservative traders.

The Pivot Points Breakout Strategy

Doing it the Aggressive way

The aggressive approach to trade breakouts is very simple. The strategy for such traders is to trigger the trade when the price breaks above resistance or below the support. The logic to this is that the resistance/support which was supposed to hold is now not being respected. It means that the opposite party is showing more strength. Hence, we will also be following the stronger side.

Aggressive traders are the ones to catch the initial move of the breakout. But there is high risk involved in these types of entries.

Trade Example

Below is the chart of GBP/CHF on the 15min timeframe. The pivot points are marked as shown. Initially, we can see that the price broke below S1 support. Here, aggressive traders can get in for a sell after the close of the candle. Later, the price continued to fall down and ended up breaking the S2 support as well. This could be another entry for the aggressive breakout traders.

Placements

As aggressive traders, it is important to have good risk management on the trades. The most basic necessity is the placement of stop-loss and take-profit orders. For the above trades, traders can keep the stop-loss just above the level they entered the trade. However, it would be better to place the stop-loss much higher than that level because we can stay safe from spikes. And a typical TP would be the next Support level. Refer to the above chart to get better clarity on it.

Doing it the Conservative way

The conservative approach is more of a safe approach to trade breakouts. According to this strategy, look to enter the trade when the price retests the level after breaking through that level. In trading terms, this is called the ‘role reversal’ concept. This concept simply means the turning of ‘support into resistance’ and ‘resistance into support.’ For example, when the price breaks below the support level, it is not a ‘support’ anymore; but is now ‘resistance.’ Now, let’s put this into action.

Consider the same chart shown above. We shall be looking if there are opportunities for conservative traders in the same market. In the below chart, we can see that the market broke below the S1. So, now we treat S1 as the resistance and prepare to sell when the price retraces to the S1 level. Similarly, we can enter for a sell when the price breaks below S2 and retests back to S2.

When it comes to the placement of stop-loss and take-profit, one can follow the same approach, as explained in the aggressive traders’ placement.

This brings us to the end of this lesson. Note that the above strategy is only to get an understanding of how to trade breakouts using pivot points. It is highly recommended to apply other technical tools to have more odds in your favor. Cheers.

[wp_quiz id=”69720″]
Categories
Forex Videos

Forex Timeframes & Trading Windows – Which To Choose!

Time frames And Trading Windows Tricks – Maximize Opportunities With Overlap

In this video presentation, we are going to be looking at time frames and trading windows. Although these two subjects are separate by looking at them together, we hope you will see the importance of combining them in one section.

When it comes to time frames, new traders are often confused about which time frames to trade and why. So let’s look at three different types of time frames and traders who prefer to use them.

You will most likely be trading on a short-term, medium-term, or long term time frame, depending on your preferences, including your strategy, lifestyle, and the size of your trading account. Everybody is different, and some traders may use a one-time frame or a combination of all three.

But this can cause a lot of confusion for new traders when they begin to develop their trading strategy. Many new Traders tend to want to be in and out of a trade very quickly, which means they fall into the group known as scalpers and tend to use 1-minute and 5-minute time frames.

Other traders tend to want to look for longer-term trends, but do not want their trades to roll over from one day to the next, in which case they might prefer to use 15-minute to 1-hour time frames, and these are known as intraday traders, and larger professionals, including institutional traders, will have a longer-term view and look at 4 hour time frames up to daily, weekly and even monthly time frames. These are commonly referred to as swing traders.
Scalpers team to only use 1-minute and 5-minute they might only be in a trade for 1 to 2 minutes. Whereas day traders might be in a trade all day long, and institutional long-term or swing traders might be in a trade for days, weeks, months, or even years.

One of the reasons why trading can be inherently difficult is because all of these traders have different ideas about where the price of a pair is heading based on the various time frames that are used by the various groups of time frames, and therefore the majority of them will all be trading at odds with each other, not only within their own time frame but the other time frames as well.

No matter what time frame you choose to use, it is always advisable to look at the longer-term time frames before you place a trade and then filter down to the time frame that you want to use because a great deal of price action sentiment can be gained from doing so. This is the only way that you will be able to see if trends are developing and trade accordingly. You may have heard of the phrase let the trains be your friend, well this is the best way to find a trend, by looking at a higher time frame than the one you want to use and then filter down once you have established what is happening to price action overall.


Example A. Traders can look to the higher time frame, such as the daily or weekly charts.

Example B. In order to establish what is happening with price action and to find out if trends are available or forming and then simply move down to their preferred time frame. By doing this, they will also be able to more clearly see prominent support and resistance areas which may be being observed by institutional traders, because, after all, this is where the real money is. Institutional traders are the ones that move the market. And so it is always advisable to know what they are doing at the higher time frames.

In summary, the type of time frame that you choose is dependent on the type of trader that you want to be, whether it is a quick in and out scalper style, or perhaps to take a longer longer-term view. But however, you trade it is always advisable to look at other time frames especially, especially longer-term ones than your preferred time frame, in order to help you pick your trade entry more easily.

Next, we are going to look at trading sessions. The forex market is broken up into major trading sessions.

Example C.  The Sydney session, the Tokyo session, the London session, which includes Frankfurt and a New York session. The forex market is open between 10 p.m. Sunday evening GMT and runs all the way through until 10 p, GMT on Friday, non-stop. However, the main centers will typically open at around 7 a.m. their time and finish at around 5 p.m. In other words, business hours. And where we can see on the graph that some of the sessions overlap.
That more centers overlap means that there are more players in the forex market at that time, and this means extra volume and liquidity and, therefore, greater moves in price action or potentially happen during these overlaps.

In summary, the best times I’m two trees are when two sessions overlap, and most volume and liquidity is provided during the London session, which includes Frankfurt and is also known as the European session, and where this overlaps with New York. This is the time of most activity. Generally speaking, in the forex market. Please remember to adjust your trading to reflect the seasonal changes due to daylight saving hours. The middle of the week tends to be the busiest because this is where we find more economic data releases normally. These affect market volatility.

With the worst times to trade being Sundays and Fridays, especially after the US session, public holidays where markets are thin, and volume is low, which means spreads will be at their widest, and during major news events where the markets can be extremely volatile.

Categories
Forex Basic Strategies

The ABC pattern: One of the Traders’ Favorites

Trading ABC pattern is one of the most frequently used trading strategies by Forex/financial traders. Once the price makes a breakout, makes a correction, and produces a reversal candle upon finding point C, traders trigger their entry. It is a favorite pattern among all kinds of financial traders. It brings profit at least on 80% occasions. In today’s lesson, we are going to demonstrate an example of an ABC pattern trading.

The chart shows that the price after being bearish has a double bounce at a level of support. It produces a bullish engulfing candle followed by another bullish candle. However, the price starts having consolidation. Since it is double bottom support, the buyers may keep their eyes on the chart.

The chart produces another bullish candle followed by a long bullish one. The price usually makes a correction after such a move. The buyers are to wait for the price to make a bearish correction and produce a bullish reversal candle to go long in the pair above the last highest high.

As expected, the price starts having the correction. It produces two bearish candles. The buyers hope that the chart produces a bullish engulfing candle closing above the last highest high to trigger a long entry. This is what pushes the price with more momentum. Let us find out what happens next.

The chart produces an inside bar. This is not a strong bullish reversal candle. However, the price finds its support. This is called the C point. If the price makes a breakout at the last highest high, the ABC pattern traders trigger a long entry.

The price makes a breakout closing well above the last highest high. The buyers may trigger a long entry right after the candle closes by setting stop loss below the last support (C point). Take Profit is to be set with 1R. Let us proceed to the next chart and find out how the trade goes.

The price heads towards the North with good bullish momentum. It produces two consecutive bullish candles and hits the target (1R). Here is an important point to remember. The ABC pattern is a widely used trading strategy. Thus, the price often reverses once it hits the target. Thus, the traders are recommended that they close the whole trade and enjoy the profit. Trailing Stop Loss and partial profit-taking do not work well in this pattern. Do some backtesting and get well acquainted with this pattern. It may bring you a handful of pips.

Categories
Forex Market Analysis

Daily F.X. Analysis, April 08 – Top Trade Setups In Forex – Choppy Sessions Continued! 

Daily F.X. Analysis, April 08 – Top Trade Setups In Forex – Choppy Sessions Continued! 

On the forex front, the U.S. dollar weakened against its major peers, with the ICE Dollar Index dropping 0.8% on the day to 99.91. Later in the day, the U.S. Federal Reserve will release its latest monetary meeting minutes. Whereas, the Bank of France will report Industry Sentiment Indicator for March (90 expected).

Economic Events to Watch Today     


EUR/USD – Daily Analysis

The EUR/USD rebounded 0.9% to 1.0895, snapping a six-day decline. Official data showed that German industrial production grew 0.3% on month in February (-0.8% expected). Previously, an uptick in German’s industrial production for February may not provide support to the EUR/USD because the futures tied to the S&P 500 futures are starting to reporting a 0.60% drop and will likely draw bids for the greenback during the day ahead. 

The European stocks remained on the upside, with the Stoxx Europe 600 Index gaining 1.9%. Germany’s DAX jumped 2.8%, France’s CAC rose 2.1%, and the U.K.’s FTSE 100 was up 2.2%, which is extending slight support to the single currency Euro.

Today, the European data docket is light, so apart from this, Federal Reserve’s March meeting minutes will be key to watch, which are scheduled to release at 18:00 GMT. While on the technical side, the immediate bias would remain bearish in the pair until the hourly chart descending trendline drawn from overnight highs is intact. 

Daily Support and Resistance

  • S1 1.0647
  • S2 1.0762
  • S3 1.0827

Pivot Point 1.0876

  • R1 1.0941
  • R2 1.0991
  • R3 1.1106

EUR/USD– Trading Tips

Looking at the 4-hour timeframe, the EUR/USD is trading within a symmetric triangle pattern, which is keeping the pair within 1.0922 – 1.0765 trading zone. Right now, the pair is trading at 1.0858, having an immediate support level of around 1.07990 and 1.0765. The EUR/USD violated the support level of 1.085, which is now working as a resistance. A bearish breakout of 1.07990 level may extend selling bias until the next support level of 1.0650 while the MACD has crossed over 0, converting the bearish sentiment into bullish. 

We can’t fully really on the MACD right now as the lack of trends in the market is causing its value to toss above and below 0, signaling a neutral bias. But the 50 periods exponential moving average is also keeping the EUR/USD in a bearish mode, extending an immediate resistance around 1.08856. So, let’s consider taking selling trades below 1.091 to target 1.0775 and bullish above the same to target 1.0946 today.

GBP/USD– Daily Analysis

The GBP/USD bounced 0.9% to 1.2340. The pair doesn’t seem to show much interest as the death toll from the coronavirus increased by 621 to 4,934. The total number of confirmed infections rose to 47,806. Apart from the coronavirus intensifying concerns, the GBP currency could remain bearish in the European trading hours, mainly due to the sluggish data. As in result, the U.S. 10-year Treasury yields remain flashing green around 0.68% with major Asian stocks marking gains.

At the Brexit front, the European Union and many others are forcing the Tory administration for the delay in the Brexit deadline while Cabinet Office Minister Michael Gove showing a willingness to leave talks unless there was a broad outline of a deal.

At the USD front, the U.S. Dollar taking bids on the day, as the S&P 500 futures slumped by 0.5%, indicating the risk-off sentiment in the global market after New York reported 731 deaths from coronavirus on Monday- the biggest daily rise. On the other hand, Spain’s daily losses of coronavirus deaths also increased for the 1st-time in 5-days.

Looking forward, investors will keep their eyes on every incoming detail about the virus for fresh direction. Moreover, Brexit headlines will also key to watch as the EU-UK policymakers are finalizing the timetable for further Brexit talks in April and May.

Daily Support and Resistance

  • S1 1.2075
  • S2 1.2201
  • S3 1.2269

Pivot Point 1.2327

  • R1 1.2395
  • R2 1.2453
  • R3 1.2578

GBP/USD– Trading Tip

On Wednesday, the GBP/USD continues trading around 1.2298 within a symmetric triangle pattern, which is supporting Sterling at 1.220 and along with resistance around 1.2490. On the 4-hour timeframe, the GBP/USD pair may find resistance around 1.2470, along with support around 1.2278. In the case of market breaks bellow 1.2278, we may see GBP/USD prices heading into the selling zone until 1.2100 and 1.2005. Whereas, the chances of buying remains solid over 1.2275 until 1.2520. The MACD and 50 EMA are also supporting the neutral bias, so let’s consider taking buying trades over 1.2209 with a target of 1.2400 and sell trades below 1.2335. 

USD/JPY – Daily Analysis

During Wednesday’s early Asian session, the USD/JPY currency pair flashing green and struggles to cross above the 109.00 level mainly due to the latest recovery in the U.S. Dollar in the wake of the risk-off market sentiment. Whereas, the fresh bid in the safe-haven Japanse yen is one of the key factors behind the limit to the pair’s gains. 

Right now, the USD/JPY pair is trading at 108.81 and consolidates in the range between the 108.50 – 109.00. Yesterday’s risk-on sentiment extended to Europe due to the optimism that the pace of new COVID-19 cases may be slowing, but the U.S. markets were failed to hold. Despite this, the U.S. Secretary of Housing said there are signs that COVID-19 cases in the U.S. could level out sooner than predicted.

At the USD front, the U.S. Dollar taking bids on the day, as the S&P 500 futures slumped by 0.5%, indicating the risk-off sentiment in the global market after New York reported 731 deaths from coronavirus on Monday- the most prominent daily rise. On the other hand, Spain’s daily losses of coronavirus deaths also increased for the 1st-time in 5-days.

At the U.K. front, the Foreign Secretary looking confident about the UK PM Boris Johnson’s health and said that he would recover from pandemic while describing him as a “fighter.” Moreover, Japan’s Prime Minister Abe has announced a state of emergency in Tokyo and 6-other provinces. He plans to control the economic fallout of COVID-19 as well as a substantial fiscal stimulus package. The package, worth ¥16.5trn, equates to 20% of GDP. Consequently, the USD/JPY currency pair is moving nowhere as investors seem confused about whether to buy USD/JPY over a stronger dollar or sell over the increased safe-haven appeal. 

Daily Support and Resistance

  • S1 105.37
  • S2 106.64
  • S3 107.08

Pivot Point 107.91

  • R1 108.35
  • R2 109.17
  • R3 110.44

USD/JPY – Trading Tips

As we can see on the 4-hour timeframe, the USD/JPY’s symmetric triangle pattern still remains intact, perhaps due to a lack of high impact economic events in the market. The USD/JPY is trading choppy above and below 108.884, and it’s strictly following a narrow trading range of 108.650 – 107.250. With that being said, the USD/JPY’s immediate support is likely to be found around 108.700. On the 4 hour timeframe, the Japanese pair has closed a bullish engulfing candle over 50 EMA, which is suggesting odds of more buying in the USD/JPY currency pair. 

The USD/JPY may exhibit further room for buying until 109.680, and violation of this can open more room for buying until 110.500 and 111.450. On the lower side, support continues to hold around 108.750. Let’s look for buying traders over 108.850 today.  

All the best for today! 

Categories
Crypto Market Analysis

Daily Crypto Review, Apr 8 – BCH and BSV halving countdown; Cryptos consolidating after a move up

The cryptocurrency market established its position after the gains it made yesterday. Bitcoin is currently trading for $7,338, which represents an increase of 0.76% on the day. Meanwhile, Ethereum gained 0.42% on the day, while XRP gained 1.33%.

CyberVein took the position of today’s most prominent daily gainer, with gains of 47.18%. Bytecoin lost 8.52% on the day, making it the most prominent daily loser.

Bitcoin’s stayed at the same place dominance-wise. Its value is now 64.25%, which represents a 0.1% difference to the downside when compared to yesterday.

The cryptocurrency market capitalization increased over the past 24 hours. Its current value is $209.34 billion. This value represents an increase of $4.65 billion when compared to the value it had yesterday.

What happened in the past 24 hours

Twitter CEO, as well as the founder of Square Jack Dorsey, has started a fund, which will help with fighting COVID-19. The fund is called Start Small LLC. Dorsey is seeding the fund with $1 billion, which is roughly 28% of his wealth.

Honorable mention

BCH/BSV

Bitcoin Cash will complete its block reward halving in the next 9 hours, with Bitcoin Satoshi’s Vision following shortly after.

By performing a block reward halving, Bitcoin Cash will cut its block reward from 12.5BCH down to 6.25BCH.

_______________________________________________________________________

Technical analysis

_______________________________________________________________________

Bitcoin

Bitcoin has spent the day consolidating and testing the upside and downside relative to the level it is in right now. The largest cryptocurrency tried to break the $7,420 resistance level many times, but with no success. It also tested the $7,085 level once again, but the bulls quickly reacted to the price going down and jumped in to help stabilize the market.


Bitcoin’s volume is slightly lower than yesterday, while its RSI dropped out of the overbought territory and is now at the value of 64.

Key levels to the upside                    Key levels to the downside

1: $7,420                                           1: $7,085

2: $7,750                                           2: $6,850

3: $8,000                                            3: $6,640


Ethereum

Ethereum spent the past 24 hours fighting to stay above the $168 level. After a sharp increase in price, ETH dropped down from $176 to $162. However, the ETH bulls jumped in and brought the price above the $168 resistance level, making it support.


Though Ethereum’s volume reduced by quite a bit, it is still elevated compared to the previous week. Its RSI level is currently at 69.

Key levels to the upside                    Key levels to the downside

1: $178.6                                             1: $168

2: $185                                              2: $158 

3: $193.6                                            3: $147.5


Ripple

XRP also tested where it will find a suitable place to consolidate. The price fluctuated between the $0.19 and $0.205, trying to find the stabilization point. XRP failed to break $0.205 to the upside, but also retested $0.19 right after failing to break to the upside. After failing to break to the downside as well, XRP consolidated right below the $0.2 level.


XRP’s volume is just slightly lower when compared to yesterday, while its RSI level is at 67.

Key levels to the upside                    Key levels to the downside

1: $0.2                                                1: $0.19

2: $0.205                                            2: $0.165

3: $0.227                                             3: $0.147

Categories
Forex Signals

USDJPY-Buy-stop

USDJPY Buy Stop Pending Order

The pair has been consolidating within a fairly tight range of only 70 pips on the 4-hour chart.  This period of consolidation is out of kilter with the number of fluctuations in price action we have seen over the last few weeks.  The safe-haven status of the yen currency is at risk due to the looming problems associated with the Coronavirus and the impact on the Japanese economy.

The Japanese government has stated that they are ready to declare a state of emergency in various provinces throughout Japan.  They have also indicated they are about to widen their stimulus package which will involve injecting trillions of yen into the economy.  This, coupled with the Japanese pension funds looking too heavily invest in other global funds, and various bond purchasing exercises, which will also involve millions of yen being injected to try and stimulate the Japanese economy and also to mitigate against the risk that the pandemic poses in Japan.

Therefore,  although this is a largely fundamental set up,  the downside in the pair looks to be stalling and where the previously mentioned measures by the Japanese government could cause weakness in the yen and therefore send this pair bid, at least to recent highs of around the 111.50 area, which will be our target.

Summary of the Trade
  • Order entry: Buy stop level at109.30
  • Stop-loss 108.50
  • Target 111.50
Risk:
Categories
Forex Market Analysis

Gold’s Ascending Triangle Breakout Continues to Play – COVID 19 Fears! 

On Tuesday, the precious metal gold prices slipped over 1%, reversing from a near one-month high hit earlier in the session, as symptoms of less than before coronavirus patients in major epicenters fueled equity markets, pulling away some of the gold safe-haven demand.

The yellow-metal prices broke its early consolidation phase and hit the 1-week high near the $1660 mark in the last hour. Whereas, the gold traders did not give any significant attention to the goodish pickup in the US bond yields as well. The gold is currently trading at 1,665.60 and consolidates in the range between the 1,638.30 – 1,669.95.

The buyers of gold ignored robust recovery in the global risk sentiment, which is supported by a reduction in the number of deaths from COVID-19 and which tends to weaken the metal’s perceived safe-haven demand. Meanwhile, the risk-on sentiment was further strengthened by a strong pickup in the US Treasury bond yields.

Daily Support and Resistance

Support     Resistance
1628.08     1687.6
1592.25     1711.3
1532.73     1770.83
Pivot Point 1651.78

A day before, the precious metal gold violated an ascending triangle, which was providing resistance at 1,636 level, and now it’s working as solid support. Closing of candles above this level is suggesting chances of more buying until the next resistance level of 1,671. While support continues to hold around 1,650 and then 1,636. The leading indicator MACD is also supporting the bullish trend in gold. 

Gold has shown some correction as it dropped today from 1,673 high to 1,650 level, but now it’s time to expect another bullish rally. Let’s consider taking bullish trades over 1,650 levels to target 1,662 and 1,671. Good luck!

Categories
Crypto Videos

Master Doji Candlestick Trading! Unlock Your Potential!

Profiting from the crypto market – Doji candle trading

Doji candlesticks

The Doji star, better known as the Doji candlestick, is a unique candle that signals indecision in the crypto market. It shows that neither the crypto bulls nor bears are in control. However, not everything is that simple. The Doji candlestick has five variations. Each one of them shows something different. This is why it’s important to understand how to spot and read different Doji candle variations.

The Doji candlestick is characterized by its cross-like shape. This happens when a cryptocurrency pair opens and closes at the exact same level leaving a very small or even non-existent body while also exhibiting upper and lower wicks of equal length. While Doji mostly represents indecision in the market, it can also indicate a slowing momentum of an existing trend.

Doji candle in technical analysis

The Doji candle can be a very important piece of information as it can provide crypto traders with a moment to stop trading and reflect. However, it is important to consider the Doji candle in conjunction with other tools when timing your market exit point.

Doji candle variations

While the traditional Doji star shows indecisiveness, other variations can have different implications.
The picture on the screen will show different variations of the Doji candlestick, as well as its outcomes.

Trading the Doji candlestick

Traders use various ways to trade various Doji candlestick patterns. However, they all look for signals that complement the Doji candlestick in order to execute high-probability trades.

Trading the Doji star


The chart shows the Doji star appearing right at the bottom of an existing downtrend. This Doji pattern suggests that neither bulls nor bears are in control, meaning that a trend reversal is possible. At this point, it is crucial to take a look at supporting signals from other tools and indicators. This example makes use of the stochastic indicator, which is currently in the oversold territory, which adds to the bullish bias.

A popular Doji trading strategy involves looking for Dojis, which appear near support and resistance levels. The chart highlights the Dragonfly Doji, which appeared near trendline support. In this case, the Doji doesn’t appear at the top of the uptrend, so it doesn’t mark a trend reversal. The Dragonfly Doji, in this case, shows the rejection of lower-level prices. This potential bullish signal is further supported by the candle appearing near the trend support.

Categories
Forex Assets

Analyzing The GBP/TWD Forex Currency Pair

Introduction to GBP/TWD

GBP stands for British pound sterling, and it is typically known as Pound. It is the official currency of the United Kingdom and some other countries like Jersey, South Georgia, and Guernsey. The pound is also the 4th most traded currency in the foreign exchange after USD, EUR & YEN. Whereas TWD is the abbreviation of The New Taiwan dollar. The central bank of Taiwan issues this currency.

GBP/TWD

Currency pairs are the national currencies from two countries coupled for being exchanged in reference to each other. In the Forex market, one currency is always quoted against the other. GBP/TWD is the abbreviation for the Pound sterling against the New Taiwan dollar. In this case, the first currency(GBP) is the base currency, and the second(TWD) is the quote currency.

Understanding GBP/TWD

In Forex, to find out the relative value of one currency, we need another currency to compare. If the value of the base currency goes down, the value of the quote currency goes up and vice versa. The market value of GBP/TWD determines the strength of TWD against the GBP. This can be easily understood as 1GBP is equal to how much of TWD. So if the exchange rate for the pair GBP/TWD is 37.093, it means we need 37.093 TWD to buy 1 GBP.

Spread

Forex brokers have two different prices for currency pairs: the bid and ask price. The bid price is the selling price, and ask is the buy price. The difference between the ask and the bid price is called the spread. Spread is basically a type of commission by which brokers make their money. Below are the ECN and STP for the pair GBP/TWD.

ECN: 49 pips | STP: 52 pips

Fees

Each time we place a trade, we need to pay some commission on it. A Fee is simply that commission we pay to the broker for opening a particular position. The fee also varies from the type of broker we use; for example, there is no fee on STP account models, but a few pips on ECN accounts.

Slippage

Slippage refers to the difference between the trader’s expected price and the actual price at which the trade is executed. It can occur at any time but mostly happens when the market is fast-moving and volatile. Also, sometimes when we place a large number of orders at the same time.

Ranges in GBP/TWD

The Range is a measure of volatility. It tells how much the currency pair has moved in a determined period. Whether a trader makes a profit or loss in a given time period depends on the movement of a currency pair and can be determined using the trading range table. It is a representation of the minimum, average, and maximum pip movement in a currency pair. This can be evaluated simply by using the ATR indicator combined with 200-period SMA.

Procedure to assess Pip Ranges

  1. Add the ATR indicator to your chart
  2. Set the period to 1
  3. Add a 200-period SMA to this indicator
  4. Shrink the chart so you can assess a significant period
  5. Select your desired timeframe
  6. Measure the floor level and set this value as the min
  7. Measure the level of the 200-period SMA and set this as the average
  8. Measure the peak levels and set this as Max.

GBP/TWD Cost as a Percent of the Trading Range

The cost of trade mostly depends on the broker and varies based on the volatility of the market. This is because the total cost involves slippage and spreads apart from the trading fee. Below is the representation of the cost variation in terms of percentages. The comprehension of it is discussed in the following sections. We will look into both the ECN model and the STP model.

ECN Model Account

Spread = 49 | Slippage = 3 |Trading fee = 5

Total cost = Slippage + Spread + Trading Fee = 3 + 49 + 5 = 57

STP Model Account

Spread = 52| Slippage = 3 | Trading fee = 0

Total cost = Slippage + Spread + Trading Fee = 3 + 52 + 0 = 55

Trading the GBP/TWD Forex Pair

The GBP/TWD is an exotic-cross currency pair and is a ranging market. A market is said to be ranging when the price hits the support and resistance at least three times. As seen in the Range table, the average pip movement on the 1-hour time frame is only 47. This clearly shows that if we trade in this pair, we will have to wait for a more extended period of time to get some good profit because of such a less movement in the pips.

Here in GBP/TWD, TWD is considered to be an emerging currency. Note that the higher the volatility, the lower is the cost of the trade. However, this is not an advantage as it is risky to trade highly volatile markets.

For example, in the 1M time frame, the maximum pip range value is 3009 and in minimum pip range, the value is 687. When we compare the fees for both the pip movements, we find that for 687 pip movement fees is 8.30%, and for 3009pip movement, fess is only 1.89%.

So, we can infer that the cost of trade is higher in the low volatile markets and high in the highly volatile markets. It is recommended to trade when the volatility is around the minimum values. The volatility here is low, and the costs are a little high compared to the average and the maximum values. But, if our priority is not towards reducing costs, we may trade when the volatility of the market is around the maximum values.

Categories
Forex Market Analysis

Daily F.X. Analysis, April 07 – Top Trade Setups In Forex – Risk-off Sentiment In Play! 

On the forex front, the ICE U.S. Dollar Index was little changed on the day at 100.79. On Tuesday, eyes will be on the series of low impact economic events from the Eurozone, U.K., and U.S. economy, but these may not drive major price action in the market. So we should focus on the technical side of the market. The German Federal Statistical Office will report February industrial production (-0.9% on month expected).

France’s INSEE will release the February trade balance (5.05 billion euros deficit expected). The U.S. Labor Department will report JOLTS job openings for February (6.5 million expected). The Federal Reserve will post February consumer credit (+14.0 billion dollars expected).

Economic Events to Watch Today     


EUR/USD – Daily Analysis

The EUR/USD slipped 0.1% to 1.0796, down for a sixth straight session. Official data showed that German factory orders dropped 1.4% on month in February (-2.5% expected). On the other hand, the eurozone Sentix Investor Confidence Index declined to -42.9 in April (-37.5 expected) from -17.1 in March.

The uptick in German’s industrial production for February may not provide support to the EUR/USD because the futures tied to the S&P 500 futures are starting to reporting a 0.60% drop and will likely draw bids for the greenback during the day ahead.

In the meantime, if the German data represents that the manufacturing output was already facing a renewed recession ahead of COVID-19 concerns seen in March, the EUR currency may draw offer, possibly testing support at 1.0770.  

It is worth mentioning that Industrial Production usually releases by the Statistisches Bundesamt Deutschland, which measures outputs of the German factories and mines. Whereas, the changes in industrial production are broadly watched as a significant sign of strength in the manufacturing sector. A high figure is understood as positive or bullish for the EUR. Hence, a low reading is seen as negative (or bearish). The German Federal Statistical Office will report February industrial production (-0.9% on month expected).

Daily Support and Resistance

  • S1 1.0653
  • S2 1.0732
  • S3 1.0769

Pivot Point 1.081

  • R1 1.0847
  • R2 1.0889
  • R3 1.0967

EUR/USD– Trading Tips

On Tuesday, the EUR/USD is trading bearish at 1.088, having an immediate support level of around 1.07990. On the 4-hour chart, the EUR/USD has violated the support level of 1.085, which is now working as a resistance. A bearish breakout of 1.07990 level may extend selling bias until the next support level of 1.0650. While the MACD is staying below 0, supporting the odds selling movements in the market. At the same time, the 50 periods exponential moving average is also keeping the EUR/USD in a bearish mode. Bearish crossover of 1.081 area can open further room for selling until 1.065 level. So, let’s consider taking selling trades below 1.081 and bullish above the same to target 1.0946 today.

GBP/USD– Daily Analysis

The GBP/USD lost 0.3% to 1.2224. U.K. Prime Minister Boris Johnson has been admitted to intensive care as his coronavirus symptoms worsened. Meanwhile, the Markit U.K. Construction PMI slid to 39.3 in March (44.0 estimated) from 52.6 in February.

As per the latest report, the death toll from the coronavirus increased by 621 to 4,934. The total number of confirmed infections rose to 47,806. Apart from the coronavirus intensifying concerns, the GBP currency could remain bearish in the European trading hours, mainly due to the sluggish data. As in result, the U.S. 10-year treasury yields remain flashing green around 0.68% with major Asian stocks marking gains.

At the coronavirus front, the decreasing fear of coronavirus is also the reason behind the risk-on market sentiment. While the declining figures from Spain, Italy, and the U.K., the recent decline in the British death losses from the top of April 04 figures of 708 to 439 providing support to the market, but it seems doubtful as per the experts.

At the USD front, the U.S. dollar losing its bullish momentum on the day, mainly due to the risk recovery sentiment in the market. The fresh stimulus package hints from the U.S. also keeps the USD lower. Looking forward, investors will keep their eyes on the coronavirus updates. As well as, the government/central bank struggles to control the deadly disease will also be essential to watch for near-term direction.


Daily Support and Resistance

  • S1 1.1909
  • S2 1.21
  • S3 1.2184

Pivot Point 1.229

  • R1 1.2375
  • R2 1.248
  • R3 1.267

GBP/USD– Trading Tip

The GBP/USD is trading at 1.2330 within a symmetric triangle pattern, which is supporting Sterling at 1.220 and along with resistance around 1.2490. On the 4-hour timeframe, the GBP/USD pair may find resistance around 1.2470, along with support around 1.2278. In the case of market breaks bellow 1.2278, we may see GBP/USD prices heading into the selling zone until 1.2100 and 1.2005. Whereas, the chances of buying remains solid over 1.2275 until 1.2520. The MACD and 50 EMA are also supporting the bullish bias, so let’s consider taking buying trades over 1.2209 with a target of 1.2400. 

USD/JPY – Daily Analysis

During Tuesday’s Asian session, the USD/JPY currency pair failed to continue its 3-days winning streak and faced some fresh supply while dropped to 108.67 level, mainly due to modest declines in the U.S. dollar in the wake of risk-on market sentiment. The fresh recovery in the risk market weakened the safe-haven JPY and collaborated the pair limit the downside. The USD/JPY is trading at 108.79 and consolidates in the range between the 108.67 – 109.28.

The decreasing number of new coronavirus cases is also the reason behind the risk-on market sentiment. While the declining figures from Spain, Italy, and the U.K., the recent decline in the British death losses from the top of April 04 figures of 708 to 439 providing support to the market and weakened the Japanese yen’s safe-haven status.

Moreover, the risk-on market sentiment could also be attributed to the fresh pickup in the U.S. Treasury bond yields. The Japanese government is showing a willingness to declare a state of emergency for Tokyo, and other big cities further weighed on the Japanese yen, which was also seen as a factor helping limit the downside.

On the other hand, the United States President Donald Trump is also showing a readiness to declare another aid package after the House Speaker Nancy Pelosi gave hints for the same. The risk sentiment got a boost, driving the Japanese yen higher.

Daily Support and Resistance

  • S1 105.37
  • S2 106.64
  • S3 107.08

Pivot Point 107.91

  • R1 108.35
  • R2 109.17
  • R3 110.44

USD/JPY – Trading Tips

The USD/JPY is also forming a symmetric triangle pattern on the 4-hour chart in the wake of thin volatility and trading volume in the market. The USD/JPY is trading choppy around 108.884, still staying above previously violated the choppy trading range of 108.650 – 107.250. With this, the USD/JPY’s best immediate support is likely to be found around 108.700. On the 4 hour timeframe, the Japanese pair has closed a bullish engulfing candle over 50 EMA, which is suggesting odds of more buying in the USD/JPY currency pair. The USD/JPY may exhibit further room for buying until 109.680, and violation of this can open more room for buying until 110.500 and 111.450. On the lower side, support continues to hold around 108.750. Let’s look for buying traders over 108.850 today.  

All the best for today! 

Categories
Crypto Market Analysis

Daily Crypto Review, Apr 7 – BTC secures its place above $7,000; Altcoins surge with ETH leading the way

The cryptocurrency market had another great day while Bitcoin established its price above the $7,000 level. Altcoins increased in value significantly, with many of them surpassing Bitcoin’s gains. Bitcoin is currently trading for $7,330, which represents an increase of 3.92% on the day. Meanwhile, Ethereum gained an astonishing 15.08% on the day, while XRP gained 7.36%.

Digibyte took the position of today’s most prominent daily gainer, with gains of 20.97%. Swipe lost 1.16% on the day, making it the most prominent daily loser.

Bitcoin’s lost some dominance in the past 24 hours as many altcoins surpassed its gains. Its value is now 64.35%, which represents a 1.15% difference to the downside when compared to yesterday.

The cryptocurrency market capitalization increased considerably over the past 24 hours. Its current value is $204.99 billion. This value represents an increase of $7.87 billion when compared to the value it had yesterday.

What happened in the past 24 hours

The Bank of Korea has launched a new pilot program for its central bank digital currency. This launch came rather early as Korea was afraid some other country could take the lead in the industry.

The South Korean central bank reevaluated the CBDC proposal after closely observing what other developed nations, such as Japan and the US, were doing.

Honorable mention

Steem

Tensions between Steem and the Hive community continue to escalate as Steem executes a soft fork so it could freeze up to 20 accounts that were owned by the network’s former witnesses.

These frozen accounts hold around 17.6 million STEEM, which is worth approximately $3.2 million and equates to nearly 5% of Steem’s total supply.

_______________________________________________________________________

Technical analysis

_______________________________________________________________________

Bitcoin

Bitcoin bulls pushed the price up yet again, establishing the level above $7,000. On top of that, Bitcoin broke many resistance levels. Besides $6,850, which was broken yesterday,Bitcoin went through the 7,085 one as well. However, the $7,420 level stopped its uptick as there was simply no pressure to reach above that one too.


Bitcoin’s volume increased slightly, while its RSI on the 4-hour chart is deep in the overbought, standing at the value of 76.

Key levels to the upside                    Key levels to the downside

1: $7,420                                           1: $7,085

2: $7,750                                           2: $6,850

3: $8,000                                            3: $6,640


Ethereum

Ethereum had a fantastic day as ETH bulls pushed its price up more than 15%. The second-largest cryptocurrency pushed through $147.5 and $158 and $168 resistances, only to be stopped at the $178.6 resistance level. This parabolic move is pretty unstable and might require a pullback to stabilize.


Ethereum’s volume increased substantially, while its RSI level is unbelievably high, sitting at 89.5.

Key levels to the upside                    Key levels to the downside

1: $178.6                                             1: $168

2: $185                                              2: $158 

3: $193.6                                            3: $147.5


Ripple

XRP had a great couple of days, with its price constantly rising. However, the past 24 hours were especially great as XRP managed to break its $0.19 resistance level. The move was stopped by the $0.2 key level as there wasn’t enough bullish presence.


XRP’s volume almost doubled during the spike, while its RSI level went deep into the overbought territory, currently sitting at 85.

Key levels to the upside                    Key levels to the downside

1: $0.2                                                1: $0.19

2: $0.205                                            2: $0.165

3: $0.227                                             3: $0.147

Categories
Forex Price-Action Strategies

Breakout Confirmation Candle and the Difference It Makes

Breakout trading strategy traders first wait for the breakout with good momentum. Then, they are to wait for the breakout confirmation candle. A breakout can be confirmed in two ways. It can take the price towards the trend, or it could come out as in inside bar reversal candle. As long as the candle closes below the breakout level, it confirms the breakout. However, these two types of breakout confirmation push the price towards the trend a bit differently. In today’s article, we are going to demonstrate an example of this.

The price after being bearish makes a bullish correction. The last candle comes out as a bearish pin bar. This is a strong bearish reversal signal. The sellers are to wait for the price to head towards the level of support, where the price has a bounce earlier.

The price heads down with good bearish momentum. It seems that it is going to make a breakout at the drawn level. The breakout sellers are to keep their eyes on the pair closely to take a short entry upon a bearish breakout and breakout confirmation.

Here it comes. The last candle breaches the level of support closing well below it. This is an explicit breakout, which the sellers wait for. If the next candle confirms the breakout, the sellers may drive the price towards the South further.

The next candle comes out as a bullish inside bar. However, it closes within the breakout level. It means the breakout is valid. It is not an A+ breakout confirmation. It offers less reward and does not drive the price towards the trend with good momentum. If the candle came out as a bearish candle closing below the breakout candle, it would be a different ball game. The price may make a move towards the downside by offering 1R at least. Let us see what happens here.

The next candle comes out as a bearish candle. Some sellers may trigger a short entry. In most cases, it does not travel as far as it has traveled to offer the entry.

It produces a strong bearish candle. It seems that the sellers are in control. The question is whether it travels the same distance of Stop Loss-Entry or not. Let us find out from the next chart.

The price starts making an upward correction. It goes back within the breakout level. This chart does not look good for the sellers any more unless it makes a bearish breakout at the last lowest low.

We have seen that the breakout candle and breakout momentum are good. However, the price does not head towards the trend and travel the distance as it usually does. This is what happens if the breakout confirmation candle comes out as an inside bar reversal candle. Thus, it is best if we skip taking such entry.

Categories
Forex Elliott Wave

Validation Rules on Impulsive Waves – Intermediate Level

Introduction

In our previous articles, we have seen that impulsive waves have construction rules. However, some rules, or principles, allow the wave analyst to validate or confirm each guideline. These rules are divided into two groups, which we will detail in this educational article. 

First Rule – Validation of the Trend Line 2-4

This rule will apply once the impulsive pattern ends. The wave analyst must trace the trendline joining the end of waves 2 and 4. Then, the impulsive wave will be confirmed if the price action pierces the trendline 2-4 in the same or less proportion of time it took to form wave 5.

In case the fifth wave takes longer, the price develops a terminal structure or wave 4 that has not still ended, another possibility is the wave analyzed does not correspond to an impulsive formation, but to a corrective wave.

Second Rule – Retracement from the fifth wave

Within an impulsive wave, the wave analyst must recognize which the extended segment is. Depending on this factor, it will be possible to determine the level at which the price could fall, determined by the wave 2 and 4 price range within the momentum structure.

First Wave Extension

In this case, the retracement should go to the end of wave 4. However, if the price extends its retracement beyond the end of wave 4, then the impulsive wave will end up with a larger correction in terms of price and time.

Third Wave Extension

The price has to return to the fourth wave area of ​​the impulsive pattern and will generally finish near the end of that wave. If the retracement comprises more than 61.8% of the complete motive sequence, then the third wave would involve a higher degree impulse wave completion.

Fifth Wave Extension

When the extension appears in the fifth wave, the price should reverse at least 61.8% of that wave, although it might not retrace the complete wave. If the price retraces the complete progression of the fifth wave, then the retracement would complete a higher degree pattern.

In this case, the following could happen:

  1. The fifth wave extension pattern is part of a higher degree impulse, which is also a fifth wave extension, or
  2. The extension of the fifth wave is a wave C of a flat pattern or a zigzag.

Fifth Wave Failure

A fifth wave failure occurs when wave 5 of an impulsive sequence is shorter than wave 4 high. It generally occurs when the opposing trend is stronger than the initial impulsive movement trend. Consequently, if the wave analyst detects this type of failure, it should notice that the movement following the fifth wave is highly likely to reverse the forward movement of the impulsive movement completely.

On the other hand, if the motive movement was bullish, there should not be further highs until the price has fully retraced the impulsive bullish sequence. This affirmation is analogous if the impulse is bearish.

Conclusions

In this educational article, we have seen how to validate an impulsive sequence in terms of its correction. Also, we commented on the potential of the next path, respecting the fifth wave retracement and what is the extended wave in the impulsive sequence.

Likewise, we have seen the case of the failure in a fifth impulsive wave and what will be the impact in the next movement.

In the next educational article, we will see the process of validation of corrective structures.

Suggested Readings

  • Neely, G.; Mastering Elliott Wave: Presenting the Neely Method; Windsor Books; 2nd Edition (1990).


Categories
Crypto Videos

Make Crypto Trading Profits Using Forex Techniques – The Three Line Strike!


Generate profit trading cryptocurrencies – Three Line Strike

Many traders rely only on indicators, while only a few take into consideration patterns that appear in the market. Even fewer people are spotting small candlestick patterns, which they might think of as insignificant. However, they are far from insignificant.

Three Line Strike

A three-line strike represents a continuation group of candlesticks that is formed by three candlesticks in the direction of a trend, then followed by a final candlestick that pulls back to the starting point.
There are two versions of a three-line strike: Bullish/Bearish

The bullish three line strike consists of three strong bullish candlesticks that close higher than the last one, then followed by a final candle, also known as the strike candle. The strike candle goes in the opposite (bearish) direction and opens at or higher than the third candlestick, but closes below the open of the first candle in the pattern.

A bearish three line strike is everything, but in reverse, three strong descending candles that close progressively lower followed by a bullish strike candlestick. The strike candle opens at or lower than the third candle close and closes above the first candlestick open.

Validating the pattern

To validate this pattern, we need to confirm that the first three candles are at least of average size. They need to have a defined stair-case like appearance in order to be reliable.
A bullish three line strike should be treated as an extension of the three white soldiers pattern, while a bearish three line strike as an extension of the three black crows pattern.

Market Sentiment

The assumption behind the three-line strike amongst traders is that the strike candle shows a temporary correction that will not be prolonged, while the main trend will follow the first three candles. The pullback of the strike candle is a reaction to the strong move to one direction in the first part of the pattern.

Buyers should use the low point of the pattern to create an entry opportunity. Sellers, on the other hand, should use the high point of the pattern to create an opportunity to sell high.

Three Line Strike Reliability

The three-line strike is not a very common pattern in cryptocurrencies. However, it is quite reliable when paired up with volume indicators, and traded with the larger time frame trend. A thing to note is that the bearish three line strike is slightly more reliable than the bullish one when it comes to crypto trading.

While the bearish pattern was accurate over 60% of the time, the bullish one was accurate, only 50% of the time.
Bullish Three Line Strike – Example
The example will show a chart which created a bullish three line strike. The first three candlesticks lined up in a three white soldiers formation, signaling reliability.

A buy signal was confirmed when the low of the strike candle reached below the first candle open.
Bearish Three Line Strike – Example
This example will show a chart that illustrates a bearish three line strike. The high of the strike candle does not reach the open of the first candle, but remains within tolerance levels, and is close enough to be classed as a bearish continuation.

Categories
Forex Videos

Combine Fundamental &Technical Analysis To Master Forex


Combine Fundamental & Technical Analysis To Master The Forex Market

In this video, we will be looking at combining fundamental and technical analysis, which are the yin and yang of forex trading. Professionals, including institutional traders, tend to take a balanced approach when incorporating fundamental and technical analysis into their trading. Whereas some professional traders will lean towards fundamental analysis and incorporate technicals into where they see price action going based on current or future economics. However, many retail traders tend to lean towards technical analysis.
Traders who wish to be more rounded need to take both of these into consideration in order to be more consistent, and this involves having a good knowledge base of both.

Fundamental data releases can offer us the directional bias when trading. As well as waiting for the release, markets will often anticipate price action direction leading up to an economic data release, especially if analysts believe the data is going to be above or below expectations. And therefore, it is important to try and second guess what the markets are expecting in the run-up to the release and then where price action will go once the data has been delivered into the market. For example, sometimes market data might be worse than expected by the markets, and yet price action goes in the reverse direction as you might expect. This is one of the reasons we see a lot of volatility surrounding high-level data releases, which is because people have varying opinions on the effects of the data.
However, traders are advised to play the probability game; i e., if the market data release is bad, we should expect bearish price action, and if the market data is good, we should expect bullish price action. If technical indicators subsequently work in line with the data, and in line with the fundamentals of the data release, then we should trade accordingly Having pinpointed an ideal entry. This way, we will be stacking the odds in our favor for a successful trade.
There are many ways to incorporate fundamental and technical analysis into your trading, but in this video, we will be looking at three methods.

Method 1, Involves breakout trading with fundamental analysis, which capitalizes on training when a section breaks outside of its trading range.

Example A, the catalyst for range breakouts is usually due to the release of market data news events And where such data causes extra volume to come into a particular currency pair yeah and push it outside of a consolidation range into new highs or new lows depending on the nature of the release. Because data releases can cause extra market volatility, it is always wise to air on the side of caution when trading around such events. Previous support and resistance levels can be breached, and a great deal of uncertainty can enter into the market, and at this time, it is always advisable to use tight stop losses.


Example B, Once our support or resistance line, is breached on an economic data release we can assume that the market has taken the data in one of two ways, and in this example, we have a dovish stance towards the Canadian dollar and whereby this particular pair, the USDCAD, has reacted in a bullish direction. Therefore we have bad economic data coming into the market about the Canadian economy, and this is supported by a price action breaching the line of resistance and where price action subsequently moves in an upward direction and whereby we should only be considering a buy trade.

By planning around data releases, we can look for technical breakouts, adjust positions accordingly incorporating tight stop losses, and even utilize the data release to leave us in a trade in order to maximize profits. Remember, the art of trading is to latch onto trends because that is where the most amount of pips are to be gained.

Method 2 combines range-bound trading with fundamental analysis.

Example C, Range bound trading involves identifying a trend with the use of a couple of simple Lines, which show us support and resistance levels and areas where the price is likely to bounce off of the support or resistance in order to maintain the price action range.

Traders use the support and resistance lines to buy at the support line in an ascending trend and to sell at the resistance line in a declining trend. Example D, This example shows a chart with a strong bearish trend.

We do not want any news data release to potentially adversely affect our descending trend and interfere with our profitable trade. Therefore, ideally, we would look to not have open trades surrounding data releases, especially if they are potentially of a high impact nature. Therefore precautions should be taken to avoid trading around high impact news events, but if you find yourself in an open and profitable trade with a looming data release, which might be of high impact in nature, we suggest you close the trade, or partially close the trade, or insert tight stop losses in order not to reverse the profits you have made on a successful range bound trade.


Method 3, Using oscillators with fundamental analysis. Example E, Oscillators are often used in technical analysis. They are often used to establish overbought or oversold conditions. Here, in this chart, we can see one such oscillator, the RSI, or relative strength indicator.


Example F, By incorporating oscillators such as the RSI, we are easily able to identify areas where price action might reverse having been oversold or overbought, and if these coincide with support and resistance lines on our chats, we must be aware of this and be prepared to take the necessary action. However, should these also coincide with new data releases, we should give them extra emphasis because even if the data goes in line with our chart, and yet our charts are telling us that the market is overbought or oversold, we could see conflicting price action.
Therefore please take all of these into consideration when setting up your next trade and consider adopting some of these methods into your trading strategy. Remember that new data releases, especially of a high-impact nature, can cause extreme market volatility.

Categories
Forex Market Analysis

Daily F.X. Analysis, April 06 – Top Trade Setups In Forex – Risk-off Sentiment In Play! 

On the forex front, the U.S. dollar continued to see safe-haven buying. The ICE U.S. Dollar Index rose 0.4% on the day to 100.58, extending its rally to a third straight session. Later today, the Research firm Markit will publish March U.K. Construction PMI (44.0 expected). The eurozone Sentix Investor Confidence Index for April will be released (-37.5 expected). The German Federal Statistical Office will report February factory orders (-2.5% on month expected).

Economic Events to Watch Today     


EUR/USD – Daily Analysis

The EUR/USD slid 0.5% to 1.0809, posting a five-day losing streak. Official data revealed that the eurozone’s retail sales surged 0.9% on month in February (+0.1% expected). Later today, the eurozone Sentix Investor Confidence Index for April will be released (-37.5 expected).

Speaking about the Germans Factory orders data, this data release by the Deutsche Bundesbank, which indicates the shipments, inventories, and new orders. A surged in the factory order total may show progress in the German economic growth, and it could also be a factor to boost inflation.

It is worth noting that the German Factory influences by two-ways either positively or negatively, the total Eurozone GDP. A high figure is considered as a positive or bullish for the EUR, while a low reading is negative.

Therefore, the pair could drop to 1.0773 previously low on mixed Ferman data. Moreover, if the greenback catches fresh bids on the turnaround in the risk sentiment, the EUR/USD currency pair could suffer in a more profound drop below 107.00 ahead.

As per the coronavirus latest report, the cases rose by 3,677 in Germany when compared with Sunday’s 5,936 new infections, showing the 4th-straight drop in the daily rate. The death toll rose by 92. Consequently, the EUR/USD is suffering badly and may trade sideways as the dollar also suffers alongside. 


Daily Support and Resistance

  • S1 1.0653
  • S2 1.0732
  • S3 1.0769

Pivot Point 1.081

  • R1 1.0847
  • R2 1.0889
  • R3 1.0967

EUR/USD– Trading Tips

The EUR/USD is trading bearish at 1.080, having an immediate support level of around 1.07990. On the 4-hour chart, the EUR/USD has violated the support level of 1.085, which is now working as a resistance. As of now, a bearish breakout of 1.07990 level may extend selling bias until the next support level of 1.0650. While the MACD is staying below 0, supporting the odds selling movements in the market. 

At the same time, the 50 periods exponential moving average is also keeping the EUR/USD in a bearish mode. Bearish crossover of 1.081 area can open further room for selling until 1.065 level. So, let’s consider taking selling trades below 1.081today.

GBP/USD– Daily Analysis

The GBP/USD sank 1.1% to 1.2262. The Markit U.K. Construction PMI for March will be released later in the day (44.0 expected). As per the latest report, the coronavirus cases rose to 33,718 as of 08:00 GMT on April 02, whereas there was a 24% rise in the death toll to 2,921 at the same time.

Meanwhile, the Washington Governor extended the stay-at-home order, whereas S&P declared its U.S. rating at AA+ with expectations of a recovery in 2021. As in result, the market’s risk-tone remains moderately heavy with the U.S. 10-year treasury yields dropped below 0.60%, and most Asian stocks are also flashing red.

As per the latest report, the death toll from the coronavirus increased by 621 to 4,934. The total number of confirmed infections rose to 47,806. Apart from the coronavirus intensifying concerns, the GBP currency could remain bearish in the European trading hours mainly due to the sluggish data, which is released early Monday and showed the British consumer confidence declined to the weakest since February 2009. 

On the flip side, the USD has ignored 7 million drops in the U.S. jobs for March, because the upbeat US ISM Non-Manufacturing PMI boded well for the greenback. However, the U.K. Services PMI data for March was revised down to 34.5 points, which will likely push the GBP lower.

Looking forward, the headlines related to the PM Johnson’s condition will remain driver seats. The U.S. dollar dynamics also will be critical to watch for fresh directions. Meanwhile, traders, all eyes will be on the U.K. government COVID-19 meeting, which is scheduled to happen at 0815GMT for new trading impetus. The meeting will be chaired by the U.K. Foreign Secretary Raab and include the advisers and officials.


Daily Support and Resistance

  • S1 1.1909
  • S2 1.21
  • S3 1.2184

Pivot Point 1.229

  • R1 1.2375
  • R2 1.248
  • R3 1.267

GBP/USD– Trading Tip

The technical side of the GBP/USD hasn’t changed much as it continues trading sideways in between the same trading range of 1.2275 – 1.2425. On the 4 hour timeframe, the GBP/USD is forming neutral candles despite worse than expected NFP figures from the U.S. Hence, the pair has gained slight support and recovered over 1.2265 resistance level, which is now working as a support. 

On the 4-hour timeframe, the GBP/USD pair may find resistance around 1.2470, along with support around 1.2278. In the case of market breaks bellow 1.2278, we may see GBP/USD prices heading into the selling zone until 1.2100 and 1.2005. Whereas, the chances of buying remains solid over 1.2275 until 1.2520.

USD/JPY – Daily Analysis

During Monday’s Asian session, the USD/JPY currency pair flashing green and continue to gaining its traction for the 3rd-consecutive session mainly due to fresh risk recovery in the market.

The U.S. bond yields exhibited an uptick, which is providing support to the greenback and also kept the USD/JPY pair higher. Right now, the USD/JPY is trading at 109.25 and consolidates in the range between the 108.37 – 109.38.

However, the USD/JPY pair added to its intraday gains and rose further beyond the 109.00 round-figure marks, hitting fresh one-week tops in the last hour. A fresh drop in the death and cases of coronavirus gave a high relief to the trader. Whereas, the strong gain in the U.S. equity futures weakened the Japanese yen’s safe-haven demand.

On the other hand, the reason behind the Japanese bearish bias could also be TBS News report that the Japanese government is considering 6-months for a state of emergency declaration to control the coronavirus outbreak in Tokyo.

Daily Support and Resistance

  • S1 105.37
  • S2 106.64
  • S3 107.08

Pivot Point 107.91

  • R1 108.35
  • R2 109.17
  • R3 110.44

USD/JPY – Trading Tips

Technically, the USD/JPY pair is trading bullish a 109.177, having violated the choppy trading range of 108.650 – 107.250. With this, the USD/JPY’s best immediate support is likely to be found around 108.700. On the 4 hour timeframe, the Japanese pair has closed a bullish engulfing candle over 50 EMA, which is suggesting odds of more buying in the USD/JPY currency pair. 

With this, the USD/JPY may exhibit further room for buying until 109.680, and violation of this can open more room for buying until 110.500 and 111.450. On the lower side, support continues to hold around 108.750. Let’s look for buying traders over 108.850 today.  

All the best for today! 

Categories
Forex Daily Topic Forex Price-Action Strategies

Do Not Give Up Until It Is Void

Forex traders have to have no given up attitude. With patience, discipline, and diligence they have to stick with a chart unless it is completely messed up. In today’s lesson, we are going to demonstrate an example of this.

The chart shows that the price makes a strong bearish move. It finds its support and heads towards the North for an upward correction. Look at the last candle on the chart. This comes out as a bearish engulfing candle, which the sellers wait for in such price action. If the price heads towards the downside and makes a breakout followed by a breakout confirmation, the sellers are going to trigger a short entry. Let us proceed to the next chart.

The sellers do not expect this. The price does not head towards the downside. It rather goes towards the North and roams around the level of resistance. It is painful for the sellers. However, observe on the chart that the level of resistance is still intact. The price may head towards the North but the sellers still have a chance. Let us see what happens next.

The sellers are on their toes again. The chart produces an inverted hammer followed by another long bearish candle. If the price makes a breakout and confirms that, the sellers are going to trigger a short entry.

Here comes the breakout candle. A good-looking bearish candle breaches the level of support closing well below it. This is an explicit breakout. The sellers are to wait for the next candle to close below the lowest low of the breakout candle to trigger the entry.

The next candle comes out as a bearish candle closing well below the breakout candle. The sellers must not waste a second here but trigger the entry right after the last candle closes. A dead-looking chart for the sellers ends up producing entry. Let us proceed to the next chart to find out how the trade goes.

The price heads towards the South in a hurry. It is quite a big bearish move, which offers more than 1R. A trade setup works wonderfully well for the sellers.

Let us recap the entry again. It looks good at the beginning. The price then goes towards the upside and it seems that it may not offer a short entry. The price finds its resistance at the same level; makes a breakout followed by a breakout confirmation. As far as breakout strategy is concerned, the sellers trigger a short entry and make a profit out of it. This is why traders must not give up but stick with the chart as long as it’s valid to produce a signal.

Categories
Crypto Market Analysis

Daily Crypto Review, Apr 6 – Bitcoin above $7,000 – but will it stay there?

The cryptocurrency market had quite a good day as volume increased, and bulls gathered. Bitcoin led the market up to new highs and finally broke the $7,000 mark. It is currently trading for $7,067, which represents an increase of 4.33% on the day. Meanwhile, Ethereum gained 5.27% on the day, while XRP gained 3.39%.

Zilliqa took the position of today’s most prominent daily gainer, with gains of 16.97%. Steem lost 4.14% on the day, making it the most prominent daily loser.

Bitcoin’s dominance stayed at almost the same place over the weekend. Its value is now 65.5%, which represents a 0.23% difference to the downside when compared to Friday.

The cryptocurrency market capitalization increased greatly over the weekend. Its current value is $197.12 billion. This value represents an increase of $7.33 billion when compared to the value it had on Friday.

What happened in the past 24 hours

Michael Stay, a former Google’s software engineer as well as the current CTO of a DApp company Pyrofex, claims to have successfully hacked a certain zip file containing the private keys leading to over $300,000 in Bitcoin (BTC).

Honorable mention

Ripple

A new blockchain course that the Australian National University law school is offering this year now has full support from Ripple’s University Blockchain Research Initiative.

This partnership between ANU and UBRI will work on finding out more about how blockchain can disrupt the legal industry.

_______________________________________________________________________

Technical analysis

_______________________________________________________________________

Bitcoin

Bitcoin bulls pushed to reach new highs all throughout the weekend. The price went far above the resistance line of $6,850 three times, but came back quickly the past 2 times. This is the third time that its price has crossed the resistance. However, all three times, there wasn’t enough buying power to reach above $7,085. If Bitcoin doesn’t hold its gains, bears might get courageous and attack the downside.


Bitcoin’s volume increased compared to the previous week, while its RSI level on the 4-hour chart is 65.

Key levels to the upside                    Key levels to the downside

1: $7,085                                           1: $6,850

2: $7,420                                           2: $6,640

3: $7,750                                            3: $5,960


Ethereum

Ethereum followed Bitcoin in its jump up and even outperformed it. The second-largest cryptocurrency passed its $139 resistance level (for the first time, unlike Bitcoin passing through for the third time) and reached the level of $151. However, that level was quickly denied. Ethereum is still fighting to stay above this (now) support line as it enters the overbought territory.


Ethereum’s volume increased during the spike, while its RSI is currently in the overbought territory (at the value of 72).

Key levels to the upside                    Key levels to the downside

1: $168                                                1: $128

2: $178.6                                            2: $122.5 

3: $185                                                3: $100


Ripple

Even though XRP was the cryptocurrency that gained the least out of the top3, it still performed extremely well. XRP spent the weekend consolidating and preparing for a move, which is now happening. The third-largest cryptocurrency by market cap is reaching higher levels but is currently stuck around $0.185.


XRP’s volume increased when compared to the prior week, while its RSI level on the 4-hour chart reaches near the overbought territory, with the current value of 68.

Key levels to the upside                    Key levels to the downside

1: $0.19                                             1: $0.165

2: $0.2                                               2: $0.147

3: $0.205                                             3: $0.1

Categories
Forex Assets

Asset Analysis – Exploring The ‘GBP/BND’ Exotic Pair

Introduction

The abbreviation of GBP is the Great British Pound, and this currency is mostly known as pound sterling across the globe. It is one of the most-traded currencies in the Forex market and stands at the fourth position right after USD, EUR, & JPY. Whereas the abbreviation of BND is the Brunei Dollar, and it has been the currency of the Sultanate of Brunei since 1967. The Monetary Authority of Brunei Darussalam issues the Brunei Dollar.

GBP/BND

In the Forex market, currencies of the two countries are paired for being exchanged in reference to each other. GBP/BND is the abbreviation for the Pound Sterling against The Brunei Dollar. In this case, the first currency (GBP) is the base currency, and the second (BND) is the quote currency. The GBP/BND is classified as an exotic-cross currency pair.

Understanding GBP/BND

In the Forex, one currency is quoted against the other. To find out the relative value of one currency, we need another currency to compare. If the value of the base currency goes down, the value of the quote currency goes up and vice versa.

The market value of GBP/BND determines the strength of BND against the GBP. This can be easily understood as 1GBP is equal to how much BND. So if the exchange rate for the pair GBP/BND is 1.7660, it means 1GBP is equal to 1.7660 BND.

Spread

Forex brokers set two different prices for the currency pairs – Bid & Ask prices. Here the ‘bid’ price is at which we can sell the base currency, and the ‘ask’ price is at which we can buy the base currency. The difference between the ask and the bid price is called spread. The spread is how brokers make their money. Some brokers, instead of charging a separate fee for trading, they already have the fees inbuilt in the form of spread. Below are the ECN & STP spread values for GBP/BND Forex pair.

ECN: 12 pips | STP: 15 pips

Fees

A Fee is simply the commission we pay to the broker each time we execute a position. There is no fee on STP account models, but a few pips of the trading fee is charged on ECN accounts.

Slippage

Slippage refers to the difference between the expected price at which the trader wants to execute the trade and the price at which the trade gets executed. The slippage can occur at any time but mostly happens when the market is fast-moving and volatile in nature. Slippage also occurs when we place a large number of orders at the same time.

Trading Range in GBP/BND

The amount of money we will win or lose in a given time can be assessed by using the trading range table. It is a representation of the minimum, average, and maximum pip movement in a currency pair. This can be evaluated easily by using the ART indicator combined with 200-period SMA.

Procedure to assess Pip Ranges

  1. Add the ATR indicator to your chart
  2. Set the period to 1
  3. Add a 200-period SMA to this indicator
  4. Shrink the chart so you can assess a significant period
  5. Select your desired timeframe
  6. Measure the floor level and set this value as the min
  7. Measure the level of the 200-period SMA and set this as the average
  8. Measure the peak levels and set this as Max.

GBP/BND Cost as a Percent of the Trading Range

The cost of trade mostly depends on the type of broker we chose and also varies based on market volatility. This is because the total cost involves slippage and spreads apart from the trading fee. Below is the representation of the cost variation in terms of percentages. The comprehension of it is discussed in the following sections.

ECN Model Account

Spread = 12 | Slippage = 3 |Trading fee = 5

Total cost = Slippage + Spread + Trading Fee = 3 + 12 + 5 = 20

STP Model Account

Spread = 15 | Slippage = 3 | Trading fee = 0

Total cost = Slippage + Spread + Trading Fee = 3 + 15 + 0 = 18

Trading the GBP/BND

The GBP/BND is an exotic-cross currency pair and it is typically a Ranging market. The average pip movement of this pair on the 1H timeframe is 55 pips. Since the market is ranging, the volatility is less and the trading costs are relatively high while trading the GBP/BND pair. Always remember that cost of trade increases as the volatility decreases and vice versa.

Conservative traders who don’t mind spending more on trading fees can trade this pair on all the timeframes as the volatility is moderate. Comprehending the above tables, we should note that the costs on the trade are high when the volatility is less. But traders who don’t prefer spending more on trading costs can trade this pair when the volatility of the market is around the maximum values. Cheers!

Categories
Forex Course

94. Calculating and Comprehending Pivot Points

Introduction

In the previous lesson, we understood what pivot points are. However, it is also necessary to understand how these levels are calculated. So, in this lesson, let’s go ahead and figure out how these levels are marked and comprehended.

Before getting right into it, let’s brush up the previous topic real quick.

  • The pivot point is an indicator used to identify Support and Resistance levels.
  • It is a static indicator, unlike the other indicators that move with the price.
  • It helps in determining the overall trend of the market in any given timeframe.
  • It is calculated using high, low, and close values.

Below is an image of how pivot points look when applied on the charts. As already mentioned, S stands for Support, R stands for Resistance, and P(PP) stands for Pivot Point. Now we shall see what exactly is S1, R1, S2, R2, etc.

Calculating Pivot Points

Different levels of Support and Resistance are shown when calculating the Pivot point’s support and resistance levels, and they are represented as S1, R1, S2, R2, etc. Now, let’s calculate each one of them. The Pivot Point P(PP) value is given by the average of the high price, low price, and the close price.

Pivot point P(PP) = (High + Low + Close) / 3

First level Support and Resistance Formula:

First Resistance (R1) = (2 x P) – Low | First Support (S1) = (2 x P) – High

Second level Support and Resistance Formula

Second Resistance (R2) = P + (High – Low) | Second Support (S2) = P – (High – Low)

Third Level Support and Resistance Formula

Third Resistance (R3) = High + 2(P – Low) | Third Support (S3) = Low – 2(High – P)

In the above formulas:

High represents the high price from the previous trading day,

Low represents the low price from the previous trading day, and

Close represents the closing price from the previous trading day.

Note: Since the forex market is open 24 hours, the New York closing time, i.e., 5:00 pm EST, is taken as the previous day data. For example, if you want to calculate the levels for Wednesday, you must consider the values of Tuesday.

Comprehending Pivot Points

In this indicator, we came across three levels, namely, Pivot point level, Support level, and the Resistance level. Let’s now understand what they actually depict.

The pivot point is a level drawn at the price of the average of the High, Low, and the close price of the prior trading day. So, if the market falls below the pivot point level on the subsequent trading day, we say that the market is showing bearish sentiment. And if the price goes above the pivot point, we say that the indicator is indicating bullish sentiment.

When it comes to the Support and Resistance levels, their meaning is the same as that of the actual Support and Resistance that is defined in the industry. The Support level is the price at which the market tends to shoot up, and Resistance is the level where the market tends to fall.

This brings us to the end of this lesson. In the coming lessons, we will understand how to trade the markets applying the Pivot Points indicator.

[wp_quiz id=”69225″]
Categories
Forex Market Analysis

WTI Crude Oil Retest 28.30 – Is It a Good Idea to Sell Here? 

The U.S. crude oil futures soared 25.0% to $27.32 a barrel, and Brent was up 21.0% to $30.94 a barrel. One of the major reasons behind such a bullish trend was a tweet from U.S. President Trump.

He said in his tweet: “Just spoke to my friend MBS (Crown Prince) of Saudi Arabia, who spoke with President Putin of Russia, & I expect & hope that they will be cutting back approximately 10 Million Barrels, and maybe substantially more which, if it happens, will be GREAT for the oil & gas industry!”

The markets were supported by the sentiment of an oil production cut on Thursday in United States markets after news that President Donald Trump said the world oil industry has been ruined this year and has plans to attend meetings with industry executives later this week. Whereas the idea of tariffs on Gulf imports was floated Afterward, WTI rose to the $27 handle overnight. 

Looking forward, the oil traders will now keep their eyes on the U.S. President’s meeting with the key oil company leaders to determine if there are chances of production cut or not. 

WTI Crude Oil – Daily Technical Level

Support Resistance 

22.84     28.87

19.71     31.76

13.68     37.79

Pivot Point 25.74

Technically, U.S. oil has passed over the resistance mark of 24.85, which has exposed additional opportunity for buying unto 28.29 level. Formation of candles beneath this level may support us to capture a bearish trade; however, at the same time, bullish trades can be taken instantly above a 24.85 resistance level. The MACD is making significant histograms, which is proposing the chances of further buying in crude oil. Good luck!

Categories
Forex Fundamental Analysis

Understanding ‘Foreign Exchange Reserves’ & Its Impact On The Forex Market

Introduction To Foreign Exchange Reserves

Foreign Exchange Reserves are foreign assets held by a country’s central bank. Most of the foreign reserves are held in the form of currencies, while the other reserves include deposits, bonds, treasury bills, other government securities. There are plenty of reasons why central banks hold reserves. And the most important reason is to control their currencies’ values. The reserves act as a backup for their liability. From an economic point of view, it essentially influences the monetary policy.

When a country’s currency falls considerably, the foreign exchange reserve acts as a backup of their economy. Typically, countries hold the US dollar as their forex reserves because it is the most traded currency in the world. Apart from that, the Great Britain Pound, Chinese Yuan, Euro region’s Euro, and Japanese Yen are the currencies that are held as FX reserves.

Understanding Foreign Exchange Reserves

Let us understand with an example, how exactly are the forex reserves accumulated.

Consider two countries, the United States and Great Britain Pound. In the present situation, let’s say the value of USD and the GBP is the same with stable economies. Now let’s say the investors start believing that the USD is going to perform exceptionally well in the coming years. So, they begin flowing in cash into the US’s real estate and the stock market. This brings up a massive demand in the US dollar, while supply in Pound.

In such a situation, people must pay more Pounds to purchase one US Dollar. Or in USD’s perspective, people must pay lesser US dollars to buy one Pound. Moving further, let’s say the US does not want its currency to get very strong. This is because it has led to high volatility in the price and dramatic moves in the market.

With this concern, the central banks start printing more of their currency (US Dollar). And this money is deployed into buying the GBP. In doing so, the supply and demand of both the currencies stabilize again. Now the Pounds that the US central banks own are the foreign reserves. This hence appears on the balance sheet of the US.

What is the Purpose of Foreign Exchange Reserves?

There are several ways central banks use FX reserves for different purposes.

The countries use their foreign reserves to keep their currency’s value at a fixed rate. An example of the same is given above. Countries with a floating exchange rate system use FX reserves to keep the value of their currency less than the US dollar. For example, Japan follows a floating system. The central bank of Japan buys US treasury so that the Yen stays below the Dollar.

Another critical function of the reserves is to maintain liquidity in case of economic crises. For instance, a natural calamity might bring a halt to local exporter’s ability to produce goods. This cuts off their supply of foreign currency to pay for imports. In such scenarios, central banks can get their local currencies in exchange for the foreign currency they have. Hence, this allows them to pay for and receive imports.

The foreign currencies are supplied by the market to keep markets steady. It also buys the local currency to prevent inflation and support its value. Central banks provide confidence to investors through reserves. They assure their foreign investors that they’re ready to take action to protect investors’ investments. This will prevent the loss of capital for the country.

Some countries use their foreign reserves to fund sectors. For example, China has used its reserves for rebuilding some of its state-owned banks.

How Forex Reserves impact the currency?

Foreign exchange reserves are important to investors as it controls the supply and demand of the currency in the forex market. Knowing that central banks try keeping the currency values stabilized, we take advantage of this and try predicting the value of a currency pair.

Let’s say the US is buying large quantities of Australian goods, bonds, etc. This would create a demand in the Australian Dollar against the US dollar. That is, the value of AUD/USD would rise in doing so. Now, if the value rises to a significant amount, the central banks will buy back the US dollars from them, which creates a demand in the USD. And this hence will bring down the value of AUD/USD to keep it stable again. Therefore, traders can look to go short on AUD/USD knowing that USD would buy back their currency to keep both the currencies stable.

Reliable Source of information on Foreign Exchange Reserves

Traders and investors need the data of foreign exchange reserves to make their investments. And this data is publicly available for free. Below are the portals to access the reports on the Forex reserves of different countries. Apart from the current data, one can access the historical data with graphical charts as well.

USD | CAD | GBP | AUD | EUR | JPY | CHF

Impact Of Foreign Exchange Reserves’ News Release On Forex

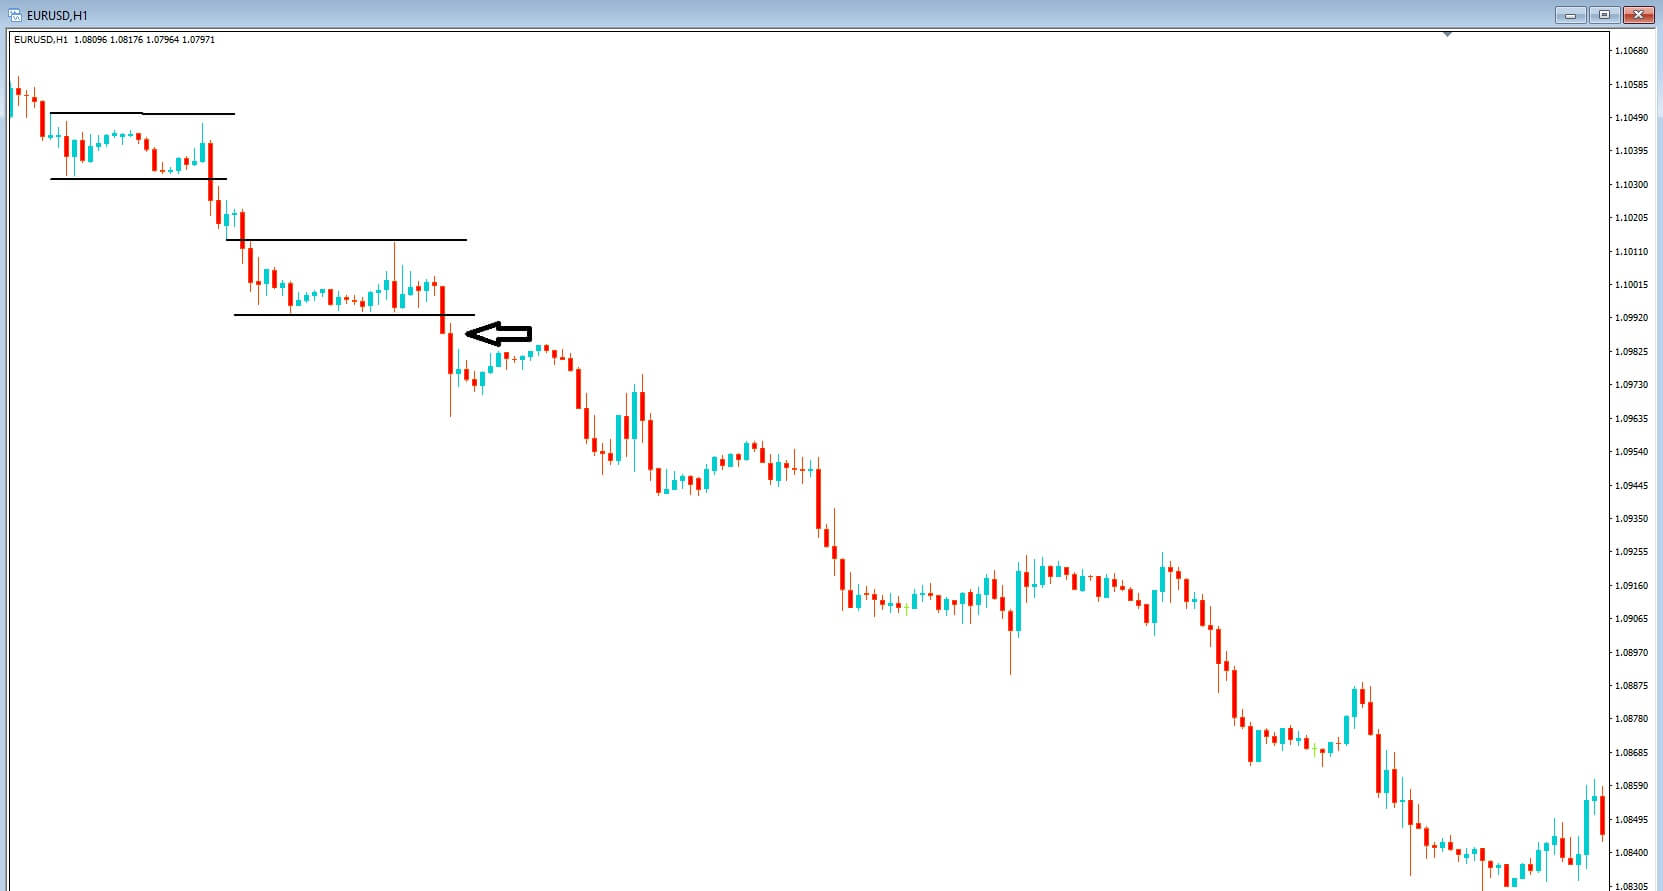
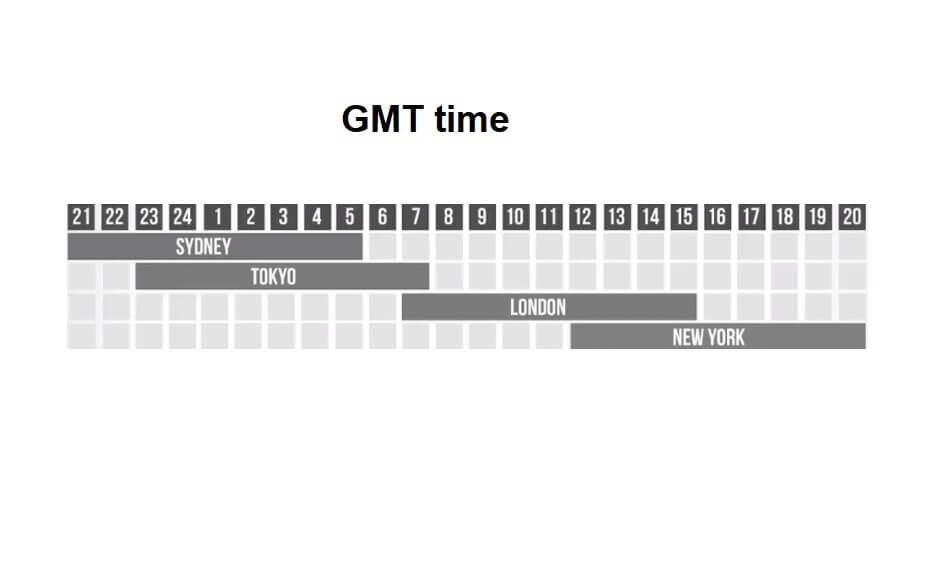
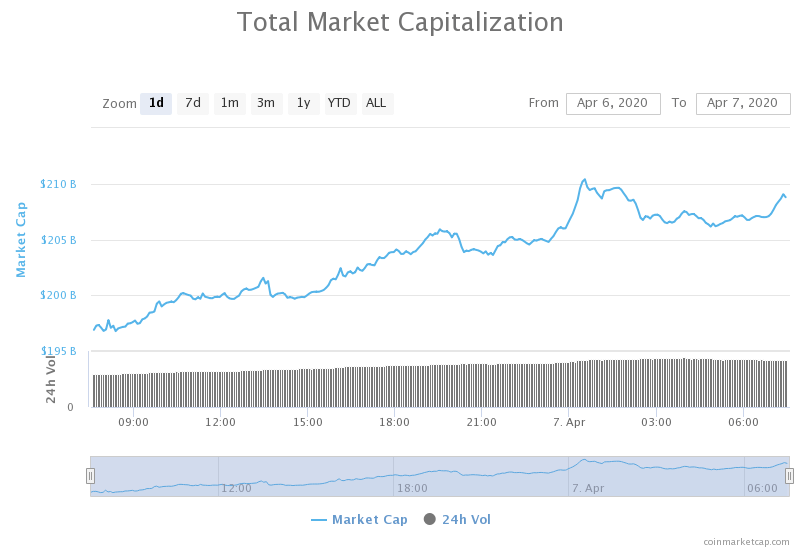
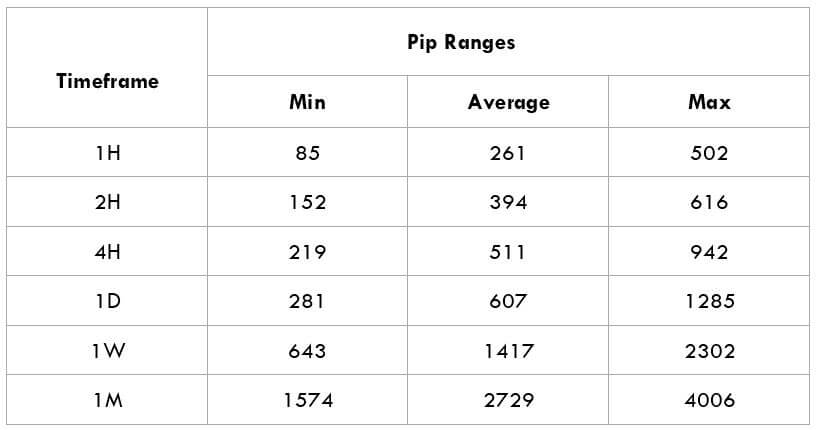
From the above topics, it is evident that Foreign exchange reserves affect the currency of an economy. Now, we shall see how the price charts are affected when the reports are released. Typically, the impact of the news after its release is low. The Forex reserves of a country are released on a monthly basis and usually at the beginning of a moth. However, the source of the announcement is different for different countries.

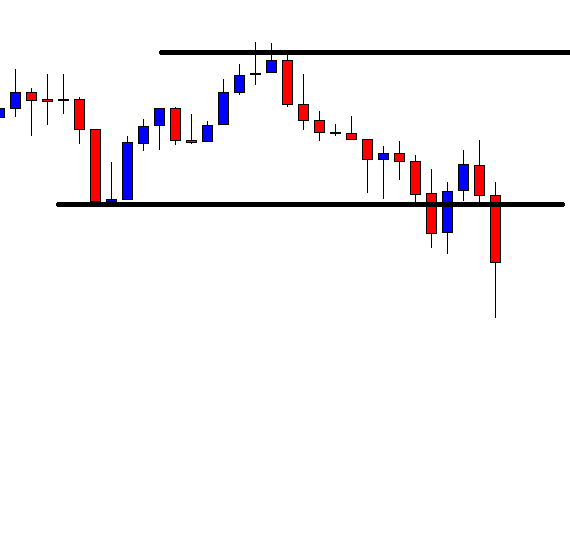
For analysis, we will be considering the data released by Japan. The reports on the FX reserve is announced by the Ministry of Finance of Japan. Specifically, we will be considering the reserves that are held as USD. Consider the below report of Foreign exchange reserves (USD) held by Japan’s central bank. The news was announced on 5th March 2020. We can that the newly released data was higher than the previous month by 16.7B.

Source: Investing.com

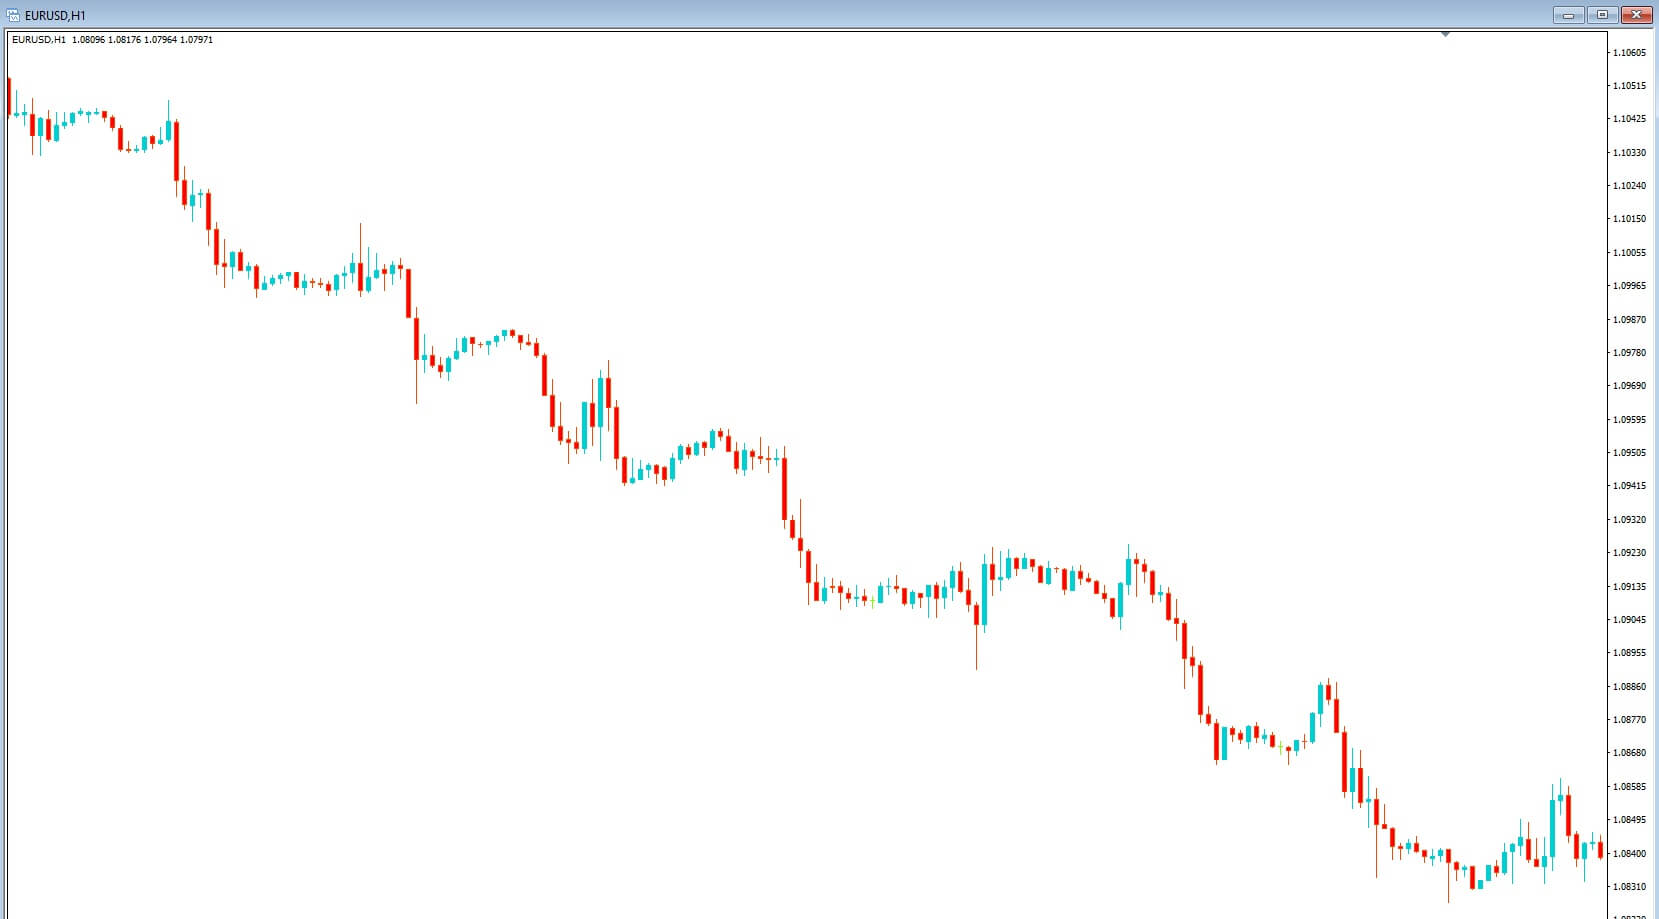
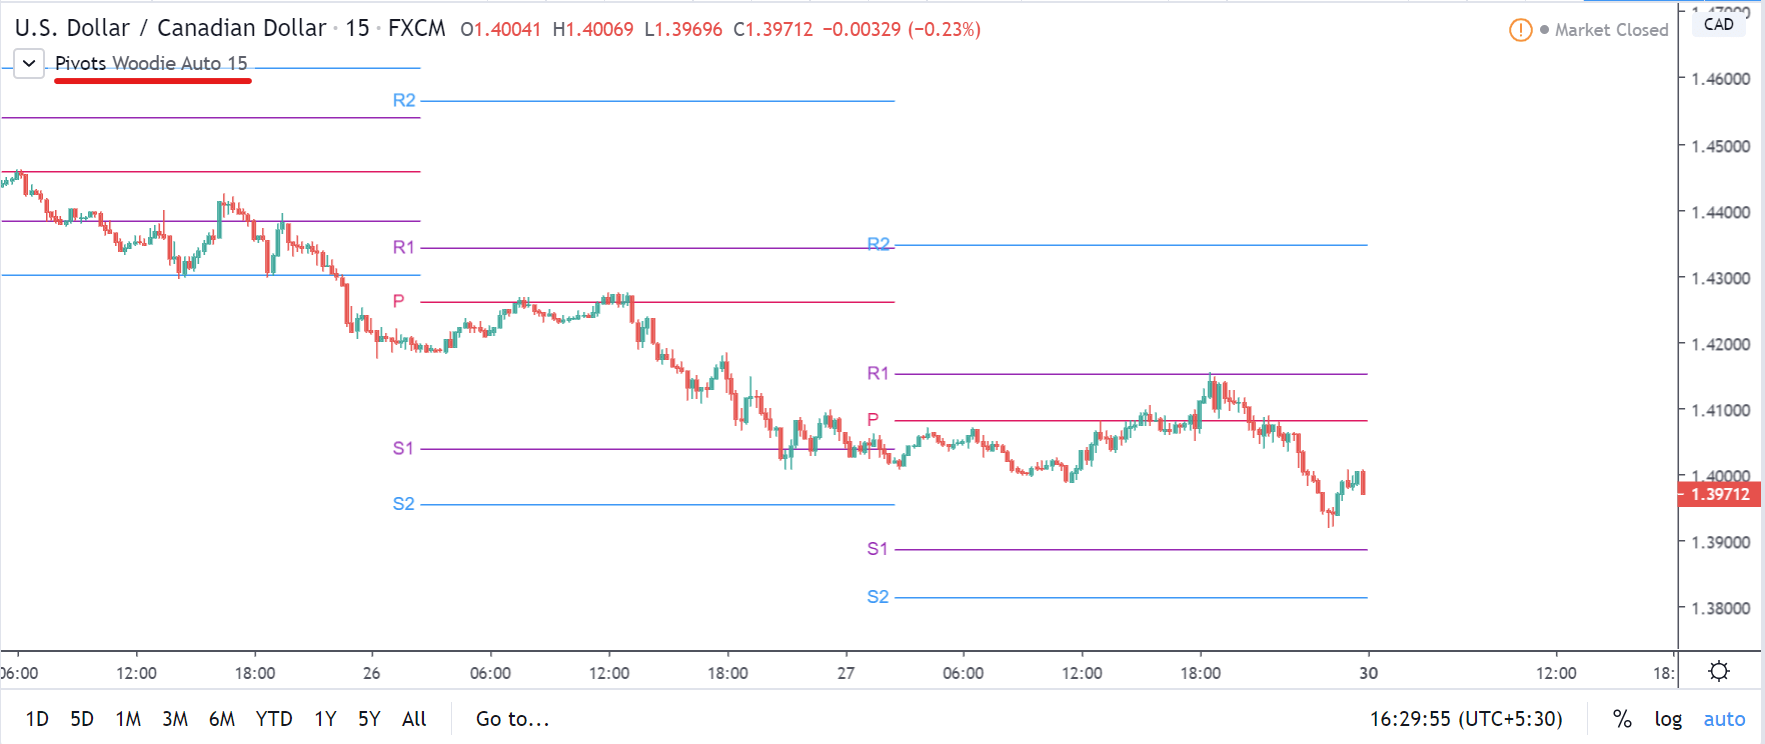
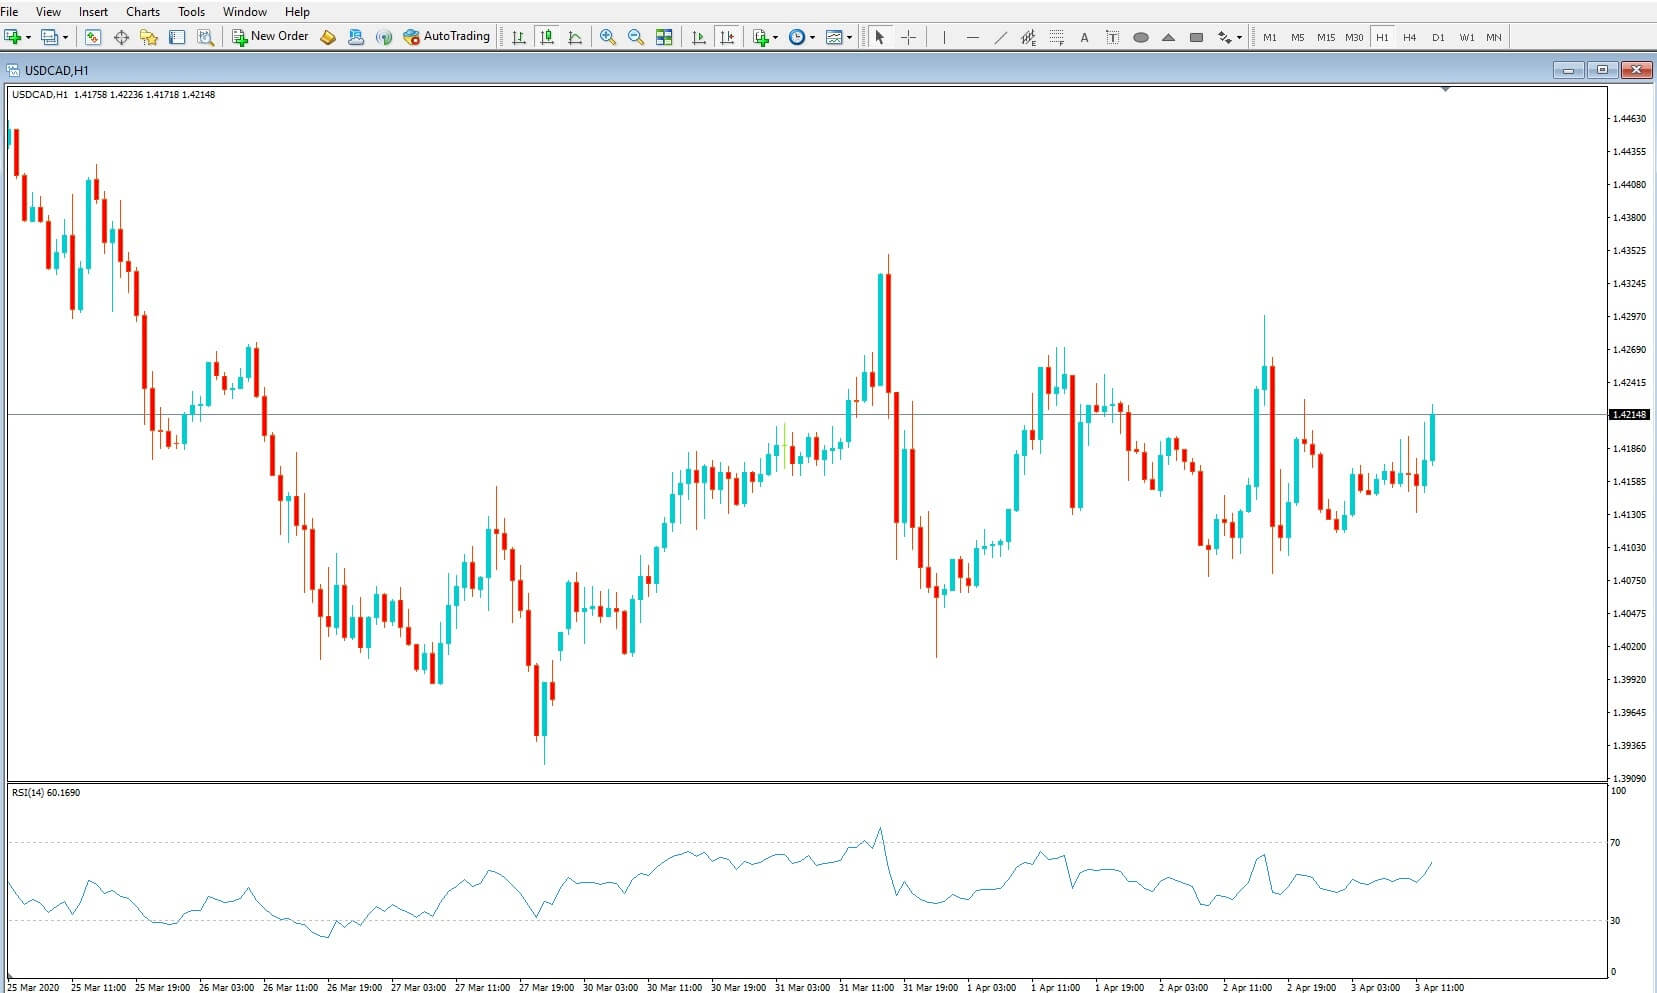
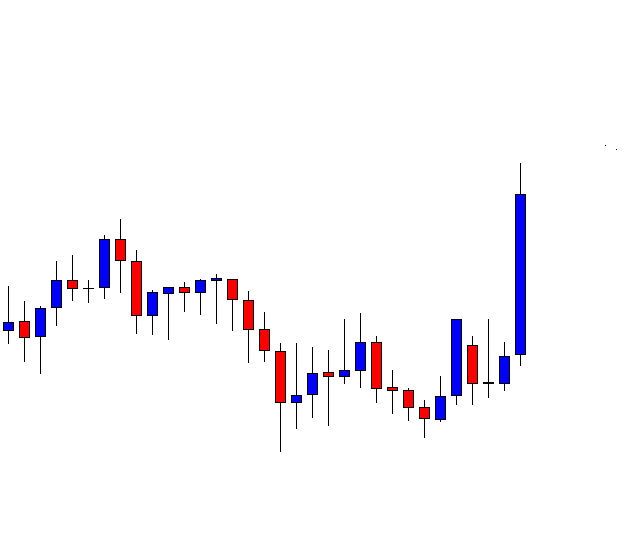
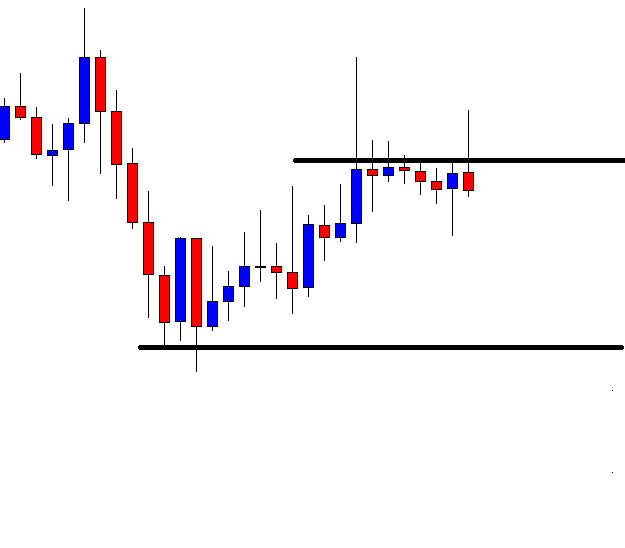
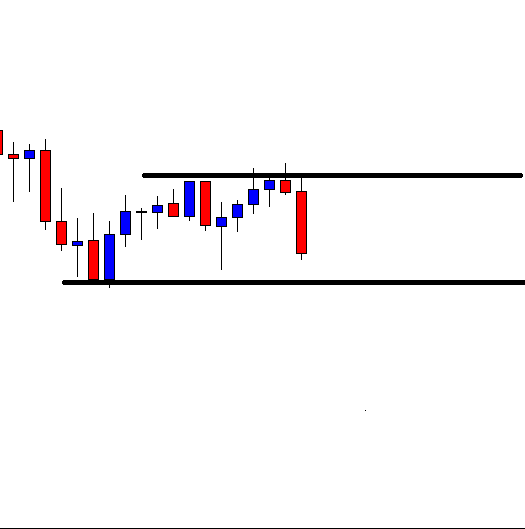
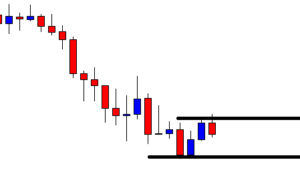
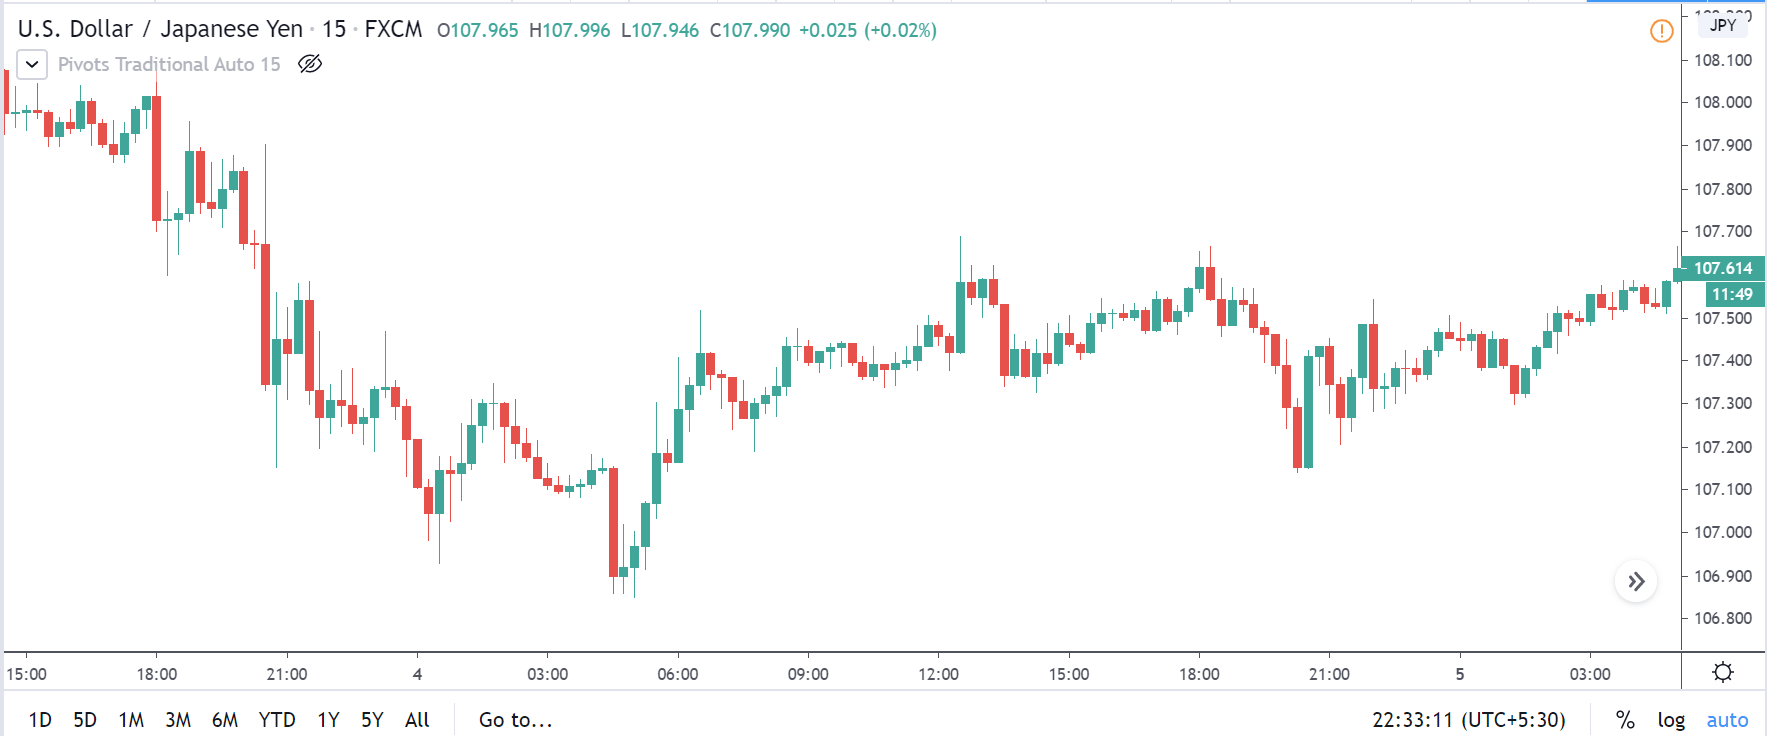
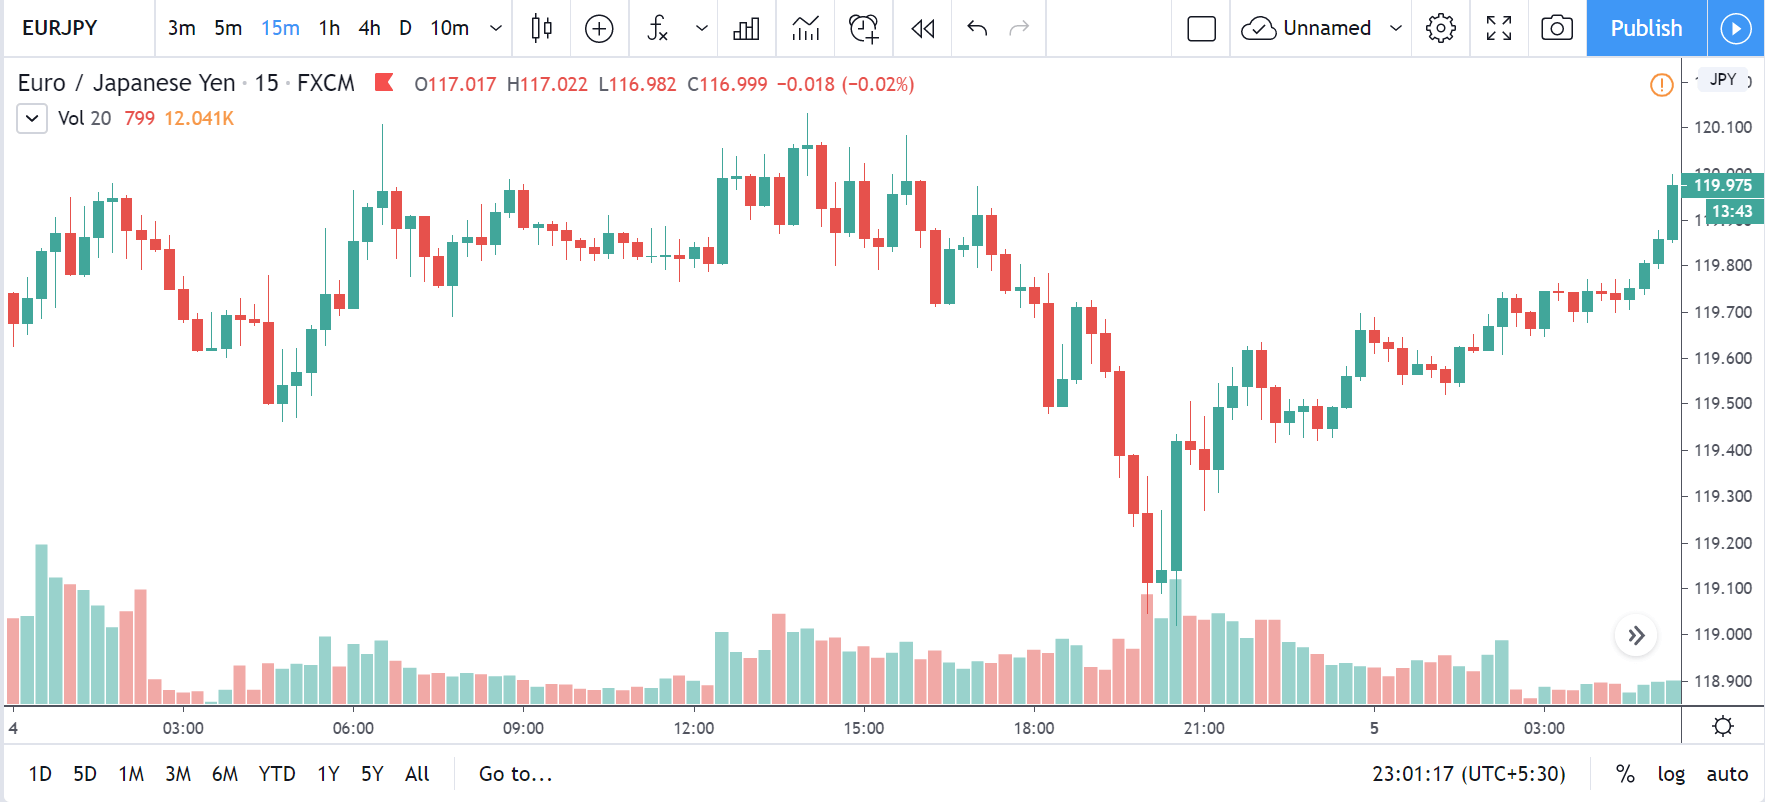
USD/JPY | Before the Announcement | 5th March 2020

Below is the chart of USD/JPY on the 15min timeframe before the release of the news. Currently, the market is showing some strength from the buyers.

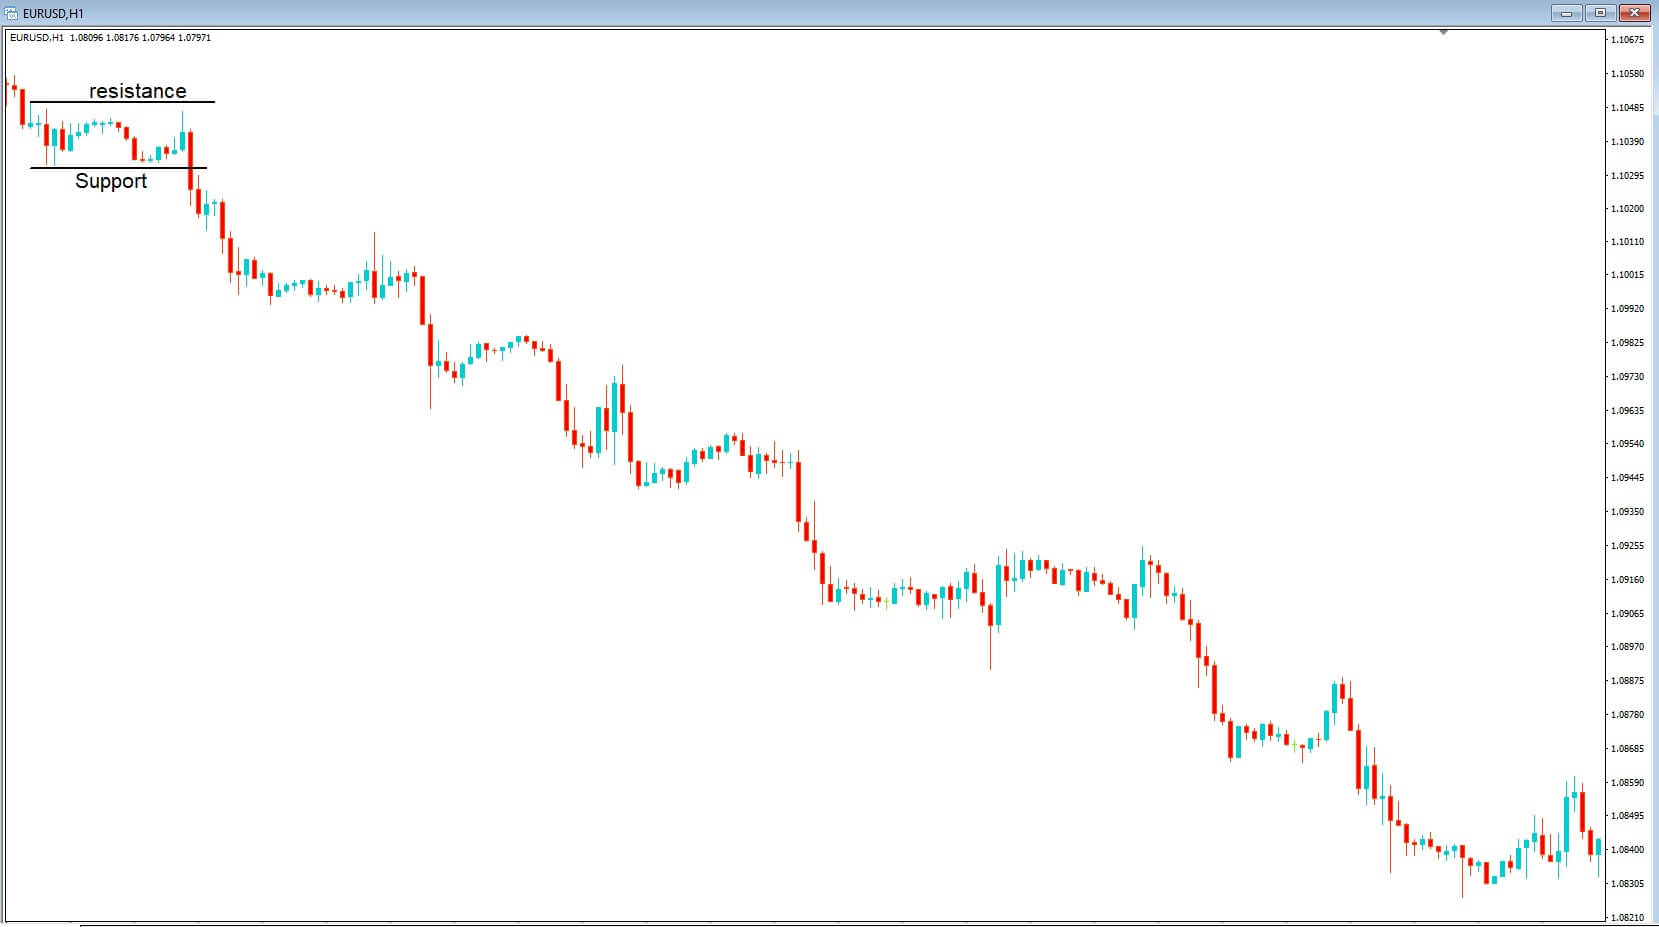
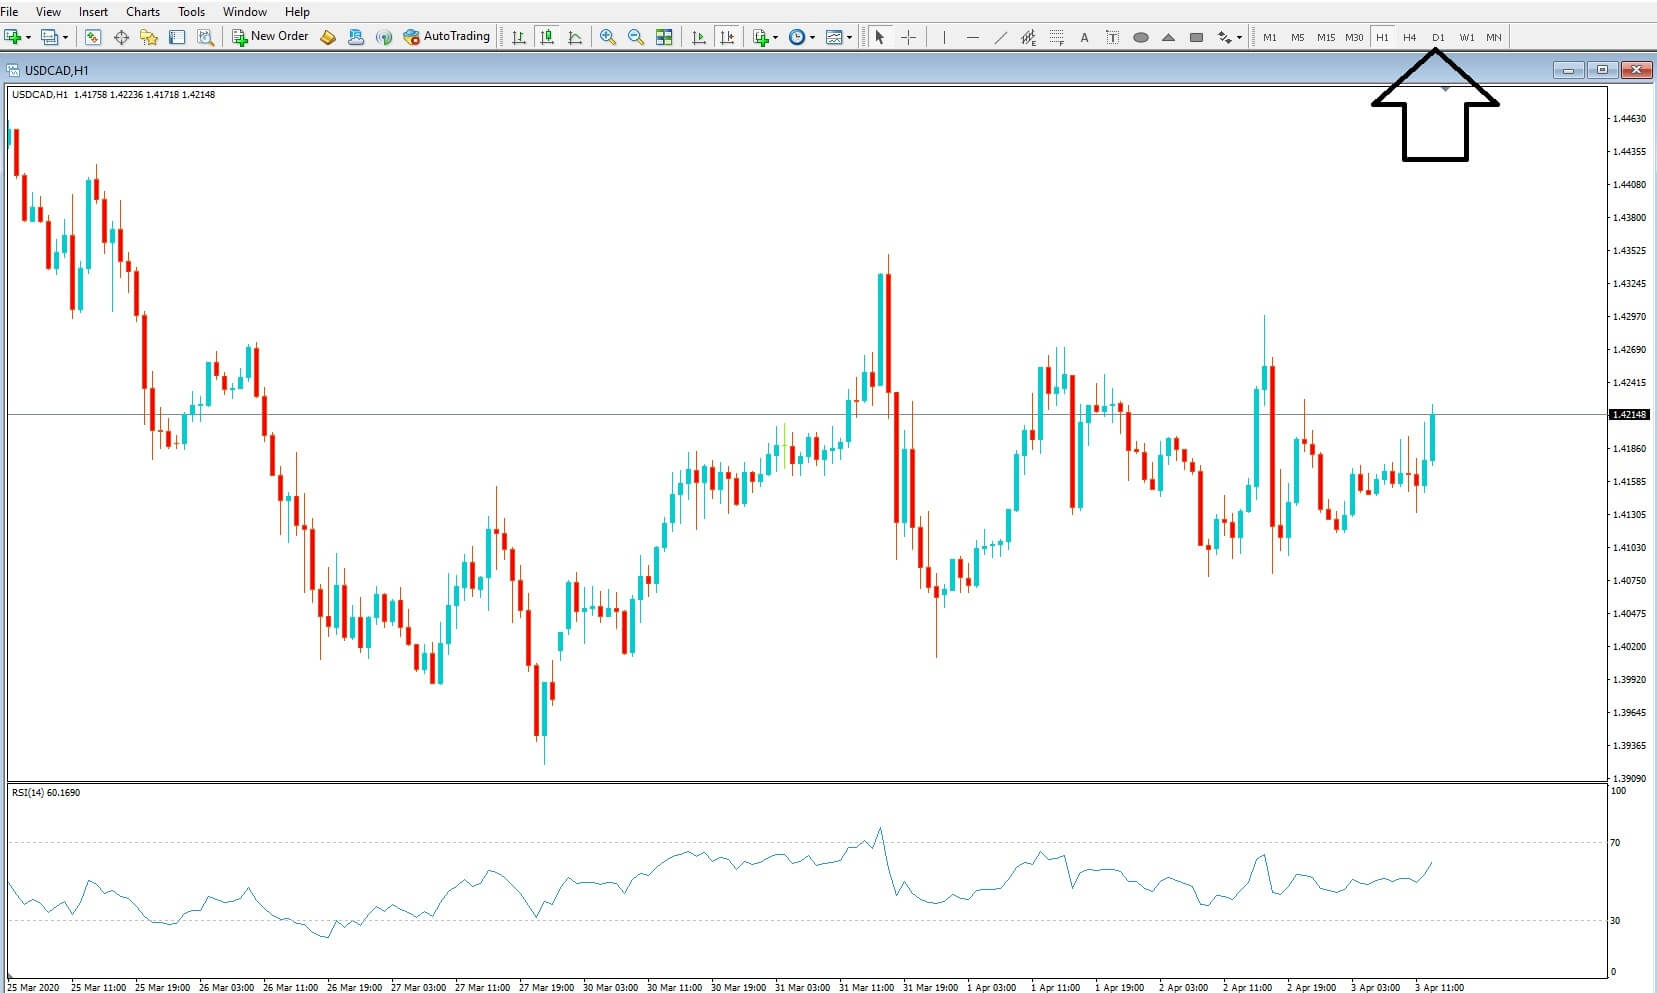
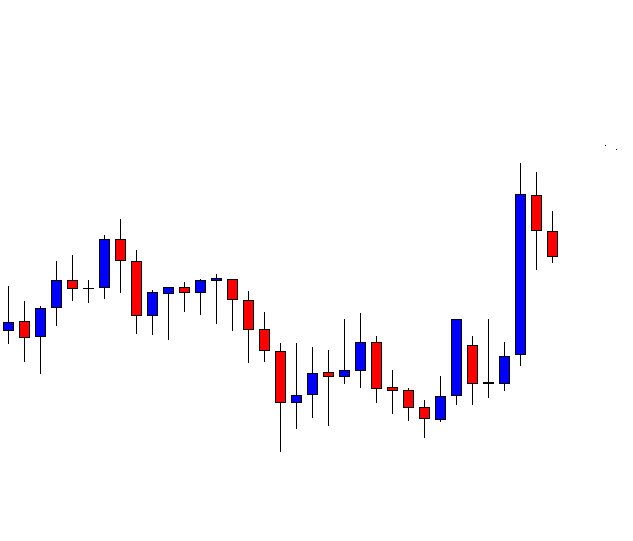
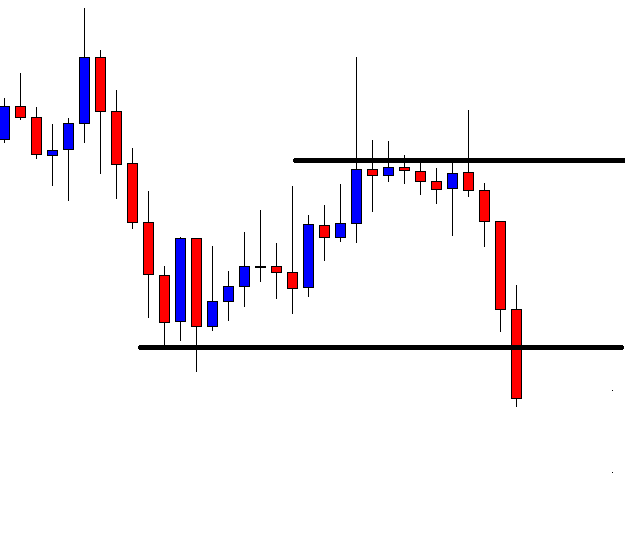
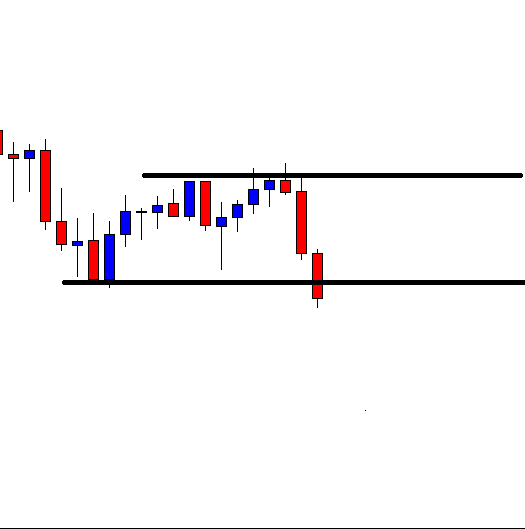
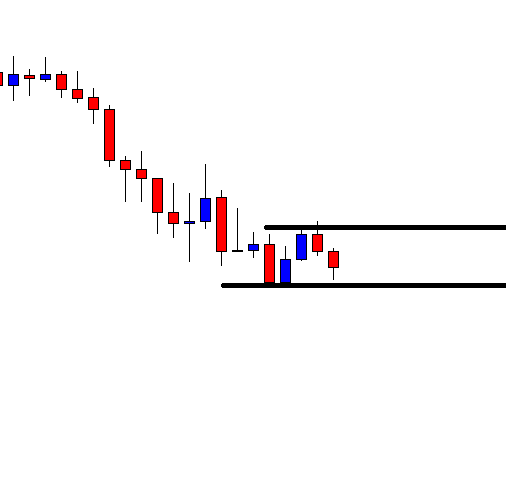
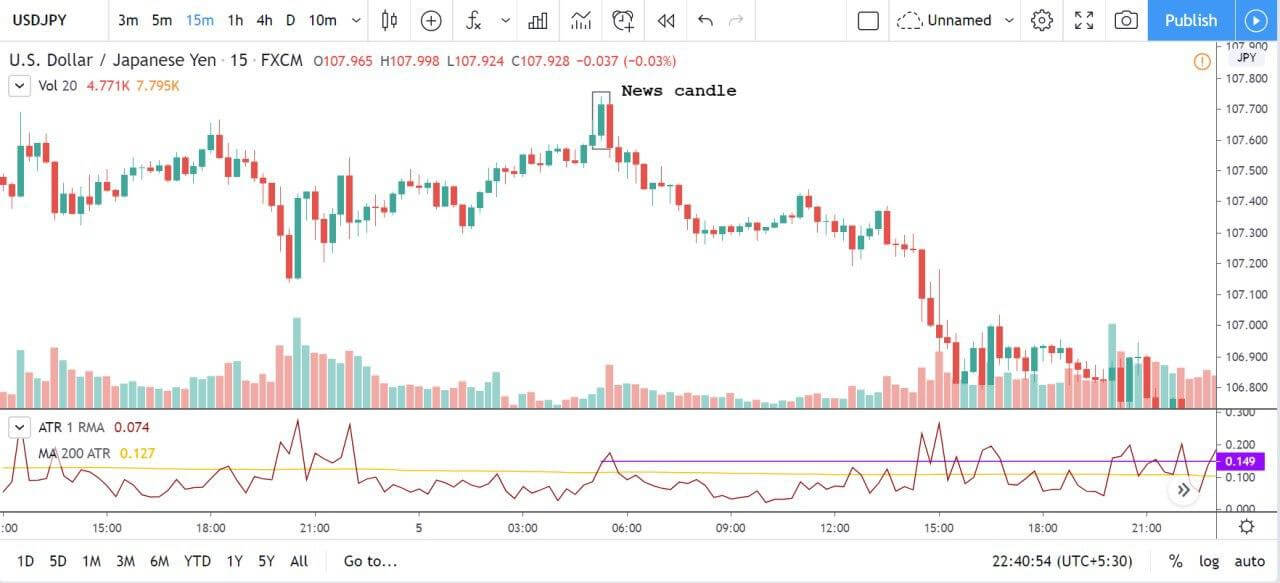
USD/JPY | After the Announcement | 5th March 2020

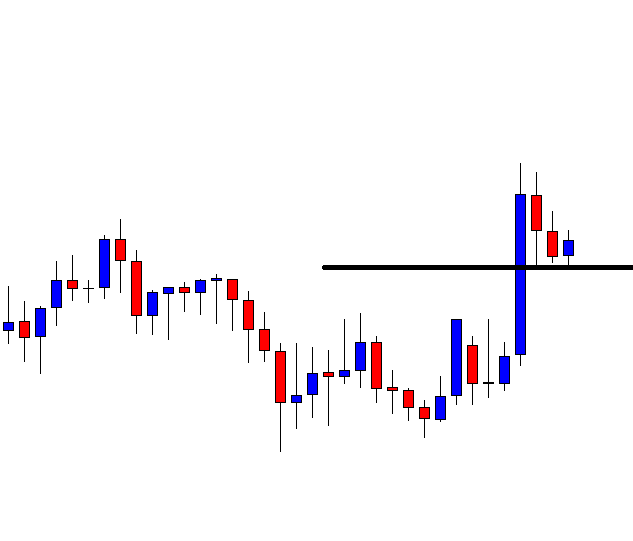
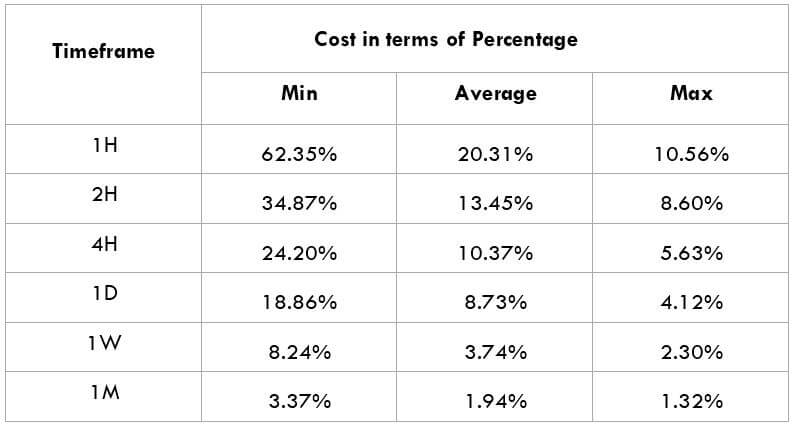
Below is the same chart, but after the release of the news. We can see that a green candle popped at first but was eaten up by a red candle. Basically, the up move was nullified by the sellers. Also, we cannot really say that the up and down move was due to the news because the volume didn’t show any sudden spike up. Typically, for impactful news, the volume increases drastically, which did not happen for this news. However, the volatility rose a little above the average but dropped below in a few minutes. One of the reasons we could account for the low volatility and volume is that the report was almost the same as the previous month’s report.

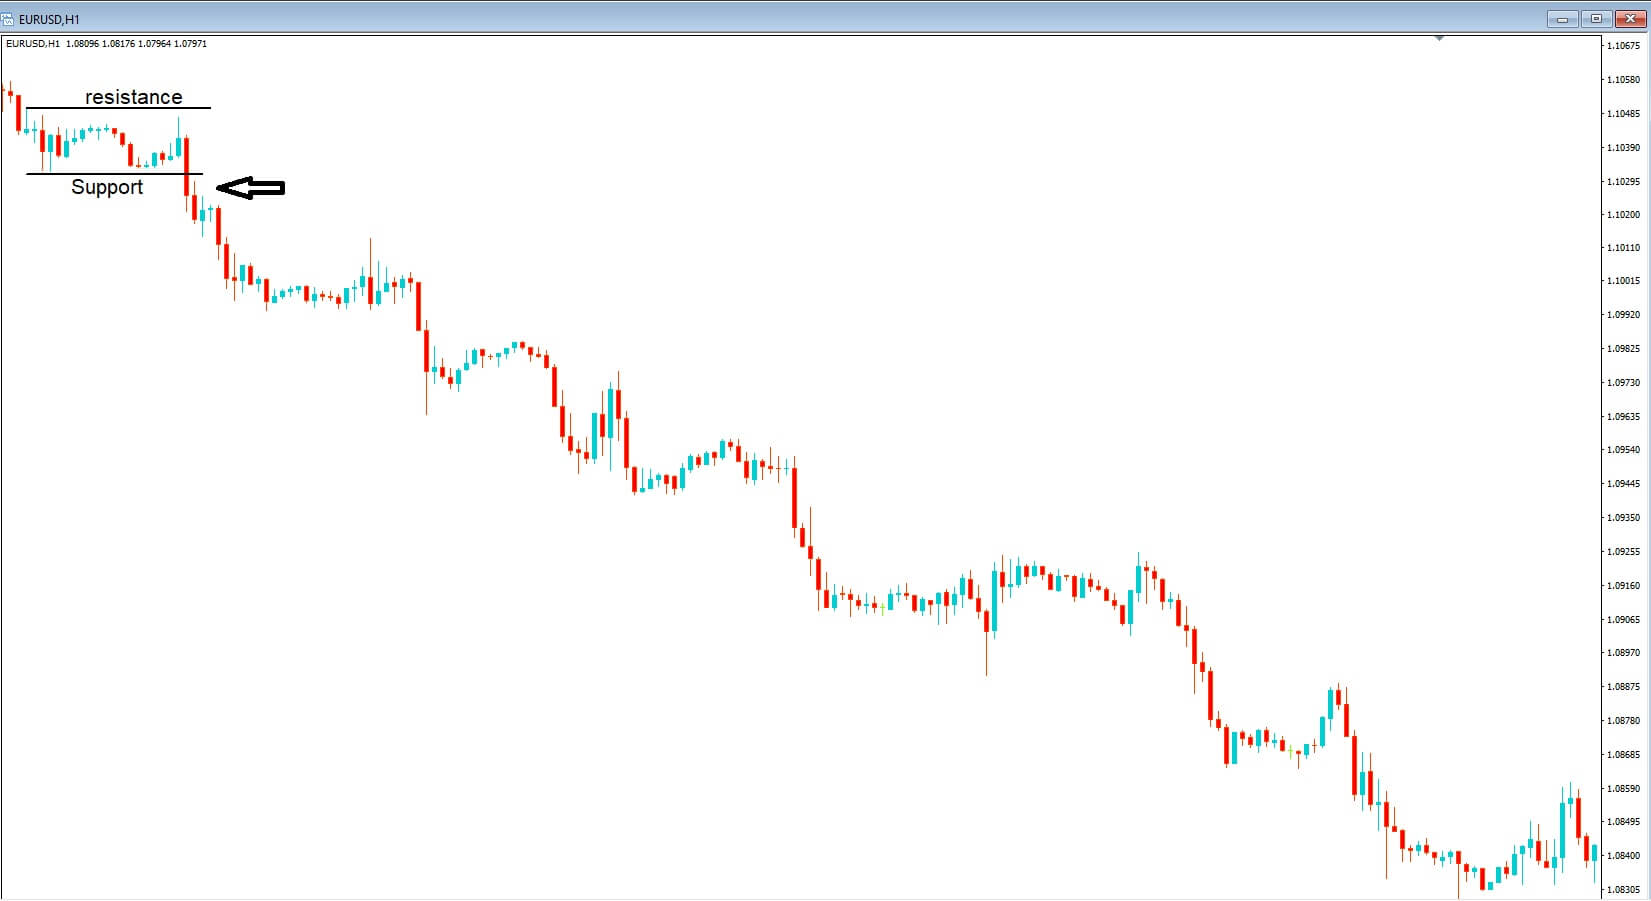
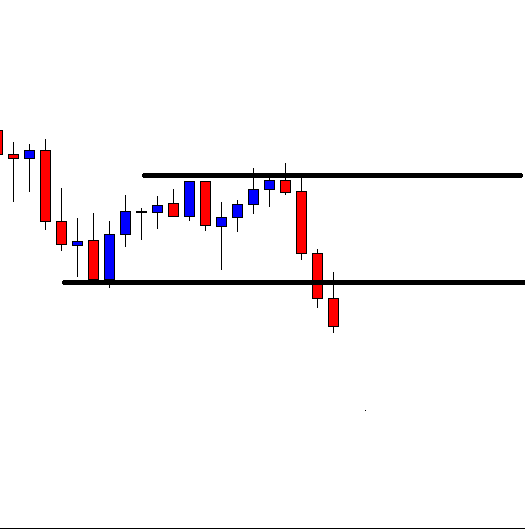
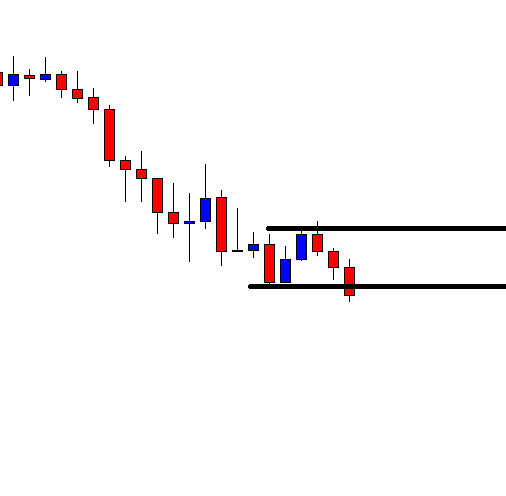
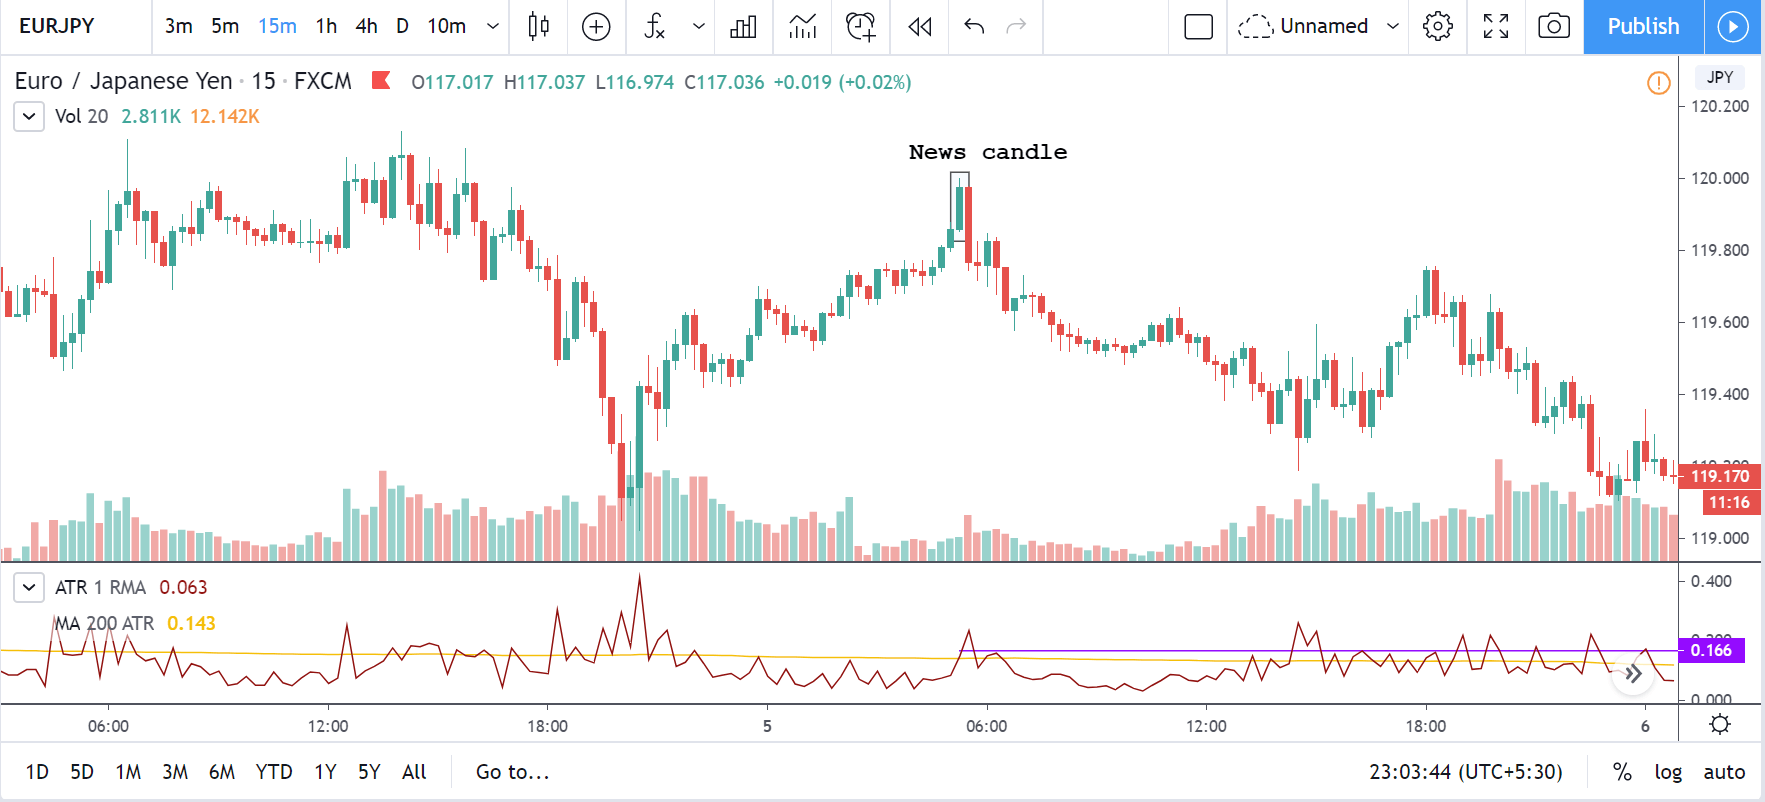
EUR/JPY | Before the Announcement | 5th March 2020

EUR/JPY | After the Announcement | 5th March 2020

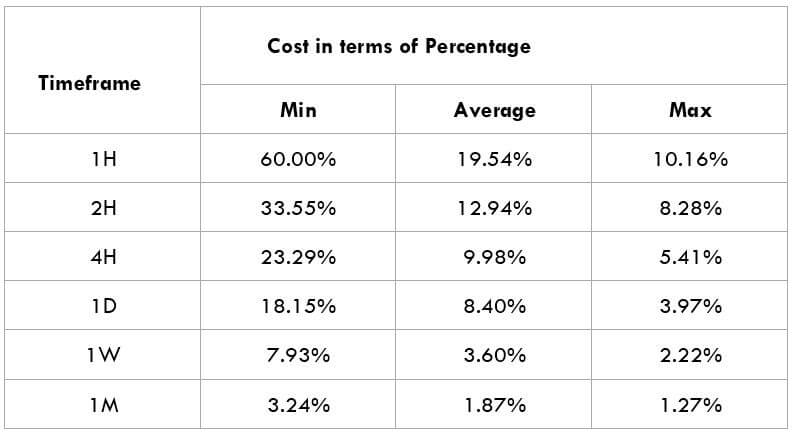
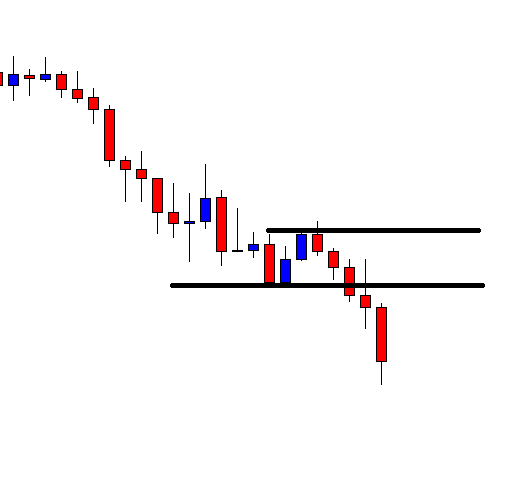
Consider the chart of EUR/JPY on the 15min timeframe given below. The news candle is marked by a rectangle around it. We can see that the price action of this pair is very similar to that of USD/JPY. Initially, the market showed a bullish move but dropped the next candle. Speaking of volatility, it was a pip or two above the average volatility. The Volume, too, did not increase during the announcement of the news, which usually happens for other impacting news. Hence, in this pair too, the FX reserves did not have an immediate impact on the currency pair.

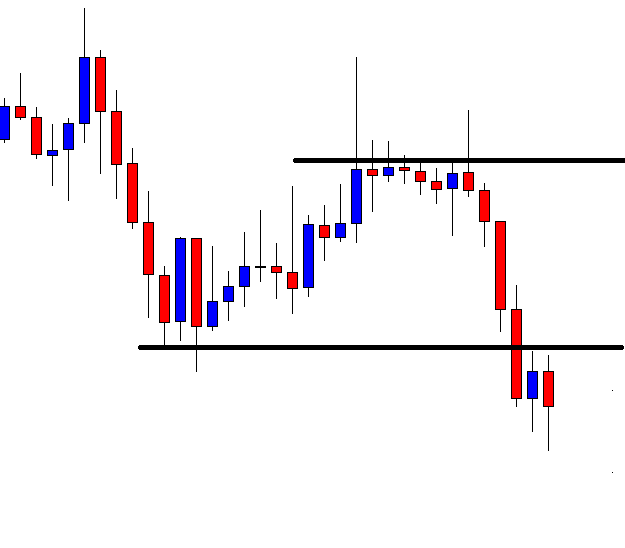
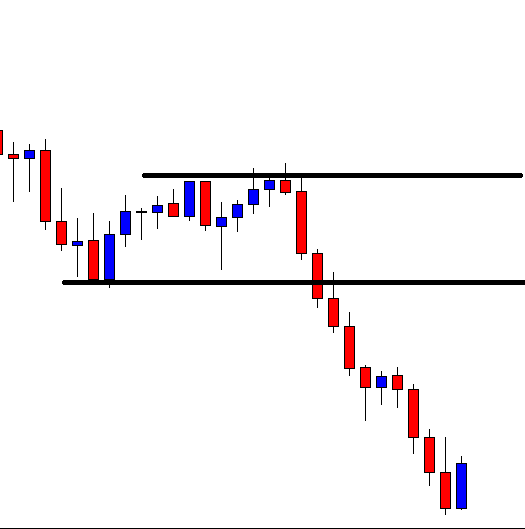
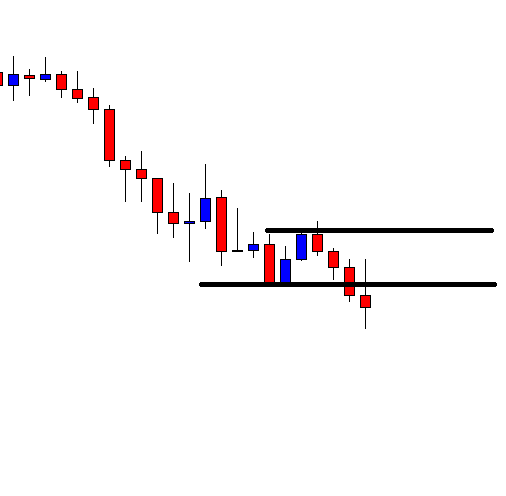
GBP/JPY | Before the Announcement | 5th March 2020

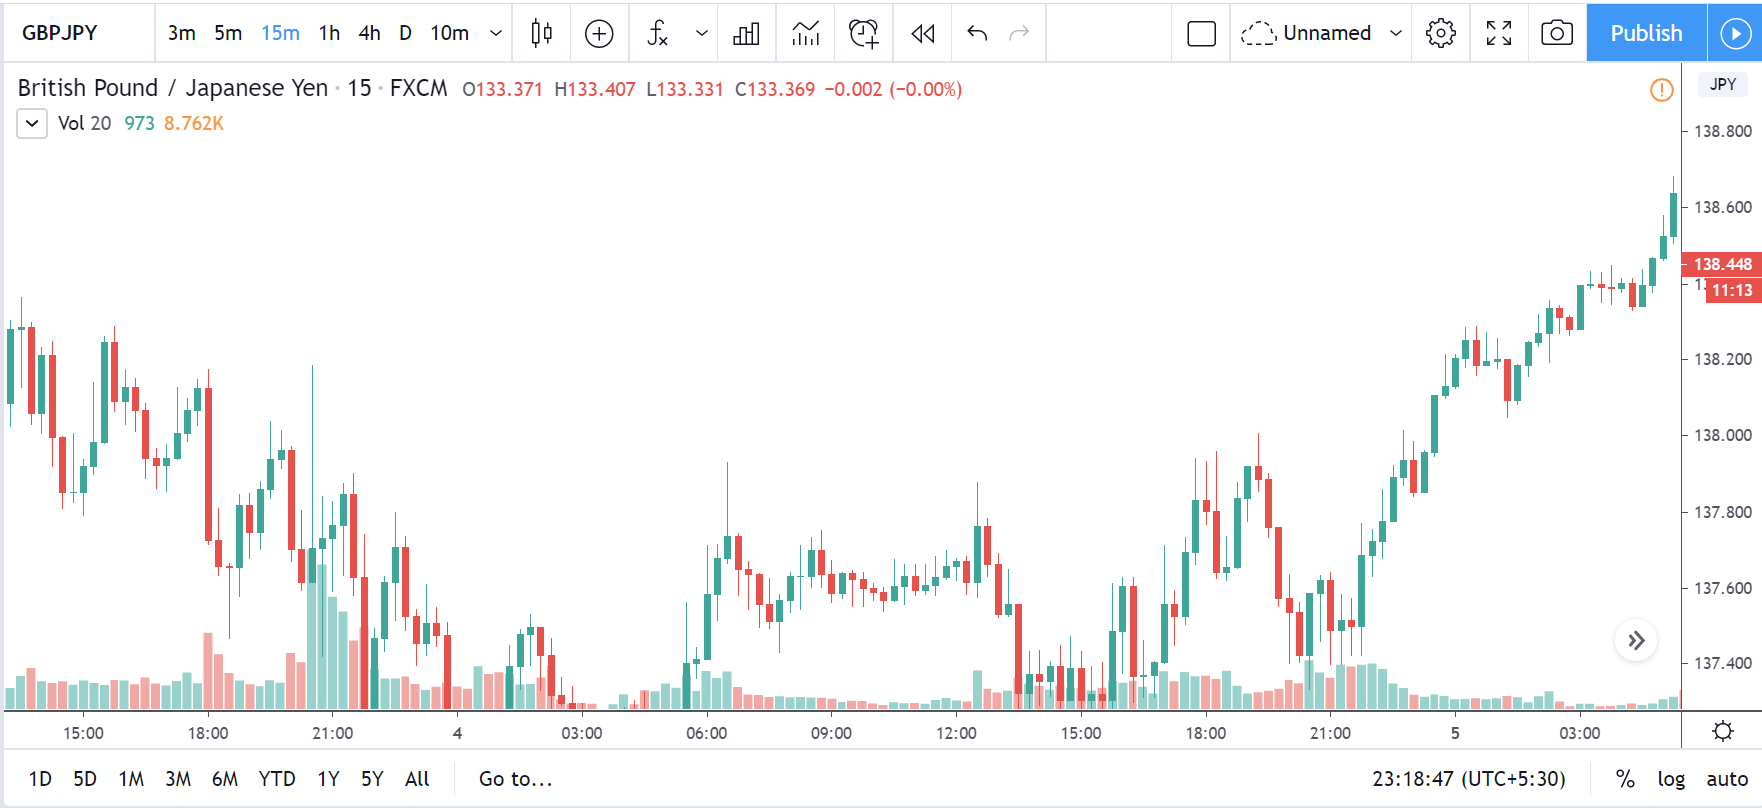
GBP/JPY | After the Announcement | 5th March 2020

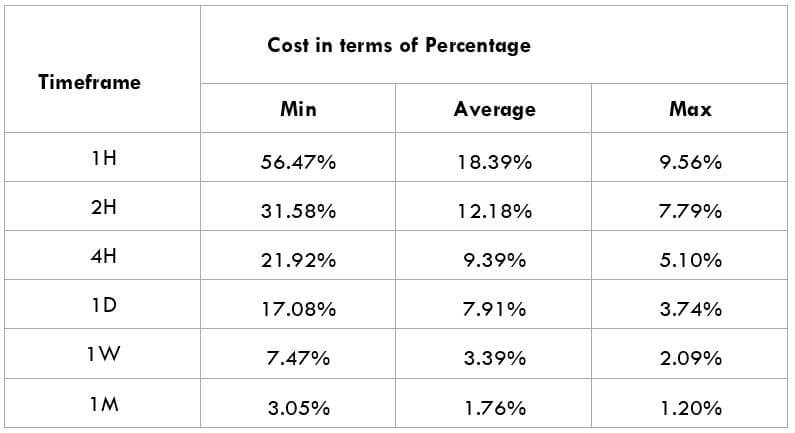
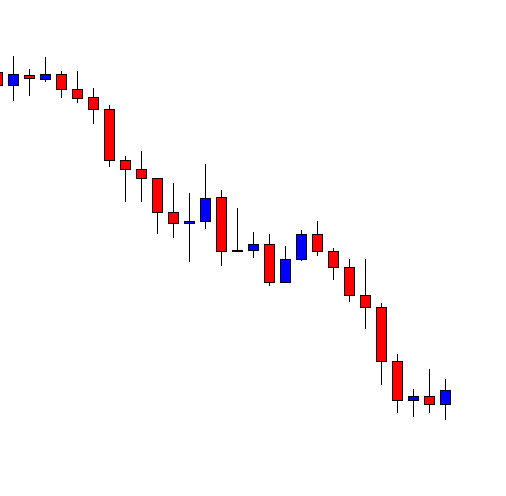
Below is the chart of GBP/JPY on the 15min timeframe. Similar to the above two pairs, in this pair too, the price action is almost the same. In 30 mins after the release of the news, the market showed a little bullish but ended on a bearish note. The volatility at this time was at the average line, and the volume was feeble. In fact, it was lesser than the time when the London or New York market opens. Hence, with this, we can come to the conclusion that the impact of Foreign exchange reserves on GBP/JPY was insignificant.

Conclusion

Foreign exchange reserves are the assets of other countries held by the central bank of a country. The reasons for doing so are plenty. The Foreign Exchange Reserves has its influence in determining the monetary policy. FX reserves can control the rate of a currency and can use to stabilize the same.

However, if we were to see its immediate impact on the price charts, it is low. The impact on the currency pair is usually when it is significantly overvalued or undervalued. FX reserves are also helpful to central banks in bringing up the economy to an extent. This indicator may not predict the future economy but can help economists in several other ways.

That’s about Foreign Exchange Reserves and their impact on the price charts. If you have any questions, let us know in the comments below. Cheers!

Categories
Forex Course

93. Introduction to Pivot Points

What is a Pivot Point?

The pivot point is a technical indicator that shows the levels typically used to determine the overall trend of the market in different timeframes. These points are essentially used by professional traders to identify support and resistance levels. As a retail trader, one must keep an eye on these levels to identify potential buy/sell signals. To put in simple terms, the pivot points and its corresponding support and resistance levels are places at which markets can possibly change its direction.

The reason this indicator is very enticing is because of its objective. Unlike other technical indicators, there is no decision making involved. The Pivot Points are very similar to the Fibonacci levels. This is because these levels are pretty much self-fulfilling. However, there are some differences in some respects, which shall be discussed in the next section.

It is important to know that the pivot point indicator is mostly designed for short-term traders who wish to take advantage of small price movements. The technique to trade this is similar to that of trading support and resistance, where we participate in the market on a break or bounce from these levels.

The Difference between Pivot Points and Fibonacci Retracements

Though Pivot points and Fibonacci retracements are made by drawing horizontal lines to depict potential support and resistance levels, there vary in few aspects. In Fibonacci levels, there is subjectivity involved in picking the swing lows and highs. But, in pivot points, there is no discretion involved.

In Fib retracements, the levels can be constructed by connecting any price points on a chart. Once the levels are determined, the lines are then drawn at percentages of the selected price range. In the case of pivot points, fixed numbers are used instead of percentages. And the fixed values are the high, the low, and the close of the prior day.

Interpreting Pivot Points

Pivot points indicator is typically used by traders who trade the market using technical analysis. This indicator can be applied to the Stock, Forex, Commodity, Futures as well as the Cryptocurrency market. This indicator is unique from the other indicators because it doesn’t move with the price action.

It is static, and the levels drawn remain at the same prices throughout the day. This means that traders can plan their strategy much in advance. For example, in most of the approaches, if the price falls below the pivot point, traders will go short on the security. And similarly, if the price goes above the pivot point, they will look for buying opportunities.

How do Pivot Points look?

When the standard pivot points are applied to the charts, it will look something like this (as shown below).

In the above chart, P stands for Pivot Point | stands for Support | stands for Resistance

There are R1, S1, R2, S2, etc. as well, but it shall be explained in the upcoming lessons. Stay tuned!

[wp_quiz id=”69068″]
Categories
Forex Assets

Trading The GBP/PHP Exotic Currency Pair

Introduction

The expansion of GBP is the Great Britan Pound, and this currency is very well known as the Pound Sterling. It is the official currency of the United Kingdom and many other countries like British Overseas Territories, South Sandwich Islands, etc. Where in PHP is known as the Philippine peso and generally referred to as the Piso. It is the official currency of the Philippines, and it is printed by The Central Bank of the Philippines.

GBP/PHP

In the Forex market, currency pairs of any two countries are coupled for being exchanged in reference to each other. GBP/PHP is the abbreviation for the Pound sterling against The Philippine peso. In this case, the first currency (GBP) is the base currency, and the second (PHP) is the quote currency. The GBP/PHP is classified as an exotic-cross currency pair.

Understanding GBP/PHP

As we know, the trading of currencies in the Forex market typically happens in pairs. One currency is quoted against the other, and to find out the relative value of one currency, we need another currency to compare. The market value of GBP/PHP determines the strength of PHP against the GBP. This can be easily understood as 1 GBP is equal to how much PHP. So if the exchange rate for the pair GBP/PHP is 63.377. It means 1 GBP is equivalent to 63.377 PHP.

Spread

Forex brokers have two different prices for currency pairs, and they are the bid and ask prices. The bid is a selling price while the ask is a buy price. The difference between the ask and the bid price is called the spread. The spread is how most of the brokers make their money. The spreads of GBP/PHP in both ECN & STP brokers can be found below.

ECN: 45 pips | STP: 48 pips

Fees

When we execute a trade, we need to pay the broker some commission. A Fee is that commission we pay to the broker each time we execute a position. There is no fee on STP account models, but ECN brokers charge some pips as a trading fee.

Slippage

Sometimes while trading in a volatile market, we won’t be able to execute a trade at the price we want it to get executed. Slippage is the difference between the trader’s expected price and the actual price at which the trade is executed. It may occur at any time but mostly happens when the market is fast-moving and volatile. It can also happen when we place a large number of orders at the same time.

Trading Range in GBP/PHP

The amount of money we will win or lose in a given amount of time can be assessed using the trading range table. It is a representation of the minimum, average, and maximum pip movement in a currency pair. This can be evaluated by using the ART indicator combined with 200-period SMA.

Procedure to assess Pip Ranges

  1. Add the ATR indicator to your chart
  2. Set the period to 1
  3. Add a 200-period SMA to this indicator
  4. Shrink the chart so you can assess a significant period
  5. Select your desired timeframe
  6. Measure the floor level and set this value as the min
  7. Measure the level of the 200-period SMA and set this as the average
  8. Measure the peak levels and set this as Max.

GBP/PHP Cost as a Percent of the Trading Range

The cost of trade mostly depends on the broker and varies based on the volatility of the market. This is because the total cost involves slippage and spreads apart from the trading fee. Below is the representation of the cost variation in terms of percentages. The comprehension of it is discussed in the following sections.

ECN Model Account

Spread = 45 | Slippage = 3 |Trading fee = 5

Total cost = Slippage + Spread + Trading Fee = 3 + 45 + 5 = 53

STP Model Account

Spread = 48 | Slippage = 3 | Trading fee = 0

Total cost = Slippage + Spread + Trading Fee = 3 + 48 + 0 = 51

Trading the GBP/PHP Forex Pair

The GBP/PHP is an exotic-cross currency pair with great volatility. For instance, the average pip movement on the 1H timeframe is 261 pips. As a matter of fact, PHP is one of the most emerging currencies in the previous year. We can find amazing trading opportunities in this currency pair if observed correctly.

When the volatility is high, the cost of trade will always be less. It is vice versa when the volatility is low. But this should not be considered as an advantage because it is always risky to trade when the volatility is high. To comprehend the above tables, higher percentages mean the costs of trade in the corresponding time frames are high. And when the percentages are low, trading costs are relatively low in those time frames.

Generally, it is recommended to take trades when the volatility of the market is around minimum to average values. Because, at min values, the volatility of the market will be low. But the costs are a bit high here when compared to the average and the maximum values. Trading at max values will reduce your trading costs but increase the risk of the trades. So we suggest you take a call according to the market situation.

There is another way to reduce the cost of trades, i.e., by using Limit Orders over Market Orders. By using these limit orders, slippage can completely be eliminated and thereby reducing the overall trading costs. In the below table, you can see how the costs have reduced by using limit orders with an STP broker.

STP Model Account (Using Limit Orders) 

Spread = 48 | Slippage = 0 | Trading fee = 0

Total cost = Slippage + Spread + Trading Fee = 0 + 48 + 0 = 48

Categories
Forex Videos

Forex Passive Income – Make Money In Your Sleep!

Passive Income In Forex Trading

Example A In this video, we will be looking at The process of making income in the forex market, It’s processes Methods for doing so and whether or not it is a viable method for you to increase your income, Including the risks involved in doing so.


Example B, So what is the difference between passive and active income? Active income is something where you might expect to earn money in regular employment, whereas passive income is irregularly made income, which requires little or no effort. In this context, it would mean that minimal effort is made by the trader in order to earn extra income outside of their normal job. Examples of passive income would be profits made from gambling, stock markets, Interest on investments, or capital gains are just some of the examples, where some definitions, especially with regard to taxation, will change from country to country.

Example C, Active income within the forex arena is where a trader will spend a long time looking at economic data while carefully assessing fundamentals and then checking technical patterns on charts before executing a trade in order to earn income.


Example D, Passive trading is where you want to make money in the forex market. But you do not actually want to go through the processes of learning everything about it and also spend time analyzing the markets via your charts, keeping on top of fundamental analysis. In this case, you may have to pay a third party a monthly fee. And unlike active traders, your trading will fit around your job and lifestyle.

Example E, Let’s look at the pros and cons of active vs. passive trading. Obviously, with passive income, the most important benefit is the amount of time you would have to commit to trading, which would be less than that of an active trader. However, this will often result in earning less money than an active trader. However, opting to spend less time monitoring your trades might expose you to extra risks. It might also be detrimental should you desire to follow a signal service that offered signals with timeframes that did not suit or fit in with your lifestyle. Unfortunately, the Forex Marina is often fitted with scam artists who operate Ponzi schemes and offer signals that are completely unreliable, and these should be avoided at all costs when considering passive trading.


Example F, So how can we earn money passive trading the forex market? One example is automated trading technology which is a trading robot that can be downloaded onto your computer and automatically places trades, setting its own stop losses and take profit levels. These are also known as EA’a or expert advisors. Some of them are very reliable, while some of them are not and you will need to do a lot of research before investing in the right EA for you. Banks and institutions are using these automated trading systems more and more and they are becoming extremely powerful tools with learning capabilities that adjust to various market conditions. It’s just a matter of finding one that suits your budget and expectations. And while the human brain can only analyze a few opportunities to trade during the day, a sophisticated algorithm can filter out profitable trades many many times each day, once a predetermined criterion has been met by the software program.

Example G, Of course, no matter which automated trading robot you decide to invest in, it will still need to be closely monitored. You would not want it to run away with itself losing you money. And while many people are skeptical about these automated trading robots, it is a statistical fact that over 75% of trades on the New York Stock Exchange are now made by these robots, and 70% of banks and institutions now opt for automated trading systems in Forex.
So if you are confident to take the next step and invest in an automated trading robot, we suggest that you carefully monitor it and make sure that it is operating within the perimeters that it was advertised to do and meet your criteria. It would also be a good idea for you to turn the EA robot off during times of high impact news, especially in the current climate where the COVID- 19 pandemics is sending trading shockwaves through the forex market on an almost hour-by-hour basis. Yet the trading robots are still in action while making money for their owners.
The accessibility of EA’s is now so Commonplace that even active Traders are able to program their own trading robots to open and close trades based on the parameters that they set. Some software developers will also work with you on a personal basis in order to develop such an algorithm once again that meets your criteria. This is certainly a growth area that he said to expand within the forex arena.


Example H, Next, we have copy trading. Again this is very suitable for passive traders where they simply subscribe to a copy trading service such as Signal-start or ETorror, and where their accounts can be automatically set to copy the trading accounts of traders who offer their services on their platform. In effect, every trade that they take on will be automatically copied onto your trading account, and where you will mirror their trades. If they win, you win, and if they lose, you lose. You can, however, adjust your risk parameters around their trading, and if they consistently make money, then you can increase your leverage to maximize your profits. The copy trading platforms offer a detailed trading history of their traders, and it is advisable to filter through each trader and seek out the one that is consistently making money while being risk-averse, and where this can be established by the level of drawdown that they are prepared to accept on their account. The lower the percentage of drawdown equals means the lower their risk tolerance is. You would typically pay a success fee to the copy trading platform, and perhaps a monthly fee and the trader will require a monthly fee also and sometimes this will be based on a percentage of winning trades and sometimes this will just be a monthly fee whether they make money or not, and sometimes this is a blended fee structure.

The example I, While this might seem like a perfect solution to a passive train, there are risk factors to consider. The forex market is fraught with risk, and again the current market climate pertaining to the COVID-19 pandemic is very relevant. Even Traders with an exceptional track record can make mistakes, and this could lead to your account being wiped out or even sending you into negative equity on your account if your trading platform does not protect you from this.

That might mean that they will be sending you an invoice for any monies that have been lost on your account due to a negative balance situation.
Therefore choose your trader carefully, as mentioned earlier, a few aggressive wins might give you peace of mind initially. Still, if this flips around into massive losses, it will adversely affect you, not only monetarily, but also psychologically as you tried to come to terms with losing money.

Example J, The next thing that passive traders utilize is forex trading signals. These services are offered via websites, text, and social media platforms. These forex signals are used by passive traders to enter trades based on the information that they receive or observe via one of these platforms and where they then manually use that information to place trades in the forex market.

While some signals are sent out by reliable, professional traders, many such service providers have little or no clue about the forex market, and some of these will be scams where they ask you to subscribe on a monthly fee-paying basis only to send you unreliable trading signals. Therefore do your homework about the signal provider, and if they charge a fee ask for a free initial trial, I’ll and watch for the reliability of the signals and only use them when you are able to ascertain that the information is consistently reliable.

Here at forex Academy, we offer a free signal service and where the signals are provided by professional traders and whereby we offer a detailed analysis with visual representations of why the trades have been taken, or in the case of pending orders why they should be taken. Most of these setups will be centered around professional and widely accepted and used technical analysis skills and sound fundamental analysis. And what is more, this service is offered absolutely free of charge.

In conclusion, passive income in the forex market is an extremely attractive option with many various ways to implement strategies such as copy trading, EA’s, and professional trading signals. And while there is a lot of research to do to establish which area is suitable for your lifestyle, after some detailed homework we are sure that you will find opportunities that suit you.

Categories
Crypto Videos

Master Crypto Trading With The 3 Black Crows Formation!

Profiting from the crypto market – Three Black Crows pattern

Three black crows are a pattern that indicates a bearish reversal of an uptrend. The black crow formation consists of three consecutive candlesticks that each opened within the read body of the previous candle and closed at a lower price than the previous candle. Traders often use this pattern in conjunction with other tools and indicators to confirm a reversal.

Three Black Crows – Explained

Three black crows is a visual pattern, which means that there are no calculations included to create the indicator. This pattern occurs when the bears overtake the bulls during a trending market. It is important to note that the candlesticks should have short to no shadows.
Being a visual pattern, three black crows are best used as a sign to seek further confirmation from other trading tools. The confidence a trader can put into the pattern greatly depends on how well-formed the pattern actually forms. If the shadows are long, it may simply imply that a minor shift in momentum will occur between the bulls and the bears.

Using volume indicators can make the three black crows pattern much more accurate. Volume during the uptrend that leads up to the pattern should be relatively low, while the three candle black crow pattern comes with high volume.

Three Black Crows vs. Three White Soldiers


Three black crows pattern has a complete opposite, which is the three white knights pattern. This pattern looks and acts exactly the same, but is completely reversed. It signals a bear to bull reversal and has three bullish candles instead of bearish ones.

Notable info

If the three black crows pattern formation involves a significant move to the downside, traders should be careful and look for oversold conditions caused by market instability. To mitigate this threat of pattern failure, we have to use an oscillator that can help with confirmation of the market reversal.

Categories
Forex Market Analysis

Daily F.X. Analysis, April 03 – Top Trade Setups In Forex – U.S. Labor Market In Highlights! 

On the forex front, the U.S. dollar strengthened against its major peers, with the ICE Dollar Index climbing 0.6% on the day to 100.10. Today’s eyes will be on the Markit that will publish final readings of March Services PMI for the eurozone (28.2 expected), Germany (34.2 expected), France (29.0 expected), the U.K. (34.8 expected) and the U.S. (38.5 expected). The European Commission will post February retail sales (+0.1% on month expected).

Economic Events to Watch Today     


EUR/USD – Daily Analysis

The EUR/USD sank 1.1% to 1.0845, posting a four-day decline. Later today, the eurozone’s retail sales data for February will be reported (+0.1% on month expected). The market is lacking trading volume and volatility, but the focus will remain on the European economic events. The European Commission will report February January PPI (-0.8% on year expected).

Italy is showing some signs of slowing down in the virus cases despite this the market traders already priced in a recession in the Europan economy, especially in Germany, because the circumstances in Spain continue to rise very fast. The lockdown across Europe continues to weigh on economic activities.

The market risk-off sentiment could more worsen if the U.S. initial jobless claims ignore past expectations, which will send the EUR/USD currency pair to the fresh lowest level. 

Besides the weekly data, the 

Looking forward, the USD moves will continue to play a significant role, as attention shifts to the Euro area Final Services PMI report. Services PMI for the eurozone (28.2 expected), Germany (34.2 expected), France (29.0 expected), the U.K. (34.8 expected), and the U.S. (38.5 expected). The European Commission will post February retail sales (+0.1% on month expected). 

Most importantly, the U.S. Non-Farm Payrolls and ISM Non-manufacturing PMI data are scheduled to release later this Friday. The coronavirus related headline could also drag attention.

Daily Support and Resistance

  • S1 1.0772
  • S2 1.0886
  • S3 1.0958

Pivot Point 1.0999

  • R1 1.1071
  • R2 1.1112
  • R3 1.1226

EUR/USD– Trading Tips

The EUR/USD is trading bearish at 1.090, having an immediate support level of around 1.07990. On the 8-hour timeframe, the EUR/USD has violated the support level of 1.085, which is now working as a resistance. Now, a bearish breakout of 1.07990 level may extend selling bias until the next support level of 1.0650. 

The MACD has also crossed below 0, confirming the chances of more bearish movements in the market. The 50 EMA is also keeping the EUR/USD in a selling mode. For now, the eyes will remain on the U.S. NFP figures to determine further trends in the market. Bearish crossover of 1.1050 area can open further room for selling until 1.065 level. Let’s consider taking selling trades below 1.07990 today.

GBP/USD– Daily Analysis

The GBP/USD edged up 0.1% to 1.2390. The United Kingdom politics are getting warm after the voting to replace the opposition Labour Party leader Jeremy Corbyn closes. Moreover, the top U.K. judge gave warning that the British judiciary system will take hints from the European rules unless last Brexit-day.

As per the latest report, the coronavirus cases rose to 33,718 as of 08:00 GMT on April 02, whereas there was a 24% rise in the death toll to 2,921 at the same time.

Meanwhile, the Washington Governor extended the stay-at-home order, whereas S&P declared its U.S. rating at AA+ with expectations of a recovery in 2021. As in result, the market’s risk-tone remains moderately heavy with the U.S. 10-year treasury yields dropped below 0.60%, and most Asian stocks are also flashing red.

The U.S. Labor Department will release March nonfarm payrolls report (-100,000 jobs, jobless rate at 3.8% expected). The Institute for Supply Management will post its Non-manufacturing Index for March (43.0 expected). It’s going to be a big day, not only for the GBP/USD but also for the rest of the dollar related currency pairs. 


Daily Support and Resistance

  • S1 1.217
  • S2 1.2278
  • S3 1.2334

Pivot Point 1.2387

  • R1 1.2443
  • R2 1.2495
  • R3 1.2604

GBP/USD– Trading Tip

The GBP/USD trade sideways in between the same trading range of 1.2275 – 1.2425. On the 4 hour timeframe, the Cable has formed neutral candles as we may not see further trends until and unless the pair manages to come out of this narrow range. For that reason, the pair needs a solid fundamental reason, which we are not expecting from the United Kingdom today. Let’s see if U.S. claims help drive some price action in the market. On the 4-hour timeframe, the GBP/USD pair is pretty much likely to find resistance around 1.2470, along with support around 1.2278. In the case of market breaks bellow 1.2278, we may see GBP/USD prices heading into the selling zone until 1.2100 and 1.2005. Whereas, the chances of buying remains solid over 1.2275 until 1.2520.

USD/JPY – Daily Analysis

The USD/JPY currency pair continues to taking bids and rose above the 108.00 level despite the high risk-off sentiment in the market, which would typically keep the Japanese yen secure. However, the pair’s bullish trend could be attributed to the sharp rise in oil prices. The USD/JPY currency pair is currently trading at 108.25 and consolidates in the range between the 107.81 – 108.27. The broad-based greenback strength also keeps the pair higher. 

As per the latest report, the COVID-19 cases have surpassed one million worldwide with over a death toll rate of over 50,000. Meanwhile, the Washington Governor extended the stay-at-home order, whereas S&P declared its U.S. rating at AA+ with expectations of a recovery in 2021. 

As well as, Japan is now facing a rise in cases that are increasing the market risk tone time by time, which eventually will likely be good for the safe-haven Japanese yen currency. As in result, the U.S. 10-year Treasury yields fell below 0.60%, down 3-basis points (bps), whereas the U.S. stock futures also mark losses of near 1.0% by the press time. Even so, stocks in Asia-Pacific are moderately positive after the recent Aussie, Japan data.

Lastly, Tokyo also reporting a record hit in daily coronavirus (COVID-19) cases extended school holidays through May 06. Recently, Japan’s Economy Minister Nishimura said that we would consider support for production rise and adopting of ECMO as part of the economic plans to combat from the COVID-19.

Daily Support and Resistance

  • S1 105.37
  • S2 106.64
  • S3 107.08

Pivot Point 107.91

  • R1 108.35
  • R2 109.17
  • R3 110.44

USD/JPY – Trading Tips

On Friday, the technical side of the market continues to exhibit choppy trading sessions within a wide trading range of 108.650 – 107.250. The best idea is to buy at the lower limit 107.250 and sell below 108.650 for now, but on the news release of U.S. nonfarm payroll, we can experience a potential breakout in the USD/JPY pair. 

The USD/JPY is trading at 108.270, consolidating sideways, right above a next support level of 107.750. On the higher side, a bullish breakout of 108.650 resistance level can lead the USD/JPY prices higher towards 109.750 level. Until then, we should look for doing choppy trading by selling below 108.600 and buying over 107.250. Below 107.200, the next support will stay around 105.990.

All the best for today! 

Categories
Crypto Market Analysis

Daily Crypto Review, Apr 3 – Bitcoin over $7,000? Is the downtrend finally over?

The cryptocurrency market had another, even more, successful push to the upside. The upswing was led by Bitcoin, which broke its immediate resistance. However, many altcoins outperformed it during the spike. Bitcoin is currently trading for $6,820, which represents an increase of 2.68% on the day. Meanwhile, Ethereum gained 3.99% on the day, while XRP gained 1.43%.

Swipe took the position of today’s most prominent daily gainer, with gains of 109.03%. Energi lost 5.453% on the day, making it the most prominent daily loser.

Bitcoin’s dominance increased half a percent in the past 24 hours as it was the one leading the push and gaining the most in value. Its value is now 65.73%, which represents a 0.5% difference to the upside when compared to yesterday.

The cryptocurrency market capitalization increased in the past 24 hours. Its current value is $190.79 billion. This value represents an increase of $5.49 billion when compared to the value it had yesterday.

What happened in the past 24 hours

The largest crypto exchange by market volume, Binance, has acquired the most popular crypto indexing website, CoinMarketCap. The purchase was made in secret, which means that the price is still undisclosed.

Binance CEO Changpeng Zhao announced that the deal officially closed March 31, even though a verbal agreement was there “a few months ago.”

Honorable mention

Stellar Lumens (XLM)

The Stellar Development Foundation has shown that it is thinking of the endangered during the times of crisis. It decided to dedicate 2.5 million Lumens to 6 non-profit organizations to help the coronavirus crisis. On top of that, they are very vocal in calling out the community to help.

The foundation will start the initiative off by donating 100,000 Lumens to each of the six charities, while the remaining funds will be used to match the community contributions on a 1-1 basis throughout the month of April.

_______________________________________________________________________

Technical analysis

_______________________________________________________________________

Bitcoin

Bitcoin bulls finally mustered enough strength to reach above the immediate resistance of $6,640, which was contested many times over the past couple of days. The push was gradual rather than sudden, and BTC managed to even contest the next resistance level ($6,850) which held up well. However, one candle brought extreme volume and pushed Bitcoin just below $7,300 just briefly.


Bitcoin’s volume increased when compared to the previous days, while its RSI level is hovering below the overbought territory.

Key levels to the upside                    Key levels to the downside

1: $6,850                                           1: $6,640

2: $7,085                                           2: $5,960

3: $7,420                                            3: $5,000


Ethereum

Ethereum had a clean, steady run to the upside, with its price going from $130 all the way up to $143, where it is trading at the time of writing. The second-largest cryptocurrency by market cap finally had an increase in volume after a long period of low-volume trading. The price, at one point, briefly spiked all the way up to the $150 but was quickly brought back down.


Ethereum’s RSI level is currently in the overbought territory on the 4-hour chart, sitting at around $74. A few resistance levels have been added, but they have not been confirmed as key levels yet.

Key levels to the upside                    Key levels to the downside

1: $168                                                1: $128

2: $178.6                                            2: $122.5 

3: $185                                                3: $100


Ripple

Ever since XRP has left the descending trend, it has been quite stable and upside-oriented. However, its gains did not match the rest of the crypto market. This is the case with today’s gains as well, as XRP gained the least out of the top3 cryptos. However, the move to the upside was steady, and the volume was increased.


XRP’s volume increased multiple times during one 4-hour candle, while it was slightly increased over the rest of the day. Its RSI level is currently at 61.

Key levels to the upside                    Key levels to the downside

1: $0.19                                             1: $0.165

2: $0.2                                               2: $0.147

3: $0.205                                             3: $0.1

Categories
Forex Assets

GBP/INR Exotic Pair – Analyzing The Trading Costs Involved

Introduction

GBP Pound sterling, also known as the pound, is the official currency of the United Kingdom. It is very well known, and in fact, it is the fourth most-traded currency in the Forex market. INR (Indian rupee) is the official currency of India. This currency is controlled and managed by the Reserve Bank of India.

GBP/INR

In the Forex market, one currency is always quoted against the other as the currencies are trades in pairs. GBP/INR represents the trading of the Pound sterling against the Indian rupee. In this case, the first currency (GBP) is the base, and the second (INR) is the quote currency. The GBP/INR is classified as exotic-cross currency pair.

Understanding GBP/INR

To find out the relative value of one currency, we need another currency to compare. If the value of the base currency goes down, the value of the quote currency goes up and vice versa.

The market value of GBPINR determines the strength of INR against the GBP. This can be easily understood as 1GBP is equal to how much INR. So if the exchange rate for the pair GBP/INR is 94.034, it means 1GBP is equal to 94.034 INR.

Spread

Forex brokers have two different prices for currency pairs: the bid and ask price. The bid price is the selling price, and ask is the buy price. The difference between the ask and the bid price is called the spread. The spread is how brokers make their money. Below are the spreads for GBP/INR currency pair in both ECN & STP brokers.

ECN: 55 pips | STP: 57 pips

Fees

A Fee is simply the commission we pay to the broker each time we execute a position. There is no fee on STP account models, but a few pips on ECN accounts.

Slippage

Slippage refers to the difference between the trader’s expected price and the actual price at which the trade is executed. It can occur at any time but mostly happens when the market is fast-moving and volatile. Also, sometimes slippage occurs when we place a large number of orders at the same time.

Trading Range in GBP/INR

The amount of money we will win or lose in a given amount of time can be assessed using the trading range table. It is a representation of the minimum, average, and maximum pip movement in a currency pair. This can be evaluated simply by using the ART indicator combined with 200-period SMA.

Procedure to assess Pip Ranges

  1. Add the ATR indicator to your chart
  2. Set the period to 1
  3. Add a 200-period SMA to this indicator
  4. Shrink the chart so you can assess a significant period
  5. Select your desired timeframe
  6. Measure the floor level and set this value as the min
  7. Measure the level of the 200-period SMA and set this as the average
  8. Measure the peak levels and set this as Max.

GBP/INR Cost as a Percent of the Trading Range

The cost of trade mostly depends on the broker and varies based on the volatility of the market. This is because the total cost involves slippage and spreads apart from the trading fee. Below is the representation of the cost variation in terms of percentages. The comprehension of it is discussed in the following sections.

ECN Model Account

Spread = 55 | Slippage = 3 |Trading fee = 5

Total cost = Slippage + Spread + Trading Fee = 3 + 55 + 5 = 63

STP Model Account

Spread = 57 | Slippage = 3 | Trading fee = 0

Total cost = Slippage + Spread + Trading Fee = 3 + 57 + 0 = 60

Trading the GBP/INR Exotic pair

The GBP/INR is an exotic-cross currency pair and is volatile in nature. For instance, the average pip movement on the 1H timeframe of this pair is about 432 pips. From the above tables, it is clear that the higher the volatility, the lower is the cost of the trade. However, this is not an advantage as it is risky to trade when the markets are highly volatile.

While reading the above tables, if the percentages are larger, higher are the costs on the trade. Likewise, if the percentages are small, lower are the costs. So, this can be interpreted as the trading costs are higher for low volatile markets and lower for high volatile markets.

It is always recommended to trade when the volatility is around the minimum values. Because at min values, the volatility is low, and the costs are a little high compared to the average and maximum values. But, if your priority is towards reducing costs, you may trade when the volatility of the market is around the average values. Cheers!

Categories
Forex Videos

Is Forex Gambling? The Harsh Truth!

What Is Forex & Is It Not Just Gambling?

There has been an explosion in interest in forex trading since the advent of the retail Forex market, which opened up after the internet was born.


Example A, Much hype has been made of people making fortunes from forex trading in the retail space. So is it all true, or is it a fabrication, and is it really easy to make money trading Forex? Unfortunately, wherever there is money involved, there will always be fraud, and therefore you will find a lot of scams in the forex retail space within social media sites such as Youtube and Facebook and Instagram, etc. People upload videos onto YouTube telling you that they will help you make a fortune and then, of course, they want to be paid money for their education programs or perhaps trading on your behalf with your money, when in actual fact they are ill-equipped and do not care about making a profit for you, they are simply out for your subscription fee or investment funds.
And so the forex world may conjure up ideas of easy money and wealth, with flash cars, luxurious houses, jet-set lifestyles, and exotic holidays. That is the reality Far from the portrayal that many of these scammers would lead you to believe?
In truth, the forex market is a skilled profession. There is a steep learning curve to go through to understand how this industry works. It is a highly complex and extremely fluid marketplace, Where over 5 trillion dollars are traded every day and which is interconnected throughout the financial markets With other asset classes such as stocks bonds, precious metals commodities, and oil. You would not strip a car engine down if you had not been to college to learn about car mechanics and you would not attempt to build a house without first learning how to do so, and you would not try and operate on a human being without first learning all the processes, having been to university. And the forex market is exactly the same: you must learn about economics and the fundamentals surrounding the government’s financial policies of the countries whose currencies you wish to trade in. You will need to learn how to look at trading charts, in what is called technical analysis, to learn how currencies, which are always traded in pairs, are moving against each other, in order to successfully find the trends and trade them accordingly.

Therefore the effort that you put into accumulating the relevant knowledge is the only way that you will be able to successfully and consistently make money trading Forex. Once you have learnt everything that you need to be able to trade successfully, you will then need to backtest your results and forward test them on a demo account before you risk losing your hard-earned money trading in the marketplace for real. Therefore there is no quick fix strategy on how to make money trading; anything short of what is necessary means that you will simply be gambling. And the forex market can be deadly if you slip up.

So how does this market work? The Forex or FX market is an international exchange that is un-centralized, which means that nobody is in charge of it, and where currencies are bought and sold against each other in pairs. We are over 5 trillion dollars being traded from Monday to Friday, 24 hours a day. It is the most liquid business on the planet. There are specific windows when the volume is higher than at other times during the day, and these are the best x to seek out trans in currency pairs and where traders look to latch onto a trend because this is where the real money can be made due to the increased volume going through at these particular times.


Example B, Just like other commercial areas, fluctuations in currencies are largely driven by supply and demand. If you have too much of a product, it tends to be cheaper, and where a product is difficult to obtain, it becomes more expensive, and this can be true with currencies.


Example C
, So when there is a surplus of a particular currency, it becomes cheaper to obtain And may fall against a particular counterpart currency.


Example D and the opposite is true when demand for a currency increases and there are fewer sellers, in which case the price of the currency will become more expensive against its counterpart currency, and the value of the currency will therefore rise.
So how do we apply this demand and supply scenario to the forex market? Each time a currency is bought, surplus demand is created within the market, which subsequently pushes the price of balance, and the price will rise.
And each time I currency is sold, a surplus supply is created. And this time the opposite is true, it throws the market price off balance and pushes the price down.

The Amount that the price moves up or down during these situations is dependent on the amount of volume going through at any particular time, and this fluctuates during the day, and where during those periods where extra volume is experienced during the busiest times of the trading day. Therefore the biggest likely market moving generators tend to be central banks, large financial institutions, large hedge funds, sovereign wealth funds, and whereby the retail sector has a much smaller impact on price fluctuations due to the fact that they only make up a very small part of the forex market.
These constant price fluctuations in the forex market are the main driver for how traders make money in trading. The economic events in the world are constantly changing, where government policymakers adjust their financial policies in relation to the swings in the fortune of their countries’ which affects their gross domestic product and whereby economic data releases, which come out on a weekly and monthly basis are the main drivers as to why there are consistent movements in price action pertaining to the balance of supply and demand for each currency.

Because currencies are always traded in pairs when trading, you are betting on the value of one currency against another moving up or down based on the underlying supply and demand for each currency.

Categories
Forex Course

Introduction To Forex Course 4.0

Hello People,

As you all know, we have completed Course 3.0 successfully. Thanks a lot for the brilliant response and great job on the quizzes you all have taken. We have covered some of the most critical fundamentals pertaining to technical analysis in course 3.0. Please make sure to practice all the concepts we have discussed in a demo account. Without practice, it is impossible to ace the Forex Market using technical analysis. We have also made a quick navigation guide for Course 3.0 so that it’ll be easier for you to get a quick recap whenever required. You can find that guide in the link below.

Quick Navigation Guide – Forex Academy Course 3.0

With all these learnings in mind, we will be moving on to the Forex Academy Course 4.0. We have discussed most of the basics concerning technical trading in the previous course. Hence, we will be exploring some sophisticated strategies and intermediate to advanced concepts of technical analysis in Course 4.0. It is crucial to have acquired the knowledge of whatever we have studied in the previous course to catch up with these complex concepts. So it is highly recommended to finish the previous course before starting off with this one.

Topics that will be covered in Course 4.0

Forex Chart Patterns & Their Importance

Trading The Most Popular Chart Patterns

Oscillators

Momentum Indicators

Pivot Points & their importance

Each of these topics will have about 7 to 10 course articles with corresponding quizzes. The USP of this course are the writers who prepared TOC and the related content. They are professional technical & price action traders who have a combined experience of 20+ years in the Forex market. So make sure to follow all the concepts that are discussed in this course and practice them well to become a successful Technical Trader. Also, try to answer the quiz questions until you get all the questions right. We wish you all the luck. Cheers!

Categories
Forex Elliott Wave

Analyzing the Triangle Pattern – Intermediate Level Part 3

In the previous article, we expanded the ideas of the triangle pattern; in particular, we talked about the contracting triangle and its variations. In this last part dedicated to the triangle pattern, we will review the non-limiting triangle.

Non-Limiting Triangle

Non-limiting triangles do not differ much from limiting triangles. Both types of triangles must meet the minimum construction requirements. However, they will have the following characteristics:

– Channeling. In the case of the non-limiting triangle, the trend lines are not convergent but divergent.

1. Congestion occurs just at or near the apex of the convergence lines.

The wave analyst should note that the term “just or near the apex” refers to the end of wave E being close to the intersection of both trend lines and the extent of wave E to be measured in terms of the time spent in the triangle formation.

b. The triangle pattern is considered Non-Limiting if the measurement of time elapsed from its beginning until the end of wave E, and the apex occurs after 40% of the interval has passed.

c. There must be a post-thrust correction that must return to the apex area.

If the triangle met any of these three conditions, then the triangle will be said to be of the non-limiting type.

Post-Triangular Thrust

The distance of the thrust outside the limits of the non-limiting triangle does not have a specific restriction. However, it can reach the length equivalent to the longest segment of the triangle. 

Likewise, once reached this extension, there is a possibility that the price will continue in the original direction of the thrust.

Expanding Triangles

Expanding triangles are very frequent in complex corrections. It is characterized because as it progresses in its formation, each segment, or the majority, is larger than the previous one.

The rules that characterize the expanding triangles are described below:

  1. Wave A or Wave B will always be the smallest wave in the triangle.
  2. In most cases, the E wave will be the longest.
  3. Expanding triangles cannot be part of wave B of a zigzag pattern. Nor can they be part of an intermediate wave, that is, waves B, C, or D of a triangle of higher degree.
  4. In most cases, the E wave will be the longest and most complex segment of the triangle. This wave can be formed by a zigzag or by a complex correction.
  5. Generally, wave E will pierce the trend line joining the ends of waves A and C.
  6. Line B-D should act similarly to contracting triangles.
  7. The extension of the thrust of the expanding triangle must be less than the longest wavelength of the triangle.
  8. When comparing the length from wave E to wave A, it must be verified that each previous wave must be greater than or equal to 50% of the next wave.

The following figure shows the three most common types of expanding triangles, of which the irregular is the most likely to appear in the real market.


In expanding triangles also exists limiting and non-limiting triangles. However, in this type of formations, there is no post-triangular variation between one and the other. The difference lies in the wave position that the triangle holds, which can be “standard” or be part of a complex correction.

Limiting Expanding Triangle

The term “limiting” refers to whether the triangle is a fourth wave or a B wave. Its main characteristics are described below.

1. An expansive limiting triangle usually appears in wave B, particularly in irregular failures or in flat wave formations with failure in wave C.

2. The thrust outside the triangle is a minimum of approximately 61.8% of the structure, measured from its highest to the lowest level.

Horizontal Expanding Triangle

This variation rarely appears in the real market. However, this does not mean that there is no possibility of it showing up in real markets.

The main characteristics of a horizontal triangle are:

1. Wave A must be the smallest of the formation.

2. Waves B, C, D, and E y must each exceed the final point of the previous wave.

3. There is a possibility that wave E will exceed the guideline of waves A-C.

Irregular Expanding Triangle

This variation is more common, and its characteristics are as follows:

1. Wave B is smaller than Wave A, while the rest of the waves maintain their increasing characteristics.

2. The longer the duration of the pattern, the higher the chance that the guideline will tilt up or down.

Continuous Expanding Triangle

This expanding triangle has a bias due, on the one hand, because wave B is longer than wave A, and on the other hand, because wave C is the shortest. The E wave, meanwhile, can be more volatile or “violent” than the rest of the waves.

Non-Limiting Expanding Triangle

These types of triangles tend to appear in complex corrective formations, for example, in the first or last stage of a complex sequence. In this sense, in a complex corrective structure, the thrust will generate a wave X.

Finally, concerning the apex, it is located before wave A and must be produced before it reaches 20% of the construction time of wave A.

Conclusions

With this article, we have ended the standard corrective patterns defined by the Elliott wave theory. As we have seen in previous examples, expansive triangles also usually appear on waves 4 and B. However, this does not mean that they cannot appear on wave 2.

In the next educational article, we will see the process of validating impulsive structures.

Suggested Readings

  • Neely, G.; Mastering Elliott Wave: Presenting the Neely Method; Windsor Books; 2nd Edition (1990).


Categories
Crypto Market Analysis

Daily Crypto Review, Apr 2 – Bitcoin failing to break $6,640; What’s next?

The cryptocurrency market attempted another push towards new highs as Bitcoin bulls tried to get its price above $6,640. Even though most cryptos are in the green, the push was not successful, which may pose a problem in the short term. Bitcoin is currently trading for $6,595, which represents an increase of 4.63% on the day. Meanwhile, Ethereum gained 3.12% on the day, while XRP gained 1.95%.

Digitex Futures took the position of today’s most prominent daily gainer, with gains of 26.06%. IOTA lost 4.53% on the day, making it the most prominent daily loser.

Bitcoin’s dominance increased over half a percent over the past 24 hours as it was the one leading the push and gaining the most in value. Its value is now 65.23%, which represents a 0.54% difference to the upside when compared to yesterday.

The cryptocurrency market capitalization increased in the past 24 hours. Its current value is $185.3 billion. This value represents an increase of $5.8 billion when compared to the value it had yesterday.

What happened in the past 24 hours

Statistics on crypto adoption came out recently, showing that online purchases using Bitcoin went down during Q1 of 2020. However, the same goes for Visa and some other apps. However, crypto exchanges saw a major increase in new accounts in 2020, showing that people are responding to the price drop opportunistically.

What seems to be the case here is that people recognize crypto as a way to hedge their portfolios, so they are investing. However, due to the economic crisis knocking at our doors, people that do not have enough funds simply can’t spend it on online purchases, which is reducing the real-world use cases significantly.

Honorable mention

Ripple

The class-action lawsuit against Ripple had an amendment which includes additional claims of false advertising as well as unfair competition, now claiming that XRP might not be a security.”

The investors’ sixth and seventh claims would appear to be a direct hedge for the event that the judge rules “against” the original suit, basically saying that XRP was an unregistered security, and therefore sold as such.

_______________________________________________________________________

Technical analysis

_______________________________________________________________________

Bitcoin

After a steady day of consolidating, Bitcoin attempted another swift push towards the $6,640 resistance level. Even though the price reached over the level, it was quickly pushed down, announcing the fail of the push. Bitcoin is currently trading just under this key level. If the trend of Bitcoin failing to break the immediate resistances continues, we may expect a retest of the lows very soon.


Bitcoin’s volume almost tripled during the push, but quickly normalized. Its RSI level is now descending and is currently at the value of 59.

Key levels to the upside                    Key levels to the downside

1: $6,640                                           1: $5,960

2: $6,850                                           2: $5,000

3: $7,085                                            3: $4,300


Ethereum

We said yesterday that Ethereum would most likely not move without Bitcoin moving first, therefore deciding its direction. This is exactly what happened today. Ethereum followed Bitcoin to the upside, but only managing to reach its $139 resistance level before stopping the move. This key level held up strong, and ETH did not even manage to go above it.


Ethereum’s volume increased during the upswing but quickly dwindled to its usual low levels. Its RSI level is currently at 60.5.

Key levels to the upside                    Key levels to the downside

1: $168                                                1: $128

2: $178.6                                            2: $122.5 

3: $185                                                3: $100


Ripple

XRP didn’t have as good a day as BTC or ETH did, as its price didn’t increase as much. However, the fact that XRP didn’t go back under the descending trend seems to be good enough. XRP seems to be responding to a level between $0.1765 and $0.1785.


XRP’s volume increased each time the cryptocurrency retested the descending trend line. Its RSI is currently sitting at the value of 56.

Key levels to the upside                    Key levels to the downside

1: $0.19                                             1: $0.165

2: $0.2                                               2: $0.147

3: $0.205                                             3: $0.1

Categories
Forex Assets

GBP/TRY – Knowing The Trading Costs Involved While Trading This Exotic pair

Introduction

GBP Pound sterling, also known as the pound, is the official currency of the United Kingdom and many others. The sterling is the fourth most-traded currency in the Forex market. On the other hand, TRY is known as the Turkish lira. It is the official currency of Turkey and the self-declared Turkish Republic of Northern Cyprus.

GBP/TRY

Currency pairs are the national currencies from two countries coupled for being exchanged in reference to each other. In the Forex, one currency is quoted against the other. GBP/TRY is the abbreviation for the Pound sterling against The Turkish lira. In this case, the first currency(GBP) is the base currency, and the second(TRY) is the quote currency. The GBP/TRY is classified as an exotic-cross currency pair.

Understanding GBP/TRY

In the Forex market, to find out the relative value of one currency, we need another currency to compare. The market value of GBPTRY determines the strength of TRY against the GBP that can be easily understood as 1GBP is equal to how much lira(TRY), so if the exchange rate for the pair GBPTRY is 8.0877. It means in to order to buy 1GBP we need 8.0877 TRY

If the value of the base currency goes down, the value of the quote currency goes up and vice versa.

Spread

The broker provides us with two prices, Ask price and Bid price. Here, the Bid price is the buy price, and the Ask price is the Sell price. The difference between the ask and the bid price is called the spread. The spread is how brokers make their money.

ECN: 61 pips | STP: 64 pips

Fees

A Fee is simply the commission we pay to the broker each time we execute a position. There is no fee on STP account models, but a few pips on ECN accounts.

Slippage

Slippage refers to the difference between the trader’s expected price and the actual price at which the trade is executed. It can occur at any time but mostly happens when the market is fast-moving and volatile. Also, sometimes when we place a large number of orders at the same time.

Trading Range in GBP/TRY

The amount of money you will win or lose in a given amount of time can be assessed using the trading range table. It is a representation of the minimum, average, and maximum pip movement in a currency pair. This can be evaluated simply by using the ATR indicator combined with 200-period SMA.

Procedure to assess Pip Ranges

  1. Add the ATR indicator to your chart
  2. Set the period to 1
  3. Add a 200-period SMA to this indicator
  4. Shrink the chart so you can assess a significant period
  5. Select your desired timeframe
  6. Measure the floor level and set this value as the min
  7. Measure the level of the 200-period SMA and set this as the average
  8. Measure the peak levels and set this as Max.

GBP/TRY Cost as a Percent of the Trading Range

The cost of trade mostly depends on the broker and varies based on the volatility of the market. This is because the total cost involves slippage and spreads apart from the trading fee. Below is the representation of the cost variation in terms of percentages. The comprehension of it is discussed in the following sections.

ECN Model Account

Spread = 61 | Slippage = 3 |Trading fee = 5

Total cost = Slippage + Spread + Trading Fee = 3 + 61 + 5 = 69


STP Model Account

Spread = 64 | Slippage = 3 | Trading fee = 0

Total cost = Slippage + Spread + Trading Fee = 3 + 64 + 0 = 67


Trading the GBP/TRY

From the trading range table, it can clearly be ascertained that this pair is very volatile. For example, the pip average pip movement in the 1H timeframe is as high as 400 pips. This also means that the risk is high from the 1H timeframe all the way to the 1M timeframe.

As far as the costs are concerned, it is in favor of the traders. This is because the greater the volatility, the lower are the costs. That is the reason the percentage values are large in the min column and comparatively smaller in the average and max columns.

With this in mind, one can opt to trade this pair when the volatility values are between the minimum and average. In doing so, the volatility will be comparatively lower, which in turn reduces the risk on the trade and also keeps the cost in balance with the volatility.

Categories
Forex Market Analysis

Gold’s Choppy Session Continues -Quick Trade Setup! 

On Wednesday, the precious metal gold prices firmed as investors sought safe-haven securities following the U.S. economic figures, which heightened concerns of an economic slowdown amid growing global constraints and lockdowns to fight the coronavirus pandemic.

Gold prices fell nearly 0.9% at $1,585.08 an ounce during the U.S. session as the release of Advance Nonfarm payroll seems to have a muted impact on gold prices. The United States Federal Reserve has proved a temporary repo facility for foreign central banks and other international monetary authorities. 

Hence, this should continue to decrease the bullish pressure on the greenback and possibly move the ball into sellers court. Selling in the U.S. dollar can support gold, but right now, we aren’t seeing any significant movement in the market. 

The G20 finance ministers and central bankers meet bankers’ to come up with any meaningful results apart from committing to previous commitments given to respond to COVID-19. In addition to the current meeting, the next meeting is due on 15 April, which keeps the uncertainty high in the financial and commodities markets. 

Lastly, intensifying fears about an expected global recession further benefitted the USD’s safe-haven status, which helps improve dollar prices, while driving selling pressure on gold.


On the technical front, the precious metal is trading at 1,585 level, having immediate support at 1,577 and resistance at 1,600 level for now. Bullion has completed 50% Fibonacci retracement until 1,577 level, and violation of this level can open up further room for selling until the next support level of 1,548, which marks the 61.8% Fibo level. 

XAU/USD – Daily Technical Levels

Support     Resistance 

1,560.95     1,606.8

1,544.43     1,636.13

1,498.57     1,681.99

Pivot Point 1,590.28


On the higher side, a bullish breakout of 1,600 level can extend buying until 1,620 and 1,635 level. Consider staying bearish below 1,600 level today. Good luck! 

Categories
Forex Price-Action Strategies

The Benefit of Checking Minor Chart before Taking Entry

In one of our lessons, we have learned that when a breakout confirmation candle comes out with a long upper or lower shadow needs to be checked on the 15-min chart. The last 15 M candle plays a significant role to drive the price towards the breakout direction. A breakout confirmation candle with a long upper or lower shadow does not mean that the last 15M candle comes out as a reversal candle. We are going to demonstrate an example of this in today’s lesson.

The price after being bearish finds its support. The chart produces two bullish candles consecutively. A level of resistance produces a bearish reversal candle. The correction length looks good. Let us proceed to the next chart.

The next candle comes out as a bearish candle as well. However, it closes within the consolidation support. The sellers are to wait for a candle to breach the level closing well below it. It is waiting time for the sellers.

The last candle breaches through the consolidation support. The breakout does not look an explicit breakout. However, it closes below the level. If the next candle closes below the breakout level, that would confirm the breakout. The breakout confirmation candle holds the key for the sellers.

The last candle closes below the breakout candle. This confirms the breakout. However, look at the long lower spike. This looks ominous for the sellers. In naked eyes, it does not look to be a good confirmation candle for the sellers to trigger a short entry. Let us now flip over to the 15 M chart and find out how the last candle comes out.

This is the 15 M chart. The last candle is a strong bearish candle despite having a long lower spike. We do not need to flip over to any minor chart here. This means the pair is having a strong bearish momentum in the 15 M chart, which is a signal for the sellers to trigger a short entry.

As expected, the next candle comes out as a bearish candle. It seems that the price is going to hit 1R in a hurry. Let us proceed to the next chart to find out how the trade goes.

The price heads towards the South with one more candle. It hits the take profit level (1R) with ease. The price may make a more bearish move as well. The trade setup with a less promising breakout confirmation candle works wonderfully well for the traders. Do not forget to check the 15 M chart if the confirmation candle has a long upper/lower shadow. It may help you decide which entry to take and which one not to.

Categories
Forex Elliott Wave

Analyzing the Triangle Pattern – Intermediate Level Part 2

In our previous article, we saw that the triangle pattern is the most common of the three standard formations defined by R.N. Elliott. In this educational post, we will review the different types of variations of this corrective structure.

Contractive Triangle

Within the group of triangles, this formation is the most common of all. The minimum requirements of this structure are:

1. Once the contractive triangle is completed, the price must make a “thrust” that should be greater than or equal to 75% of the largest internal segment. On the other hand, this movement should not exceed 125% of the most extended triangle segment.

The following figure shows two cases. In the first, we see that wave A is the most extended segment of the contracting triangle after wave E is completed. The thrust can reach between 75% and 125% of wave A.

In the second case, we observe that wave B is the most extensive of the contracting triangle. Analogously to the previous case, we distinguish that the thrust made by the price should not be less than 75% nor greater than 125 of wave B.

2. In this type of triangle, the thrust must further exceed the highest (or lowest) end it reached during structure formation.

In other words, when the contracting triangle is about to be completed, two parallel lines should be drawn over the most extended segment, depending on which side the thrust is on, the price should touch the top or bottom line.

3. The E wave must be the smallest of all the segments of the triangle in terms of price.

As we observe in the following figure, the internal segment corresponding to wave E must be the smallest of all in terms of price, but not the time it takes for this movement to complete.

Limiting triangle

R.N. Elliott defined the limiting triangle as a formation that occurs in the waves fourth and B. Its name is because its completion must occur under specific conditions,

The completion of the limiting triangle in wave E must happen in the range of 20% to 40% before the apex point of the triangle.

Horizontal Limiting Triangle

1. The trendlines of the triangle must move in opposite directions.

In other words, when drawing the ends of the triangle corresponding to the end of waves A-C and B-D, the trendlines must correspond to a contracting triangle respecting the basic structure defined by Elliott.

2. The apex of the triangle must be within a range whose amplitude is 61.8% of the most extended segment of the triangle and whose center is the midpoint of that segment.

In the case of the previous figure, the most extended wave is wave B. However, this is analogous for the situation in which wave A or wave C is the longest in the triangle.

3. Wave D must be smaller than the internal leg corresponding to wave C. Likewise, the segment corresponding to wave E must be shorter than wave D.


Irregular Limiting Triangle

This type of triangle must perform a higher thrust and with greater speed than in the case of the horizontal triangle. The distinctive element of this formation is wave B, which must be longer than wave A. In general, its main characteristics are as follows.

  1. Wave B should not be higher than 261.8% of Wave A. Under normal conditions, it should be less than 161.8% of Wave A.
  2. Waves C, D, and E must be smaller than the previous wave.
  3. The trend lines of the triangle must have opposite directions.

Running Limiting Triangle

This type of wave can be confused with the Double Three corrective structure. Its main characteristics are:

  1. Wave B is longer than Wave A. It is also the largest segment of the triangle.
  2. Wave C is smaller than Wave B.
  3. Wave D is shorter than Wave C.
  4. Wave E is shorter than Wave D and is the smallest of the triangle.
  5. The thrust after the completion of wave E can become more extensive than wave B and even reach 261.8% of wave B.

Conclusions

In this educational article, we have examined the different variations of triangles and expanded their contracting variants. We must emphasize that its importance lies in the fact that this type of formations, in particular, the contracting triangle, is the most common of all triangular patterns. The knowledge of how triangles behave can provide the wave analyst with an advantage that would allow him to more accurately predict what the next market move would likely be.

In the next article, we will see the last part of the corrective formations. In particular, we will review the non-limiting triangles and their main characteristics.

Suggested Readings

– Neely, G.; Mastering Elliott Wave: Presenting the Neely Method; Windsor Books; 2nd Edition (1990).

Categories
Forex Market Analysis

Daily F.X. Analysis, April 01 – Top Trade Setups In Forex – Eyes on Advance ADP Figures 

The U.S. dollar failed to keep its momentum, with the Dollar Index marking a day-high of 99.93 before closing down 0.2% on the day to 99.01. Later today, eyes will be on the Markit as it will publish final readings of March Manufacturing PMI for the eurozone (44.6 expected), Germany (45.5 expected), France (42.9 expected), the U.K. (47.0 expected) and the U.S. (48.0 expected). The European Commission will report February jobless rate (steady at 7.4% expected). The German Federal Statistical Office will post February retail sales (+0.1% on month expected). Here’s a technical and fundamental outlook for today.

Economic Events to Watch Today     


EUR/USD – Daily Analysis

The EUR/USD was broadly flat at 1.1027. Official data showed that the eurozone’s CPI grew 0.7% on year in March (+0.8% expected), while the German jobless rate was steady at 5.0% (5.1% estimated). Later today, the eurozone’s February jobless rate (7.4% expected) and German retail sales (+0.1% on month estimated) will be released.

Italy marked as the second-highest country of confirmed cases in the world after the United States (140,470). Total cases are 92,472 confirmed, marking up the highest death rate in the world. 

Today, the manufacturing data are also scheduled to release in this day later. A disappointment on expectations by a big margin will likely send the greenback lower across the board. The European Commission will report February jobless rate (steady at 7.4% expected). The German Federal Statistical Office will post February retail sales (+0.1% on month expected).

Looking forward, all traders now keep their eyes on the German retail sales and manufacturing data, which is scuddled to release on at 06:00 GMT. The coronavirus headlines will take a driver’s seat while investors are likely to hold cash in the form of U.S. dollars due to intensifying coronavirus concerns.

Daily Support and Resistance

  • S1 1.0772
  • S2 1.0886
  • S3 1.0958

Pivot Point 1.0999

  • R1 1.1071
  • R2 1.1112
  • R3 1.1226

EUR/USD– Trading Tips

On Wednesday, the EUR/USD is trading slightly bearish at 1.097, having an immediate support level of around 1.0947. As we can see on the 4-hour chart above, the EUR/USD had formed a bullish channel supported the pair around 1.1060, but has now been violated. The breakout of an upward channel has a huge potential to drive the selling trend in the EUR/USD currency pair.

On the higher side, the EUR/USD pair is facing resistance at 1.1050 area. Bullish crossover of 1.1050 area can open further room for buying until 1.1145 level. Whereas, the chances of a bearish bias will remain strong if the pair closes a 4-hour candle below 1.0950 level today. On the lower side, the target is likely to target 1.0947 and 1.0885. 


GBP/USD– Daily Analysis

The GBP/USD was little changed at 1.2413. A day before, Sterling surged as traders reconciled their portfolios before the end of the first quarter of 2020, although analysts said the currency remained fragile.

However, the worse than expected economic events throughout the first quarter continued to weigh on the market’s risk-tone during the early Asian session.

Today, the US ADP Employment report and the ISM Manufacturing data are scheduled to release in this day later. A miss on expectations by a significant margin will likely send the greenback lower across the board. However, the losses could be temporary, mainly because the coronavirus outbreak is not showing any sign of slowing down with the number of cases in the U.S. continue to rise and reached above 177,000 so far. 

The economic calendar is mostly empty for the U.K.; therefore, the coronavirus updates will keep the driver’s seat until the U.S. session. Moreover, the ADP Employment Change and March month activity numbers from the world’s largest economy will be essential to watch for taking fresh direction.

Daily Support and Resistance

  • S1 1.202
  • S2 1.2208
  • S3 1.2319

Pivot Point 1.2396

  • R1 1.2507
  • R2 1.2584
  • R3 1.2772

GBP/USD– Trading Tip

The GBP/USD hasn’t moved much as it continues trading sideways around within a narrow trading range of 1.2275 – 1.2425. On the 4 hour timeframe, the Cable is forming bullish and bearish candles, showing a tug of war between the bulls and bears. We may not see further trends until and unless the pair manages to come out of this narrow range. In order to do this, the pair needs a solid fundamental reason, which we are not expecting from the United Kingdom.

On the 4-hour timeframe, the GBP/USD pair is pretty much likely to find resistance around 1.2470, along with support around 1.2278. In the case of market breaks bellow 1.2278, we may see GBP/USD prices heading into the selling zone until 1.2100 and 1.2005. Whereas, the chances of buying remains solid over 1.2275 until 1.2520.


USD/JPY – Daily Analysis

The USD/JPY currency pair looking flat and hit the high of 107.95 from the low o 107.25 mainly due to the greenback continue to pick the bids as a safe-haven demand after the report in the U.S. said that experts expecting the virus could kill almost 100,000 and 240,000 Americans despite social distancing measures. 

The USD/JPY got support also from the Bank of Japan’s Tankan corporate survey, which showed Japanese manufacturers turned downbeat for the first time in seven years. The USD/PY is trading at 107.58 and consolidates in the range between the 107.25 – 107.94.

Besides, the risk sentiment in the market is getting worse time by time due to intensifying concerns over the coronavirus (COVID-19). As in result, the USD/JPY pair dropped earlier as JPY was getting strong bids due to its safe-haven demand while the U.S. dollar strength was supporting the pair to stay bullish. 

As per the latest report, the coronavirus outbreak is not showing any sign of slowing down with the number of cases in the U.S. continue to rise and reached above 177,000 so far. The coronavirus cases continue to increase in Europe, with Spain and Italy reporting a total of 200,000 cases so far.

The U.S. President Trump was increasing the possibilities of another major infrastructure package or some $2trn within the next relief bill. At the same time, the Democratic House Speaker, Nancy Pelosi, also declared that the United States should start developing and discussing the 4th stimulus bill. Thus, the USD/JPY pair can trade bearish in the wake of a weaker dollar and stronger yen.

Daily Support and Resistance

  • S1 105.37
  • S2 106.64
  • S3 107.08

Pivot Point 107.91

  • R1 108.35
  • R2 109.17
  • R3 110.44

USD/JPY – Trading Tips

On Wednesday, the USD/JPY is trading at 107.570, consolidating sideways, right above an immediate support level of 107.200. The USD/JPY’s trading range remains narrow as the upper limit stays at 108.500, and the lower limit rests at 107.150. 

We see neutral candles, which may trigger a breakout at any side of the market. But the bullish breakout of 108.650 resistance level can lead the USD/JPY prices higher towards 109.750 level. Until then, we should look for doing choppy trading by selling below 108.600 and buying over 107.250. Below 107.200, the next support will stay around 105.990. All the best for today!