The cryptocurrency market had a pretty stable day as most cryptos consolidated within previously achieved levels. Bitcoin is currently trading for $6,341, which represents a decrease of 1.23% on the day. Meanwhile, Ethereum gained 1.08% on the day, while XRP gained 1.13%.

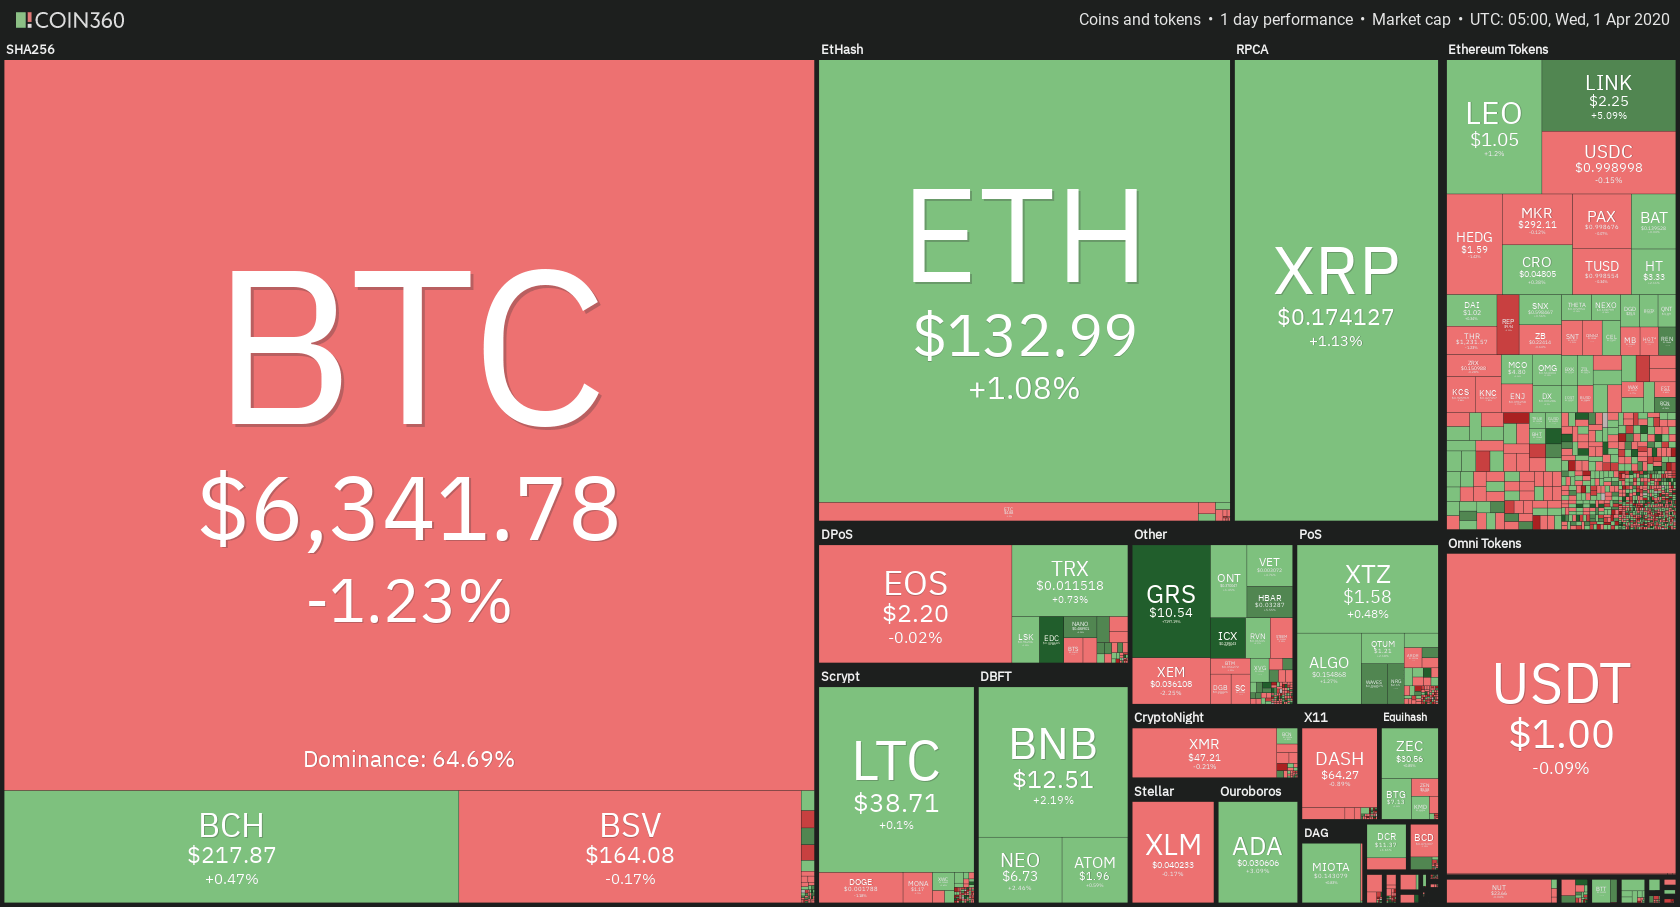
ICON took the position of today’s most prominent daily gainer, with gains of 15.80%. Nervos Network lost 8.51% on the day, making it the most prominent daily loser.
Bitcoin’s dominance dropped almost a whole percent over the past 24 hours. Its value is now 64.69%, which represents a 0.78% difference to the downside when compared to yesterday.
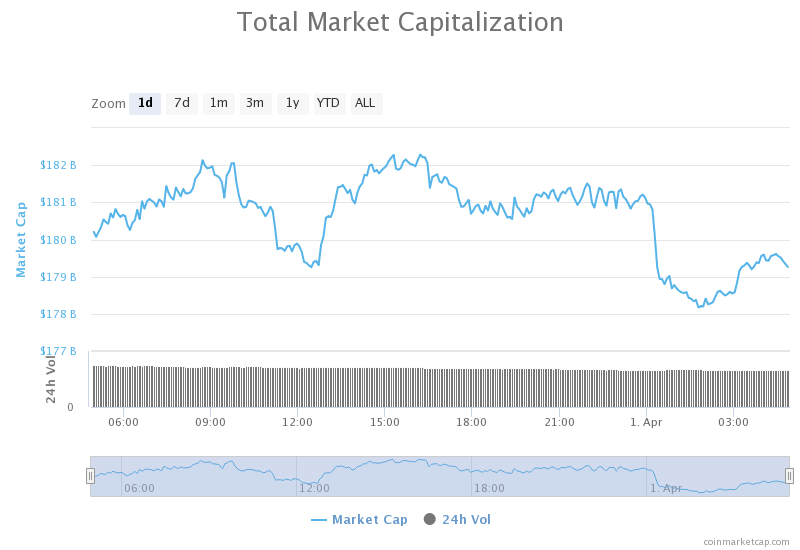
The cryptocurrency market capitalization did not move much throughout the day. Its current value is $179.50 billion. This value represents a decrease of $0.41 billion when compared to the value it had yesterday.
What happened in the past 24 hours
Digital payments company PayPal posted a new job listing, where it seeks to hire an Anti-Money-Laundering and Blockchain Strategy director that will work in their Global Financial Crimes (GFC) division.
The new director, which will be based in New York, will be in charge of evaluating the use cases of blockchain for the prevention of financial crimes.
Honorable mention
Bitcoin vs. the Traditional markets
April 1 brings us to the Q2 2020, as well as reports and analyses on how assets performed in Q1. Nikkei 225 was down 20%, which represents the worst quarter since 2008. The FTSE fell 14% for the period, which its second-worst quarterly performance ever. The S&P 500 lost 18% to close out Q1 2020, which is its worst quarterly performance since 1938.
While cryptocurrencies operate 24/7 and don’t exactly have quarters, it is important to look at them as well and compare the crypto market’s performance with the performances of other assets. The crypto market was down just 10% for 2020’s first three months, which is significantly less than the aforementioned traditional markets.
However, despite its relative resilience, bitcoin (and the rest of the market) has been trending downward along with traditional markets, which shows some form of correlation. This correlation across all assets can be explained by the saying that “macro matters more than micro.”
_______________________________________________________________________
Technical analysis
_______________________________________________________________________
Bitcoin
Bitcoin had a pretty stable day as there was no real volume to push the price up or down. The largest cryptocurrency by market cap still trades within a range, bound by $6,640 to the upside and $5,960 to the downside. As the price could not break the resistance level, we can expect a slow decline towards the support level if nothing changes on a macro level.
Bitcoin’s volume was steady and low in the past 24 hours. Its RSI level is currently at the value of 50.
Key levels to the upside Key levels to the downside
1: $6,640 1: $5,960
2: $6,850 2: $5,000
3: $7,085 3: $4,300
Ethereum
Ethereum spent the day with virtually no fluctuations. Its chart is mostly consisting of doji candles, hammer and inverted hammer candles, meaning that there is low volume, as well as great price direction indecisiveness. Ethereum gained just slightly over 1% on the day, which was just catching up to Bitcoin’s gains, which happened the day before. Ethereum most likely won’t move without Bitcoin moving first and deciding its direction.
Ethereum’s volume is extremely low, while its RSI value is currently at 53.
Key levels to the upside Key levels to the downside
1: $168 1: $128
2: $178.6 2: $122.5
3: $185 3: $100
Ripple
XRP had a great day, even though its price gains do not show it. The third-largest cryptocurrency managed to get out of the descending range, which it was in for around a week. The price broke the upper trend line and then successfully retested the line, which held well.
XRP’s volume increased greatly during the retest of the trend line, while the rest of the day passed without much volume. Its RSI is currently at 54.
Key levels to the upside Key levels to the downside
1: $0.19 1: $0.165
2: $0.2 2: $0.147
3: $0.205 3: $0.1
Related posts
 Daily Crypto Review, Feb 17 – Altcoins take a dive as Bitcoin drops under $10,000; Craig Wright suing BTC and BCH?
 Daily Crypto Review, Feb 24 – New Jersey regulating crypto?
 Daily Crypto Review, July 16 – Bitcoin Giveaway Scam Hits Twitter: Jeff Bezos, Barack Obama, Kanye West And More Targeted
 Daily Crypto Review, Nov 13 – Bitcoin Above $16,000: What’s Next?