Categories
Forex Technical Analysis

Why Trend Lines Are Not Trendy for Swing Traders

Twitter accounts and websites offering educational material on trading currencies appear to have little awareness about the role they play in traders’ development. While eagerly sharing captivating content, giving comments, and advice on various forex-related questions, these sources successfully lure beginners into the community. By not addressing real, state-of-the-matter problems and challenges such complete novices are soon to encounter, not only do the information providers falsely glorify the effectiveness of poor-performing tools but they thus also deny their responsibility for generating an apparent high rate of failure.

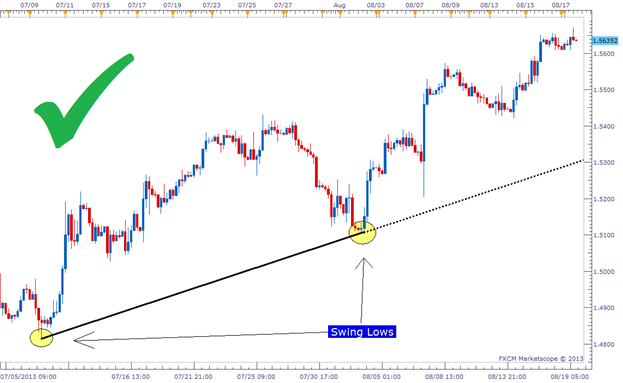
Considering how the recommendation is nowadays seen as one of the strongest marketing means that can practically charm any individual into believing in an asset’s quality, there is little doubt over what excessive and, more importantly, unfounded praise can do in a community of individuals eager for learning and exchanging experiences. The same can be said for the extensively lauded trend lines, a charting tool drawn over highs and lows that traders use to detect the prevailing direction of a price. Regardless of its vast application in trading and the presupposed analytic value, trend lines may not be the salvation traders seek and thus need to be further assessed so as to gather additional evidence of their effectiveness.

The first time beginners encounter trend lines, they have already gone through blogs and videos discussing the topic. They may have also consulted traders coming from other markets, e.g. the stock market, or have previous experience in trading various equities themselves. When they start applying the tool in their own charts, they hope to estimate how the price is going to react, whether it will break out of the trend line or bounce off of it. What traders find particularly appealing is the ease and convenience that come with drawing the lines. Nonetheless, some professional traders strongly object to the level of effectiveness of trend lines in charts, claiming that finding proof of their usefulness is harder than what one may expect. These traders go as far as to say that it may be quite difficult to find areas in the chart where trend lines fulfill the purpose of predicting where the price is going to go owing to the fact that they essentially lack any predictive value.
The situation becomes more alarming once we take into consideration the fact that traders do not base their judgment on analysis, but often post information about how the price bounced off or broke through on social media sites once a trend is already over. Some experts even believe that people behind websites and twitter accounts win every time, hinting at the belief that success has little to do with their knowledge about trend lines.

Forex traders need to know which direction the price will take beforehand, but the assumption that trend lines function as a safe method of trading may be fundamentally flawed. People love trends and what they also find particularly interesting is the ability to offer their own opinions and views regarding the future outcome. Based on such an approach where subjectivity plays the central role, we may freely put forward the idea that trend line-based predictions then uncannily resemble the world of sports betting. Interestingly enough, trends are also used by professional sports betters, but only sparingly. Whenever we do notice a trend, we know that there is a certain likelihood of it leading to a specific outcome, but are we truly ready to accept this level of randomness when investing our precious money and time?

Roulette wheel boards in casinos, for example, show approximately 15 numbers that last appeared (see picture on the left), based on which people make specific decisions concerning their next step. Casino goers typically assume that a specific number or color is due and that they are in fact following a trend, which cannot be any farther from the truth. In a world somewhat similar to casinos, markets, or important market players will never take any action in order to intentionally lose money. Hence, they will strive to make every single trader believe that randomness is not randomness at all, playing with your lack of knowledge and analytical skills. More often than not, what traders assume to be a trend proves not to be a trend at all, and they cannot thus serve as a direct confirmation of what will eventually happen with the price.

Even if we take a look at some definitions of the word, we would know that trend generally indicates a development or change, not a final destination. We then need not rely on trends to tell us whether we are seeing an uptrend or a downtrend, we can just look at the chart to gather data and draw conclusions. Instead of having a predictive quality to them, trend lines, in fact, rather reflect a statistical anomaly or a deviation. It is truly remarkable how we can choose to draw a trend line basically on any random chart, anywhere, and anytime. Nonetheless, what is peculiar is that there are as many places where we can draw these lines as there are places where we simply cannot.

Any chart has a trend happening somewhere, but seeing areas with highs and lows you can connect with a straight line is not an analytical advantage but a game of flipping a coin. If you can draw a connection between a coin landing on a particular side and a price breaking the trend line, then you certainly know how we are playing with a 50—50 proposition or even far less. Trend traders are often amazed at the predictions given on Twitter, but as we said before, the way someone looks smart is not equal to the level of luck you will have using the tool they advertise. As the price will inevitably have to go one way or the other, moving up or down, they will only later reveal the results they accredit to the trend line, which will push you to believe in trend lines’ ability to help you reach your goals faster.

What do you want a trend line to show you? As traders typically look for signs whether the price would break out or bounce off, we can expect to see three different scenarios: a) breaking out, passing the trend line, and starting a new trend; b) bouncing off of a trend line and continuing on the trend they are on; or, c) false breakouts and false reversals that appear to be similar to the previous two. In the end, we are not really looking at an actual trend, but a statistical anomaly because trend lines have little to do with the question of whether prices move up or down. The only ones possessing this kind of information always turn out to be the big banks and institutions, which are constantly on the lookout for market activity. They eagerly look for the areas in the chart where the majority of retail traders are going on any currency pair only to take the price the opposite way and earn a profit. If you are already participating in the market, your success will undoubtedly and indisputably depend on your ability to get off the big banks’ radar, which means evading the places where the greatest number of individuals are trading.

This further implies that tools such as support and resistance lines often prove to be completely useless since, unlike trend lines, they do reflect some consistency due to which every trader can have access to the exact same information, immediately sparking the big banks’ interest. Traders assume than these major players pay attention to diagonal support and resistance when they in fact only wait for the majority of traders to move into one direction so that they can redirect the price. Whatever you expect a trend line to show will not eventually provide you with enough security and keep you away from the areas in the chart which can get you to lose a lot of money.

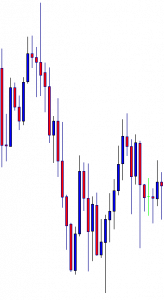
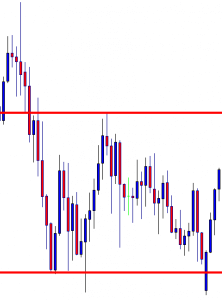
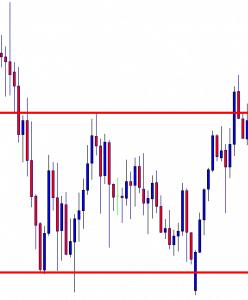
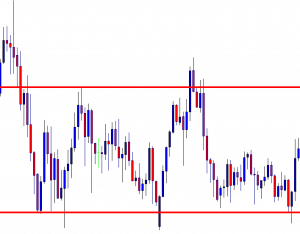
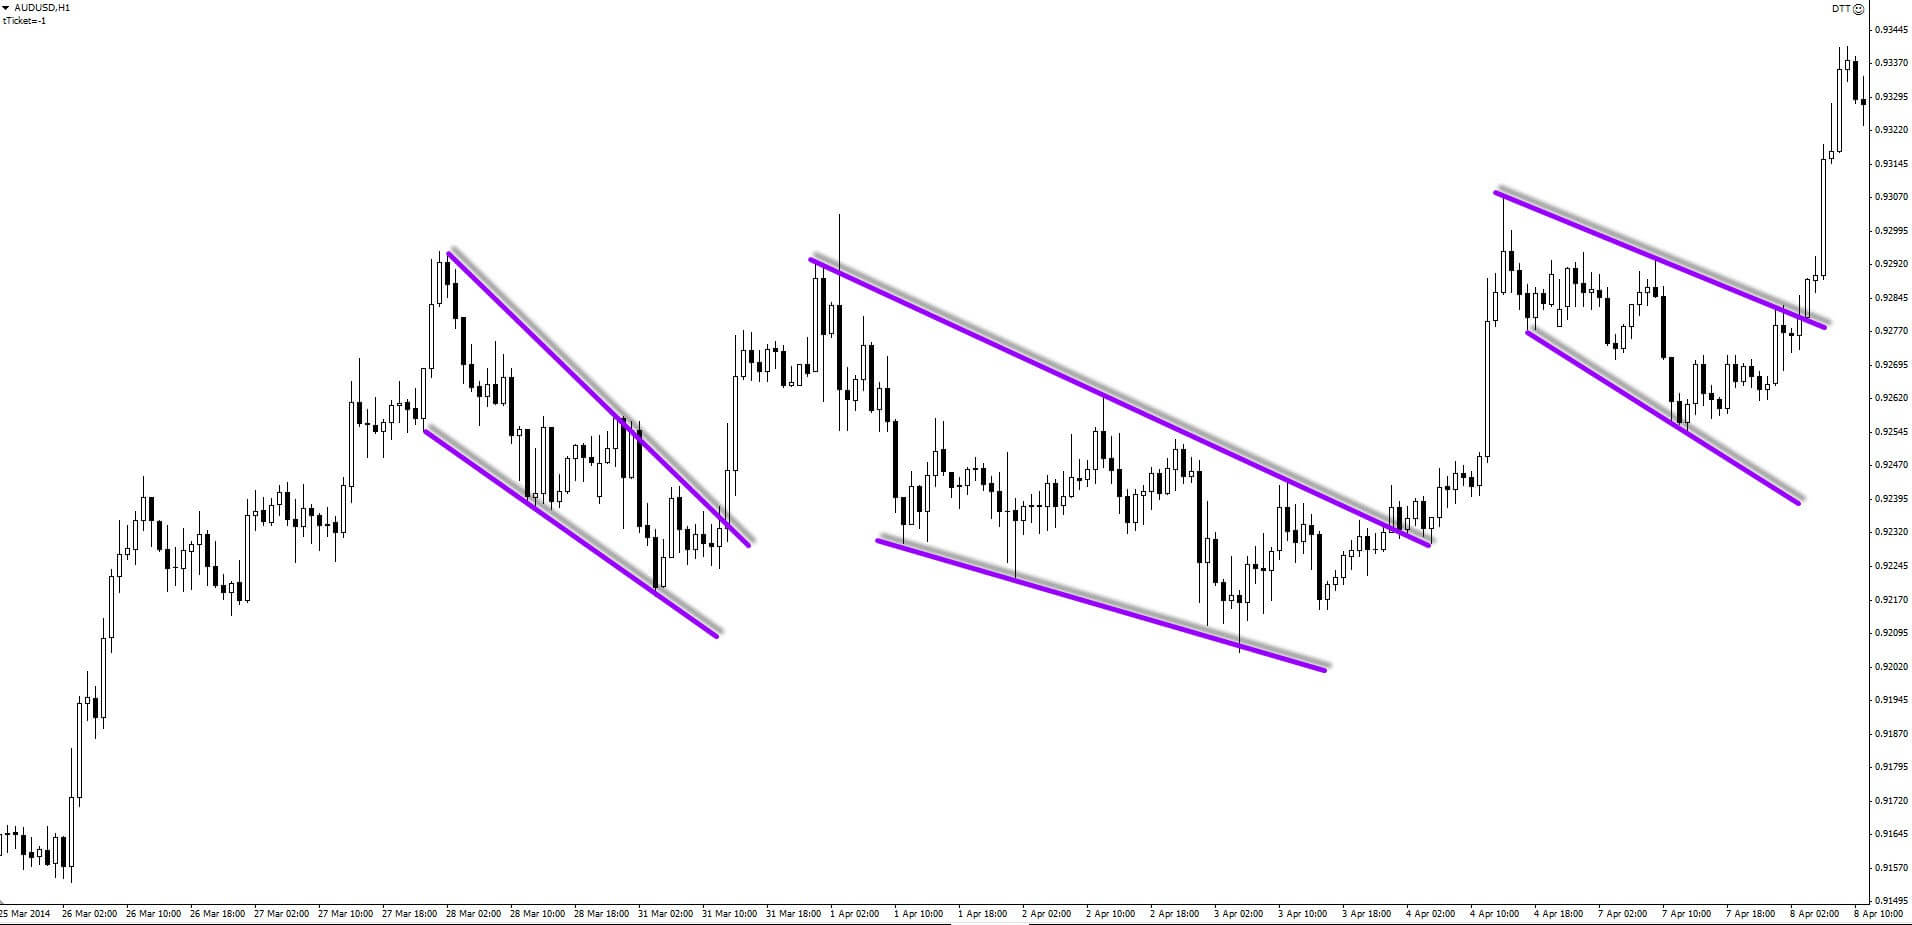
Despite the fact that some people claim to know everything about trend lines, if you ever try to find a specific standard for drawing them correctly, you will discover a great degree of inconsistency. If you take a look at the image below, you will see the extent of discrepancies between the rebound and break out points. Whereas support and resistance lines have very defined areas where people are trading, trend lines significantly differ from one trader to another. So, how can we draw them then? Do we focus on the highs and the lows or do we see them as noise and disregard them as a result? Are we to connect any two points or several ones? How many points make a single line then? Should we connect the bodies or concern ourselves with the opens and closes?

As you can see, every combination is a possibility, but we still wonder at what point a trend line stops serving us. When is it no longer legitimate and should we still keep it or erase it from the chart after the price has gone some other way? Because of the existence of countless possibilities, people can have different views on where entry and exit points are on a particular trend line. With zero consistency across charts, we can safely assume that trend lines are essentially whatever traders desire them to be.

Examples of Different Approaches to Drawing Trend Lines

Since we cannot firmly state that any line can determine whether a price is going to move up or down, we should truly aim to follow the advice of the best traders out there and move on to tools that can actually grant us success. What many traders may think here is that they could use trend lines together with RSI, stochastics, or Fibonacci. However, instead of using two low-level tools, which are not only useless but dangerously overrated as well, you can give yourself the opportunity to search and test out thousands of other more modern tools created solely for the purpose of trading in the spot forex market. From its conception in 1996, this market has witnessed a turnover of approximately 10 thousand indicators and tools we can use in everyday trading as well as an incredibly high rate of failure at the same time.

Expert traders claim to have tested more than one thousand indicators only to find what serves them best, which is a clear indication of the fact that a popular tool is not always a good tool. Therefore, if you search hard and test vigorously, you can confidently expect to find some excellent tools that you will be able to use for good. Then, once you have discovered a few of such tools which prove to give great results, you may start to combine them, creating a stable system with an incomparably higher chance of predicting whether the price is going to go up or down. What we are seeing here still involves a portion of randomness, but we are also including the momentum which your set of tools will be able to recognize. It is precisely due to the mathematics within your toolbox that you will have the chance to trade on an above-average level. Your tools will predict if the momentum in the market is real and which way it is most likely to take the price, based on which you can stop making completely random predictions and starting earning a real profit.

Whichever tools you end up using, you should never lose focus over the importance of entering and exiting a trade on time, which trend lines fail to do over and over again. If you want to become a successful trader, do not fear the evident stigma of being different in the market. We have already seen in some other markets how news events and lack of independence play out, and the best way to avoid the staggeringly high failure rate is to build yourself as an independent trader. Use your analytical mind to assess whatever information you come across because writing and recording are always profitable, both to their creators and to the big banks eventually. Following trends is essential, but the fact that this tool has that word as part of its name has no relevance and certainly no power to provide you with the information you need. Whenever you encounter vagueness, start asking yourself whether it is testable, logical, and profitable.

With so many outdated tools, traders are not only entering trades when trends are already over, but they are entering trades that will get them right under the big banks’ radar. If you are still convinced that trend lines are your perfect companion, can you answer the question of whether you experienced a situation where a price did not align with your trend line? If the answer is yes, then you should know that the reason behind such a phenomenon is the fact that diagonal support or resistance simply does not exist, further supporting the claim that trend lines are not to be used in charts to predict the behavior of the price. Strive to construct an algorithm that will consistently and transparently send signals that will lead to successful trades, thus steadily building your trading account.

Categories
Forex Basic Strategies

Trading ‘Cable’ Using The ‘English Breakfast Tea Strategy’

Introduction

When traders deal with a particular currency pair for a long time, they start to observe certain characteristics and behavior of that currency pair. Such common behavior could be observed during market opening hours, closing hours, or major news releases. Traders may notice common behavior before and after the holiday season, such as Christmas or New Year.

Day traders enjoy the volatility of the market opening. This could be either Tokyo open, London open, or New York open. Some traders are familiar are with the pattern developed during the Tokyo open while some are comfortable trading the New York open. While some traders like to trade when the market is not extremely volatile, they prefer to trade when the market is quiet and less volatile.

The strategy we will be discussing today is based on the peculiar behavior observed in the GBP/USD currency pair. This behavior is mostly observed during the London opening hours.

Time Frame

The English breakfast tea method works well on the 15-minutes time frame. This means each candle represents 15 minutes of price movement.
Indicators

This strategy is based on pure price action; hence we will not be using any indicators.

Currency Pairs

This strategy applies only to the GBP/USD currency pair.

Strategy Concept

The pattern is observed in GBP/USD before, and after the London market opens in the morning, we have named this strategy an ‘English breakfast tea strategy.’

We have observed that when GBP/USD trends in one direction from 04:15 hours to 8:30 hours London time, it tends to move in the other direction after 8:30 hours. We now compare the closing price of the 15-minute candle that corresponds to 04:15 AM and 08:15 AM London time to determine the direction of the GBP/USD. We then enter the market in the opposite direction at 08:30 AM London time.

For example, if the closing price of the 15-minutes candle at 08:15 hours is lower than the closing price at 04:15 hours, we go long at 08:30 hours. If the closing price of the 15-minutes candle at 08:15 hours is higher than the closing price at 04:15 hours, we go ‘short’ at 08:30 hours.

The stop-loss for the strategy is fixed at 20-30 pips depending on the point of entry on the chart and risk appetite. There are two profit targets for the strategy with risk to reward ratios of 1:1 and 1:2. In other words, the ‘take-profit‘ would be at around 30 pips and 60 pips, respectively.

Trade Setup

Since this strategy is based on the London time zone, we need to make sure that we change the trading platform’s time zone to ‘London.’ If this is not possible, we should know London’s corresponding time opening with respect to our time zone. Let us see the steps required to execute the strategy.

Step 1

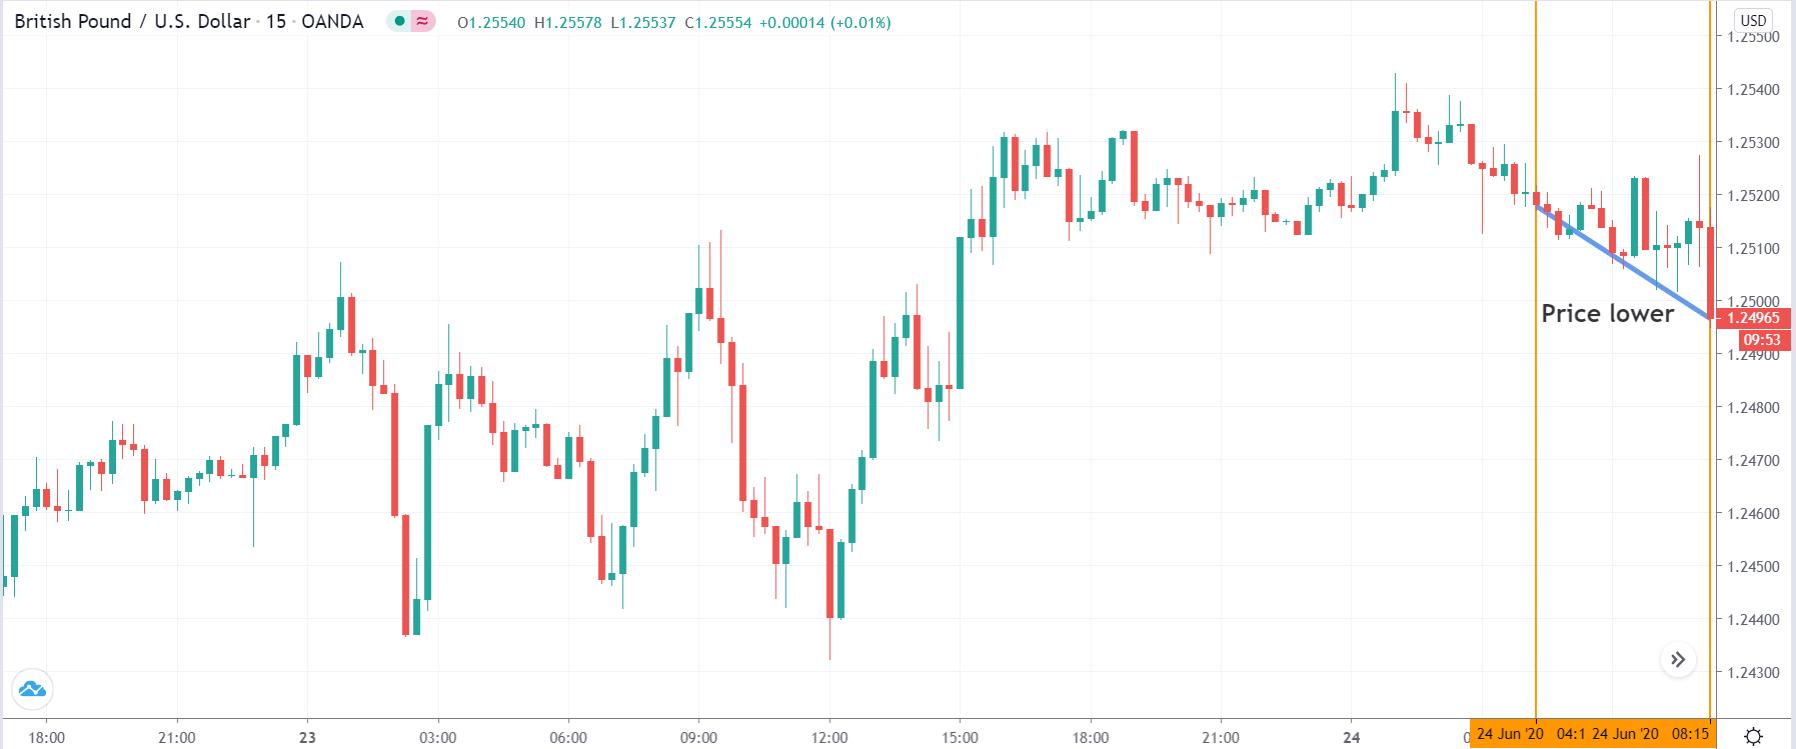
In the first step, we mark 04:15 hours and 8:15 hours London time on the chart. Then we look at the difference between the two candles. If the closing price of 8:15 hours is lower than the closing price of 04:15 hours, we then look for buying GBP/USD. On the other hand, if the closing price of 8:15 hours’ candle is higher than the closing price of 04:15 hours’ candle, we will for ‘short’ trades in the currency pair.
In the following example, we see that the market moves lower between 04:15 hours and 8:15 hours London time. The closing price of the latter is below the former. Therefore, we will take a ‘long’ position by executing further steps.

Step 2

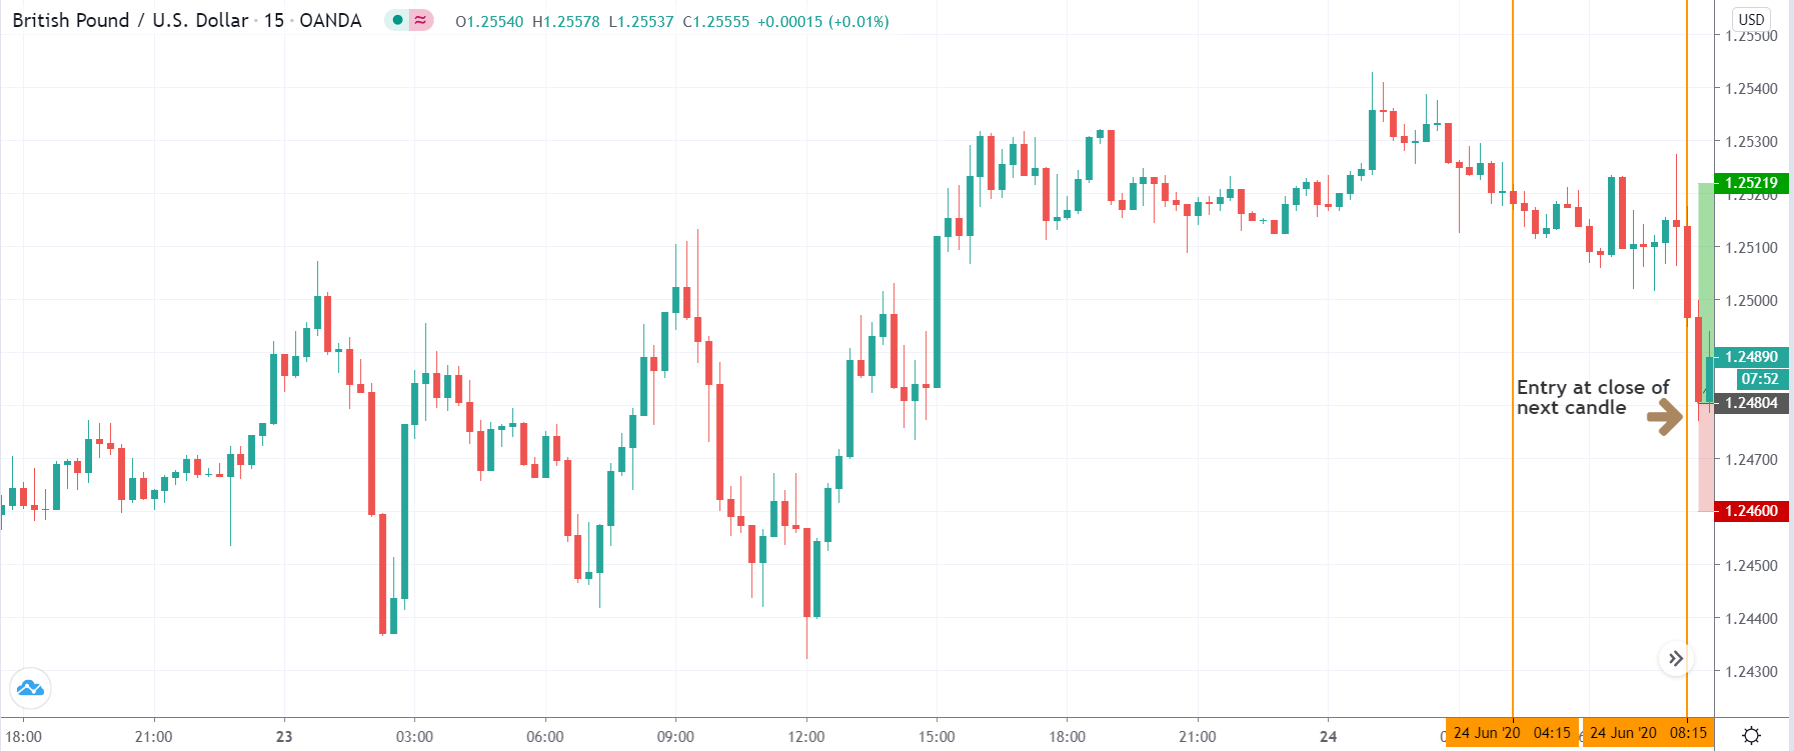
In this step, we examine the ‘entry’ part of the strategy. ‘Entry’ is the simplest part of the strategy where we enter the market at the close of the 08:30 hours’ candle. If the difference between the two candles marked in the previous step is negative, we enter for a ‘buy’ at the subsequent candle. If the difference between the two candles is positive, we enter for a ‘sell’ at the subsequent candle.

We can see in the below image that the subsequent candle dropped significantly lower. As per our strategy, we will take a ‘long’ trade at the close of this candle. Let us see what happens later.

Step 3

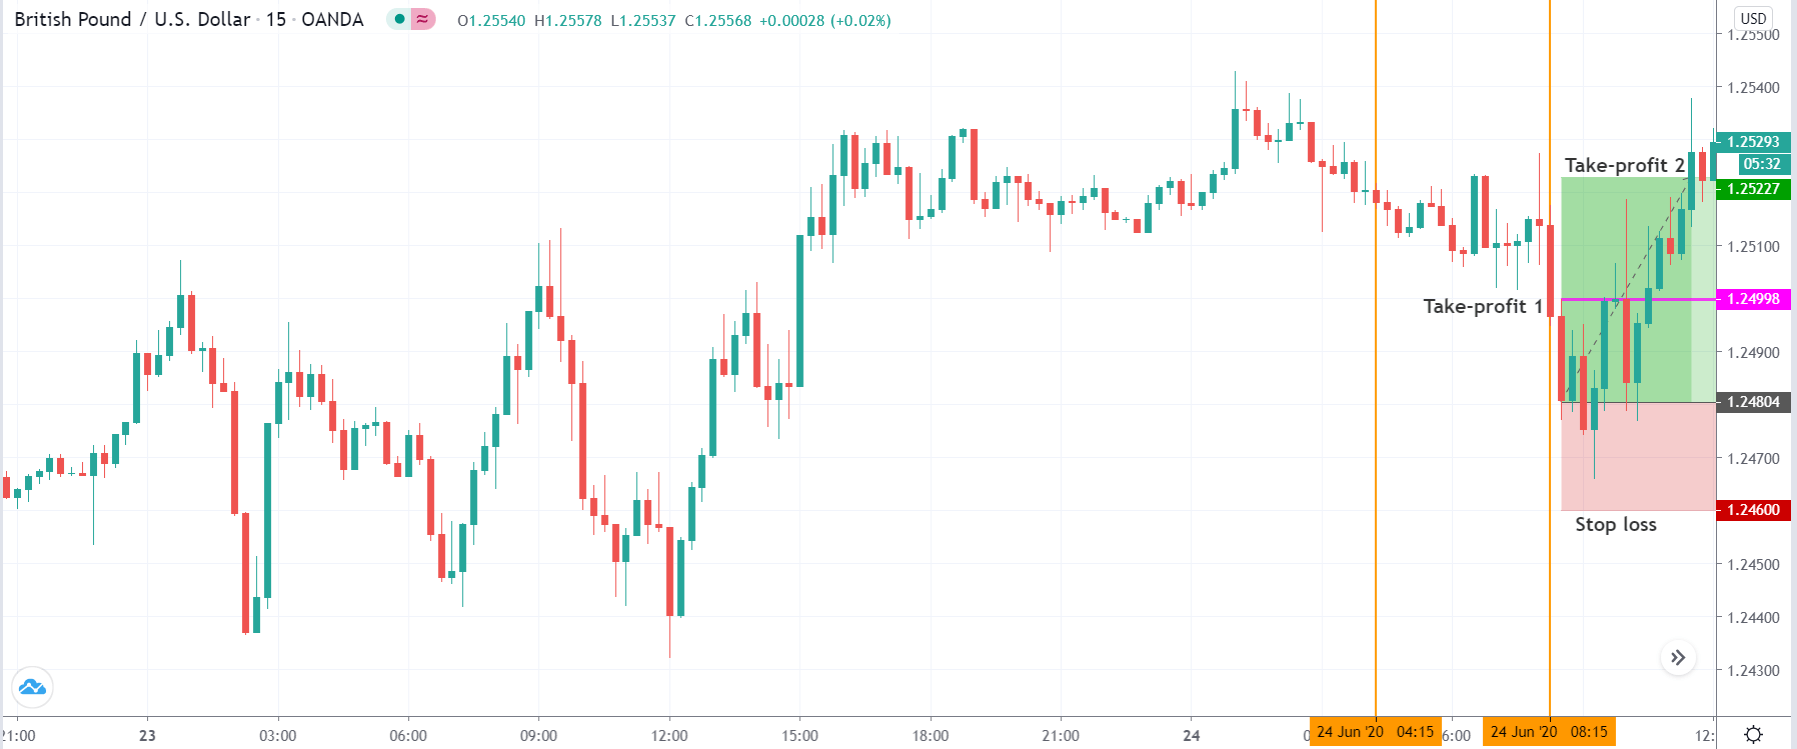
In this step, we determine the stop-loss and profit targets for the strategy. The stop loss is usually set at 20-30 pips depending on the risk appetite of the trader. However, a technical approach for setting the stop loss is that, if the trade is taking place in the direction of the major trend of the market, we keep a small stop loss. If the trade is taking place against the major trend of the market, we opt for a larger stop loss. The first profit target is at 1:1 risk to reward, and the second one is set at 1:2 risk to reward. If we are trading against the trend, the first ‘take-profit’ ensures that we don’t lose any money even if the market turns around mid-way.

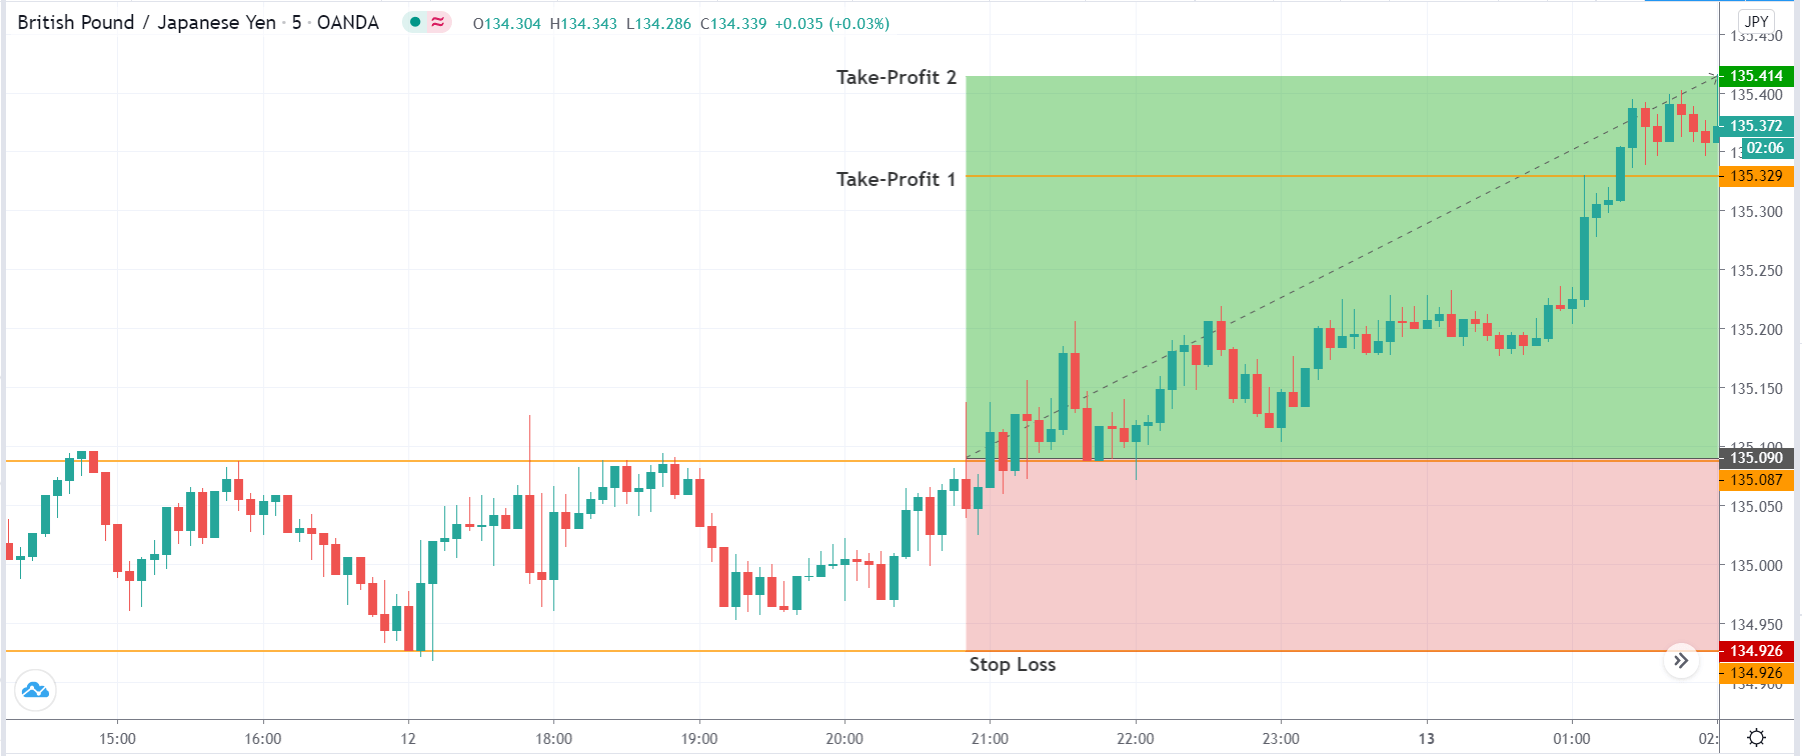
In the below image, we can see that the price hits our final ‘take-profit’ after taking an entry at the close of the red candle. Since the market was in an uptrend, we kept a small stop loss.

Strategy Roundup

This strategy is based on a fixed time period, i.e., during the market opening hours. The rules are simple and specific. Any trader can try out this strategy to benefit from the volatility associated with the market opening. However, the currency pairs will change for other market openings. Since we are not giving much importance to the market trend, we might have some losing trades in the beginning until we become expert in the strategy.

Categories
Forex Market Analysis

Daily F.X. Analysis, July 27 – Top Trade Setups In Forex – U.S. Durable Goods In Hightlights! 

On the news side, eyes will remain on the German Business Climate, and the U.S. durable good as these have the potential to drive movement in the market gold and US-related pairs. Check out the trading plans below.

Economic Events to Watch Today  


EUR/USD – Daily Analysis

The EUR/USD pair was closed at 1.16543 after placing a high of 1.16579 and a low of 1.15810. The EUR/USD pair extended its 6th-day bullish rally and rose above 1.16500 level on Friday amid the broad-based U.S. dollar weakness. The declines in greenback boosted the currency pair EUR/USD as the marginal gains in the U.S. dollar failed to retain their position.

The U.S. Dollar Index raised to 94.80 level but turned to the downside after dropping to 94.40 level, the lowest since September 2018. The U.S. dollar currency was unable to stabilize as its weakness remained in place.

The main driver behind Friday’s rally in the EUR/USD pair was the U.S. dollar’s weakness. However, the economic data also supported this upside movement in currency pair.

At, 12:15 GMT, the French Flash Services PMI for July rose to 57.8 against the expectations of 52.3 and supported EUR. The French Flash Manufacturing PMI for July dropped to 52.0 from the projected 53.1. At12:30 GM, the German Flash Manufacturing PMI raised to 50.0 from the 48.0 of expectations, and Flash Services PMI also raised to 56.7 from the anticipated 50.4.

At 13:00 GMT, the Flash Manufacturing PMI for whole bloc also rose to 51.1 from the anticipated 50.0, and the Flash Services PMI for whole bloc reached 55.1 in July from the expected 51.0. At 17:55 GMT, the Belgian NBB Business Climate dropped by 13.9 points against the expected drop by 14.3 points, and it also supported Euro as the business climate showed improvement.

On the flip side, the Flash Manufacturing PMI from the U.S. was released at 18:45 GMT. The figure dropped to 51.3 from the anticipated 52.0. The Flash Services PMI from the U.S. also declined to 49.6 from the expected 51.0 in July. The better than expected PMI data from Europe indicated that manufacturing and services activities were improved in Europe, giving strength to EUR. Whereas, the poor than expected data from the U.S. weakened the U.S. dollar when its PMI dropped in July.

The better economic condition and business climate of the European Union could be attributed to the latest approval of a massive stimulus package by the European Union. And the U.S.’s poor economic condition indicated that the U.S. was still suffering and struggling against coronavirus.

The U.S. marked the second day with 70,000 plus new cases of coronavirus and deaths more than 1000 in 24 hours on Saturday. The total number of infections in the U.S. reached 4.1 M, and the fatalities reached 145,324.

The mounting numbers in infected people will likely weigh on the U.S. economy and its currency for a longer period, and the weakness in gold is likely to remain persistent. So, another rally in EUR/USD on Monday is expected unless news suggested otherwise.
Daily Technical Levels

Support Resistance

1.1640     1.1659

1.1629     1.1667

1.1621     1.1678

Pivot point: 1.1648

EUR/USD– Trading Tip

The EUR/USD traded sharply bullish amid weaker dollar to trade at 1.1704 level, and closing below 1.1730 resistance level can trigger selling until 1.1685 level today. On the lower side, the pair may gain support at 1.1686 level. A bullish breakout of the 1.1730 level can extend the buying trend until the 1.1788 level. While the violation of 1.1685 can lead to EURUSD prices towards 1.1589 level. 


GBP/USD – Daily Analysis

The GBP/USD closed at 1.27945 after placing a high of 1.28034 and a low of1.27168. Besides, the trading of the GBP/USD pair remained bullish throughout the day. The GBP/USD pair gained on Friday and extended its bullish streak of the 6th consecutive day on Friday amid better than expected U.K. data and broad-based U.S. dollar weakness.

Despite U.K. data coming in favor of local currency, the other factor involved in the rally of GBP/USD pair was the U.S. dollar’s weakness. The greenback has failed to recover as U.S. yields were low and looking for support. Since March, the U.S. Dollar Index fell and posted the fifth weekly decline in a row with the worst performance. The index dropped below 94.5 level that is lowest since September 2018.

Sterling was high on the board as the macroeconomic data related to PMI for July from the U.K. rose from expectations. AT 13:30 GMT, the Flash manufacturing PMI for July rose to 53.6 against the expectations of 52.0 and supported GBP. The Flash Services PMI for July also raised to 56.6 from the expected 51.4 and supported GBP. At 11:00 GMT, the Retail Sales from the U.K. was raised by 13.9% from the expected 8.3% and supported GBP. The better than expected PMI and Retail Sales data from Great Britain helped GBP/USD to post gains and trade higher.

The U.S. Manufacturing PMI dropped to 51.3 from the expected 52.0, and the Flash Services PMI from the U.S. also dropped to 49.6 from the expected 51.0 in July. This added in the U.S. dollar weakness on board and supported the gains in GBP/USD pair on Friday.

Meanwhile, the U.S. dollar weakness was further bolstered by the rising coronavirus cases across the states. The U.S. marked the second day with 70,000 plus new instances of coronavirus and deaths more than 1000 in 24 hours on Saturday. The total number of infections in the U.S. touched 4.1 M, and the death toll reached 145,324.

The hopes that the U.S. economy will take a long period to recover from the coronavirus crisis as it hit hardest the U.S. States kept weighing on the U.S. dollar. The U.S. Dollar drops across the board pushed the pair above the 1.2800 level, and analysts believe that if the dollar’s weakness remained still, the GBP/USD pair could reach the 1.3000 level.

The British Pound was also backed by the decreasing number of coronavirus cases in the U.K. It means that restrictions will be gradually removed, and these hopes supported Pound.

On Brexit front, the latest round of negotiations ended on Thursday without significant progress on the post-Brexit trade deal. Britain’s chief Brexit negotiator David Frost said that they would not reach a preliminary agreement by the UK PM Boris Johnson’s July deadline. However, although the expectations for striking a deal are very less, it could not lose attention. Next week, the Brexit talks, U.S. stimulus package, and the infection cases in the U.S. will be key to watch.

Daily Technical Levels

Support Resistance

1.2782      1.2803

1.2771      1.2813

1.2762      1.2824

Pivot point:1.2792

GBP/USD– Trading Tip

The GBPUSD is also trading in an overbought region, and now it can drop until 1.2825 level, which marks 23.6% Fibonacci retracement below this the next support will be found around 1.2770. At the same time, resistance stays at 1.2860 and 1.2930. The RSI and MACD are in the bullish region, but they are forming smaller histograms that suggest odds of selling bias. Let’s consider taking buying trade over 1.2760 until 1.2860 level today.  


USD/JPY – Daily Analysis

The USD/JPY was closed at 106.124 after placing a high of 106.902 and a low of 105.679. The USD/JPY pair extended its bearish streak for the second day towards the lowest of 2 years amid broad-based U.S. dollar weakness. The strong bearish pressure on the day came in after the souring market sentiment that helped JPY gather strength as a safe haven. The currency pair dropped below 106 level and extended its slide and reached its lowest since mid-March at 105.67.

The risk-averse market sentiment was boosted by the escalating tensions between the U.S. & China. Last week the U.S. sent a short notice to China to halt its consulate in Houston. In retaliation, China closed the U.S. consulate in Chengdu, and the tensions between the U.S. & China escalated. Besides, U.S. Secretary of State Michael Pompeo asked for an end of “engagement,” a policy that has defined US-China relations for nearly five decades. The policy is considered as the most important foreign policy achievement by China in recent history.

The safe-haven Japanese yen gained traction due to its safe-haven status, causing the USD/JPY pair to move in a downward direction. The U.S. Dollar Index dropped by 0.36% to its lowest level since September 2018 at 94.41 level and made the greenback weak across the board. The weak U.S. dollar weighed on the USD/JPY pair and pushed the pair to its two years lowest level.

Furthermore, the macroeconomic data released on Friday also weighed on the USD/JPY pair when Flash Manufacturing PMI from the U.S. dropped to 51.3 level from the anticipated 52.0 in July. The Flash Services PMI also fell to 49.6 level from the projected 51.0 and weighed on the U.S. dollar. At 19:00 GMT, the New Home Sales in June from the U.S. increased to 776K from the expected 700K.

The decreased PMI data from the U.S. could be attributed to the increased number of coronavirus cases from across the U.S. On Saturday, the U.S. marked the second day with 70,000 plus new instances of coronavirus and deaths more than 1000 in 24 hours. The total number of infections in the U.S. rose to 4.1 M, and the death number reached 145,324.

Next week, the FOMC meeting will remain dovish, and the scope for U.S. Dollars will remain on the downside. This will make investors to short USD positions that will cause further decline in the USD/JPY pair.

Daily Technical Levels

Support Resistance

105.85     106.19

105.70     106.36

105.52     106.52

Pivot Point: 106.03

 USD/JPY – Trading Tips

The USD/JPY trades with a selling bias around 105.526 level, trading within a downward channel that provides an immediate resistance at 106.120. On the lower side, the USD/JPY may find support at 105.375 level, and closing of candles below 105.375 can open further selling bias until 104.850. Overall the pair is forming lowers low and lowers high pattern, which signifies selling sentiment among traders. The RSI and MACD suggest selling signals; for instance, the RSI is holding below 50, and the MACD is staying below 104.866. Today, let’s look for sell trade below 105.800. Good luck! 

Categories
Forex Daily Topic Forex Price Action

Even a Fragile Breakout Makes the Price Move

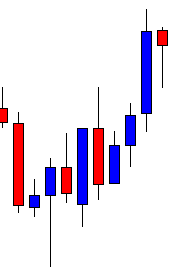
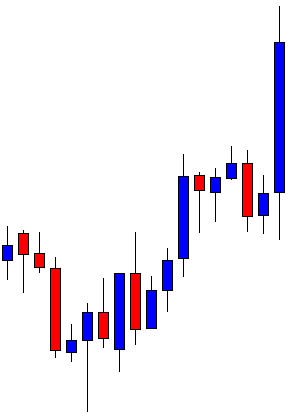
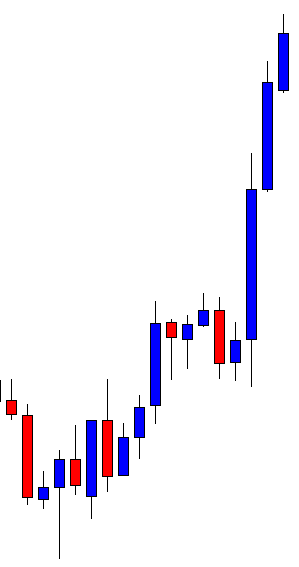
In today’s lesson, we are going to demonstrate an example of a chart producing a double top and offering entry. The breakout does not look that promising though. However, the price heads towards the breakout direction and makes a long bearish move. Let us get started.

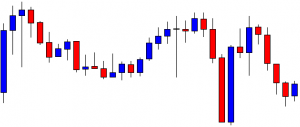
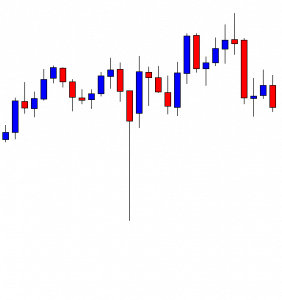
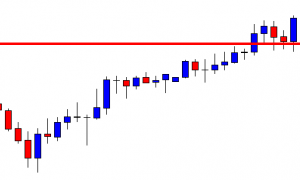
The chart shows that the price has a rejection at a level and makes a bearish move. Upon finding its support, it produces a bullish engulfing candle and heads towards the North. The chart produces a bearish inside bar around the level of double top resistance. It may attract the sellers to keep their eyes on the chart to go short upon a neckline breakout.

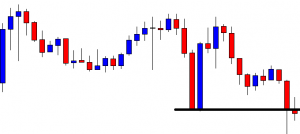
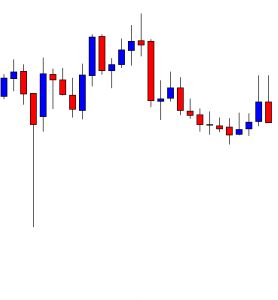
The price heads towards the South with good bearish momentum. The last candle comes out as a bullish inside bar. It is a sign that the chart may get choppy instead of making a breakout at the neckline. However, we never know. The sellers may keep patience and wait for a bearish breakout.

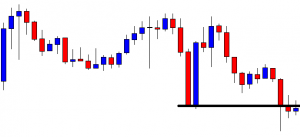
The price consolidates for a while and makes a bearish move. The last candle closes below the neckline. It is a kind of breakout that the sellers are waiting for, but it is a breakout. Let us wait and see what the price does here.

The chart produces a spinning top. The candle closes within the breakout level. Thus, it is a valid breakout. The sellers may wait for the chart to produce a bearish engulfing candle closing well below the last swing low. Let us proceed to the next chart.

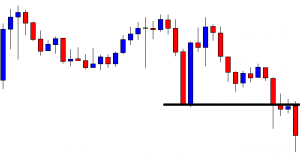
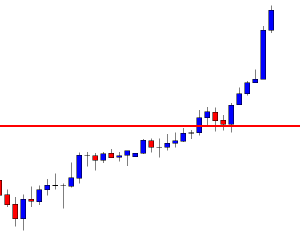
Look at the last candle. The candle comes out as a bearish engulfing candle closing well below the last swing low. The sellers may trigger a short entry right after the last candle closes by setting stop-loss above the breakout level and take profit with 1R.

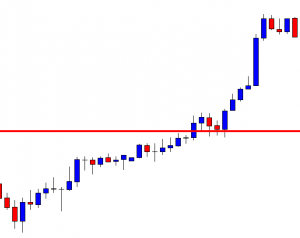
The price heads towards the South with excellent bearish momentum. It hits the target of 1R in a hurry too. This means the trade setup has worked for the sellers nicely. Considering the breakout factor, the trade setup is not an A+ trade setup. However, we may consider two important factors here.

  1. Double Top
  2. The signal candle.

These two factors are significant to make the price move. Yes, when an A+ momentum breakout goes with two of them, it gives us more chances to make a profit out of the trade. Today’s example shows that as long as it’s a breakout, upon the breakout confirmation, the price may head towards the trend direction with good momentum if the mentioned two factors meet all the requirements.


Categories
Crypto Market Analysis

Daily Crypto Review, July 24 – Bitcoin Above $10,000; Ethereum Passing $300

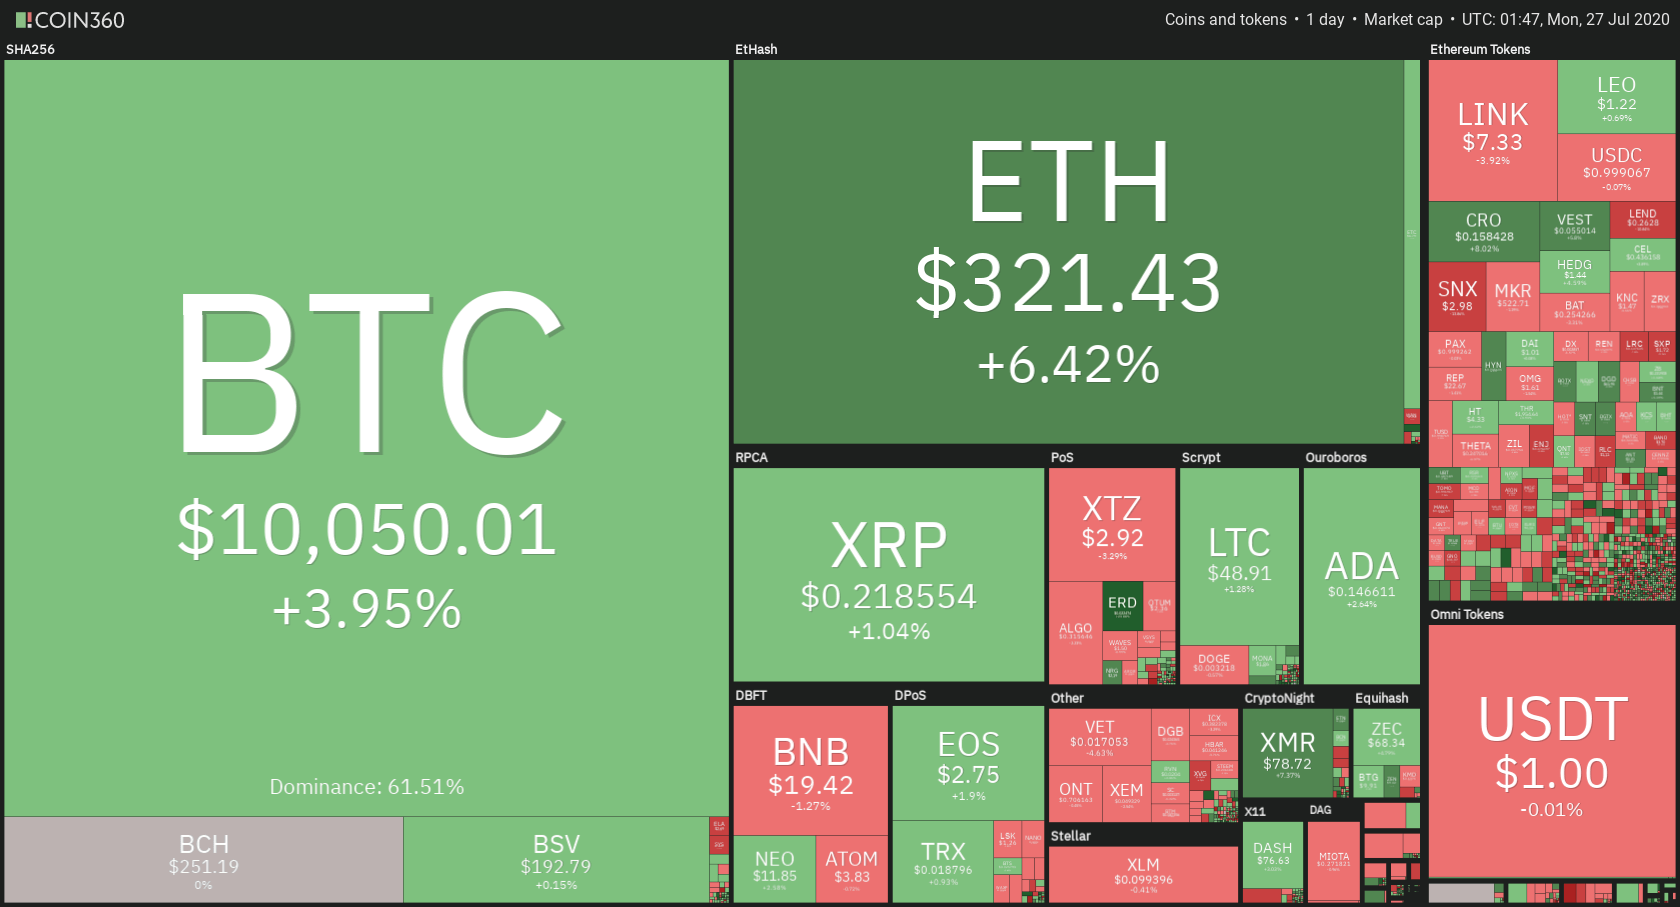
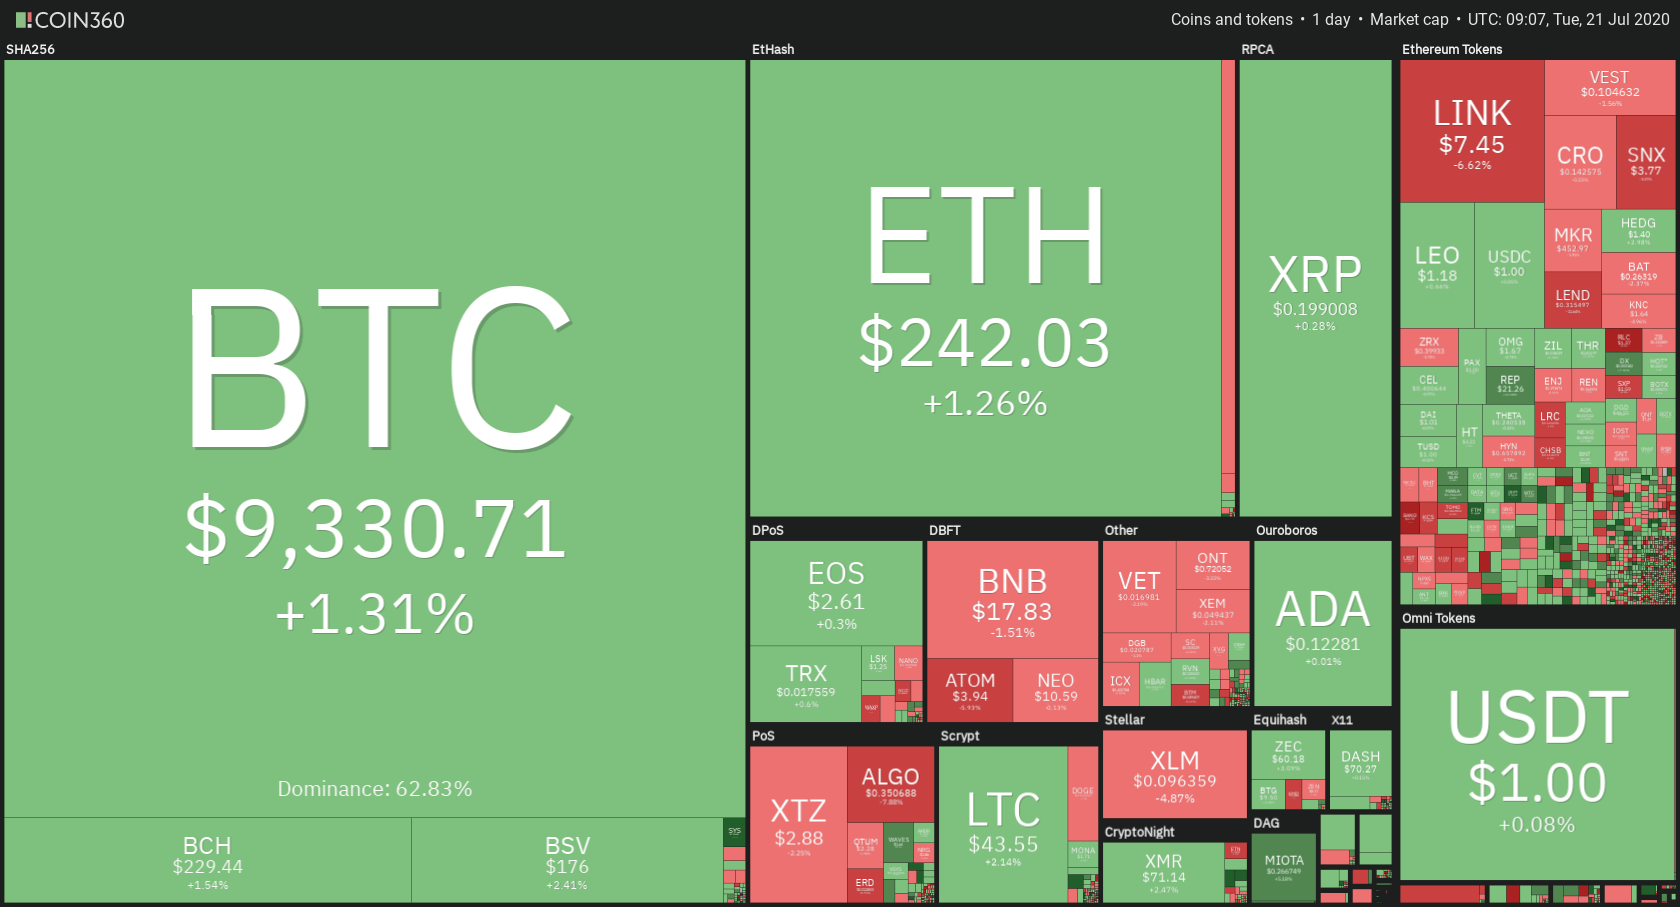
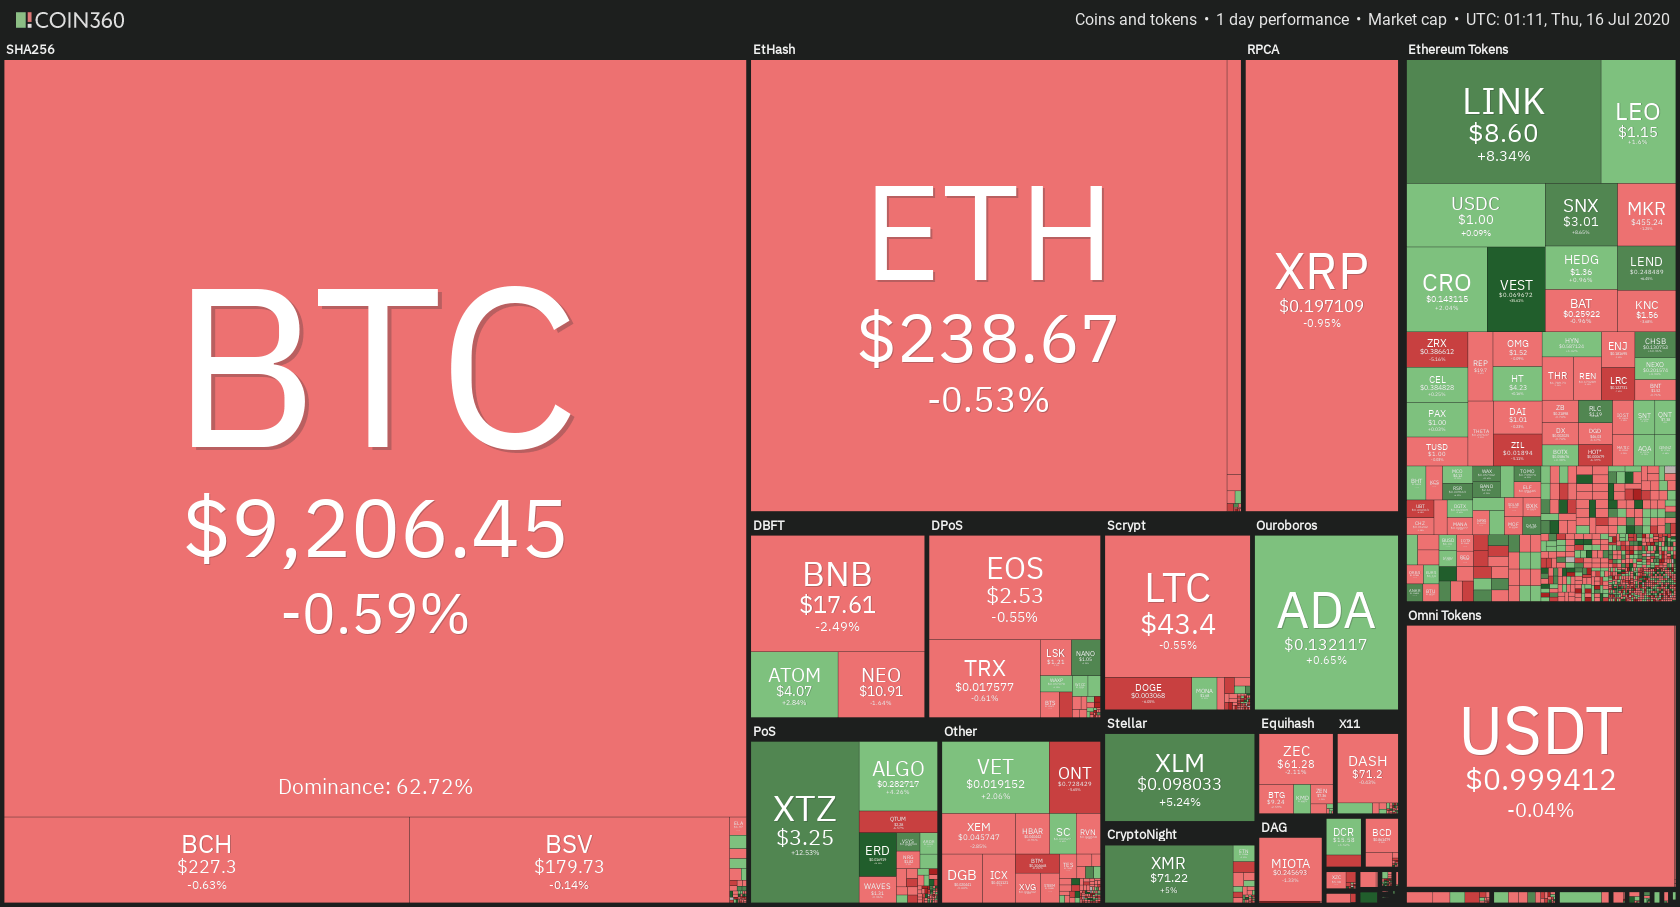
The cryptocurrency market spent had quite a bullish weekend. Out of the major cryptocurrencies, Ethereum and Bitcoin broke the strongest barriers. Bitcoin is currently trading for $10,050, which represents an increase of 3.95% on the day. Meanwhile, Ethereum gained 6.42% on the day, while XRP gained 1.04%.

 Daily Crypto Sector Heat Map

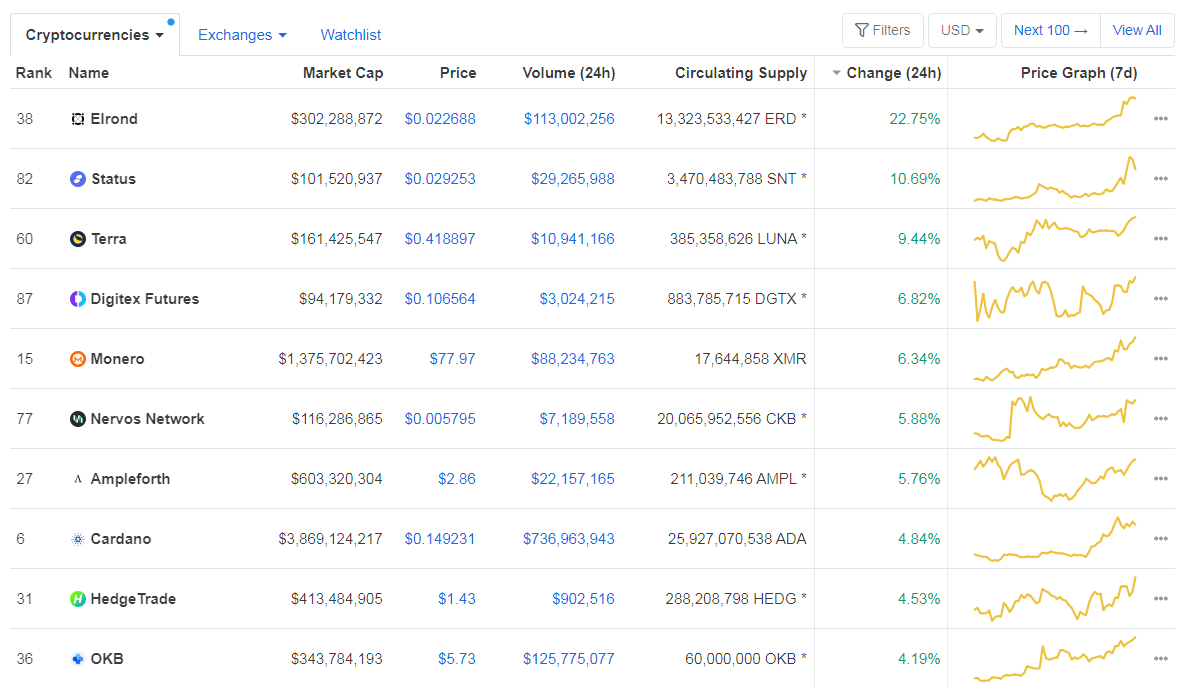
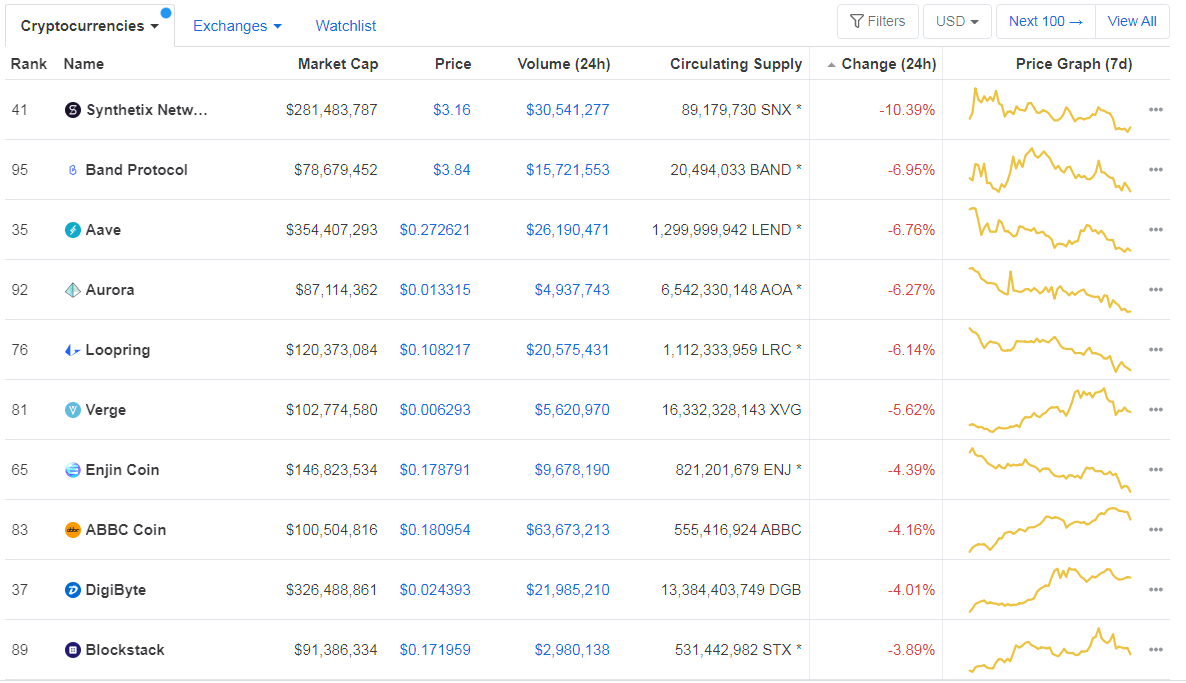
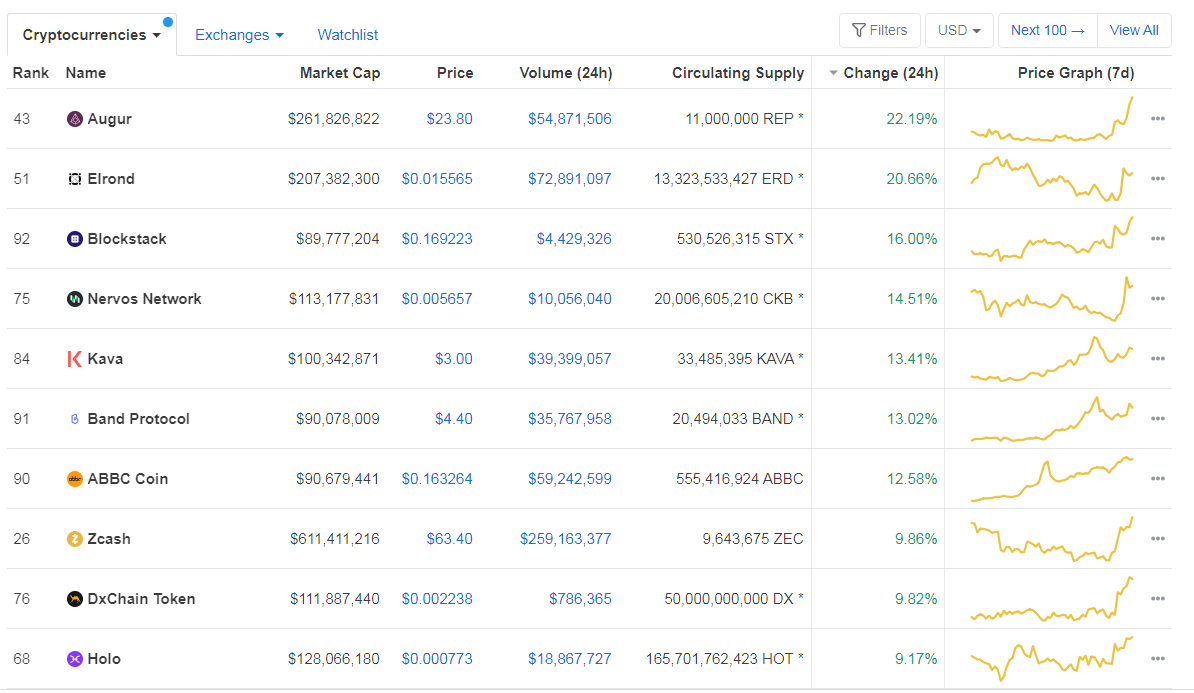
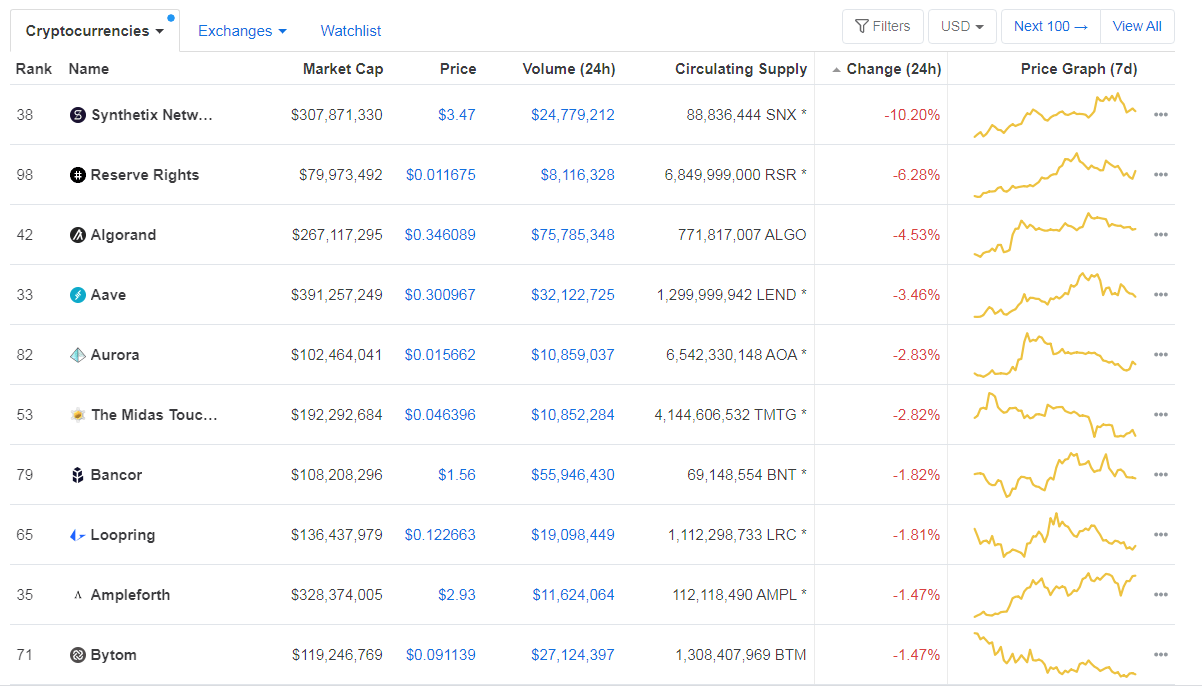
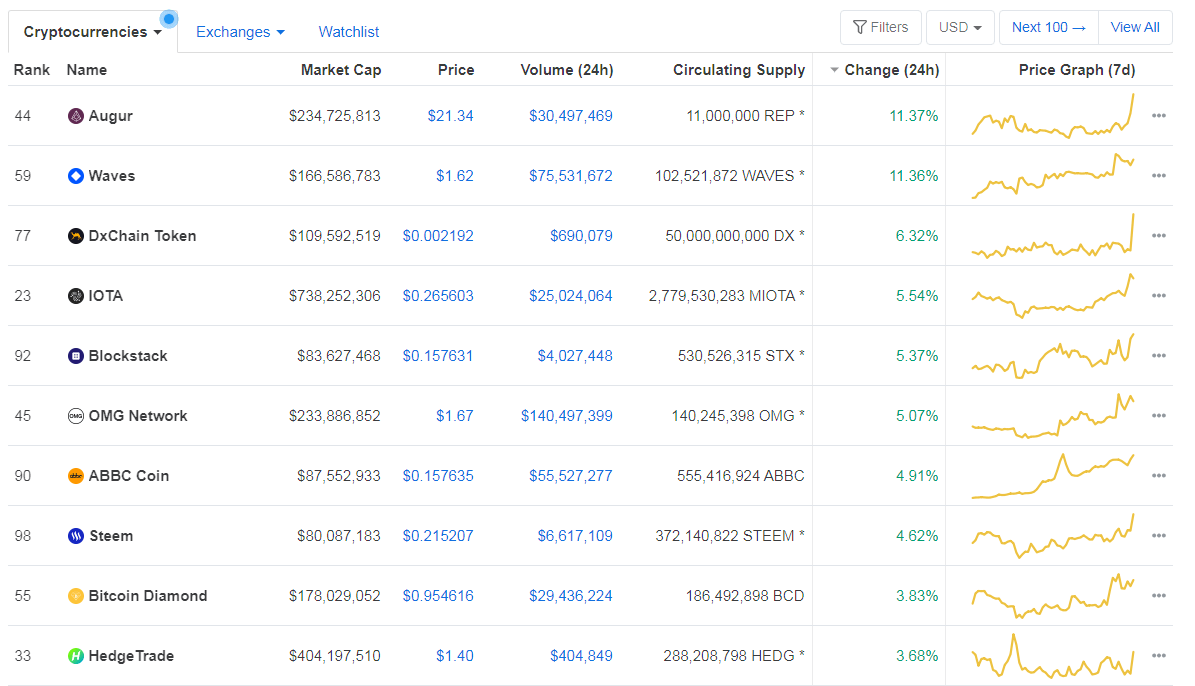
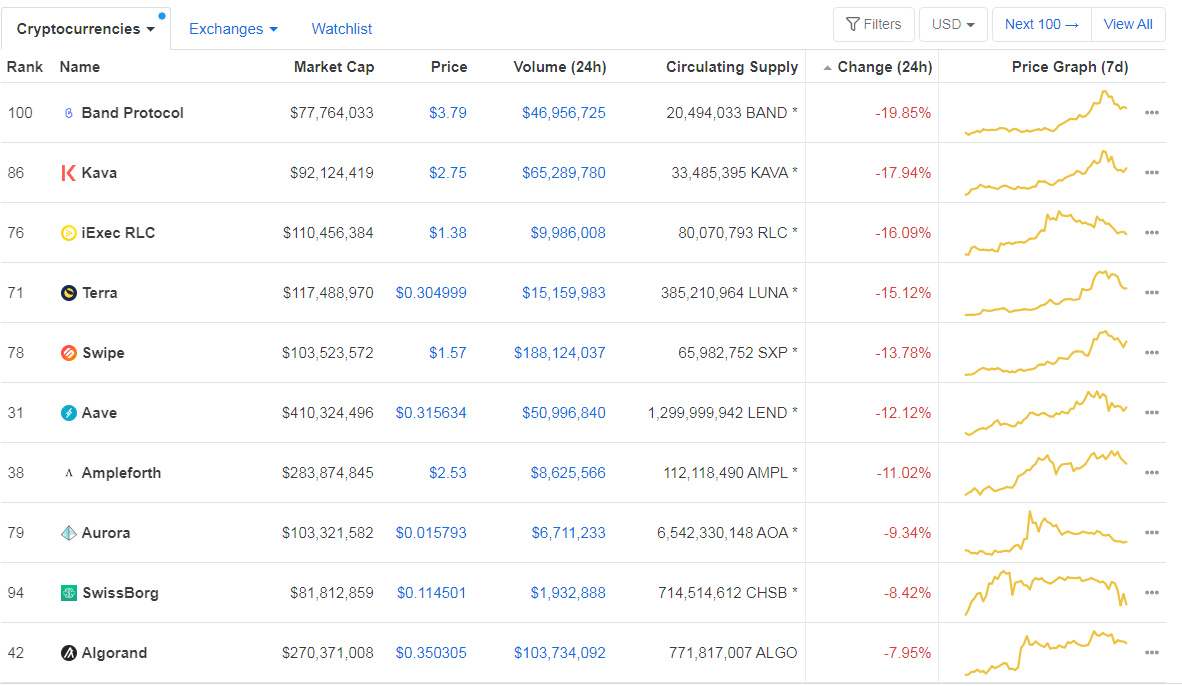
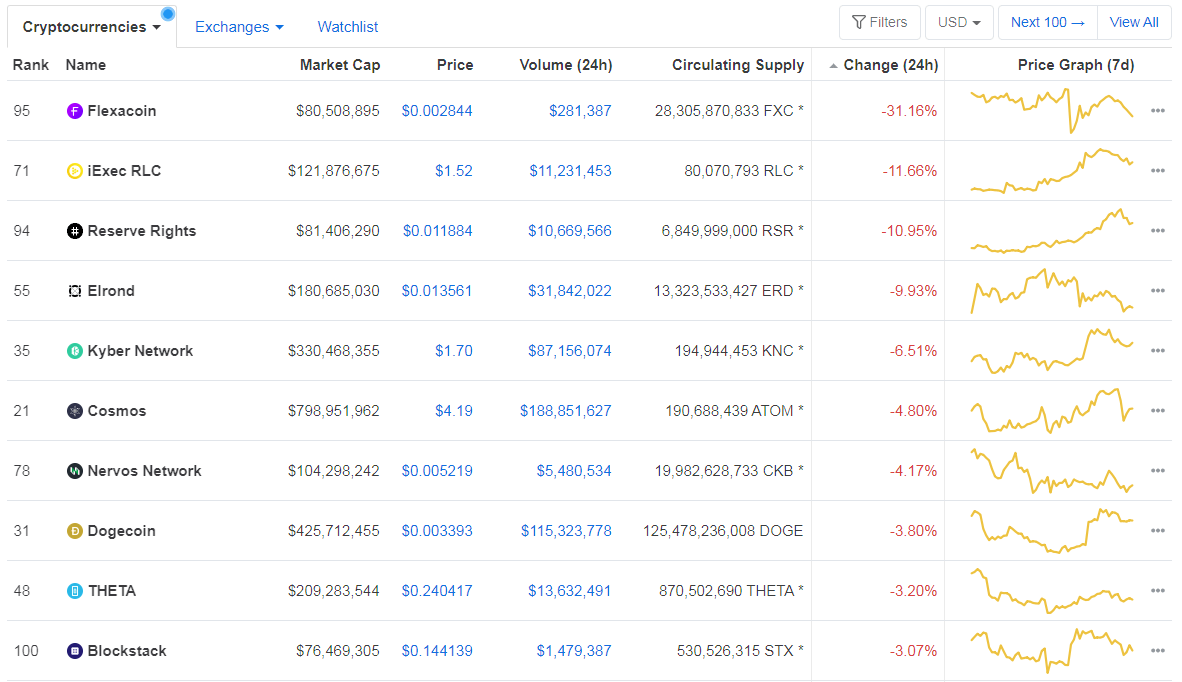
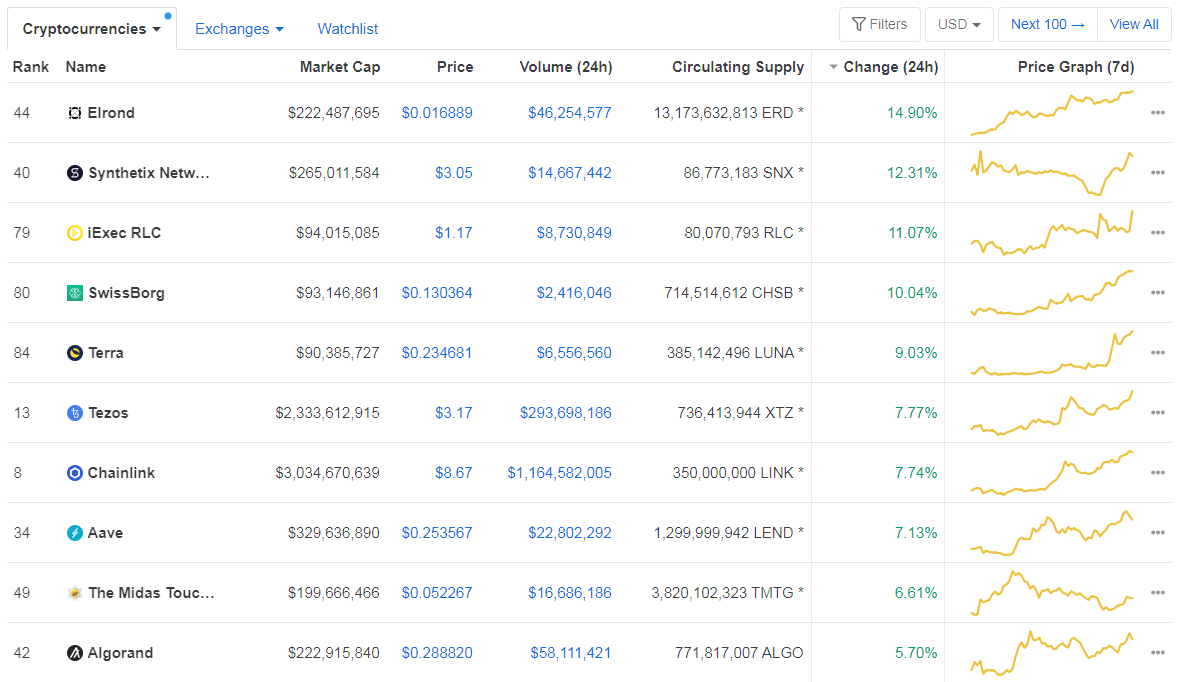
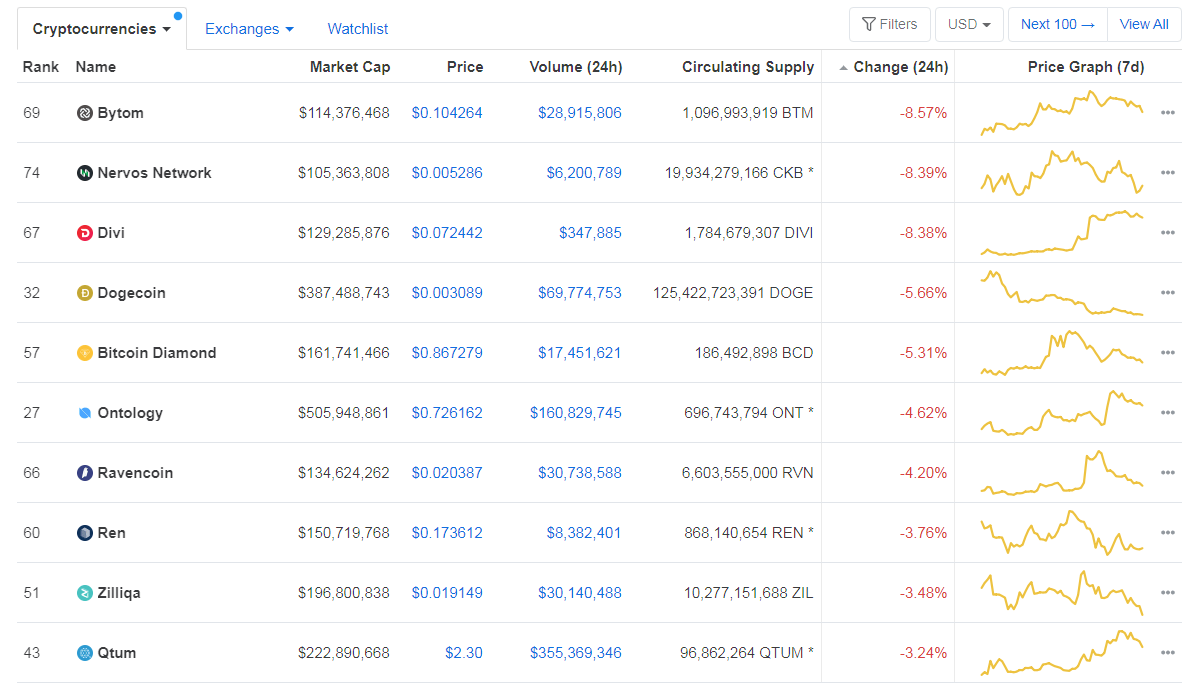
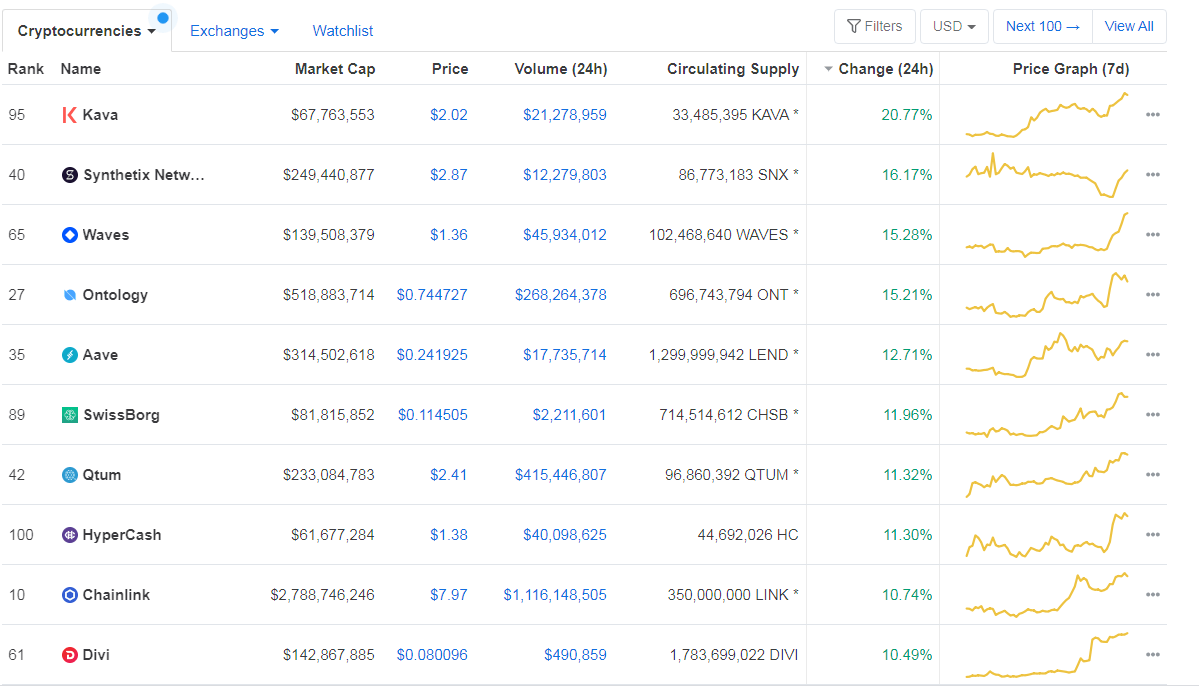
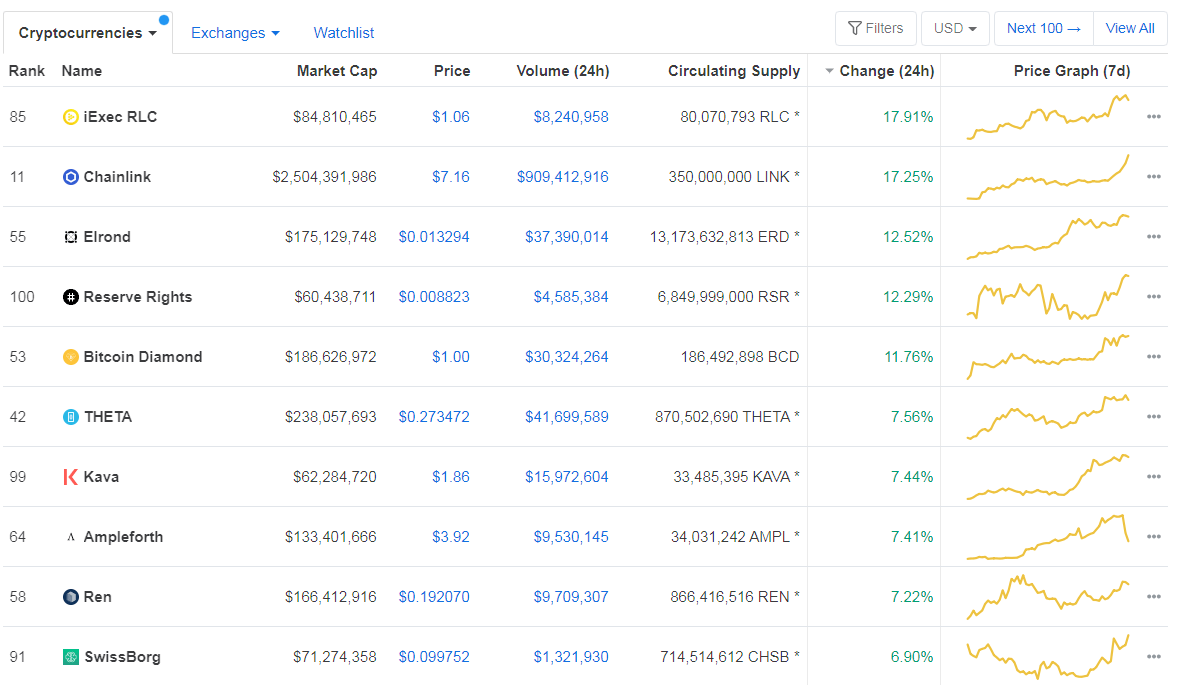
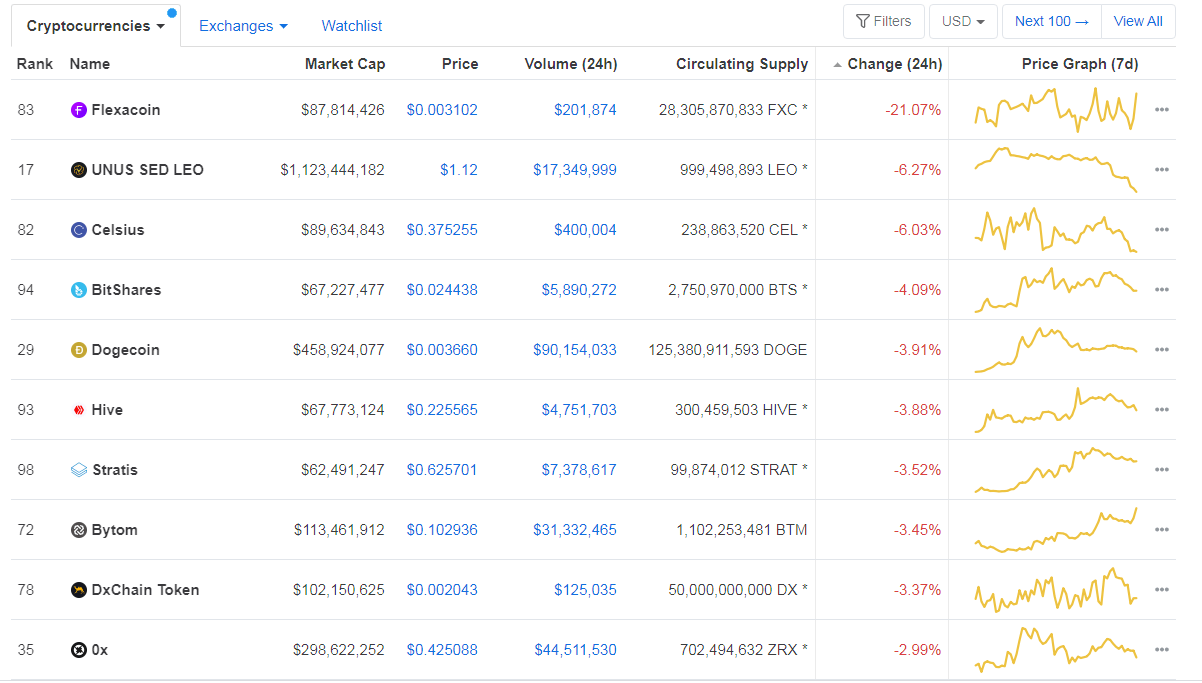
When talking about top100 cryptocurrencies, Elrond gained 22.75% on the day, making it the most prominent daily gainer. Status (10.69%) and Terra (9.44%) also did great. On the other hand, Synthetix Network has lost 10.39%, making it the most prominent daily loser. It is followed by Band Protocol’s loss of 6.95% and Aave’s loss of 6.76%.

Top 10 24-hour Performers (Click to enlarge)

Bottom 10 24-hour Performers (Click to enlarge)

Bitcoin’s dominance level decreased slightly since we last reported, with its value currently at 61.51%. This value represents a 0.78% difference to the downside when compared to Friday’s value.

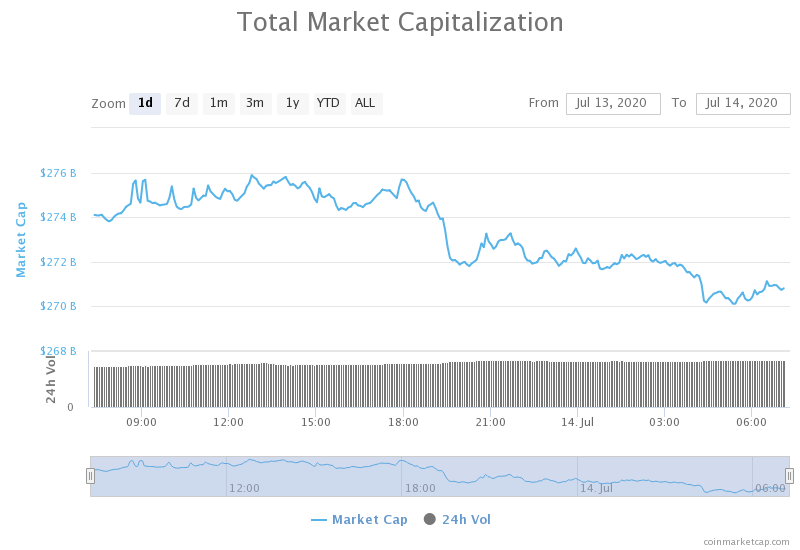
Daily Crypto Market Cap Chart

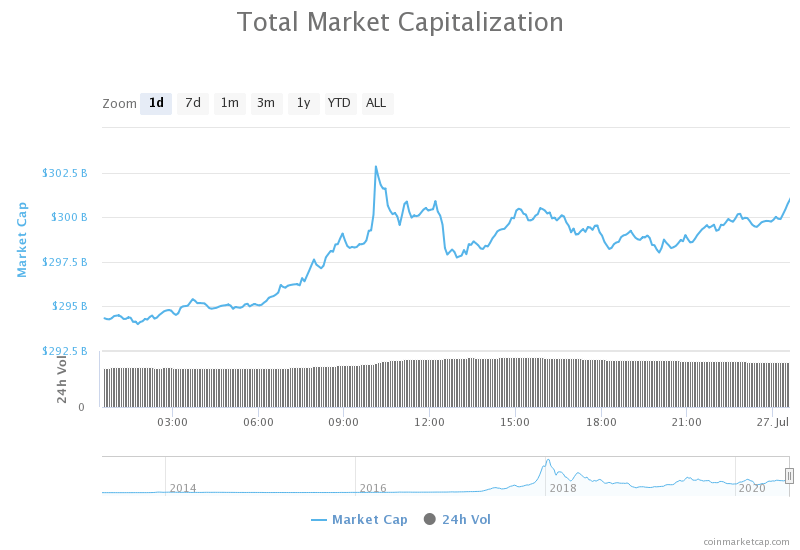
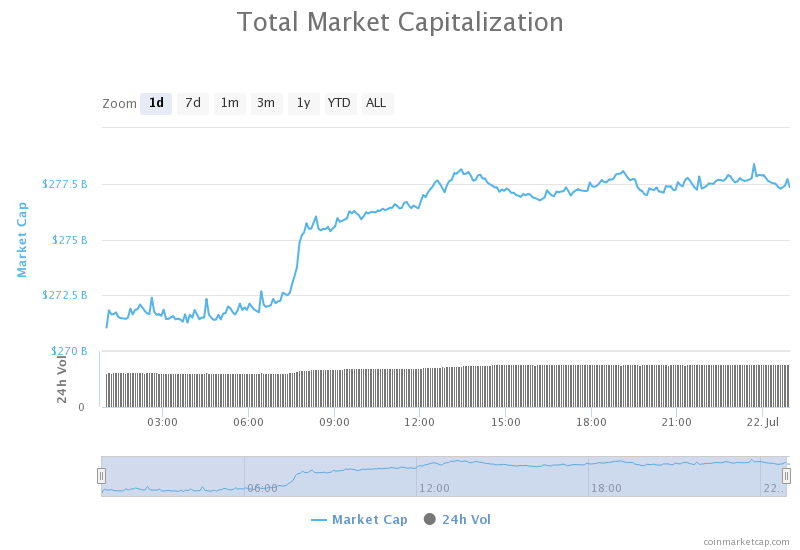
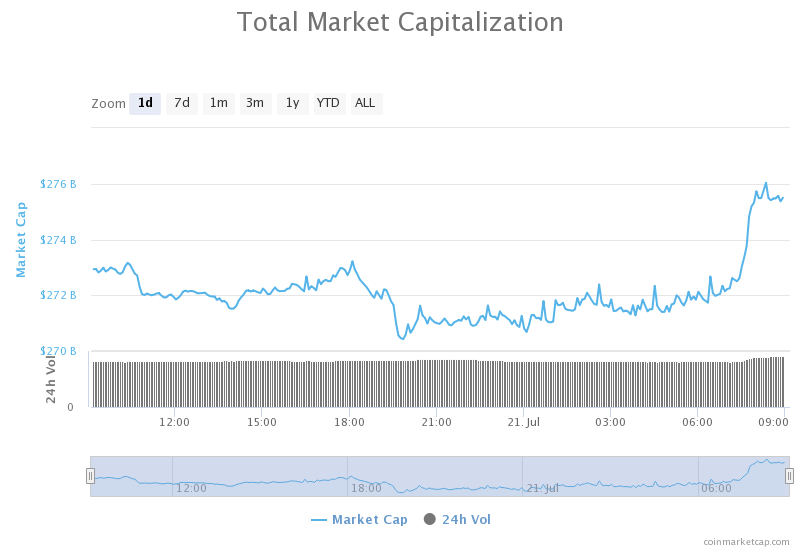
The cryptocurrency market capitalization skyrocketed and broke the $300 billion mark. Its current value is $300.47 billion, which represents an increase of $13.24 billion when compared to the value it had on Friday.

_______________________________________________________________________

What happened in the past 24 hours?

_______________________________________________________________________

_______________________________________________________________________

Technical analysis

_______________________________________________________________________

Bitcoin

The largest cryptocurrency by market capitalization had an amazing weekend, which ended with it breaking the $10,000 mark. Bitcoin experienced a steady increase in price for six days now, slowly breaking each obstacle in its path. The final move, which broke $10,000, was a bit hectic as the wall of sellers kept the price down for quite a bit. Bitcoin is now held from going up by the ascending resistance level. However, the “battle” for $10,000 is not over yet, as Bitcoin did not make a strong confirmation move.

BTC traders should look for a trade opportunity after BTC decides whether it will move above or below $10,000.

BTC/USD 4-hour Chart

Technical factors:

  • Price is currently above its 50-period EMA and its 21-period EMA
  • Price is above its top B.B.
  • RSI is in the overbought territory (76.57)
  • Volume Increased

Key levels to the upside          Key levels to the downside

1: $10,015                               1: $9,870

2: $10,505                               2: $9,735

3: $10,855                                3: $9,580

Ethereum

Ethereum, just like Bitcoin, made some amazing gains as well as broke major resistance levels over the course of the weekend. The second-largest cryptocurrency by market cap spent the past five days rising sharply towards the upside due to its booming fundamentals. The weekend ended with Ethereum moving past $300 and pushing to $325, with the move still continuing. With the RSI being heavily overbought and volume slowly declining, traders can expect the move to end soon.

Ethereum traders should look for a trade opportunity in Ethereum’s pullbacks from the big move towards the upside.

ETH/USD 4-hour Chart

Technical Factors:

  • Price is above the 50-period EMA and the 21-period EMA
  • Price is above the top B.B.
  • RSI severely overbought (82.86)
  • Extremely high volume

Key levels to the upside          Key levels to the downside

1: $340                                    1: $302

2: $362                                    2: $289

                                                 3: $278

Ripple

The third-largest cryptocurrency by market cap had a good weekend, though not quite as good as Bitcoin and Ethereum. XRP established its position above $0.214, which is a great mid-term indicator. While the initial bullish move got stopped by the $0.227 and XRP started moving towards the downside, the current position XRP is in is quite good.

XRP traders can look for an opportunity within the range XRP is currently trading in.

XRP/USD 4-hour Chart

Technical factors:

  • XRP in a mid-term descending trend (though it broke the trend in the short-term)
  • Price above 21-period and the 50-period EMA
  • Price is below the top B.B.
  • RSI is elevated (64.47)
  • Average/slightly higher than average volume

Key levels to the upside          Key levels to the downside

1: $0.227                                  1: $0.214

2: $0.235                                  2: $0.205

3: $0.245                                 3: $0.2


Categories
Forex Basic Strategies

Learning To Trade The GBP/JPY Pair Using The ‘Guppy Burst’ Strategy

Introduction

After discussing some of the intraday and long-term trading techniques, we will now focus on very mechanical trading strategies. The strategies discussed previously were time-driven, which means each strategy involved several parameters.

This style of trading is suited to newbies because it is purely based on a fixed set of rules and steps. Due to its non-dependence on rules specific time frames, the strategies we will be discussing span over three different categories: scalping, day trading, and position trading.

The first strategy is the guppy burst strategy, which is based on the 5-minute chart. The second strategy is English Breakfast Tea, which is based on the 15 minutes chart, and the third strategy we will talk about is the good morning Asia strategy, which is based on the daily chart.

The guppy burst strategy seeks to exploit trading profits when the market is quiet. One would have observed that the market is least volatile after the U.S. market’s close until the Asian market opens. The forex market is quiet during this time and tends to move gently. However, the market movement during this time is fairly predictable. The market again momentum after the Asian market opens.

Time Frame

The guppy burst strategy works well on the 5-minute time frame. This means each candle represents 5 minutes of price movement.

Indicators

This strategy is based on pure price action; hence, no indicators are required for this strategy.

Currency Pairs

This strategy applies only to the GBP/JPY currency pair.

Strategy Concept

Firstly, we identify a ‘range’ during the window of three hours between the close of the U.S. market and the opening of the Asian market. We are also taking advantage of the volatility that is witnessed when the opening of the Asian market is nearing. We will place a pending buy order at the range’s resistance with a stop loss at the support.

Similarly, we will place a pending sell order at the support of the range with a stop loss at the resistance. This might appear opposite for some traders who are well versed with the support and resistance strategy. The reason behind buying at resistance and selling at support is that, as soon as the Asian market opens, the market starts to trend in the same direction of the current move. This means we are anticipating a breakout or a breakdown of the range.

We will have two take-profit points in this strategy. The first profit target is set at risk to reward ratio of 1:1.5, while the second one is at 1:2 risk to reward. By this, we ensure that we lock in some profits and don’t lose when the trade goes against our favor.

Trade Setup

Since the time zone of the trade very important here, we need to mark the reference candle for the strategy. It is the one that corresponds to 5 PM New York time, which is nothing but the closing time of the U.S. market. As mentioned earlier, the strategy is applicable only to the GBP/JPY currency pair. Here are the steps of the guppy burst strategy.

Step 1

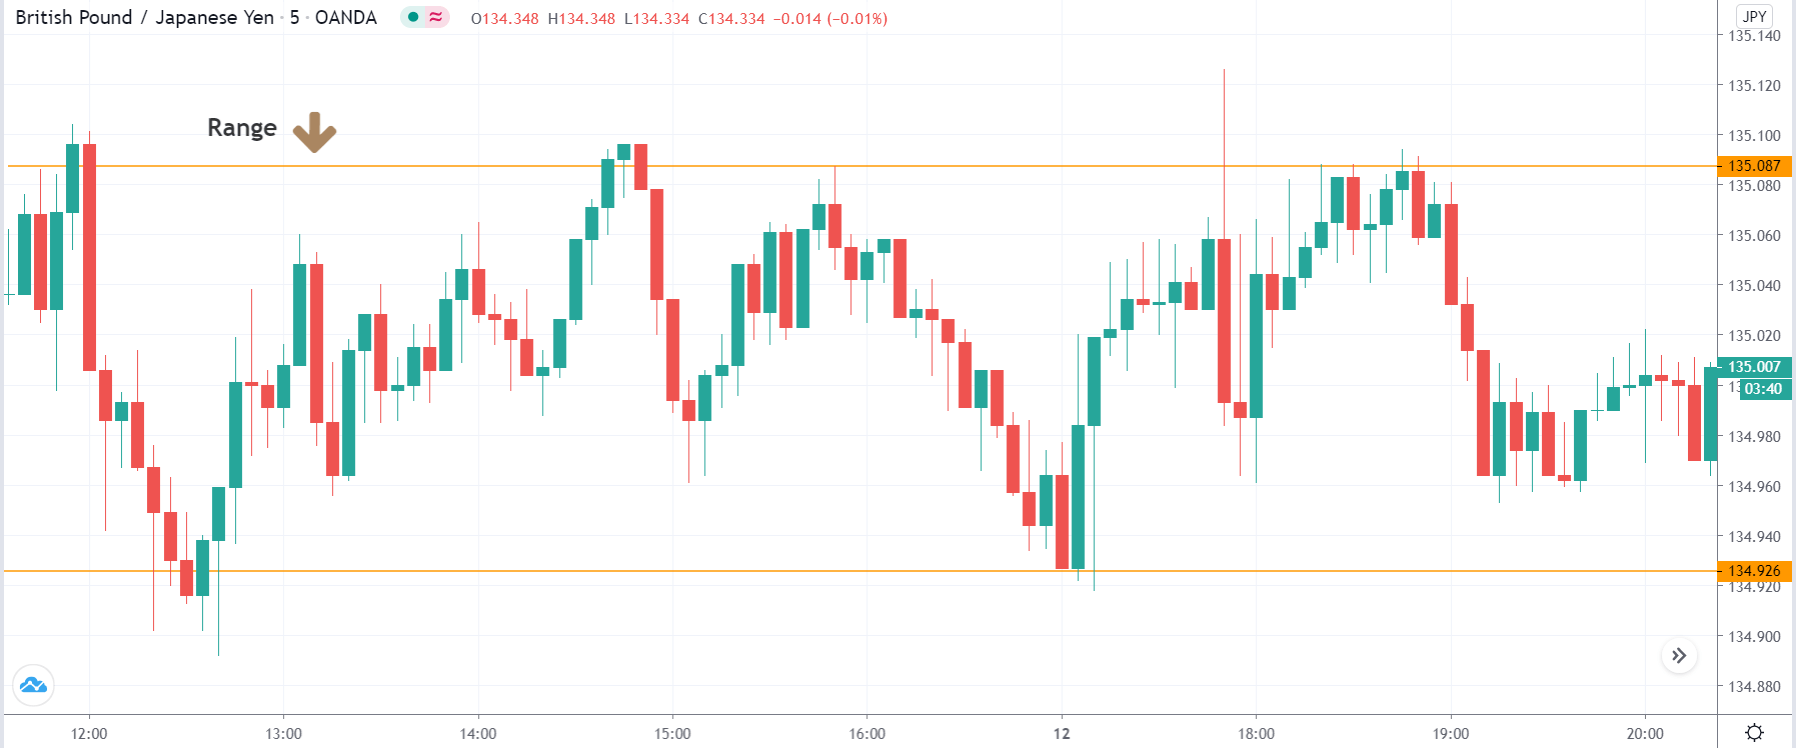
The first step is to open the chart of the GBP/JPY currency pair and then wait for the U.S. market to close. Mark this as the reference candle, and from here, the analysis of the chart begins. We need to analyze the pair on the 5 minutes candlestick chart. The below image shows an example of such a trade setup on the GBP/JPY pair. Here we see that the market is an uptrend and recently has formed a range.

Step 2

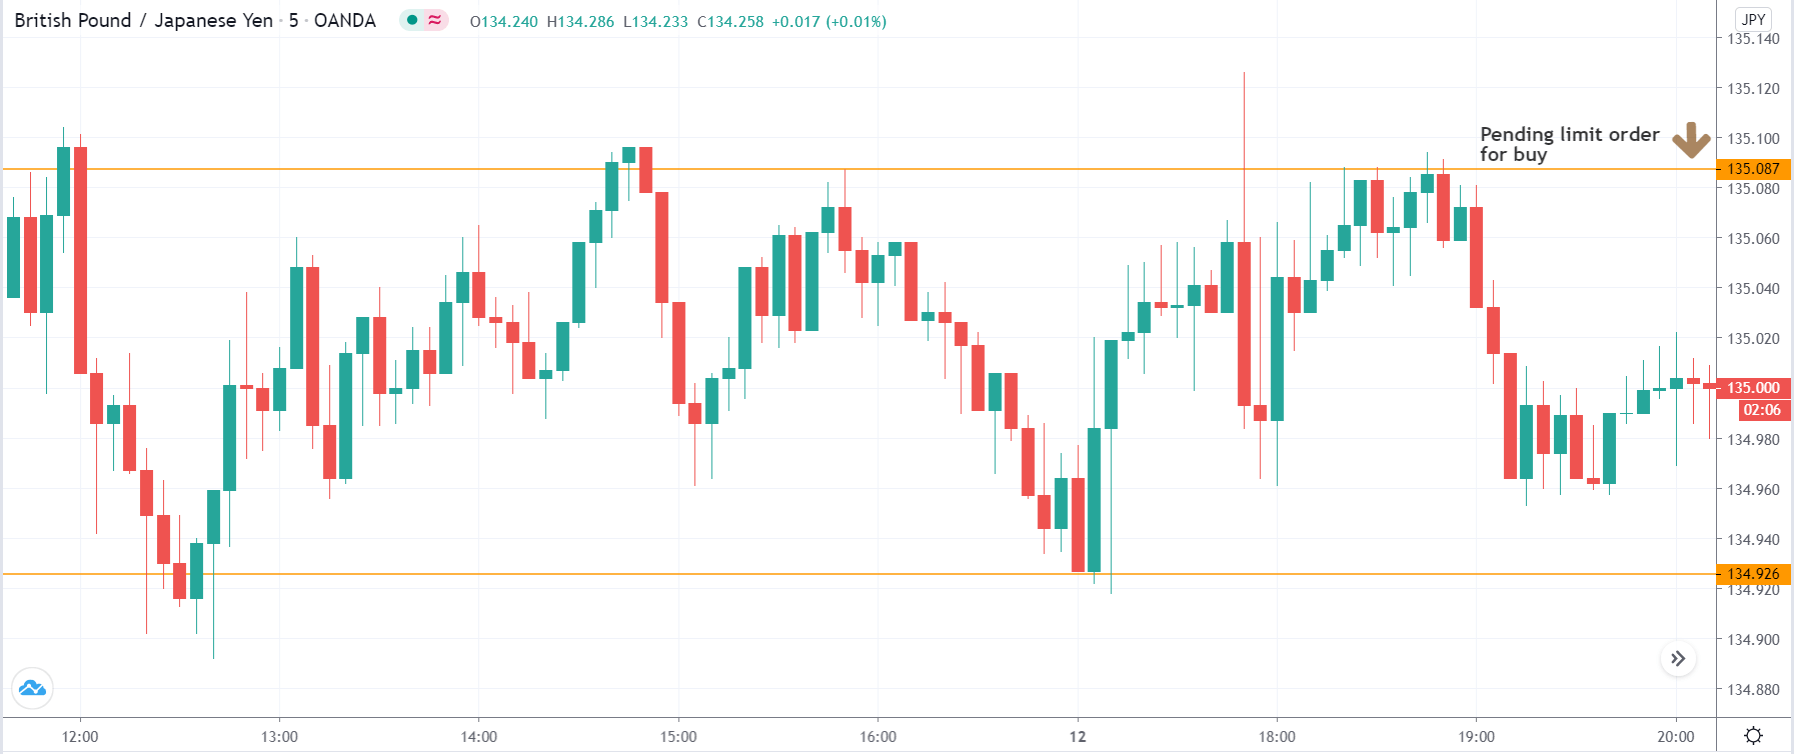
Next, we need to identify a ‘range’ where we have at least two points of support and resistance. We have to assure that the market does not start moving in a single direction after the U.S. market closes. If it does, then the strategy is no longer valid. However, the market mostly remains sideways after the U.S. session. Depending on the market’s major trend, we place a limit order at support and resistance. If the major trend of the market is up, we place the ‘buy’ limit at the resistance, and if the major trend is down, we place the ‘sell’ limit at the support.

Step 3

In this step, we do not have to do anything, but just wait for the market to hit our limit orders. At the same time, if our limit order is not triggered, we should leave the market as it is and not chase it. This is an important part of risk management.

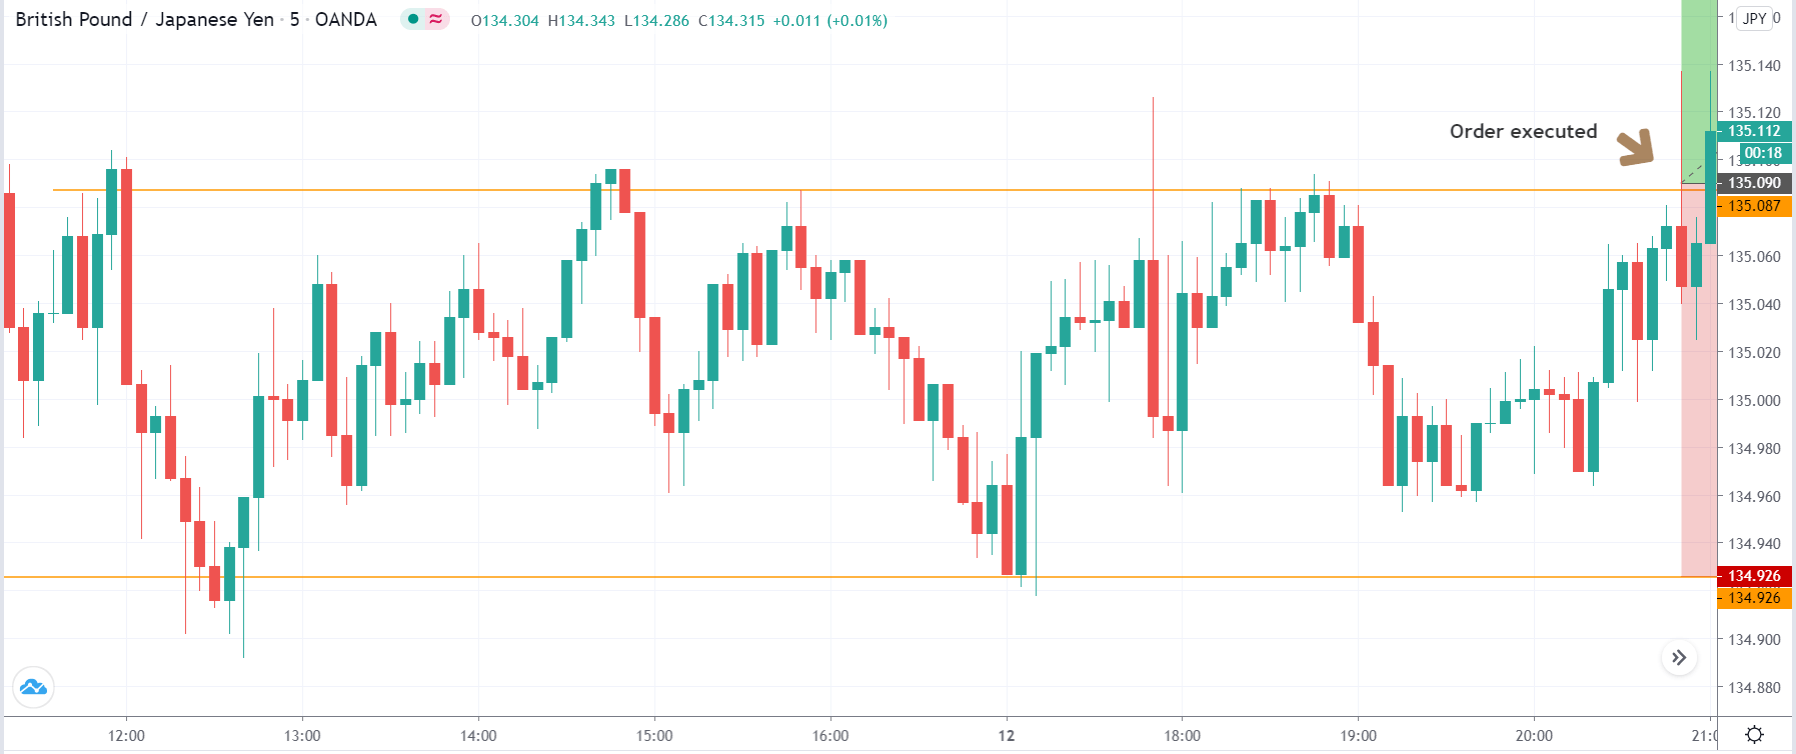
In the below image, we see that our ‘buy’ order gets triggered a few minutes after the opening of the Asian market.

Step 4

As mentioned earlier, we have two ‘take-profit’ points for the strategy. The stop-loss placed at support if going ‘long’ in the market and at resistance if going ‘short.’ The first ‘take-profit’ is set at a point where the resultant risk to reward of the trade is 1:1.5. The second ‘take-profit’ is set at 1:2 risk to reward. We lock in some profits at the first profit target, which ensures that we don’t lose money even if the market turns around.

The below image shows how the market continues to move upwards and starts trending after the breakout from the range.

Strategy Roundup

As we are not sure when the breakout will happen, the best way to enter the market is by creating a pending order on the extreme ends of the range. The important part is the identification of the range during the three-hour window between the U.S. market close and Asia market open. Along with that, make sure to place a limit order in the direction of the market.

Categories
Forex Basic Strategies Forex Daily Topic

Trading Three-Point Reversal and Continuation Patterns

Introduction

The fundamental question that any technical investor asks it is where a trend begins and ends? The final aspiration of the analyst is to identify the start of a new market direction as early as possible, enter the market, and make money with the trend.

A technical tool that could aid in the reversal trend identification process is the reversal chart patterns, which we will review in this educational article.

Three-Point Patterns

Three-point patterns are chart formations that can be broken into two categories, identified as reversal and continuation patterns. But, in this regard, the technical trader should consider that sometimes reversal chart formations may act as continuation patterns.

Stop-Loss Setting: In general terms, the stop-loss level should be located above (or below) of the nearest peak or valley of the entry-level of the chart formation.

Take Profit Setting: There is a broad range of methods available to the technical trader to establish a profit target level. Some of the options to establish this level are:

  • A Fibonacci ratio projection.
  • Parallel trend lines defining a trend channel.
  • An equivalent length to the previous impulsive wave.
  • A range extent similar to the previous move.

Trailing Stop Use: A trailing stop is an added method to protect profits. The trail stop advances as the move progresses in favor of the trade, but the stop level holds during retracements.  This method not always improve the results, although it is an excellent psychological anchor. The downside of using trailing stops, however, is that it could generate a premature closure of the trade, thus not allowing a trade to mature properly while the current trend is still progressing.

Classical Three-Point Patterns

In the technical analysis literature, there exists a wide variety of chart patterns. However, both Thomas Bulkowski, as Fischer and Fischer, agree on a reduced group of trend reversal patterns as the best indicators of a reversal. These are identified as follows.

Head and Shoulder Pattern: The H&S pattern is the most popular trend reversal pattern. H&S tends to appear regularly in the financial charts. However, in some cases, the H&S formation fails, and the market action continues developing with its previous trend. An ideal Head and Shoulder pattern should have the right shoulder at the same level as the right shoulder.

A market entry might be taken once the price action breaks and confirms the close below (or above) the neckline. The stop-loss should be placed above the second shoulder. The profit target level is assumed to be placed at an equivalent distance taken from the head to neckline, and projected from the breakout level.

Triple Top and Bottom: These formations rarely appear in financial markets. However, when they do, they tend to be profitable. 

The entry signal is to be set once the price breaks and closes above (or below) the top (or the low) price range. The stop-loss level should be placed below (or above) the triple top (or bottom) range. As a profit target, it is recommended a range equivalent to the length of the high and low, projected from the breakout level.

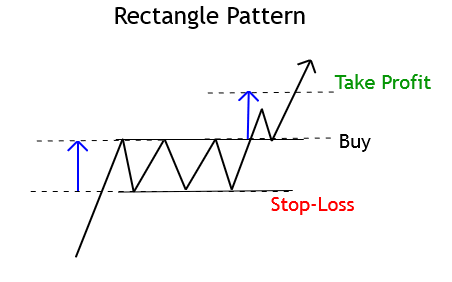
Rectangle Pattern:  In this formation, the price moves between two parallel trend-lines that progress horizontally. A trade signal will trigger after the price breaks and closes above (or below) the rectangle range. 

A conservative way to confirm the entry signal consists of waiting for the closeout of the rectangle formation range. The stop-loss and profit target levels hold the same arrangement as in a triple top and bottom pattern.

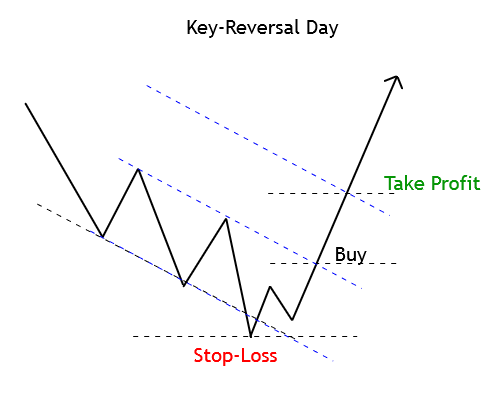
Key-Reversal Days: Although a Hammer Candlestick pattern offers poor performance, it tends to increase when the price action develops a hammer in a third peak or valley at the end of a fast market.

This pattern does not have any specific entry setup; however, Fischer and Fischer considers that for the pattern to be considered, the shadow’s length of the hammer should be at least three times its body.

The stop-loss should stay below (or above) the low of the key-reversal day. The profit target level may be set at the same distance as the previous trading range.

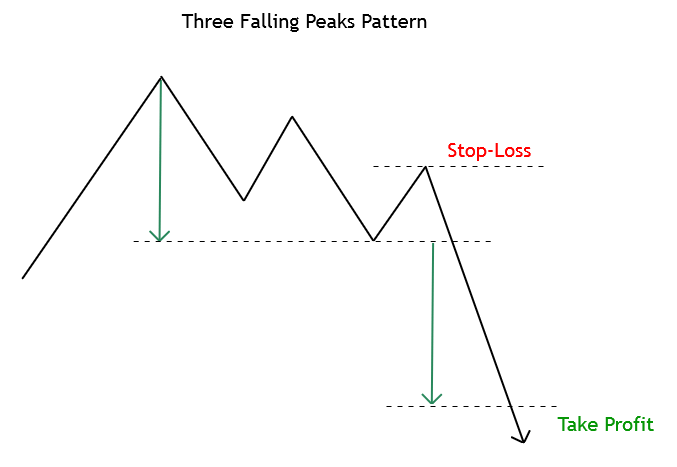
Three Ascending Valleys and Three Descending Peaks: These formations are usually the most reliable three-point patterns.

The essence of these formations, higher (or lower) highs and lows, indicate the continuation of the trend. Generally, a long position signal will trigger if the price rises above the highest peak and a short position when the price settles below the lowest valley.

The stop-loss should be located above (or below) the recent peak (or valley.) Finally, the profit-target level should be set at the equivalent distance of the previous range projected from the entry-level.

Triangles: Triangle patterns shows three basic variations, symmetric, descending, and ascending. The symmetric triangle could be both a reversal and a continuation formation; however, the ascending and descending triangles usually are continuation patterns.

The entry signal happens when the price breaks the triangle base-line. A stop-loss order may be located above the triangle top. In the opposite case, the protective stop should be placed below the triangle.

As profit-target level, a range from the highest to the lowest level of the triangle can be projected from the breakout level.

Conclusions

The identification of the beginning of a new trend and how to make money from it has been the primary investor’s quest since Charles Dow’s era. Three-point patterns are useful tools not only to identify trend reversals but also to recognize continuation patterns.

In this context, Bulkowski’s work cited by Fischer and Fischer provides a useful statistical study, illustrating the failure rate of a broad range of chart formations. For example, the rectangle top pattern when the price breaks up has a 2% failure rate. On the other hand, the top key-reversal pattern has a 24% failure rate.

Lastly, Bulkowski’s ranking study could be a powerful tool for the technical trader, seeking ways to reduce the risk of his market entries. In this regard, identifying the patterns and their execution requires practice and confidence when placing the order on a breakout.

Suggested Readings

  • Fischer, R., Fischer J.; Candlesticks, Fibonacci, and Chart Patterns Trading Tools; John Wiley & Sons; 1st Edition (2003).
  • Bulkowski, T.; Encyclopedia of Chart Patterns; John Wiley & Sons; 2nd Edition (2005).
Categories
Forex Market Analysis

Daily F.X. Analysis, July 24 – Top Trade Setups In Forex – PMI Figures In Highlights!  

The eyes will remain on the PMI figures from Eurozone, the United Kingdom, and the United States on the news. All of the indicators are expected to perform better than before; therefore, buying can be seen in EUR, GBP during European session and selling during the U.S. session.

Economic Events to Watch Today  


EUR/USD – Daily Analysis

The EUR/USD pair was closed at 1.15969 after placing a high of 1.16267 and a low of 1.15401. Overall the movement of the EUR/USD pair remained bullish throughout the day. The EUR/USD pair continued its bullish streak for the 5th consecutive day on Thursday. They rose above 1.1600 level amid E.U. Summit’s success & broad-based U.S. dollar weakness, in the wake of increasing coronavirus cases in the U.S.. However, the gains were limited because of rising safe-haven appeal after the tensions between the U.S. & China escalated over consulate issues.

The Euro continued to benefit from the E.U.’s agreement on a recovery fund worth 750 euro billion. Investors were stocking into Italian bonds as the Eurozone’s third-largest economy was set to benefit from the funds. The safe-haven German bonds also cheered inflows despite potential competition from the upcoming issuance of the European Commission’s mutual debt.

Besides this, the U.S. dollar struggled to gain traction and failed to receive risk-averse inflows. U.S. jobless claims from last week came in as disappointed with an increase to above 1.4M. The hopes for quick U.S. economic recovery vanished and weighed on the U.S. dollar that ultimately raised EUR/USD prices.

The U.S. Dollar Index that measures the U.S. dollar value against the basket of six currencies was down 0.1% near 94.934 after hitting its lowest since March 9. This situarion also helped in the upward trend of the EUR/USD pair on Thursday. However, the positive news related to coronavirus vaccine countered with the headlines of mounting cases and coronavirus-related deaths in America. The U.S. coronavirus cases reached 4 million on Thursday with over 2600 new cases average, the world’s highest rate. The news about vaccine development from all over the world was raising optimism around the market. As earlier this week, Russia claimed that its first vaccine against the coronavirus was ready as two groups of volunteers completed clinical trials with results showing that all of them build up immunity.

On the other hand, Oxford University’s vaccine and China military vaccine also remained under highlights this week. All the vaccine news in the market, though, helped EUR/USD pair but were also overshadowed by the rising number of coronavirus globally.

Meanwhile, the tensions between the U.S. & China escalated after the U.S. ordered to close its consulate in Houston, Texas, on stealing intellectual property. The tensions between the world’s two largest economies escalated and hopes for a halt of the US-China phase one trade deal emerged.

This raised the safe-haven demand and limited the additional gains in EUR/USD pair on Thursday. Meanwhile, the German Gfk Consumer Climate was released on the data front at 11:00 GMT, which came in as -0.3 against the expectations of -4.6 in July and supported Euro, which ultimately added in the EUR/USD pair.

Daily Technical Levels

Support Resistance

1.1548      1.1637

1.1500     1.1676

1.1460     1.1725

Pivot point: 1.1588

EUR/USD– Trading Tip

The EUR/USD has been trading in a bullish channel, which is providing resistance at 1.1629 level. At the moment, the EUR/USD pair is trading at 1.1609 level, and the continuation of a bullish trend can lead to its prices towards 1.1625 level. Further extension of a bullish trend can lead EUR/USD towards 1.1690 level upon the bullish breakout of 1.1625. The pair is holding above 50 EMA that supports a bullish bias. Today we should consider taking buying trades over 1.1565 level.


GBP/USD – Daily Analysis

The GBP/USD pair was closed at 1.27402 after placing a high of 1.27599 and a low of 1.26727. Overall the movement of GBP/USD pair remained flat yet slightly bullish throughout the day. The GBP/USD pair maintained its bullish streak for the 5th consecutive session on Thursday, supported by the weaker U.S. dollar across the board and negative Brexit hopes. However, the pair dropped heavily before posting gains on Thursday, and that fallout was because of the downbeat comments from the MPC member of Bank of England.

The U.S. Dollar Index fell below 95 levels and reached 94.6 level on Thursday, its lowest since March. The greenback’s massive sell-off was further supported by the poor than expected jobless claims data on Thursday. At 17:30 GMT, the Unemployment Claims form the U.S. increased to 1.416M against the projected 1.3M and weighed on the U.S. dollar. The rise in the number of jobless claims resulted from the increasing number of virus cases from the U.S.

The U.S. coronavirus cases extended to 4 million on Thursday with over 2600 new cases average, the highest rate in the world while the death toll in the U.S. reached 143,000. The weak U.S. dollar gave a push to GBP/USD pair prices on Thursday towards higher levels.

On Brexit front, the latest Brexit talks failed to provide any progress in negotiating and provided negative results instead as the U.K. press reported that the U.K. could be willing to leave the E.U. without a deal.

Supporting the statement, E.U.’s top negotiator Michel Barnier also said that a Brexit deal by the end of 2020 was highly unlikely. These statements weighed on the Cable and its pairs like GBP/USD pair that showed a sudden fall in Thursday prices.

Meanwhile, the local nation’s pandemic situation was also alarming as the U.K. government allowed to open Gyms and swimming pools and set the masks mandatory while getting service from takeaway restaurants. This made traders confused as gyms and pools could be more dangerous in spreading the virus.

Lastly, the interest rate setter of Bank of England, Jonathan Haskel, said that he was worried that Britain’s economic recovery from the coronavirus crisis could be slow. He added that the recovery would depend heavily on whether people felt confident to go out.

Haskel, who backed the BoE’s latest 100 billion pound expansion of asset purchases last month, also warned that unemployment could be worse than in the 2008-09 financial crisis. Haskel’s downbeat comments weighed on the Cable and caused the earlier losses of GBP/USD pair. However, the pair GBP/USD managed to end its day with a bullish candle as the dollar was also struggling.

Daily Technical Levels

Support Resistance

1.2689     1.2778

1.2636     1.2814

1.2600     1.2866

Pivot Point: 1.2725

GBP/USD– Trading Tip

The GBPUSD is also holding in an overbought zone, and now it can drop until 1.2685 level, which marks 23.6% Fibonacci retracement below this the next support will be found around 1.2670 level. At the same time, resistance stays at 1.2730 and 1.2760. The RSI and MACD are in the bullish zone, but they form smaller histograms that suggest odds of selling bias in the market. Let’s consider taking buying trade over 1.2740 until 1.2795 level today.


USD/JPY – Daily Analysis

The USD/JPY pair was closed at 106.847 after placing a high of107.228 and a low of 106.709. Overall the movement of the USD/JPY pair remained bearish throughout the day. The U.S. dollar was weakened on Thursday with recovery gains in Europe despite heightened tensions between the U.S. and China.

The U.S. Dollar Index slipped at 94.6 level, which is the lowest level since March. The drop in the U.S. dollar was caused by the fears of slow economic recovery after a resurgence of infected cases in the U.S. and the improved risk sentiment of the market.

The risk-sentiment on Thursday was supported by the improved German Gfk consumer confidence, which suggested that Europe’s largest economy was on the way of its recovery. The confidence was improved after the 27 member states of the E.U. showed consensus on the E.U. stimulus package that will help the region rebuild from the pandemic’s damage.

The improved risk sentiment in the market pushed the EUR/USD pair prices on Thursday. However, risks sentiment remained under stress due to the escalated tensions between U.S. & China amid intellectual property theft. On Thursday, the U.S. ordered China to close its consulate in Houston and accused it of spying. Beijing called this move by the U.S. as “political provocation.”

Mike Pompeo, the U.S. Secretary of State, told that the decision was taken because China was stealing its intellectual property. China’s foreign ministry denounced the move and said that its embassy in Washington was receiving death threats.

The Chinese foreign ministry spokesman said that the reasons given by the U.S. for closing the consulate were unbelievably ridiculous. She urged the U.S. to reverse its erroneous decision, or china would react with firm countermeasures.

In response to China’s anger, the U.S. President Donald Trump provided hints for the closure of more Chinese consulates and fired the heat more. The rising fears of a dispute between the U.S. & China raised a safe-haven appeal. As in result, Japanese Yen gained strength, and the USD/JPY pair dropped.

On the data front, the Japan market was off due to holiday, and the U.S. released its jobless claims for the last week at 17:30 GMT. The data exceeded the anticipation of 1.3M and came in as 1.416 M; the rise in data means that the U.S. economy has a long way to go before starting to recover. This weighed heavily on the U.S. dollar, and hence, the USD/JPY pair declined further.

Daily Technical Levels

Support Resistance

106.64     107.17

106.41     107.47

106.11     107.71

Pivot point: 106.94

 USD/JPY – Trading Tips

The forex market shows some serious selling trend in the USD/JPY as the pair fell to 106.200 while writing this update. The USD/JPY may find support around 106.850 level, which marks the double bottom support on 4 hours timeframe. Boosted safe-haven demand can also trigger more selling until 105.950 and 105.130 level. The RSI and MACD are also supporting selling bias while the resistance will stay at 106.600 level. Let’s consider selling below 106.450 level today. Good luck!


Categories
Crypto Market Analysis

Daily Crypto Review, July 24 – US Banks Can Provide Crypto Custody Services; Bitcoin Approaches $10,000

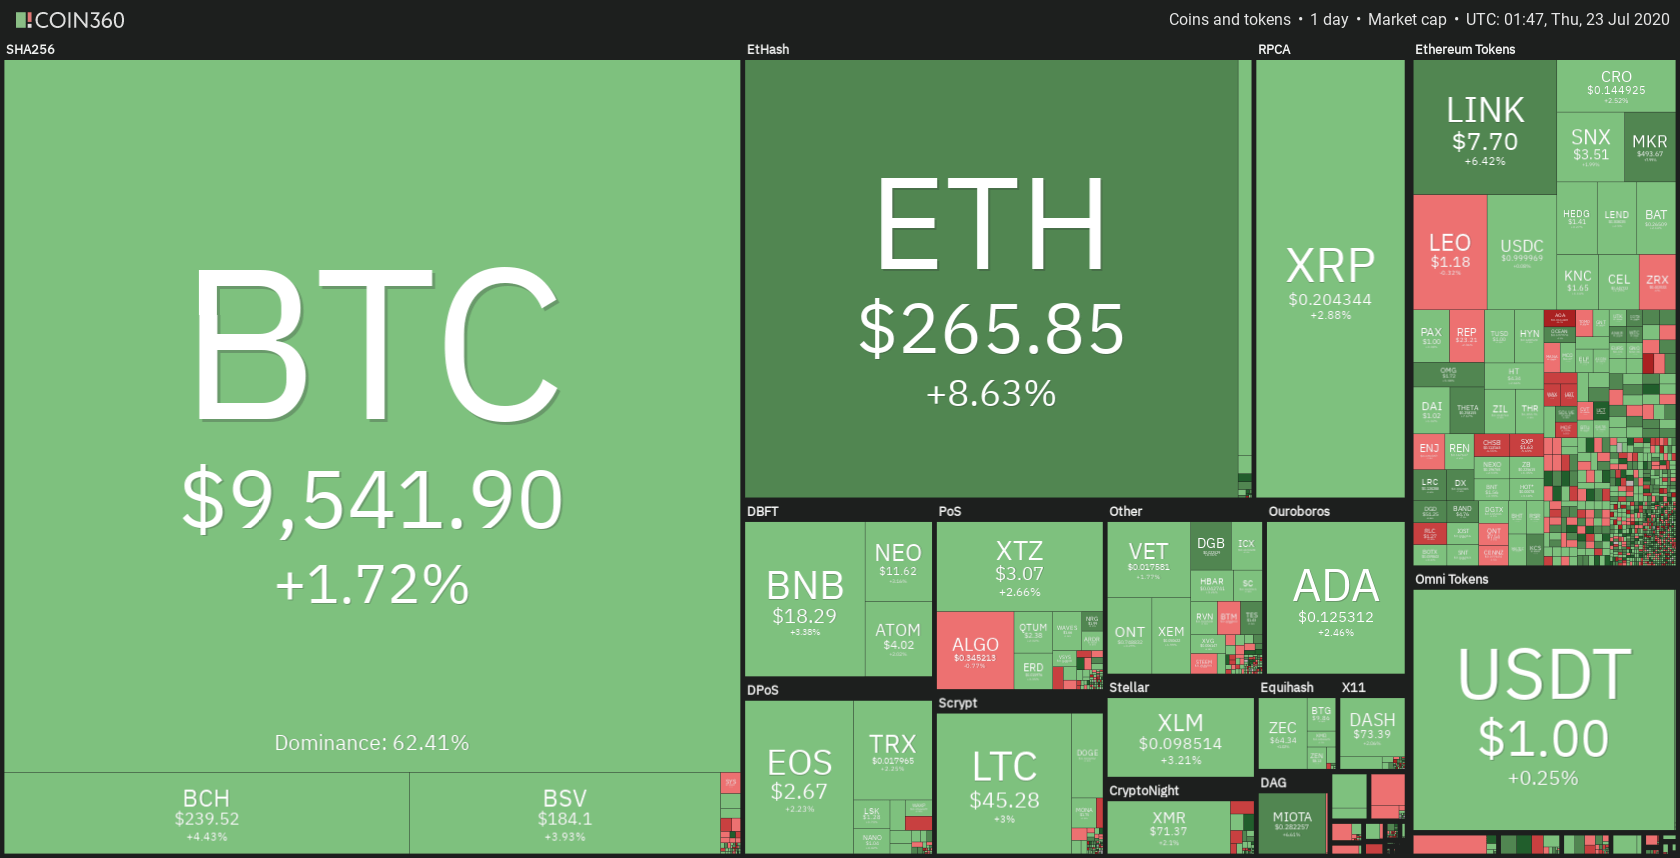
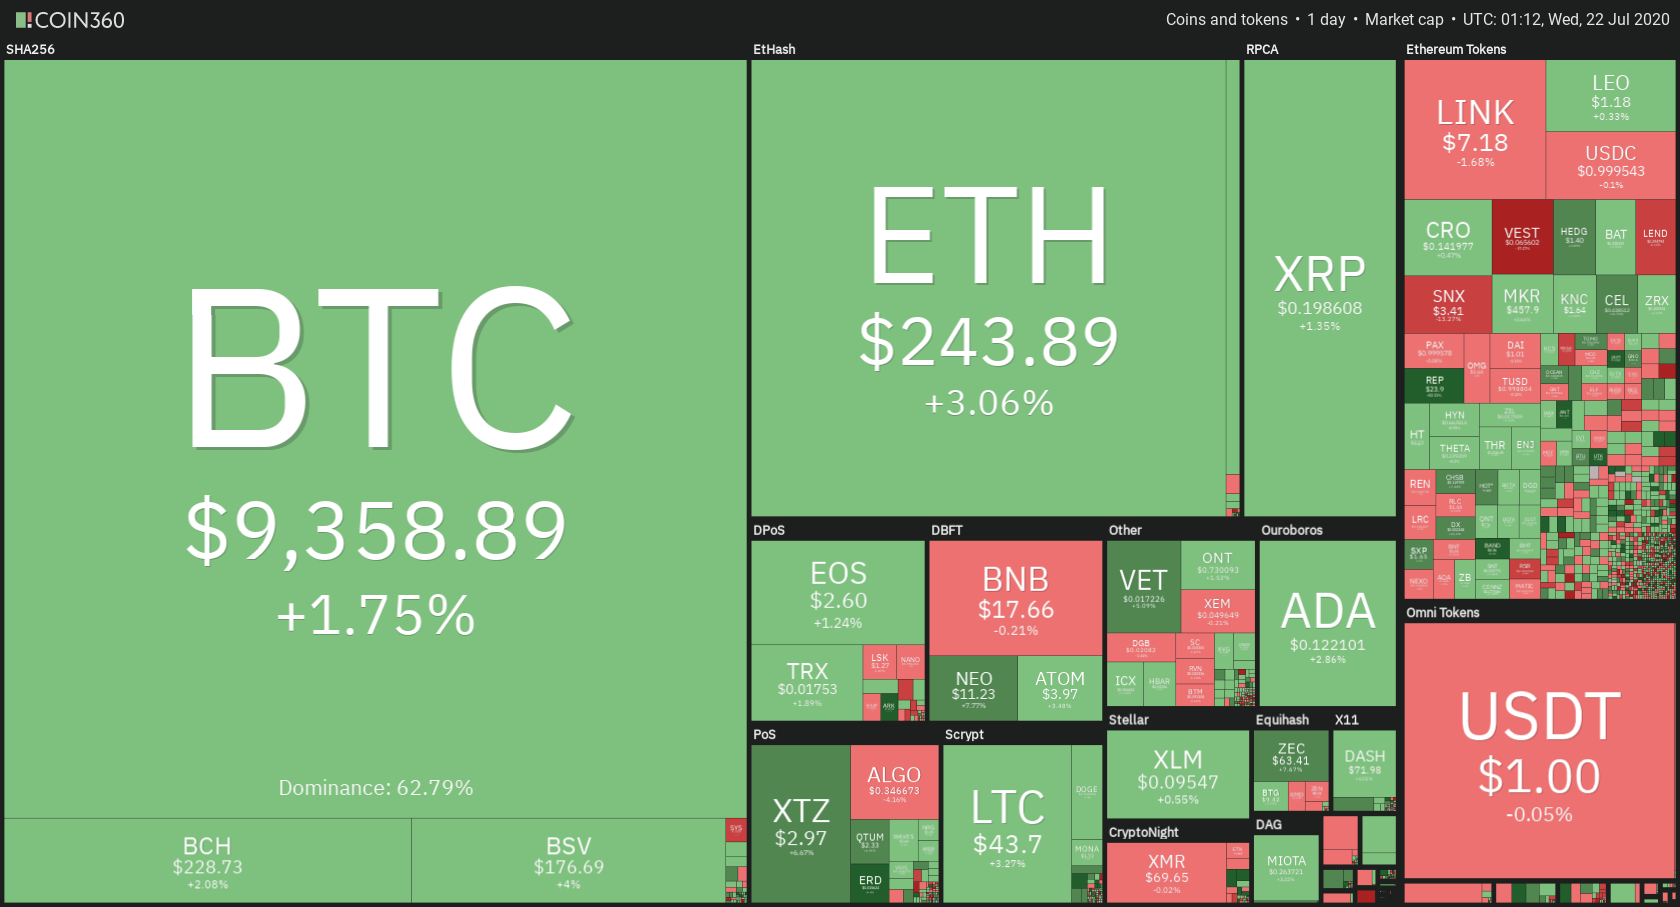
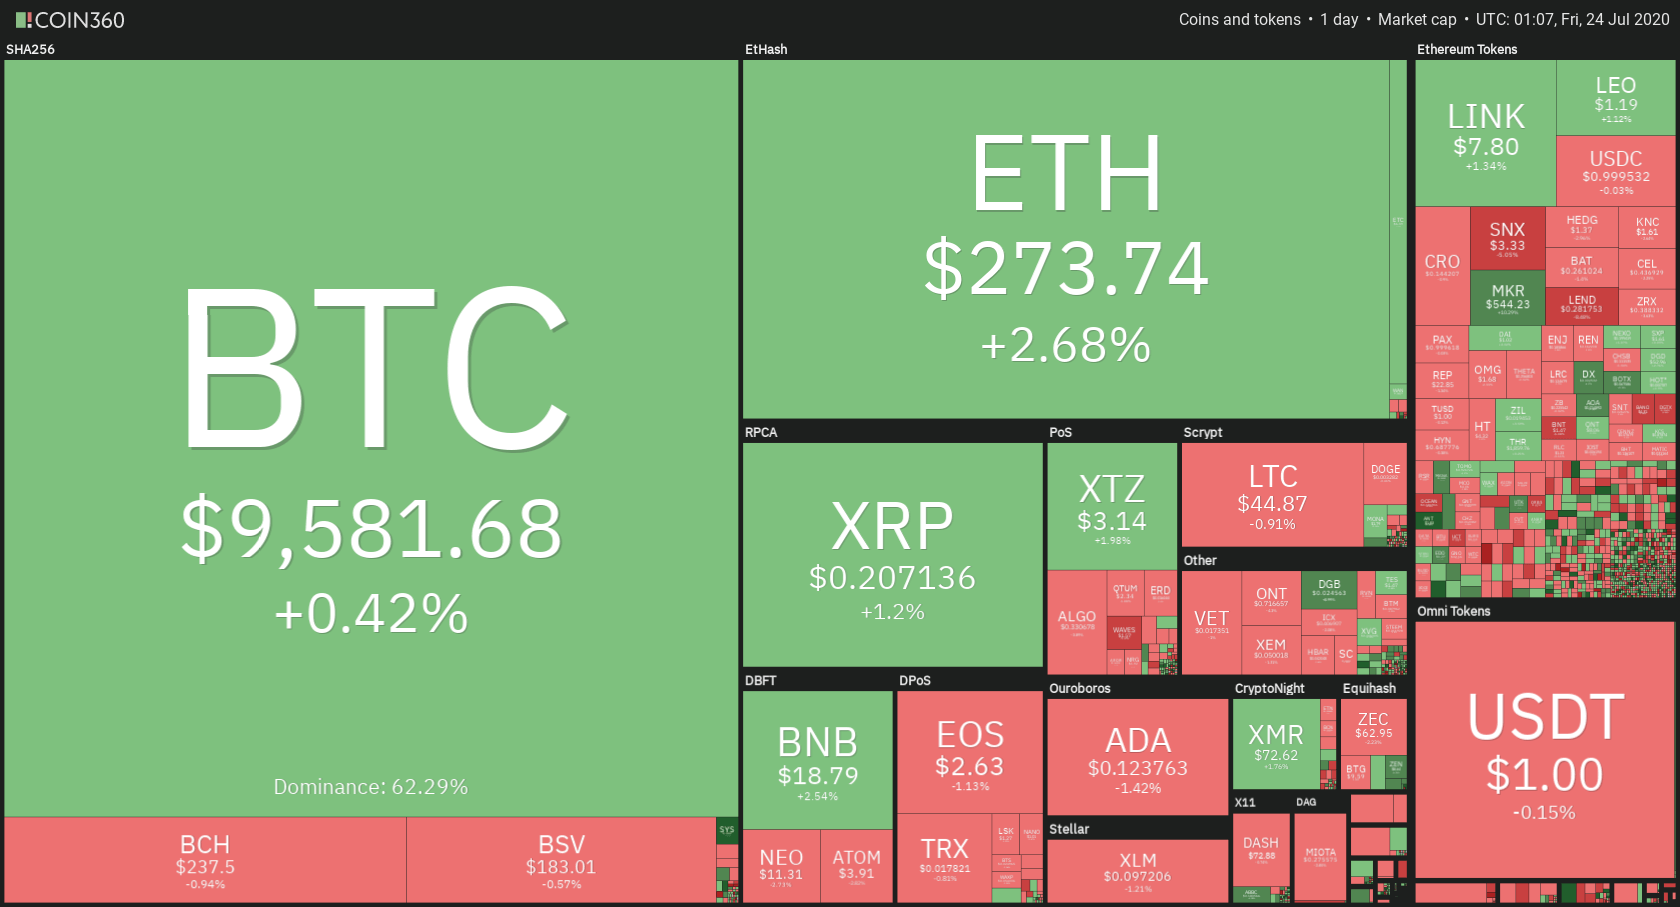
The cryptocurrency market spent yet another day shooting for the upside as Bitcoin tries to push itself closer towards $10,000. Bitcoin is currently trading for $9,358, which represents an increase of 0.42% on the day. Meanwhile, Ethereum gained 2.68% on the day, while XRP gained 1.2%.

 Daily Crypto Sector Heat Map

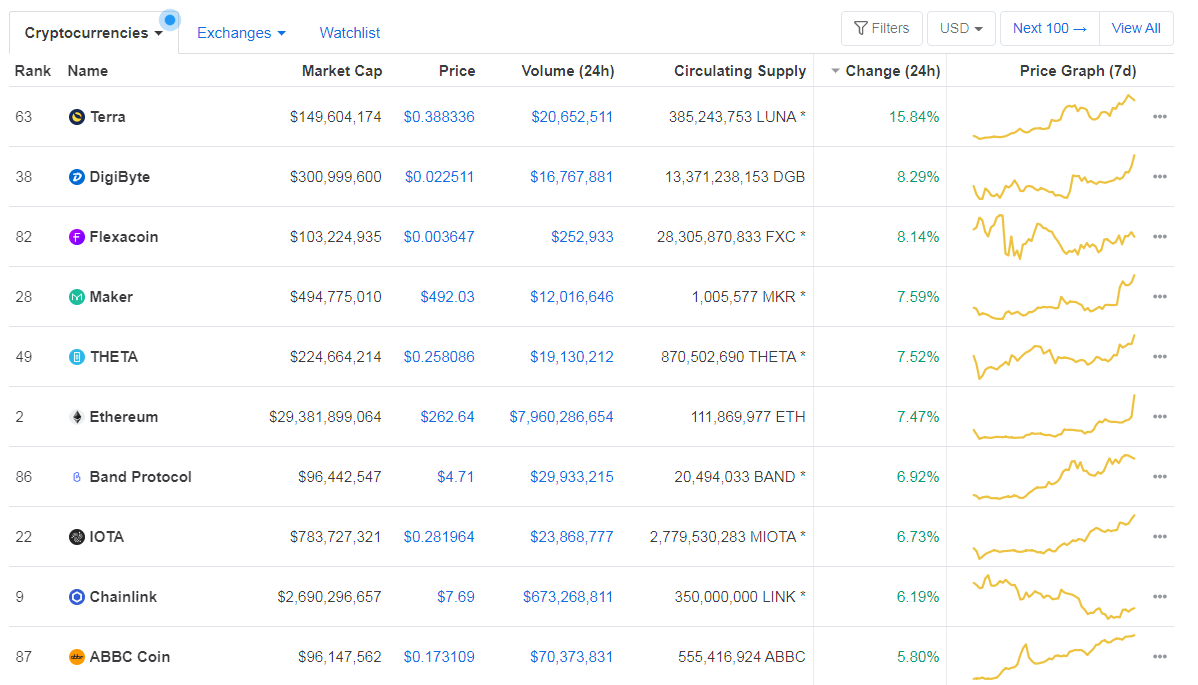
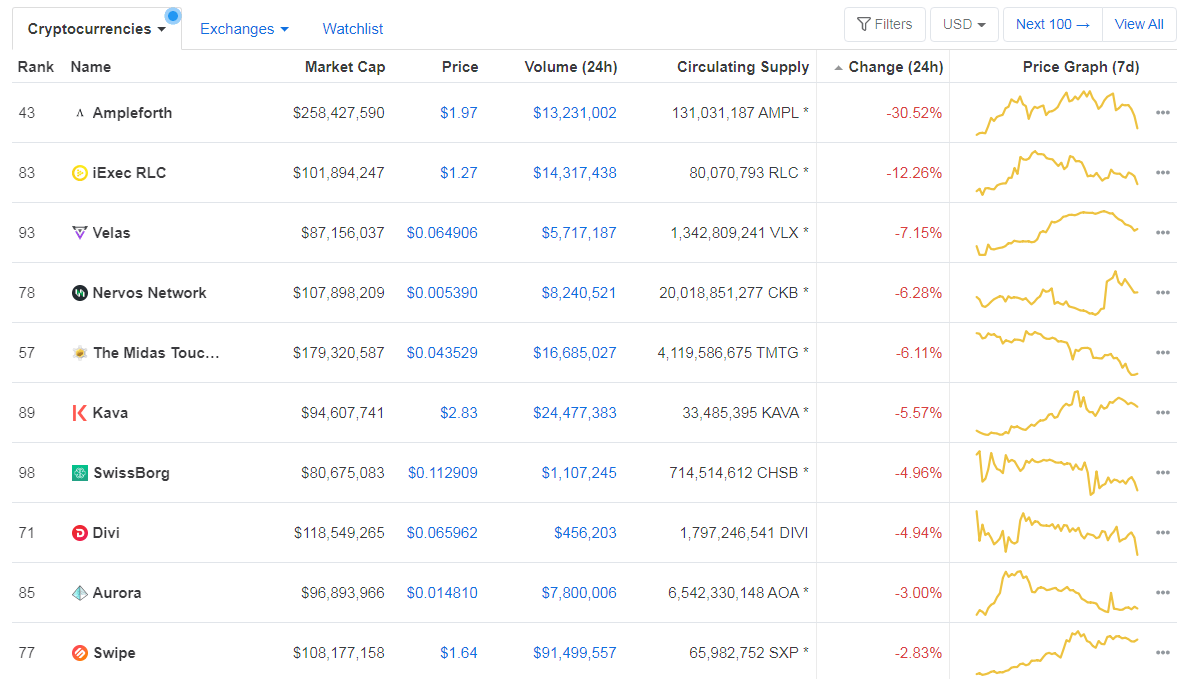
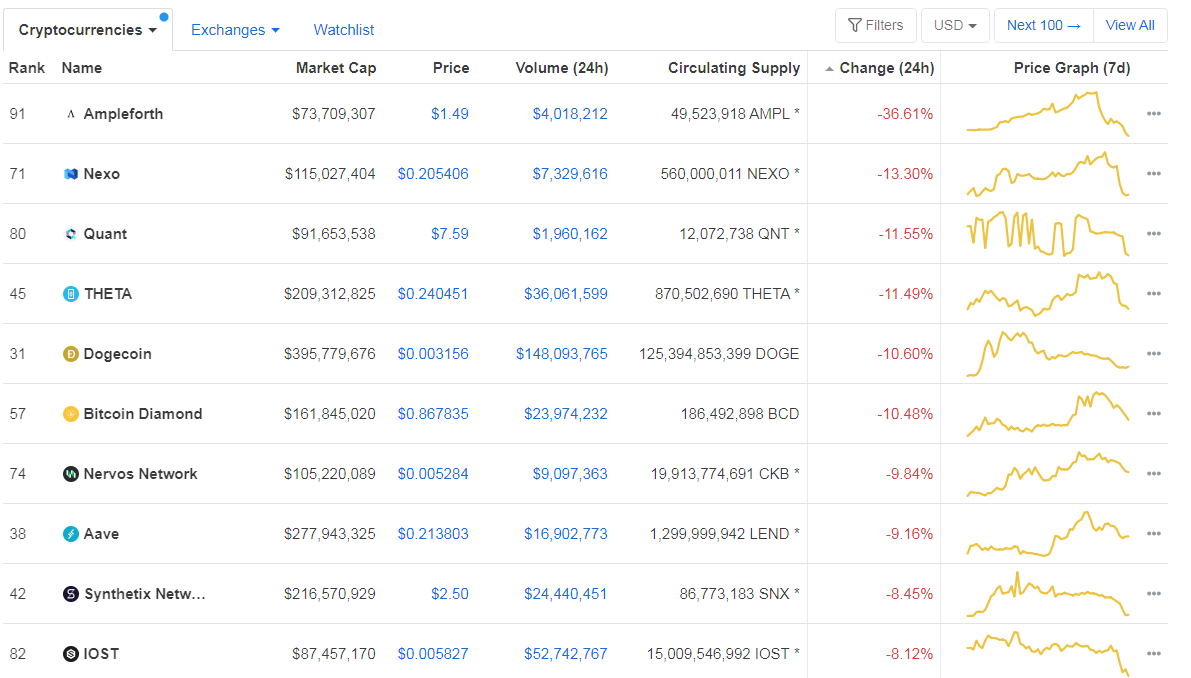
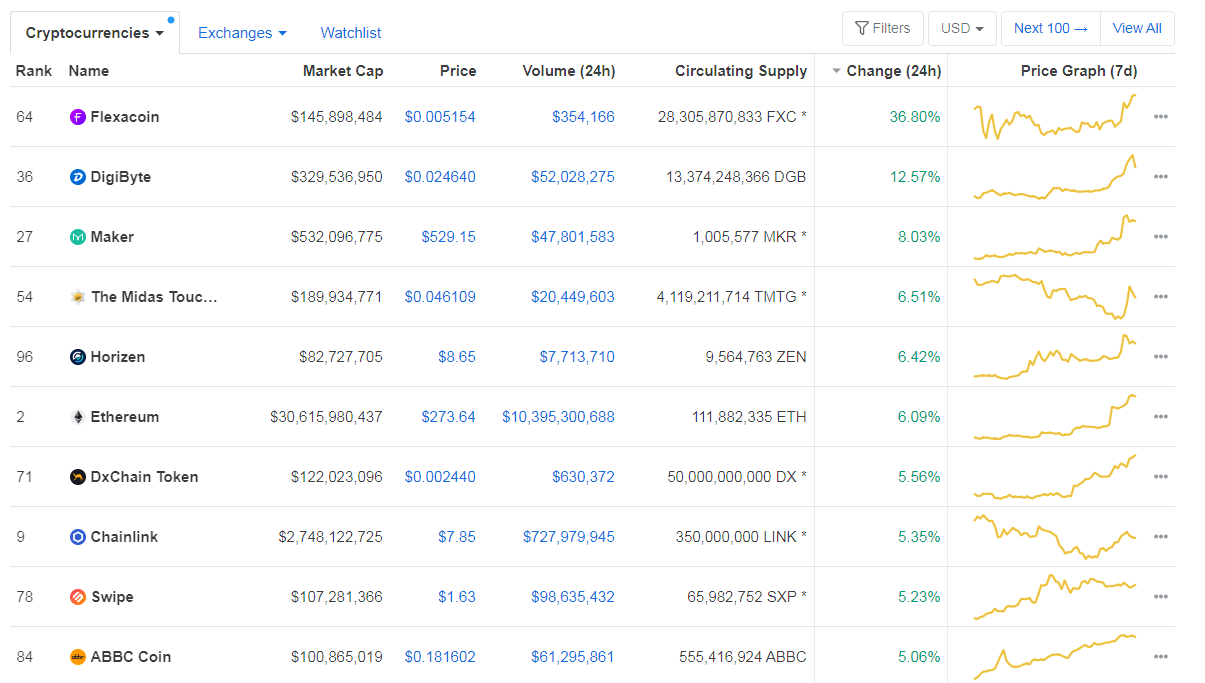
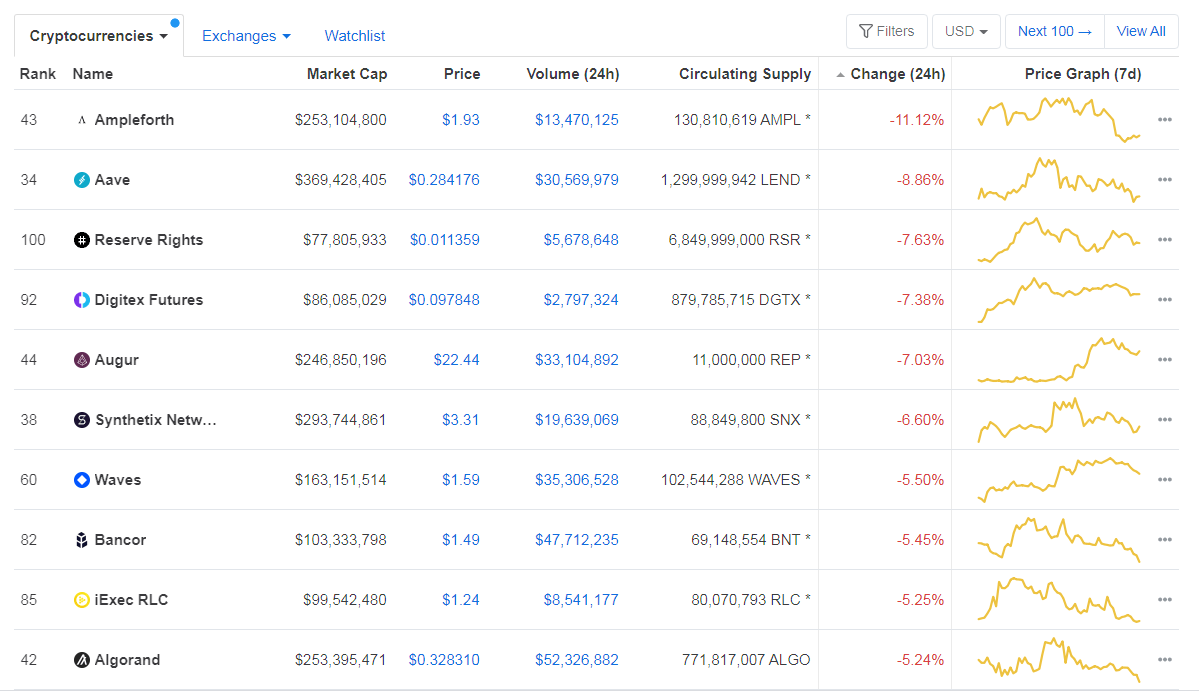
When talking about top100 cryptocurrencies, Flexacoin gained 36.8% on the day, making it the most prominent daily gainer. DigiByte (12.57%) and Maker (8.03%) also did great. On the other hand, Ampleforth has lost 11.12%, making it the most prominent daily loser. It is followed by Aave’s loss of 8.86% and Reserve Rights’ loss of 7.63%.

Top 10 24-hour Performers (Click to enlarge)

Bottom 10 24-hour Performers (Click to enlarge)

Bitcoin’s dominance level decreased slightly since we last reported, with its value currently at 62.29%. This value represents a 0.12% difference to the downside when compared to yesterday’s value.

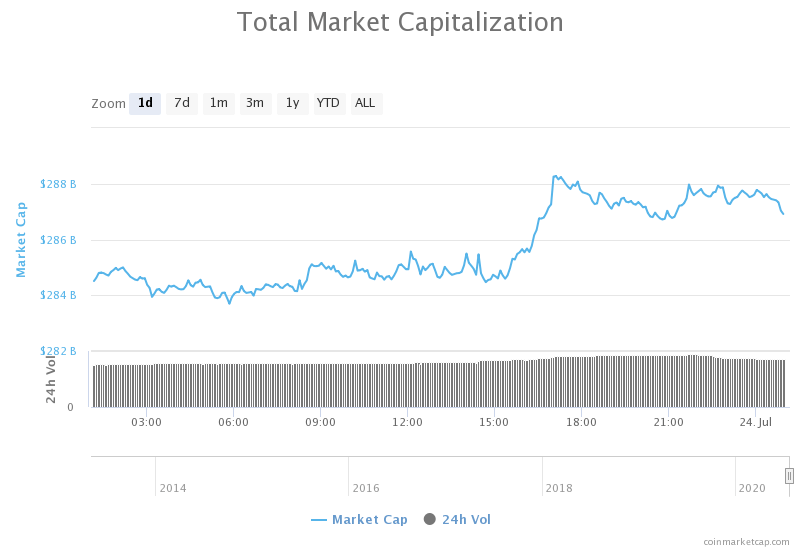
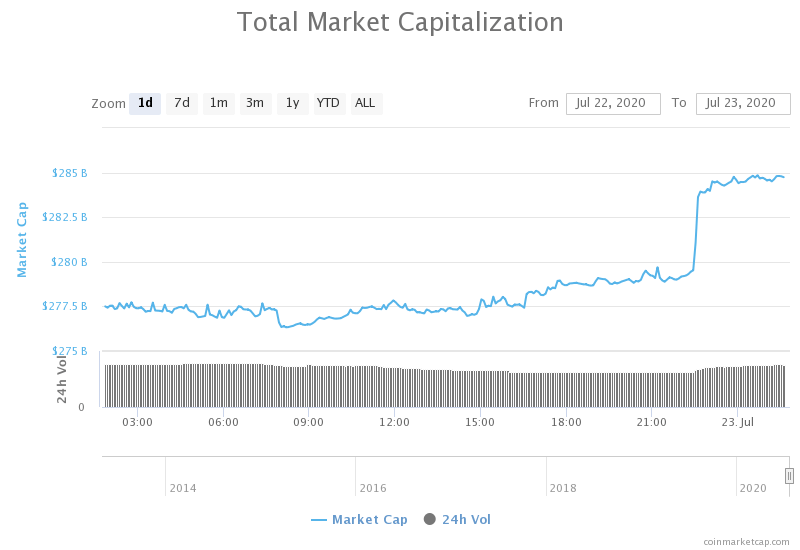
Daily Crypto Market Cap Chart

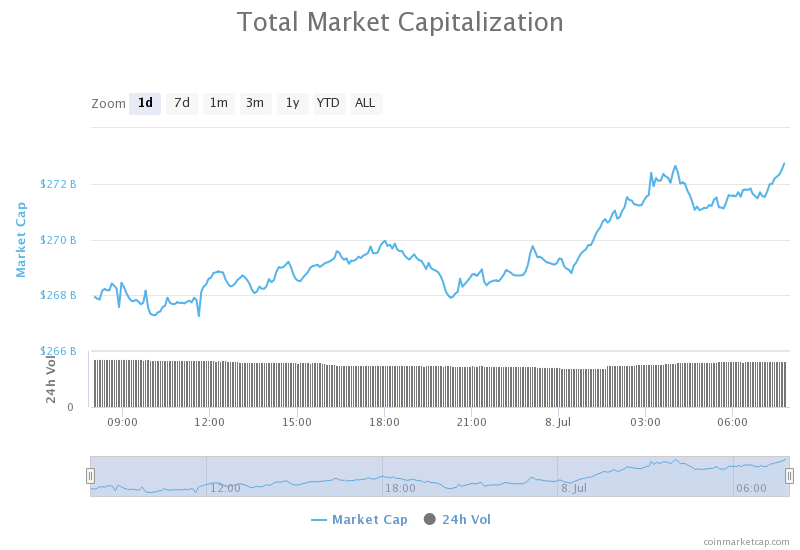
The cryptocurrency market capitalization increased when compared to when we last reported, with the market’s current value being $287.23 billion. This value represents an increase of $3.17 billion when compared to the value it had yesterday.

_______________________________________________________________________

What happened in the past 24 hours?

_______________________________________________________________________

_______________________________________________________________________

Technical analysis

_______________________________________________________________________

Bitcoin

The largest cryptocurrency by market capitalization had another great day after the Office of the Comptroller of the Currency made an announcement stating that US banks can now provide crypto custody services. Bitcoin’s price instantly skyrocketed and reached a high of $9,690, therefore passing the $9,580 resistance level. However, the fight to stay above $9,580 is still in play, and it is uncertain where Bitcoin will end up.

BTC traders should look for a trade opportunity after bitcoin establishes itself above or below $9,580.

BTC/USD 4-hour Chart

Technical factors:

  • Price is currently above its 50-period EMA and its 21-period EMA
  • Price is right below its top B.B.
  • RSI is in the overbought territory (72.10)
  • Volume Increased

Key levels to the upside          Key levels to the downside

1: $9,580                                 1: $9,251

2: $9,735                                 2: $9,120

3: $9,870                                  3: $8,980

Ethereum

Ethereum made a move towards the upside as it followed the influx of crypto bulls entering the market. The second-largest cryptocurrency by market cap established its position above $260 and hurled towards $278. However, the bullish move could not quite reach above it, and Ethereum stayed below. However, there is a high possibility that Ethereum will make another move as the range between $278 and the ascending line is closing in.

Ethereum traders should look for a trade opportunity in searching for pullbacks or after range confirmations.

ETH/USD 4-hour Chart

Technical Factors:

  • Price is above the 50-period EMA and the 21-period EMA
  • Price is slightly below the top B.B.
  • RSI severely overbought (82.89)
  • Two-candle volume spike (the rest is average)

Key levels to the upside          Key levels to the downside

1: $278                                    1: $260

2: $289                                    2: $251.4

3: $302                                     3: $240

Ripple

The third-largest cryptocurrency by market cap went past the $0.205 resistance (now support) level as bulls managed to win the fight for the level. However, XRP did not make a great leap towards the next resistance level, as Bitcoin and Ethereum did. Due to a low bullish presence, XRP failed to go past $0.21 and started moving towards the downside.

XRP traders can look for an opportunity after XRP confirms its position above $0.205, or as it falls below $0.205.

XRP/USD 4-hour Chart

Technical factors:

  • XRP in a mid-term descending trend (though it broke the trend in the short-term)
  • XRP lacks strong support levels below $0.178
  • Price above 21-period and the 50-period EMA
  • Price above the top B.B.
  • RSI is elevated (64.43)
  • Average/slightly higher than average Volume

Key levels to the upside          Key levels to the downside

1: $0.214                                  1: $0.205

2: $0.227                                  2: $0.2

3: $0.19


Categories
Forex Basic Strategies

Trading The ‘Trend Bouncer Strategy’ Using Appropriate Risk Management Techniques

Introduction

The activation of a trend can be from a political decision or an improvement in the GDP of the economy. Some other reasons include the central bank policy announcement and the discovery of new resources. Trends move like waves causing long to short term price movement in both the directions of the market.

In an uptrend, we observe that, at a certain point in time, price pullback, or retrace before continuing with the upward movement. Similarly, in a downtrend, prices retrace upward against the downward movement before continuing their way down again. This ebb-and-flow movement can be frustrating for many new traders because they are not familiar with such market moves and often get stopped out before the market starts to move in their direction later.

Experienced trend traders usually wait for a retracement before taking a trade in the direction of the major trend. This is how the trend bouncer strategy was introduced. The Bollinger band indicator provides an effective way of identifying the up and down movement of a trend.

Since this is a trend trading strategy, we will have more than one profit target. We have two specific profit levels for this strategy.

Time Frame

The trend bouncer strategy works well with the 1-hour and 4-hour time frame chart. This means each candle on the chart represents 1 hour and 4 hours of price movement, respectively.

Indicators

We will use two Bollinger bands with the following settings.

  1. Moving average 12, deviation 2
  2. Moving average 12, deviation 4

One should have a clear understanding of the Bollinger band indicator before using it for this strategy. Refer to our articles on Bollinger bands for an explanation of the indicator.

Currency Pairs

The strategy is suitable for trading in all currency pairs listed on the broker’s platform, including major, minor, and few exotic pairs. However, it is better to trade in highly liquid currency pairs.

Strategy Concept

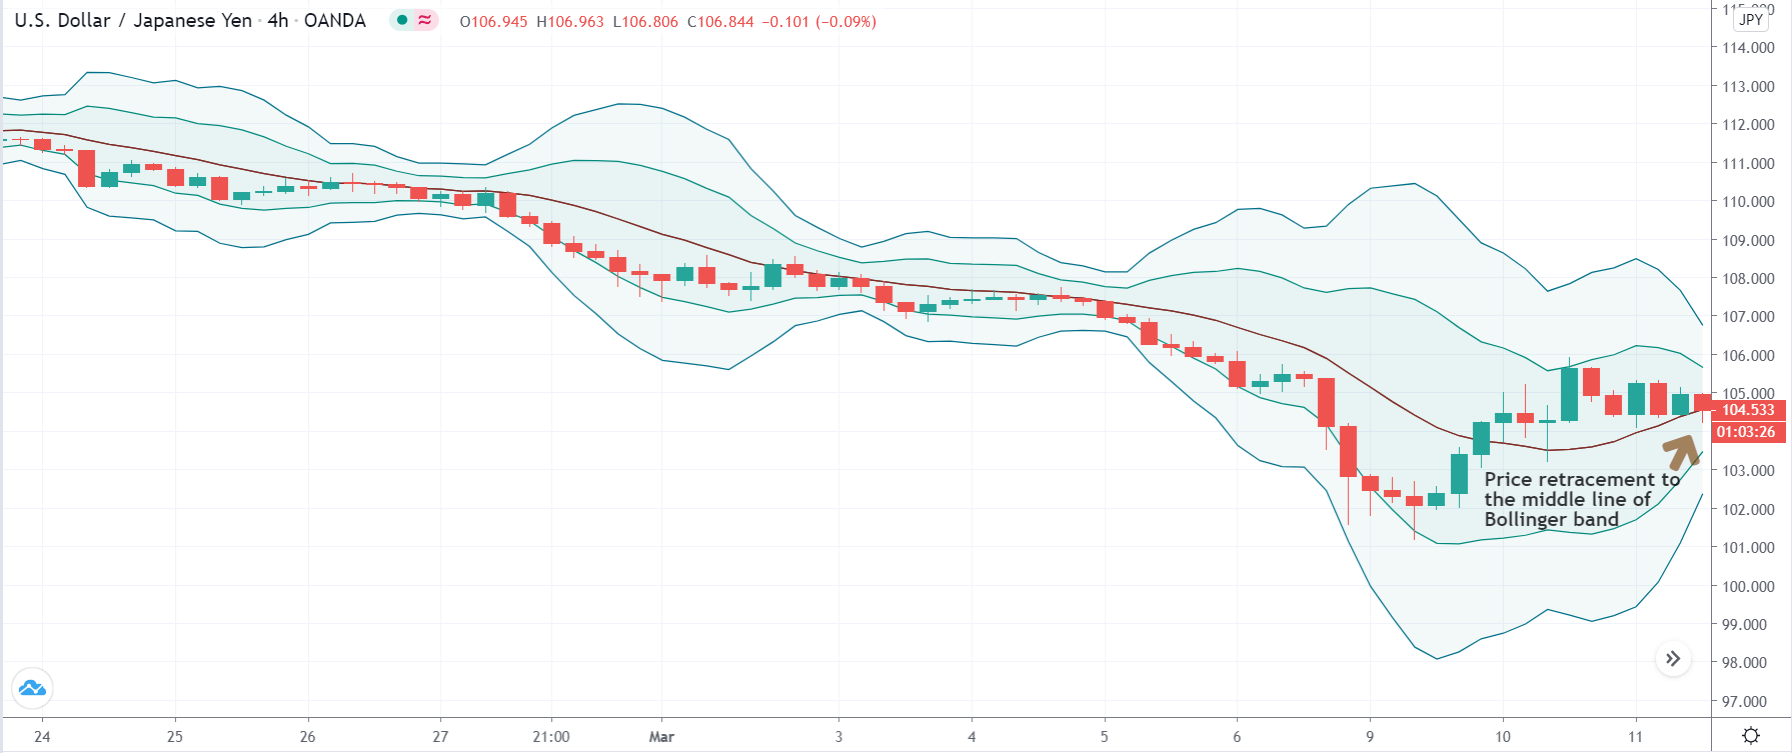
With the Bollinger band indicator’s help, we can objectively identify the ebb-and-flow movement of a trend. When the price hits the upper band of the first Bollinger band (MA 12, Dev 2), it indicates an upward movement. In this scenario, we prepare to go long in the currency pair. As prices retrace back to the centerline of the Bollinger band (MA 12), a significant retracement has occurred, and it is time to enter for a ‘long.’

Similarly, when prices hit the lower band of the Bollinger Band (MA 12, Dev 2), it indicates a momentum to the downside, and we prepare to go ‘short’ in the currency pair. As prices retrace back to the centerline of the Bollinger band (MA 12), and it is time to enter for a ‘short.’ We will exit our ‘trade’ in two places, which we explain in the coming section of the article.

Trade Setup

In order to illustrate the strategy, we have taken the example of the USD/JPY currency pair on the 4-hour time frame, where we will find a ‘long’ opportunity in the market using the strategy. Here are the steps of the trend bouncer strategy in forex.

Step 1

Firstly, open the chart of a currency pair and plot two Bollinger bands. The moving average of the first Bollinger band is 12, with a standard deviation of 2. Moving average of the second Bollinger band is also 12 but should have a standard deviation of 4. Since it is a trend trading strategy, it is best to use the strategy on the pullback of a new trend. However, it can also be used on a reversal, but the reversal should be confirmed before applying the strategy.

In this example, we see that the market has shown signs of reversal, which could extend on the upside.

Step 2

The next step is to wait for the price to hit the upper band of the first Bollinger band, in case of an uptrend. Similarly, the price should hit the lower band when trading the pullback of a downtrend. This gives us the confirmation that a trend has been established. Now, we need to wait for a retracement of this move before we can enter the trend.

In the below image, we can see that the price exactly touches the upper band of the first Bollinger band (MA 12, Dev 2), and now we will wait for a pullback to join the trend.

Step 3

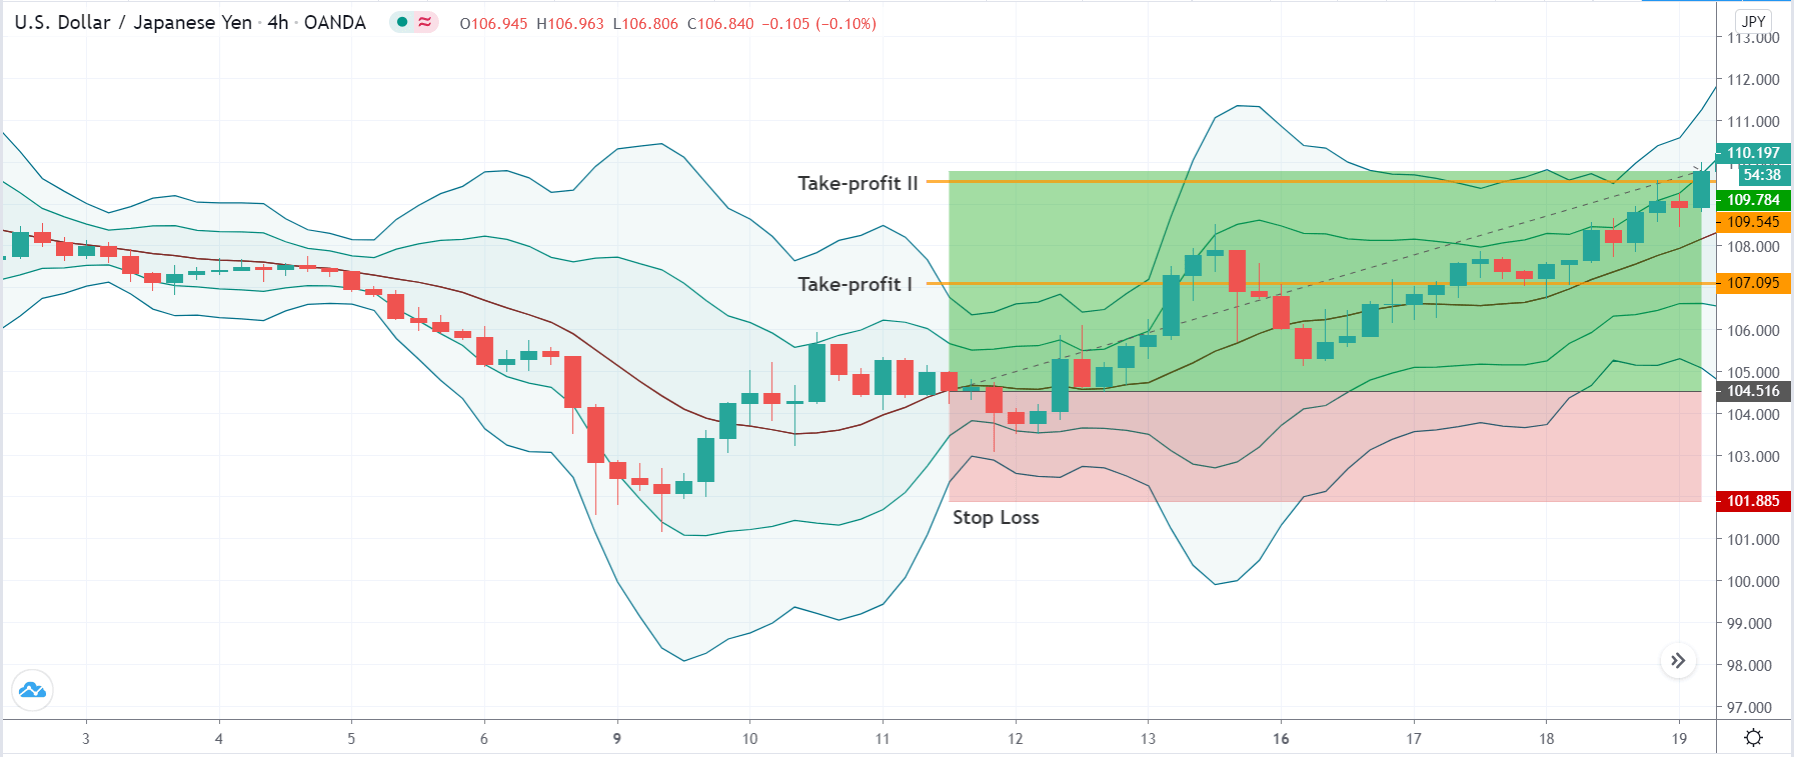
The next step is to wait for the retracement to touch the Bollinger band’s centerline. The intersection of the price and the centerline is the entry signal for the strategy. An important point to make a note here is that the pullback shouldn’t come in a single candle. This means the pullback should come in multiple candles. The longer it takes, the weaker the pullback. In such cases, the is a higher chance that the trend will continue.

In our example, we are entering for a ‘long’ as soon as the price touches the Bollinger band’s centerline. We also see that the pullback has come in 6 candles, which is desired.  

Step 4

As mentioned earlier, the strategy has two ‘take-profit‘ points. The ‘take-profit’ points are set based on the risk to reward ratio. The first one is at 1:1 RR, and the second one is at 1:2. The reason for the two ‘take-profit’ points is that since we are trading with the trend, the market has the potential to make new ‘highs’ and ‘lows.’

Strategy Roundup

Understanding the trending nature of the market helps us to identify the direction and timing of our entries. The best part of this strategy is that we bank profits in various stages. With a momentum indicator like the Bollinger band, we greatly increase the odds of being profitable in the long run.

Categories
Forex Fibonacci

Fibonacci Levels: How Much Does 50% Level Influence the Market?

In today’s lesson, we are going to demonstrate an example of a chart, in which the price makes a reversal from 50% Fibonacci level. We know if the price makes a reversal from 61.8%, it usually goes up to 161.8%; if it makes a reversal from 38.2%, it goes up to 138.2%. In both cases, traders get good risk-reward. Do you ever wonder what happens if the price makes a reversal from 50%? Let us find this out through an example.

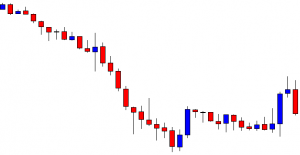
The chart shows that the price heads towards the South with good bearish momentum. It produces two bullish candles and heads towards the South. Look at the last candle. It comes out as a bullish inside bar. It makes a bullish correction. However, the sellers may wait for a bearish engulfing candle to go short in the pair.

The price has been in a bullish correction. It produces some bearish reversal candles, but it does not create any bearish momentum. The last candle comes out with a little bullish body having a long upper shadow. Let us proceed to the next chart to find out what happens next.

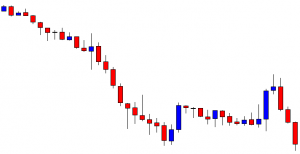
The last candle comes out as a bearish engulfing candle. It is a strong sign that the price may head towards the South again. The sellers may flip over to the minor chart to trigger entry.

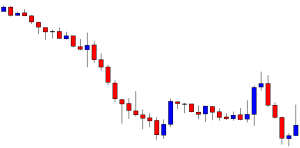
The price heads towards the South with extreme bearish pressure. The last candle comes out as a bearish Marubozu candle. It seems that the price may continue its bearish journey towards the South further. Let us find out what actually happens.

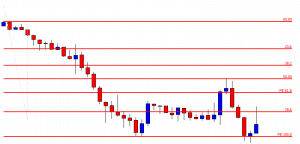
It does not continue its bearish journey. It finds its support. Upon producing a hammer, it heads towards the North with one more bullish candle. It seems that it may continue its bearish journey considering bearish engulfing candle as a reversal candle. Next, two candles come out as strong bearish candles too. What may be the reason that the price makes a bullish reversal here? Let us find this out with Fibonacci levels.

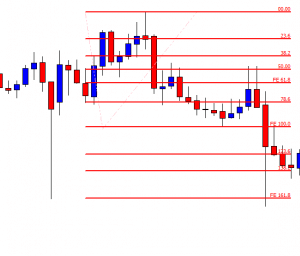
If we calculate, we find that the price makes a bearish reversal from Fibonacci 50% level. It then heads towards the South with extreme bearish momentum. However, it finds its support at the Fibonacci 100.00 level. Usually, this is what happens when the price trends from the 50% level. A question may be raised here whether we should take entry if the price trends from the 50% Fibo level. It depends on risk-reward. If it offers a good reward, then we may take an entry. In most cases, it does not offer a good reward; thus, we may skip taking those entries.


Categories
Forex Market Analysis

Daily F.X. Analysis, July 23 – Top Trade Setups In Forex – U.S. Unemployment Claims Ahead! 

The market’s fundamental side is a bit busy today as the focus on traders will stay on German GfK Consumer Climate and U.S. Unemployment Claims as these both events have the potential to drive some price action in the market. 

Economic Events to Watch Today  


EUR/USD – Daily Analysis

The EUR/USD pair was closed at 1.15701 after placing a high of 1.16012 and a low of 1.15067. Overall the movement of the EUR/USD pair remained bullish throughout the day. On Wednesday, Euro racked up gains against the U.S. dollar and tested 1.16 level on Wednesday after extending its benefits for the 4th consecutive session. The Euro rally of this week could be attributed to the E.U. Summit’s success, where European leaders managed to show consensus on massive stimulus package after four days of discussions.

The second-longest ever E.U. Summit indicated the difficulty in getting the consensus of all E.U. member countries on the E.U. recovery fund. Under the new agreed agreement, the EUR 750 Billion recovery fund will be distributed as EUR 390 Billion in grants and EUR 360 in low0interest loans.

This new agreement represented a compromise between E.U.’s wealthier nations, commonly known as Frugal Four, including Netherland, Denmark, Sweden and Austria, and poor member countries as Italy and Portugal. The former wanted most of the funds distributed as loans versus other wanted the funds as grants. In addition to the recovery fund, the E.U. members also approved a seven-year EUR 1.07 trillion budget.

Euro traders cheered after the E.U. Summit ended successfully, and the pair EUR/USD extended its gains. However, the gains were limited and were dragged by some factors in the late session. Factors included the chance of correction after a strong rally and profit-taking. The deal leaves the E.U. economy that is already suffering from a massive debt which will have to be paid back. The agreement was forced on the wealthier nations of the E.U. that are not very fond of large handouts to developing nations in the E.U. The deep division persisted in the E.U. between rich & developing countries; it has only been papered out for now.

All these factors raised concerns, and investors started getting out of EUR/USD pair in the late session, making gains of the pair short.

A statement by ECB President Christine Lagarde also helped in decreasing the daily gains of EUR/USD on Wednesday as she said that the deal between 27 member countries on 750 billion euro fund to help the bloc’s weaker economies recover from pandemic crisis, “could have been better.”

However, the EUR/USD pair’s gains were supported by the weakness in the U.S. dollar that was prompted after a possible delay in the U.S. fiscal stimulus package was reported. The Senate majority leader, Mitch McConnell, said that he was not expecting the bill for paycheck protection program to be rolled out before two weeks.

U.S. dollar also suffered because of the record-high number of coronavirus cases in the U.S. Even President Donald Trump now changed his tone and rhetoric about the pandemic and said in his speech today that the pandemic will get worse before it gets better. The death toll in the U.S. raised since records on Wednesday to 1,000 and weighed heavily on the U.S. dollar.

The broad-based U.S. dollar weakness further surged after the release of macroeconomic data. The Housing Price Index and Existing Home Sales data both fell short of expectations in May and June respectively and added further in the upward motion if EUR/USD pair.

Daily Technical Levels

Support Resistance

1.1454     1.1572

1.1379     1.1615

1.1335     1.1690

Pivot point: 1.1497

EUR/USD– Trading Tip

The EUR/USD has come out of a bullish channel, which was providing resistance at 1.1509 level. Now, this level has been violated, and it’s likely to provide support. At the moment, the EUR/USD pair is trading at 1.1590 level, and the continuation of a bullish trend can lead its prices towards 1.1605 level. Continuation of a bullish trend can lead EUR/USD towards 1.1646 level as the pair is holding above 50 EMA that supports a bullish bias. Today we should consider taking buying trades over 1.1565 level.


GBP/USD – Daily Analysis

The GBP/USD pair was closed at 1.27348 after placing a high of 1.27435 and a low of 1.26440. Overall the movement of GBP/USD pair remained bullish throughout the grounds. On Wednesday, Sterling came under pressure in the early trading session on the concerns that the U.K. will not reach a deal with the European Union. The Daily Telegraph reported that the U.K. government was working on assuming that trade deal with Europe after the end of the transition period will be conducted on World Trade Organization terms.

The U.K. Government officially reported abandoned hope of striking a Brexit trade deal with the E.U. The latest round of Brexit talks began in London this week, but expectations are that they will end in a deadlock today. Both sides were still at disagreement over fishing rights, the European Court of Justice, governance of the deal, and level playing field guarantees. The negotiations will finish on Thursday.

This weighed on Sterling heavily and the pair GBP/USD after posting gains for three consecutive days, started moving in the opposite direction in the early trading session on Wednesday. The pair GBP/USD even crossed the previous session’s lowest level on the fears of no-deal Brexit hopes.

However, the losing trend in GBP/USD pair was reversed in late session on Wednesday after the release of poor than expected data from the U.S. That further dragged the U.S. dollar and supported the GBP/USD pair. In addition to U.S. dollar weakness, the news about U.K. Prime Minister saying that the U.K. could get back to normal as early as Christmas also supported an upward trend in currency pair.

On the data front, the Housing Price Index from the U.S. for May dropped to -0.3% from the expected 0.3% and weighed on the U.S. dollar. At 19:00 GMT, the Existing Home Sales dropped to 4.72 M from the expected 4.77M and weighed on the U.S. dollar.

The U.S. dollar that was already under pressure due to the increasing number of coronavirus cases and recorded high death numbers because of the virus in the U.S. came under more pressure after the U.S. economic release data. The U.S. economy’s struggle to fight against coronavirus kept the local currency under pressure as the U.S. dollar index also fell below 95.35 level. The weak U.S. dollar also played its part in reversing the GBP/USD pair’s movement on Wednesday.

Meanwhile, Boris Johnson ordered the British army to prepare for a possible four-way crisis this winter involving a second spike in coronavirus, flu outbreak, a chaotic Brexit, and widespread flooding. This news was also behind the losses post by GBP/USD pair on Wednesday.

Daily Technical Levels

Support Resistance

1.2664     1.2782

1.2597     1.2835

1.2545     1.2901

Pivot Point: 1.2716

GBP/USD– Trading Tip

The GBPUSD is also holding in an overbought zone, and now it can drop until 1.2685 level, which marks 23.6% Fibonacci retracement below this the next support will be found around 1.2670 level. At the same time, resistance stays at 1.2730 and 1.2760. The RSI and MACD are in the bullish zone, but they form smaller histograms that suggest odds of selling bias in the market. Let’s consider taking buying trade over 1.2740 until 1.2795 level today.  


USD/JPY – Daily Analysis

The USD/JPY pair was closed at 107.155 after placing a high of 107.286 and a low of 106.707. Overall the movement of the USD/JPY pair remained bullish throughout the day.

The USD/JPY pair hovered near the top end of its daily trading range near the 107 level. Some intraday U.S. dollar rebound supported the uptick in currency pair. However, in the absence of any strong follow-through, the pair remained under pressure amid a combination of negative factors.

The U.S. dollar bulls remained defensive mode as worries about the second wave of the coronavirus infection post threat on economic recovery coupled with the delay in U.S. economic stimulus measure raised investors caution. The Republicans & Democrats have been struggling to reach consensus on a $3 trillion relief fund.

The safe-haven Japanese Yen benefited with the rising concerns about the U.S. & China dispute. The tensions between both nations increased further after the United States abruptly ordered China to close its consulate in Houston.

The U.S. state department spokesman Morgan Ortagus said that the closing consulate order was issued to protect American intellectual property and American’s secret information. China quickly responded and threatened to retaliate with firm measures, raising bars for the possible end of the US-China trade deal.

On the other hand, On Wednesday, the U.S. House of Representatives was set to vote on legislation reversing President Donald Trump’s controversial order to ban entry as immigrants from mostly Muslim-majority countries. The NO BAN Act has broad support from Democratic legislators and was likely to pass the democrat-controlled House despite strong disapproval from Republicans and the White House.

Joe Biden, former Vice President of the U.S., has vowed that if he is elected as president, he will end the Trump’s so-called Muslim travel ban on his first day in office. At 18:00 GMT, the Housing Price Index for May was released on the data front, which showed that the index fell to -0.3% from the anticipated 0.3%. At 19:00 GMT, the Existing Home Sales from the U.S. also plunged to 4.72 M from the projected 4.77M in June and weighed on the U.S. dollar. This capped additional gains in USD/JPY pair on Wednesday.

Daily Technical Levels

Support Resistance

106.22     107.39  

106.47     107.63

106.81     107.97

Pivot point: 107.05

 USD/JPY – Trading Tips

The USD/JPY bounced off to test the previously violated upward trendline of 107.250, as investors seem to sell JPY on the back of increased COVID19 cases in Japan. A bullish breakout of 107.250 level can extend buying until 107.500 level while support continues to hold around 106.930. 

The RSI and MACD suggest opposing signals; for instance, the RSI suggests bullish bias, while the MACD suggests selling. Today, let’s choppy trade session by selling below 107.250 and buying above 106.700 level. Good luck! 

Categories
Crypto Market Analysis

Daily Crypto Review, July 23 – Ethereum’s Price Skyrockets As Developers Announce Ethereum 2.0 Test Specifications

The cryptocurrency market spent yet another day shooting for the upside as Bitcoin tries to push itself closer towards $10,000. Bitcoin is currently trading for $9,358, which represents an increase of 1.72% on the day. Meanwhile, Ethereum gained a whopping 8.63% on the day, while XRP gained 2.88%.

 Daily Crypto Sector Heat Map

When talking about top100 cryptocurrencies, Terra gained 15.84% on the day, making it the most prominent daily gainer. DigiByte (8.29%) and Flexacoin (8.14%) also did great. On the other hand, Ampleforth has lost 30.52%, making it the most prominent daily loser. It is followed by iExec RLC’s loss of 12.26% and Velas’ loss of 7.15%.

Top 10 24-hour Performers (Click to enlarge)

Bottom 10 24-hour Performers (Click to enlarge)

Bitcoin’s dominance level decreased slightly since we last reported, with its value currently at 62.41%. This value represents a 0.38% difference to the downside when compared to Friday’s value.

Daily Crypto Market Cap Chart

The cryptocurrency market capitalization increased when compared to when we last reported, with the market’s current value being $284.16 billion. This value represents an increase of $6.63 billion when compared to the value it had on yesterday.

_______________________________________________________________________

What happened in the past 24 hours?

_______________________________________________________________________

_______________________________________________________________________

Technical analysis

_______________________________________________________________________

Bitcoin

The largest cryptocurrency by market capitalization had another green day where it continued strides towards $9,580, and ultimately $10,000. While the price did reach the $9,580 resistance level, it could not pass it for the time being. However, there is still a chance Bitcoin will pas (and confirm) the $9,580 level in this run, even though the overbought RSI says otherwise.

BTC traders should look for a trade opportunity after bitcoin loses bull presence or after it passes $9,580.

BTC/USD 4-hour Chart

Technical factors:

  • Price is above its 50-period EMA and its 21-period EMA
  • Price at its top B.B.
  • RSI is in the overbought territory (74.80)
  • Increased Volume

Key levels to the upside          Key levels to the downside

1: $9,580                                 1: $9,251

2: $9,735                                 2: $9,120

3: $9,870                                  3: $8,980

Ethereum

Ethereum skyrocketed today, gaining over 8% in the past 24 hours. The reason for the sudden increase in Volume (and price) is contributed to the growing DeFi field. This price is the highest Ethereum has been since February. Ethereum’s price rise got stopped by the ascending resistance level, but only for a short amount of time.

Ethereum traders should look for an opportunity in searching for pullbacks.

ETH/USD 4-hour Chart

Technical Factors:

  • Price is above the 50-period EMA and the 21-period EMA
  • Price above the top B.B.
  • RSI severely overbought (85.65)
  • One candle volume spike (rest is average)

Key levels to the upside          Key levels to the downside

1: $278                                    1: $260

2: $289                                    2: $251.4

3: $302                                     3: $240

Ripple

The third-largest cryptocurrency by market cap did well as well, with its price finally passing the $0.2 threshold after being stuck below it for almost a month. The move is currently stuck at the $0.205 resistance level, as XRP didn’t decide whether it will consolidate above or below it.

XRP traders can look for an opportunity to trade after XRP “decides” if it will end up above or below $0.205.

XRP/USD 4-hour Chart

Technical factors:

  • XRP in a mid-term descending trend (though it broke the trend in the short-term)
  • XRP lacks strong support levels below $0.178
  • Price above 21-period and the 50-period EMA
  • Price above the top B.B.
  • RSI is elevated (65.78)
  • Average/slightly higher than average Volume

Key levels to the upside          Key levels to the downside

1: $0.205                                  1: $0.2

2: $0.214                                  2: $0.19

3: $$0.227                               3: $0.178


Categories
Forex Basic Strategies

Forex Trading Using ‘Commodity Correlation Strategy – 2’

Introduction

A correlation coefficient is a number that describes the extent to which two instruments are correlated to each other. The number ranges between -1 and +1. This number moves from periods of positive correlation to periods of negative correlation. Located on one end of the scale, +1 is considered a state of the positive correlation between two instruments.

If the number is anywhere between 0 and +1, the two assets are said to move in the same direction, with a certain degree of positive correlation. On the other end of the scale, -1 is considered a state of negative correlation between two instruments. If the number is anywhere between 0 and -1, the two instruments are said to move in the opposite direction, with a certain degree of negative correlation.

The strategy we will be discussing today seeks to exploit the inverse correlation between the dollar index and Gold’s price. According to the World Gold Council, Gold tends to rise when the U.S. dollar falls. It is observed in the past that the correlation coefficient for Gold and the dollar index was between -0.6 and -0.8. This means if the dollar index is up, there is a 60% to 80% chance that gold prices would come down. In contrast, if the dollar index is down, there is a 60% to 80% chance that gold prices would come down. Let us see how the strategy works.

Time Frame

The commodity correlation strategy works well in the Daily (D) time frame. This implies that each candlestick on the chart represents the price movement of one day.

Indicators

We will be using the ATR indicator in the strategy. No other indicators are required for the strategy.

Currency Pairs

There are two charts we need to focus on in this strategy. The first one is the spot Gold or XAU/USD, and the second one is the chart of the dollar index.

Strategy Concept

The dollar index’s price action is used as a reference to initiate a trade on the XAU/USD. Technical levels of support and resistance on the dollar index chart are used to spot long and short trades on XAU/USD. If the price closes below the support on the dollar index chart, a long trade is initiated on the XAU/USD the following day. Similarly, if price closes above resistance on the dollar index chart, a short trade is initiated on the XAU/USD the following day. The risk-to-reward of this trade is 1:2. A bigger target can be achieved by allowing the trade to run its course.

The strategy is very simple for those who have a basic understanding of support and resistance. Another reason behind its popularity is that it does not involve the usage of complex indicators. The trade setups are not formed too often as we are using the daily time frame charts. Hence, a lot of patience is required for the application of the strategy.

Trade Setup

Here are the steps to implement the commodity correlation strategy. In both the instruments, we will be using the daily time frame chart only.

Step 1

The first step of the strategy is to open the dollar index’s daily time frame and mark key areas of support and resistance on the chart. If one is looking for ‘long’ trades, the identification of the support area is crucial. And if one is looking for ‘short’ trades, identification of ‘resistance’ trade is crucial. After marking out of the lines, wait for the price to breakout or breakdown. In case of a breakout, we will look for ‘short’ trades in ‘gold,’ and in case of a breakdown, we will look for ‘long’ trades in ‘gold.’

We have taken an example of a ‘long’ trade where we will be executing the steps of the strategy. In the below image, one can see that the price has broken below the long term support.

Step 2

Next, we open the chart of XAU/USD, where we look for ‘long’ or ‘short’ entry. We enter for a ‘long’ in ‘gold’ on the following day of the dollar index’s break of support. Similarly, we enter for a ‘short’ in ‘gold’ on the following day of the break of resistance in the dollar index. The entry is taken right at the opening candle on the next day.

In our case, we are entering for a ‘long’ in ‘gold’ on the following day since the price had broken the dollar index’s support on the previous day.

Step 3

In this step, we determine the take-profit and stop-loss for the strategy. The stop loss is mathematically calculated where it is placed at the amount obtained after multiplying 2 to the value of the ATR indicator on the previous day. This means if the ATR value is 30, then stop loss will be set 60 points away from the current market price (CMP). The take-profit is extended up to a point where the trade results in a risk to reward ratio of 1:2. As mentioned earlier, since this is a long-term chart, the trade has the potential to give higher returns.

We can see in the below image that trade has almost reached our ‘take-profit’ where this is the current state of the market.

Strategy Roundup

Part II of the commodity correlation strategy seeks to take advantage of the negative correlation between the dollar index and gold prices. Using the dollar index as a reference, we are activating trades on the XAU/USD pair, which is nothing but the price of spot gold.

However, the interest rates announcement by the Federal Reserve will try to keep the inverse relationship between the U.S. dollar and Gold. This strategy is ideal for traders around the world who do not have time to watch the markets on a daily basis. The strategy can also be used to look for investment opportunities in Gold.

Categories
Forex Market Analysis

Daily F.X. Analysis, July 22 – Top Trade Setups In Forex – COVID19 Boosts Safe Haven!  

On the news side, the Canadian inflation rate will be in highlights, while the U.S. will release its existing home sales, which can drop as people may not have invested in the fixed assets amid covid19. The market can exhibit retracements from yesterday’s price actions.

Economic Events to Watch Today  


EUR/USD – Daily Analysis

The EUR/USD pair was closed at 1.15283 after placing a high of 1.15395 and a low of 1.14227. Overall the movement of the EUR/USD pair remained bullish throughout the day. The EUR/USD pair extended its bullish streak for 3rd day and reached the highest level since January 2020 after crossing 1.1500 level. The pair surged based on an agreement on a massive stimulus plan and broad-based U.S. dollar weakness.

The U.S. Dollar Index traded at its lowest since March at 95.37level on Tuesday and posted the third decline in a row. It dragged the U.S. dollar, which ultimately pushed EUR/USD higher. The U.S. dollar was weak due to hopes for a potential second set of the stimulus package from Congress and a rising number of coronavirus cases in the U.S. The broad-based U.S. dollar weakness gave a push to EUR/USD pair prices.

On Europe front, the long-awaited 750 billion euros stimulus package from the European Commission was agreed on by all member countries with some changes in its initial proposal. The 750 Euros worth package included 500 billion for grants and 250 billion for loans, but it was changed to 390 Billion in grants and 360 Billion in loans on Monday.

The agreed package sends tens of billions of euros to countries hardest hit by the virus, most importantly Spain and Italy, that has suffered hardest from the pandemic against its E.U. counterparts.

After the E.U. stimulus plan was approved by its member states, the hopes for E.U. economic recovery, after being hit by the pandemic, raised and boosted risk-on market sentiment in the market. As in result, the risk-perceived Euro currency gained and pushed EUR/USD pair higher.

The risk sentiment in the market was also supported by the hopes of a potential virus vaccine. The trials of coronavirus vaccine from the U.K. and China gave positive results in early-stage tests. Both countries claimed that the vaccine developed by their companies induced an immune response in the studied participants.

The increased risk sentiment after the potential vaccine news added further in the gains of EUR/USD pair. In the absence of any macroeconomic data release on Tuesday, the pair continued to follow the good news reaction and U.S. dollar weakness and reached above 1.1500 level.

Daily Technical Levels

Support Resistance

1.1454    1.1572

1.1379    1.1615

1.1335    1.1690

Pivot point: 1.1497

EUR/USD– Trading Tip

The EUR/USD is trading within a bullish channel, providing resistance at 1.1556 level. Below this, the EUR/USD may find support at 1.1501 level. While the bullish breakout of 1.1556 can lead EUR/USD prices further higher until 1.1613 levels. The MACD and RSI are holding in a bullish zone, and these may drive bearish correction in the market today. Let’s expect selling bias below 1.1550 level today until 1.1500 and 1.1465. 


GBP/USD – Daily Analysis

The GBP/USD pair was closed at 1.27329 after placing a high of 1.27677 and a low of 1.26484. Overall the movement of GBP/USD pair remained bullish throughout the day. The GBP/USD pair extended its bullish rally and rose to its 5-week highest level since June 10 above 1.2700 level. The bullish rally in currency pair was caused by the risk sentiment and broad-based U.S. dollar weakness.

In the absence of any Brexit headline or major macroeconomic data release, the currency pair GBP/USD followed the U.S. dollar’s selling bias and continued its bullish streak for 3rd day. The continuous surge in coronavirus cases in the U.S. raised worries that the economic recovery is expected to take much longer than expected and kept the U.S. dollar bulls defensive. The sentiment was coupled with the optimism in the market about vaccine development and further decreased the safe-haven greenback.

As for the virus vaccine, the leading British drugmaker AstraZeneca and Oxford University revealed that their COVID-19 vaccine induced an immune response in its first clinical trials on humans. Two other potential vaccines, developed by Cansino Biologics in teamwork with China’s military establishment and the German drugmaker Biotech in collaboration with U.S. drugmaker Pfizer, also showed positive results early stages of the trials.

The risk sentiment was again boosted by the potential virus vaccine positive news and lead the pair GBP/USD on the upside. On the data front, the Public Sector Net Borrowing from the U.K. reached 34.8 B against the expected 34.5 B and gave almost null-effect to GBP/USD as it came as expected. On the U.S. front, there was no macroeconomic data on Tuesday.

On the virus front, the British economy has been hit hard by pandemic as last week, the Office for Budget Responsibility forecasted that the U.K. economy would contract between 10.6% -14.3%. However, the Chief Economist, Andy Haldane, maintained the optimistic tone in her speech and said that the economy had recovered about half of the fall seen in March & April after the pandemic. He added that the economy had produced a V-shaped bounce back.

These positive notes by Andy Haldane not only added in the risk sentiment but also pushed the currency pair GBP/USD gains even higher towards a 5-week top level.

Daily Technical Levels

Support Resistance

1.2664     1.2782

1.2597     1.2835

1.2545     1.2901

Pivot Point: 1.2716

GBP/USD– Trading Tip

The GBPUSD is also holding in an overbought zone, and now it can drop until 1.2685 level, which marks 23.6% Fibonacci retracement below this the next support will be found around 1.2670 level. At the same time, resistance stays at 1.2730 and 1.2760. The RSI and MACD are in the bullish zone, but they form smaller histograms that suggest odds of selling bias in the market. Let’s consider taking selling trade below 1.2740 until 1.2675 level today.  


USD/JPY – Daily Analysis

The USD/JPY pair reached under resumed bearish pressure during the U.S. session as another USD selling-wave knocked the markets. Currently, the USD/JPY pair is trading at its weakest level in 5 days at 106.85, losing 0.35% daily. The risk-on market sentiment initially got support from the fresh, upbeat report that Bloomberg has just reported about a COVID-19 vaccine developed; as the Russian Defense Ministry stating that they completed Phase 2 trials, leading First Deputy Defense Minister Ruslan Tsalikov to say the first domestic inoculation is ready for use, the article reads. Also, Japan approved the usage of dexamethasone to be included in Japan’s basket of cures to the pandemic, after earlier passing Gilead’s redelivery for its use. 

However, the vaccine news suggests that the pandemic’s cure is nearby, which favored the risk sentiment. There are approximately 16 other vaccines that are in the progress of clinical trials in Australia, France, Germany, India, South Korea, the U.K., the U.S., and China.

The European Union (E.U.) leaders agreed on late Monday for a possible €1.8 trillion ($2.06 trillion) coronavirus spending package but with some changes in the proposal that was meant to reverse the coronavirus-induced slump in the European economies.

This news boosted the risk-on market sentiment and strengthened the bid tone around riskier assets. An additional boost on the risk sentiment was derived from negotiations for a second stimulus package in the U.S. after the sustained rise in the pandemic cases from the U.S., which increased hopes of America’s Phase 4 stimulus. Consequently, the safe-haven assets are facing boosted demand to expect Japanese yen as Japan is facing an increased number of COVID19 cases. 

Daily Technical Levels

Support Resistance

106.99     107.51

106.74     107.78

106.47     108.03

Pivot point: 107.26

 USD/JPY – Trading Tips

The USD/JPY has violated the symmetric triangle pattern, supporting the pair at 107 levels. Besides, the pair has also dropped below 50 periods EMA, which is suggesting further selling bias in the USD/JPY pair. On the lower side, the USD/JPY is facing support at 106.700 level, and closing of candles above this may drive slight bullish correction until 107 and 107.100 level before it continues with its selling bias. A bearish breakout of 106.700 level can drop until 106.535 level. Good luck! 

Categories
Crypto Market Analysis

Daily Crypto Review, July 22 – Ethereum Passes Bitcoin and Becomes the Most Used Blockchain

The cryptocurrency market spent yet another day shooting for the upside as Bitcoin tries to push itself closer towards $10,000. Bitcoin is currently trading for $9,358, which represents an increase of 1.75% on the day. Meanwhile, Ethereum gained 3.06% on the day, while XRP gained 1.35%.

 Daily Crypto Sector Heat Map

When talking about top100 cryptocurrencies, Augur gained 22.19% on the day, making it the most prominent daily gainer. Elrond (20.66%) and Blockstack (16%) also did great. On the other hand, Synthetix Network has lost 10.2%, making it the most prominent daily loser. It is followed by Reserve Rights’ loss of 6.28% and Algorand’s loss of 4.53%.

Top 10 24-hour Performers (Click to enlarge)

Bottom 10 24-hour Performers (Click to enlarge)

Bitcoin’s dominance level stayed at the same level since we last reported, with its value currently at 62.79%. This value represents a 0.04% difference to the downside when compared to Friday’s value.

Daily Crypto Market Cap Chart

The cryptocurrency market capitalization increased slightly when compared to when we last reported, with the market’s current value being $277.53 billion. This value represents an increase of $1.98 billion when compared to the value it had on yesterday.

_______________________________________________________________________

What happened in the past 24 hours?

_______________________________________________________________________

_______________________________________________________________________

Technical analysis

_______________________________________________________________________

Bitcoin

The largest cryptocurrency by market capitalization spent the day furthering yesterday’s strides towards $9,580, and ultimately $10,000. However, with volume fading as well as RSI stepping into the overbought territory, it is unlikely that Bitcoin will pass $9,580 without consolidation.

BTC traders should look for a trade opportunity after bitcoin loses bull presence or after it passes $9,580.

BTC/USD 4-hour Chart

Technical factors:

  • Price is above its 50-period EMA and its 21-period EMA
  • Price at its top B.B.
  • RSI is overextended (69.87)
  • Increased volume (descending)

Key levels to the upside          Key levels to the downside

1: $9,580                                 1: $9,251

2: $9,735                                 2: $9,120

3: $9,870                                  3: $8,980

Ethereum

Ethereum continued on its path towards the upside in the past 24 hours. The second-largest cryptocurrency by market cap established its presence above $240 and pushed towards $251. However, the bullish presence is fading, and Ethereum is losing its momentum towards the upside.

Ethereum traders should look for an opportunity in searching for pullbacks.

ETH/USD 4-hour Chart

Technical Factors:

  • Price is above the 50-period EMA and the 21-period EMA
  • Price at the top B.B.
  • RSI elevated (68.02)
  • One candle volume spike (rest is average)

Key levels to the upside          Key levels to the downside

1: $251.4                                 1: $240

2: $260                                    2: $228

3: $278                                     3: $225.4

Ripple

The third-largest cryptocurrency by market cap spent another day trading in a sideways manner. Its moves are bound by the $0.19 support level and (more often) $0.2 resistance level. XRP’s next move will most likely be determined by Bitcoin’s move (in any direction).

XRP traders can look for an opportunity to trade when the currency breaks $0.2 with increased Volume, or falls down below $0.19 with increased volume.

XRP/USD 4-hour Chart

Technical factors:

  • XRP in a mid-term descending trend (though it broke the trend in the short-term)
  • XRP lacks strong support levels below $0.178
  • Price above 21-period and the 50-period EMA
  • Price slightly above middle B.B. (20-period SMA)
  • RSI is neutral (53.58)
  • Average/slightly low Volume

Key levels to the upside          Key levels to the downside

1: $0.2                                      1: $0.19

2: $0.205                                  2: $0.178

3: $0.214


Categories
Crypto Market Analysis

Daily Crypto Review, July 21 – Mastercard Bullish On Bitcoin; Paxos To Become Paypal’s Bitcoin Custodian

The cryptocurrency market spent the day trying to reach past its immediate resistance levels. Bitcoin is currently trading for $9,330, which represents an increase of 1.31% on the day. Meanwhile, Ethereum gained 1.26% on the day, while XRP gained 0.28%.

 Daily Crypto Sector Heat Map

When talking about top100 cryptocurrencies, Augur gained 11.37% on the day, making it the most prominent daily gainer. Waves (11.36%) and DxChain Token (6.32%) also did great. On the other hand, Band Protocol has lost 19.85%, making it the most prominent daily loser. It is followed by Kava’s loss of 17.94% and iExec RLC’s loss of 16.09%.

Top 10 24-hour Performers (Click to enlarge)

Bottom 10 24-hour Performers (Click to enlarge)

Bitcoin’s dominance level increased slightly since we last reported, with its value currently at 62.83%. This value represents a 0.33% difference to the upside when compared to Friday’s value.

Daily Crypto Market Cap Chart

The cryptocurrency market capitalization increased slightly when compared to when we last reported, with the market’s current value being $275.58 billion. This value represents an increase of $2.89 billion when compared to the value it had on yesterday.

_______________________________________________________________________

What happened in the past 24 hours?

_______________________________________________________________________

_______________________________________________________________________

Technical analysis

_______________________________________________________________________

Bitcoin

The largest cryptocurrency by market capitalization spent the day contesting and poking the $9,251 resistance level until a large spike caused by an increase in bear presence brought its price to $9,380. Bitcoin passed $9,251 instantly, but could not reach $9,580. It is currently trying to stabilize at around $9,330.

BTC traders should look for a trade opportunity after bitcoin establishes its position.

BTC/USD 4-hour Chart

Technical factors:

  • Price is above its 50-period EMA and its 21-period EMA
  • Price above the top B.B.
  • RSI is overextended (69.86)
  • Increased volume

Key levels to the upside          Key levels to the downside

1: $9,580                                 1: $9,251

2: $9,735                                 2: $9,120

3: $9,870                                  3: $8,980

Ethereum

Ethereum accompanied Bitcoin on its slow path towards the upside, but with its own little twist. While the upswings were much more explosive, the downswings were slower and less volatile. Ethereum reached past $240, which is where it is consolidating at the moment. The start of the explosive move got supported by the influx of buyers as well as the 21-period and 50-period moving averages, which were right at the bottom of the candle.

Ethereum traders should look for an opportunity when Ethereum confirms that it will stay above $240, or when it fails to do so.

ETH/USD 4-hour Chart

Technical Factors:

  • Price is above the 50-period EMA and the 21-period EMA
  • Price above the top B.B.
  • RSI elevated (67.20)
  • Slightly increased volume

Key levels to the upside          Key levels to the downside

1: $240                                    1: $228

2: $251.4                                 2: $225.4

3: $260                                     3: $218

Ripple

The third-largest cryptocurrency by market cap, unlike Bitcoin and Ethereum, had a pretty slow day. XRP hovered around the $0.2 resistance level, but could not break it. The inability to break this level might come from the steady low volume XRP has. For the time being, XRP will continue to trade stuck in a range, bound by support level of $0.19 and resistance level of $0.2.

XRP traders can look for an opportunity to trade when the currency breaks $0.2 with increased volume, or falls down towards $0.19 with increased volume.

XRP/USD 4-hour Chart

Technical factors:

  • XRP in a mid-term descending trend (though it broke the trend in the short-term)
  • XRP lacks strong support levels below $0.178
  • Price above 21-period and the 50-period EMA
  • Price between the middle B.B. (20-period SMA) and the top B.B.
  • RSI is neutral (56.72)
  • Volume average

Key levels to the upside          Key levels to the downside

1: $0.2                                      1: $0.19

2: $0.205                                  2: $0.178

3: $0.214


Categories
Forex Basic Strategies

The Most Simple Yet Effective Scalping Strategies You Must Know In 2020

Introduction

The Forex market consists of are several types of traders. They are broadly classified based on the time frame traded. For example, swing traders use time frames like 1H or 4H, while positional traders analyze the 1D or 1W time frame. Similarly, there are “scalpers” who trade the 1-minute and the 5-minute time frames. Note that scalpers are different from day traders, as they do not consider the 15-minute or 1H time frame for their analysis.

What is Scalping in Forex?

Scalping is a type of real-time technical analysis, where traders make several trades in a small period. Scalping involves entering and exiting from the market within a few minutes and moving on with the subsequent trade. This type of traders aims for tiny profits rather than home runs.

Scalping is usually most popular among forex traders than those trading stocks and commodities. This is because the FX market is the most liquid and volatile market. Thus, traders make use of this benefit by extracting 10-20 from the market in a short time. Since scalping involves making of few pips on a trade, they are traded with big volumes.

Getting Started with Scalping in Forex

Now that we know the basics of Forex scalping, let’s discuss the analytical side of it and then understand some powerful scalping strategies as well.

Timeframe

The ideal time frame to the scalp is either 1-min or 5-mins. However, some traders get an outlook from the 15-min time frame too.

Take Profit and Stop Loss

The most critical part of scalping is to have a take profit and stop loss on every trade. Since you will be using the 1-min time frame, the profit or loss level should be within 5-10 pips. It is risky to keep the TP and SL greater than ten pips when the analysis is based on the 1-min time frame.

Volatility and Liquid

Volatility and liquidity are other vital points of consideration before scalping any market. Forex is indeed the best market to the scalp as it offers the needed volatility and liquidity. However, you must select the right pair to trade because not all currency pairs offer enough market volatility. There are pairs that barely move on the 1-min time frame, and thus traders must end up waiting several minutes on a trade. Hence, it is recommended to trade only major pairs and a few minor pairs.

Spread

Spread plays a major role in scalping as it greatly affects the P/L of the trade. For instance, let’s say the spread on EUR/USD is two pips. The pip value of the pair is $10. If one lot is traded, the expense of the trade would be $20. Now, if a trade yields you four pips, then the net profit would be $40 – $20 = $20. We infer that 50% of the profit gets deducted as a fee. Thus, scalpers always have an eye on the spread.

Forex Scalping Strategies

Scalping strategies are unlike strategies used by swing and positional traders. Scalpers do not wait for several confirmations before entering a trade. Instead, they aggressively enter after a couple of confirmations. Here are some scalping strategies made for non-conservative traders.

Scalping using Moving Average

This scalping strategy, two moving averages – the 5-period MA and the 20-period MA is used applied onto the 3-min charts. Let us understand the strategy with a couple of examples.

Firstly, we must have a look at the overall direction of the market. Note that this strategy is only for trending markets, not ranging markets. In the below chart of AUD/USD on the 3-minute time frame, we see that the market is in a clear downtrend.

Secondly, the five period MA must be below the 20-period MA. When the price action tries to break above five-period MA (yet below the 20-period MA) and falls back into MA, we can open short positions.

The stop-loss must be placed above the high of the candle that broke below five-period MA. One must exit the trade when the price reaches up to 1:1 risk-reward or at a profit of 5 pips.

Scalping using price-volume charts

Indicators are not a must to scalp in forex. Scalping is possible solely using price action concepts. And here is a strategy for the same. This strategy works on a small time frame used on any currency pair. However, we’ll be sticking to the 3-min time frame for all the strategies.

Below is the chart of AUD/USD on the 3-minute time frame. According to the strategy, we can take entry when the market breakthrough a range strongly with high volume. In the below example, we see that the price fiercely broke above the range with high volume too. This is a confirmation that the big buyer is back into the market. Thus, we can take a long position right after the candle closes above the range.

The stop-loss can be placed below the low of the candle that broke through the range and places the take profit at a 1RR ratio. Note that, the stop-loss and take profit must exceed above 10-12 pips.

Scalping using Support and Resistance

Scalping at support and resistance levels is the most popular technique in the forex industry. Yet most traders apply it illogically. Even though the textbook says to buy at the support and sell at resistance, it cannot be applied practically incorporated in the market as there is a pinch of psychology in it. According to this strategy, one must buy at support and sell at resistance only if there is a false breakout prior to it.

Consider the below chart of NZD/CAD on the 3-minute time frame. The gray ray represents the support level. It is seen that the price broke below the support thrice and came right back above it. Thus, one can enter when the price is holding above the resistance post the fake-out. The stop-loss and take-profit for all such trades much be a maximum of 5 pips.

We hope you found these strategies interesting and helpful. If you are an aggressive trader, do try them out and let us know the results in the comment section below.

Categories
Forex Market Analysis

NZDJPY Shows Long-Term Bullish Signals

The NZDJPY cross continues its recovery after the massive sell-off that made it lose over 18.6% in the first quarter of the year when it plummeted until 59.49. From this yearly low, NZDJPY raised near to 17.9% to date.

Market Sentiment Overview

The market sentiment of NZDJPY exposed in its weekly chart reveals the market action showing bullish reversal signals after surpass and consolidate above the 26-week moving average. 

At the same time, we observe that, last week, the price closed in the upper zone of its 52-week range. This context leads us to conclude that the market participants might continue pushing the price higher.

The following figure shows the net positioning of the New Zealand Dollar and Japanese Yen futures. In the chart, we observe that institutional participants maintain a bullish pressure on the kiwi. At the same time, big participants on the Japanese currency continue having a net positioning to the long-side under 50% of the 52-week high and low range.

Consequently, considering the market sentiment on both the NZ Dollar and Japanese Yen futures, we could expect more upsides for the NZDJPY cross.

The Elliott Wave Outlook

The long-term Elliott wave perspective of the NZDJPY cross illustrated in the following chart shows a bullish structural series in progress. The upward sequence began on March 18th when the cross found fresh buyers at 59.49, where the price action developed a V-turn bounce movement.

Once the NZDJPY cross started its bounce movement, the price began to develop an impulsive sequence subdivided into five internal segments of the Minuette degree identified in blue. According to the Elliott wave theory, the structural series drawn by the NZDJPY cross corresponds to a leading diagonal formation, which tends to appear in the first wave of an impulsive sequence or corrective structure. This pattern usually follows an internal structure subdivided into 3-3-3-3-3 or 5-3-5-3-5.

After the leading diagonal completion on April 30th, high at 66.103, when the cross ended its wave ((i)) of Minute degree identified in black, the price made a higher low at 63.46 on May 17th corresponding to its wave ((ii)). Once this second wave ended, the NZDJPY cross began to rally on the wave ((iii)), which remains incomplete.

Currently, the NZDJPY cross advances in its wave (iv) of Minuette degree in blue of the incomplete third wave of Minute degree.

Our outlook for the NZDJPY cross, based on the Elliott Wave perspective, anticipates a limited decline into five waves, which could complete the wave (iv) of the Minuette degree in blue. Once this sequence ends, the market action should find fresh buyers expecting to continue pushing the cross higher. This way, the NZDJPY cross should complete the wave ((iii)) of Minute degree.

Considering that the next movement will correspond to wave ((iv)) of Minute degree, we could expect the price moving mostly sideways before starts climbing on its fifth wave of Minute degree.

Finally, considering that the market sentiment reveals an increasing bullish momentum for the New Zealand Dollar, and the Japanese Yen exposes a neutral bias that seems to start turning bearish, long-term, NZDJPY could experience more rallies.

In consequence, our preferred positioning for the NZDJPY cross still remains on the bullish side. Any time the price drops could be an opportunity to join the long side.

Categories
Forex Price Action

Price Action Trading: Factors that you should Remember

In today’s lesson, we are going to demonstrate an example of a chart offering an entry upon producing a bullish reversal candle followed by a breakout. The chart produces a bullish reversal candle earlier too, but that did not make the price move towards the North. We’ll try to find out why it does not head towards the North at its first attempt. Let us get started.

The chart shows that the price heads towards the North upon producing an ABC pattern. We may notice that we have four significant points here, such A, B, C, and D. The price most likely reacts at these levels again. Let us proceed to the next chart.

The price heads towards the South at a moderate pace. The last candle comes out as a bearish Marubozu candle. It seems that the price may remain bearish for a while. Let us proceed to the next chart to find out what happens next.

The chart produces an inverted hammer. It is a sign of a bullish reversal. However, considering point B, the price makes a bearish breakout at the level. Thus, the pair may continue its bearish move. The sellers may look for short opportunities in the minor chart.

The next candle does not make a bearish breakout. It comes out as a bullish candle. The last candle comes out as a Doji candle. Ideally, neither the bull nor the bear dominates in the pair. The sellers are to wait for the price to make a breakout at the last swing low. The buyers are to wait for the price to make a bullish reversal candle closing above consolidation resistance. Let us see what the price does.

The price comes down. It produces a bullish engulfing candle. Some sellers may have to encounter a loss here. Upon creating the bullish engulfing candle, the price heads towards the North with good bullish momentum. Now a few questions may be raised here.

  1. Why does the price not head towards the North but comes down?
  2. Why does the price not continue its bearish move but produces a bullish engulfing candle?
  3. Why does not price head towards the North at its second attempt?


Have a look at the chart below with some drawings in it.

At its first attempt, the price does not make a breakout at the level of resistance drawn. The price reacts at this level several times. Thus, this is a crucial level, which is to be counted by the buyers before taking long entries. The price finds its resistance here and makes a bearish move. It finds its support at the drawn line, where the price reacts to it earlier as well. The reversal candle comes out as a Doji candle, and the chart takes four candles to make the breakout. This is one of the reasons that the price does not continue its bearish move.

At its last attempt, it produces a bullish engulfing candle, the candle is produced at a key level, the price makes a breakout at the last swing low, and the breakout candle comes out as a strong bullish candle. These factors attract more buyers and make the price move towards the North with good bullish momentum. We need to remember such factors every time we take entries as far as price action trading is concerned.

Categories
Forex Market Analysis

Daily F.X. Analysis, July 20 – Top Trade Setups In Forex – E.U. Economic Summit Ahead

On the news front, the market seems to be muted due to a lack of high impact on economic events. The Eurozone’s German Buba report and current account data will remain in focus, but I highly doubt if this will drive any market movement.

Economic Events to Watch Today 


EUR/USD – Daily Analysis

The EUR/USD pair was closed at 1.14248 after placing a high of 1.14434 and a low of 1.13750. Overall the movement of the EUR/USD pair remained bullish throughout the day. The EUR/USD pair edged higher on Friday and rose near 1.145 level on the increased hopes for further progress on the European Union’s 750 billion euros recovery fund. As a result, the EUR/USD pair traders became optimistic that Eurozone’s economy could be on the road to recovery.

Traders expected some progress in the 2-day Summit even though the German Chancellor Angela Merkel was downbeat about a consensus between E.U. leaders over the recovery fund. She said that the differences were too large to predict that a positive result will reach this time. She added that though it would be desirable, we must be realistic. She said that to reach an agreement, a great deal of willingness to compromise was required, demanding very difficult negotiations.

Meanwhile, on the data front, at 14:00 GMT, the Final CPI from the Eurozone for the year in June came in line with the expectations of 0.3%. The Final Core CPI for the year also remained as expected, 0.8% from the Eurozone. From the U.S. side, the TIC Long-Term Purchases for May came in as 127 B compared to April’s -130.8B. At, 17:30 GMT, the Building Permits in June dropped to 1.24M against the expected 1.30M and weighed on the U.S. dollar. The Housing Starts, however, came in line with the expectations in June as 1.19M.

At 19:00 GMT, the Prelim UoM Consumer Sentiment for July dropped to 73.2 against the expected 79.0 and weighed on the U.S. dollar. The Prelim UoM Inflation Expectations in July increased to 3.1% from the previous 3.0%. The poor than expected data from the United States on Friday pushed the already rising EUR/USD pair.

Further weighing on the greenback was the escalating tensions between U.S. & China trade relations after US Trump’s administration was considering a blanket ban on all Chinese Communist Party members to the U.S.. This news made the markets cautious, and investors became seriously concerned over the economic recovery.

The greenback came under pressure due to its struggles against fighting the pandemic and coping with the increased number of unemployment claims that came in as 1.3M in recent weeks. The weak U.S. dollar helped the EUR/USD pair to gain its strength in the market.

Daily Technical Levels

Support Resistance

1.1355     1.1428

1.1326     1.1472

1.1282     1.1501

Pivot point: 1.1399

EUR/USD– Trading Tip

The EUR/USD has tested the double top resistance at 1.1446 level, and now it’s finding support at 1.1410 level. The upward trendline on the hourly chart is also likely to support the pair around 1.1375 level. Chances of bullish trend seem solid today; therefore, the bullish breakout of 1.1445 level can lead the EUR/USD prices towards 1.1490 level.


GBP/USD – Daily Analysis

The GBP/USD pair was closed at 1.25645 after placing a high of 1.25742 and a low of 1.25115. Overall the movement of GBP/USD pair remained bullish throughout the day. On Friday, Bank of England’s Governor, Andrew Bailey, said that Britain’s economy was starting to recover from its coronavirus lockdown induced crisis, but some job-intense sectors remained weak. He also added that the long-term outlook for the country remained unclear as well.

During a webinar organized by the central bank, Bailey said that the visible activity return could mean the beginning of the recovery. There were signs of activity returning in the Housing market and new car sales but not in hospitality and entertainment that employ many people.

The Governor also warned against the optimism of his chief economist Andy Haldane who has declared that there would be a V-shaped recovery in the economy post Coronavirus. He said that rebound would depend on people’s return to work and go shopping and dining out. He also said that recovery would depend on the progress of medical companies in finding cures and vaccines for the COVID-19 and also the impact of the second wave.

Earlier this week, Britain’s budget forecasters said that economy could shrink by more than 14% this year if there will be lasting damages by the pandemic. The British Pound continued to grind sideways on Friday as Governor Bailey provided gloomy comments, and traders became cautious. However, the U.S. dollar’s weakness kept the GBP/USD pair on the higher track.

On Friday, at 17:30 GMT, the Building Permits from the U.S. for May dropped to 1.24M against the expected 1.30M and weighed on the U.S. dollar. The Housing Starts, however, came in line with the expectations of 1.19M. At 19:00 GMT, the Prelim UoM Consumer Sentiment was dropped to 73.2 from the expected 79.0 and weighed on the U.S. dollar. 

Due to poor than expected macroeconomic data, the weak U.S. dollar caused a surge in GBP/USD prices on Friday in the absence of any macroeconomic data from Britain. Meanwhile, on Friday, the U.K.’s 38 Billion Dollars’ worth Stimulus package announced by Rishi Sunak came under fire after the opposition Labour Party called on the country’s spending watchdog to open an investigation over it.

Daily Technical Levels

Support Resistance

1.2505     1.2610

1.2459     1.2671

1.2399     1.2716

Pivot Point: 1.2565

GBP/USD– Trading Tip

The GBP/USD is trading with a selling bias at 1.2550 level, holding right above the support level of 1.2548 level. Downward breakout of 1.2548 level can extend selling until 1.2506 and 1.2479 support. The MACD and RSI both are supporting a bearish bias. On the upper side, the GBP/USD can face resistance at 1.2575 and 1.2595. Let’s consider taking Sell trades below 1.2533 level today. 


USD/JPY – Daily Analysis

The USD/JPY pair was closed at 107.021 after placing a high of 107.359 and 106.938. Overall the movement of the USD/JPY pair remained bearish throughout the day. The U.S. dollar was marginally lower in early European trade hours on Friday as traders looked past the resurgence in coronavirus cases worldwide and the need for a safe-haven. The U.S. dollar’s focus was on the likelihood of more fiscal stimulus ahead rather than on its safe-haven status.

According to Johns Hopkins University data, the number of coronavirus cases rose to 13.84 million globally. On Thursday, the United States reported almost 77,000 new cases that raised economic recovery concerns.

The sharp increase in the central bank’s stimulus packages to protect economies from the consequences of the pandemic has weighed on the U.S. dollar. The U.S. reported 71,558 new COVID-19 cases on Saturday and made its second day in a row to post more than 70,000 cases, according to Johns Hopkins University. The average daily rise in cases improved by 18.34% as compared to one week ago.

The increasing number of cases urged U.S. lawmakers to partially shut the economies again to control the spread of the virus. This raised fears that economies will suffer from the re-imposed restrictions and calls for more stimulus packages emerged. The need for more stimulus packages from the U.S. and across the globe to save the economy for coronavirus induced lockdowns weighed on the U.S. dollar that dragged the USD/JPY pair on Friday.

On the flip side, there were also reports on the weekend that Trump’s administration was trying to block billions of dollars in an upcoming coronavirus relief fund that was allocated to states for conducting tests and contact tracing. Reports also suggested that Trump’s administration was also blocking the amount of 5 billion that was to be allotted to the Centers for Disease Control and Prevention.

Furthermore, the New York Federal Reserve President John Williams said that it could take a few years for the U.S. economy to recover from the pandemic, and it was not yet the time to think about rising interest rates. The long-lasting decreased interest rates also weighed on the U.S. dollar and kept the pair USD/JPY prices under pressure.

On the data front, at17:30 GMT, the Building Permits fell to 1.24M from the expected 1.30M and weighed on the U.S. dollar. The TIC Long-Term Purchases for May came in as 127 B in comparison to April’s -130.8B. At 19:00 GMT, The Prelim UoM Consumer Sentiment for July also declined to 73.2 from the anticipated 79.0 and weighed on the U.S. dollar. The Prelim UoM Inflation Expectations in July rose to 3.1% from the previous 3.0%.

The poor than expected macroeconomic data from the U.S. weighed on the USD/JPY pair and dragged the pair below the 107 level.

Daily Technical Levels

Support Resistance

106.93    107.51

106.59    107.75

106.35    108.09

Pivot Point: 107

 USD/JPY – Trading Tips

The USD/JPY is consolidating in a broad trading range of 107.400 – 107, while the overall bias seems neutral at 107.191. The USD/JPY pair has recently crossed over 50 EMA, which extended resistance at 107 level, including now the same level will work as a support. The bearish breakout of the 107 level can extend the selling trend until 106.580. 

Simultaneously, the bullish breakout of the 107.400 level can extend the buying trend until 107.600. The MACD and RSI support bearish bias, and we may take a selling trade below 107 and buying above the same level today. Good luck! 

Categories
Crypto Market Analysis

Daily Crypto Review, July 20 – Twitter Hacker Possibly a BitMEX Trader; Hack Will End Up Being Good for Bitcoin?

The cryptocurrency market spent the weekend recovering from the descending trend that brought Bitcoin to $9,000. Bitcoin is currently trading for $9,200, which represents an increase of 0.15% on the day. Meanwhile, Ethereum gained 1.51% on the day, while XRP lost 0.49%.

 Daily Crypto Sector Heat Map

When talking about top100 cryptocurrencies, Band Protocol gained 39.23% on the day, making it by far the most prominent daily gainer. Terra (30.63%) and Swipe (28.00%) also did great. On the other hand, Flexacoin has lost 31.16%, making it the most prominent daily loser. It is followed by iExec RLC’s loss of 11.66% and Reserve Rights’ loss of 10.95%.

Top 10 24-hour Performers (Click to enlarge)

Bottom 10 24-hour Performers (Click to enlarge)

Bitcoin’s dominance level increased slightly since we last reported, with its value currently at 62.5%. This value represents a 0.33% difference to the downside when compared to Friday’s value.

Daily Crypto Market Cap Chart

The cryptocurrency market capitalization increased slightly when compared to when we last reported, with the market’s current value being $272.69 billion. This value represents an increase of $3 billion when compared to the value it had on Friday.

_______________________________________________________________________

What happened in the past 24 hours?

_______________________________________________________________________

_______________________________________________________________________

Technical analysis

_______________________________________________________________________

Bitcoin

The largest cryptocurrency by market capitalization spent the weekend slowly regaining its value after the drop to $9,000. The slow rise in price was stopped by an influx of buyers, which tried to bring the price above the $9,251 resistance level but failed to do so as the sheer volume was too low. Bitcoin is now consolidating at around the $9,200 level.

BTC traders should look for a trade opportunity in the range that is bound by the nearest support and resistance levels.

BTC/USD 4-hour Chart

Technical factors:

  • Price is above its 50-period EMA and its 21-period EMA
  • Price right below the top B.B.
  • RSI is neutral (53.87)
  • Lower than average volume

Key levels to the upside          Key levels to the downside

1: $9,251                                 1: $9,120

2: $9,580                                 2: $8,980

3: $9,735                                  3: $8,820

Ethereum

While Ethereum accompanied Bitcoin on its slow path towards the upside, it did so with much lower volume and volatility. The most recent hours brought a sharp increase in price, which attempted to bring the price above $240, but the push was unsuccessful. Ethereum is now consolidating right below the $240 level.

Ethereum traders should look for an opportunity when Ethereum starts moving down, or when it reacts to the next support/resistance level.

ETH/USD 4-hour Chart

Technical Factors:

  • Price is above the 50-period EMA and the 21-period EMA
  • Price above the top B.B.
  • RSI elevated (63.03)
  • Average/slightly increased volume

Key levels to the upside          Key levels to the downside

1: $240                                    1: $228

2: $251.4                                 2: $225.4

3: $260                                     3: $218

Ripple

The third-largest cryptocurrency by market cap moved along its range-bound upwards path towards $0.2. While the move got stopped at $0.2, XRP managed to gain some value over the course of the weekend. Volume remained stable throughout this slow increase, which is a great indicator.

XRP traders can look for an opportunity to trade when the currency breaks $0.2 with increased volume, or falls down towards $0.19 towards increased volume.

XRP/USD 4-hour Chart

Technical factors:

  • XRP in a mid-term descending trend (though it broke the trend in the short-term)
  • XRP lacks strong support levels below $0.178
  • Price above 21-period and the 50-period EMA
  • Price between the middle B.B. (20-period SMA) and the top B.B.
  • RSI is neutral (55.26)
  • Volume average

Key levels to the upside          Key levels to the downside

1: $0.2                                      1: $0.19

2: $0.205                                  2: $0.178

3: $0.214


Categories
Forex Market Analysis

GBPCHF Could Start a New Bullish Cycle

The GBPCHF cross during this year underperforms over 7.3% YTD easing over 940 pips. Although the market action made it decline until lower levels since 2011, the cross could experience a recovery that could propel it toward fresh highs.

The Market Sentiment

The GBPCHF cross in its weekly chart illustrates the price moving below 50% of the 52-week high and low range, which reveals that market participants maintain its bearish bias for the cross. At the same time, we distinguish the 26-week moving average acting as dynamic resistance at 1.19298.

On the previous chart, we distinguish a bearish sequence that began in mid-November 2016 when the price topped at 1.5572 and looked ended on last March 19th, when the cross found support at 1.1113. Once the GBPCHF dropped until the lowest level since August 2011, the price bounced, finding a short-term resistance in the zone of 1.2212, which coincides with 50% of the 52-week high and low range.

During the previous two weeks until now, the market action moved it down, finding resistance at the 26-week moving average, which leads us to conclude that bear traders still maintains the market control.

Consequently, while the GBPCHF keeps moving below the 26-week moving average, the market sentiment bias continues being bearish.

The Elliott Wave Outlook

The GBPCHF cross under the long-term Elliott wave perspective exposes a broadening diagonal formation that began on April 17th, 2018, when the price found fresh sellers at 1.3855.

In the previous figure, we distinguish an expanding sequence that follows a 3-3-3-3-3 internal subdivision of Minuette degree identified in blue. This structural series could have its fifth wave of Minute degree (labeled in black) concluded on March 19th, when the price found support at 1.1113.

After the market participants took down the price to the lowest level of the year, the pair reacted mostly upward, developing a bounce in a five-wave sequence. This bullish movement may correspond to a wave (i) of the Minuette degree, which ended last June 05th, from where the GBPCHF cross started to develop an incomplete corrective corresponding to wave (ii) in blue, which remains in progress.

On the other hand, the RSI oscillator, which moves below the level-60, confirms the short-term bearish bias that GBPCHF maintains.

However, considering that the price action advances in an incomplete bearish wave (ii), our preferred near-term positioning remains neutral until the current bearish structure completion expects the potential rally corresponding to wave (iii), which could raise until 1.28 area.

Categories
Forex Daily Topic Forex Fibonacci

Tweezer Top/Tweezer Bottom and Fibonacci Levels

In today’s lesson, we are going to demonstrate an example of a Tweezer Top forming at a significant Fibonacci level. We’ll find out the impact of a tweezer top in the chart. Let us get started.

The chart shows that the price has a rejection at a level of resistance twice. At the second bounce, it produces a doji candle. A doji candle is not considered a strong reversal candle. If the next candle comes out as a bearish engulfing candle, the sellers may keep their eyes in the pair to look for short opportunities.

The next candle comes out as a bearish engulfing candle. It makes a strong statement that the bear has taken control. Double top support, along with a bearish engulfing candle, usually attracts more sellers to look for short opportunities.

The price consolidates and finds its resistance. The chart produces a bearish engulfing candle. The sellers may go short right after the last candle closes with 1R. Let us proceed to the next chart to find out how the entry goes.

The chart shows that the price heads towards the South with good bearish momentum. It hits 1R at a moderate pace. It finds its support again and heads towards the North to make a bullish correction. Look at the last two candles. The first candle comes out as a bullish candle, and the last candle comes out as a bearish candle, both having a long upper shadow. The combination of these two candles is called “Tweezer Top”. Tweezer Top is considered one of the strongest bearish reversal patterns. Those two upper shadows suggest that the price has a strong rejection at the level of resistance. The bearish body of the last candle suggests that the bear may take over. Another point we may consider whether it is produced at a significant level or not. By drawing the Fibonacci extension, we may find this out. Let us draw Fibonacci extension and find out how far the price travels towards.

We see that Tweezer Top is formed right at the 61.8% level. Usually, the 61.8% level drives the price towards the level of 161.8%. This is what happens here, as well. The price hits the level of 161.8% within the next candle.

We know how handy drawing Fibonacci level can be in trading. Especially, 61.8% and 38.2% level plays a very significant role in driving the price with good momentum. If we get a strong reversal pattern such as Tweezer Top or Tweezer Bottom, it adds more pressure. Thus, the traders do not have to wait long to achieve their target.

Categories
Forex Basic Strategies

What Is ‘Gawk the Talk Strategy’ & How To Trade It Effectively?

Introduction

Trading the news is one of the best ways to make a profit within a short span of time. This is because volatility is highest during these announcements, and traders look to capitalize on these news releases by analyzing the data and the price movement.

The strategy we will be discussing is amazingly suitable for traders who love the volatility associated with news announcements. One of the biggest advantages of trading the news is accessibility. Today, we can access the news outcome as soon as they are released without any delay.

Many free websites report economic events every day. The one which is widely used by investors and traders is a site called forexfactory.com. This site is user-friendly, and the economic calendar allows us to view the upcoming news at a glance.

The news that has red-coded flags linked to them have the greatest impact on the currency pairs. We will prefer to trade the news events with the highest impact as opposed to the orange or yellow ones because the possibility of large movement is high. Today’s strategy is also based on such news releases.

As the actual and forecasted figures are extremely important for this strategy, we will be watching these numbers very carefully. That is the reason why this strategy is named as ‘Gawk The Talk.’

The top news announcements that cause the greatest moves in the forex market are Interest Rates, Gross Domestic Product (GDP), Employment Change, Trade Balance, Consumer Price Index, Purchasing Manufacturing Index (PMI), and Retail Sales.

Time Frame

Gawk the Talk strategy works well with the 15 minutes and 1-hour candlestick charts. This means each candle on the chart represents 15 minutes or 60 minutes of price movement.

Indicators

No indicators need to be used in this strategy.

Currency Pairs         

The strategy is suitable for trading all currency pairs; however, it is healthier to trade in currency pairs such as the EUR/USD, USD/JPY, GBP/USD, USD/CHF, USD/CAD, AUD/USD, and NZD/USD.

Strategy Concept

The idea of the strategy is simple, where we long on the affected currency when the actual figures are greater than forecasted figures by a minimum factor of 15%. To lower the risk, we focus on news events that are related to the U.S. economy. Which means we will be primarily trading the U.S. dollar either as the base currency or counter currency.

We will use the 15 minutes time frame chart to determine our entries since the news is usually released in 15-minutes intervals. Some common times of news releases include 8 A.M., 9:15 A.M., 10:30 P.M., and 11:45 P.M.

For example, if the Reserve Bank of Australia raises the interest rates, we will go long in AUD/USD. And if the interest rates are lowered, we take a short trade in the pair. For news announcements that affect the United States, it is best to trade in the two most liquid pairs: EUR/USD and USD/JPY. Remember, we go long in the pair if the news outcome is positive for the base currency and ‘short’ in pairs wherever the currency is a counter currency.

Trade Setup

To illustrate the strategy, we will use the Unemployment rate news announcement, which was released on the 2nd of July 2020. As mentioned earlier, we will be dealing with currency pairs involving the U.S. dollar only. Hence, depending on the news data, we will take a suitable position in the EUR/USD pair.

Step 1:

The first t step is to go to the forex factory website and look for news releases that have the highest impact on the currency. The easiest way to find such events is to look for the red-colored flags on the left-hand side of the event. We will not consider any other news results other than red ones.

In this example, we will be analyzing the Unemployment rate data of the United States.

Step 2:

An important point most traders miss out while trading using this strategy is that they trade just based on the numbers. They forget to look at the charts from a technical angle. In this step, we mark the key technical levels on the chart based on the current state of the price.

As we can see in the below image, just before the news announcement, the price is at the resistance area. This means a ‘short’ trade is considered to be less risky than a ‘long’ trade at this point.

Step 3:

This step is the crux of the strategy. In this step, we take an appropriate position in the currency based on the news’s outcome. If the actual numbers are higher than the forecasted numbers, we will go long in that currency. Likewise, if the actual numbers are lesser than the forecasted numbers, we will go ‘short’ in that currency. The difference between actual and forecasted figures should be a minimum of 15% before we can take enter the market.

In our example, we see that the Unemployment rate was better than what was predicted by economists. This means the data is positive for the U.S. dollar, and thus we can expect bullishness in the currency. Therefore, we take a ‘short’ position in EUR/USD soon after the market falls from the resistance.

Step 4:

Stop loss for the strategy is placed just above the news candle, which is technically the right spot for placing the stop loss. The take-profit is also placed at a key technical level, which could be a hurdle for the trade. The risk to reward ratio of trades placed using this strategy is a minimum of 1.5. However, one should book partial profits at the halfway mark in order to lock in some profits.

In this case, the price moved about 60% of our take-profit, where would take some profits off. However, more often than not, the price does hit the take-profit levels.

Strategy Roundup

The strategy we discussed today is mostly for the aggressive traders and people with large risk appetite. In this strategy, we are essentially taking advantage of the volatility and the fundamental factors that affect the currencies. The trade management rules of the strategy ensure that we don’t make huge losses even if the trade does not work completely in our favor. Cheers.

Categories
Forex Market Analysis

Daily F.X. Analysis, July 17 – Top Trade Setups In Forex – Final CPI Under Spotlight! 

On the news front, the market may not offer high impact events, but the focus will stay on the UK BOE Gov Bailey Speaks and Prelim UoM Consumer Sentiment from the United States. Since it’s Friday, we can experience sharp movements in the market, especially during U.S. sessions.

Economic Events to Watch Today 


EUR/USD – Daily Analysis

The EUR/USD pair was closed at 1.13818 after placing a high of 1.14415 and a low of 1.13703. The EUR/USD pair broke its four-day bullish streak on Thursday and started posting losses on the back of European Central Bank’s monetary policy meeting decision combined with the broad-based U.S. dollar strength.

The ECB left its rates unchanged on Thursday; however, the latest recovery plan’s decision worth 750 billion euros was still pending. The European Central Bank held its refinancing operations at 0% and pledged to roll out more stimulus if the Eurozone’s economic recovery slowed materially. However, the meeting was seen as something of a non-event by the analysts, who think that the E.U. Summit will overshadow the ECB announcement.

A two-day European Summit will occur on Friday, and the ECB Governor called for fiscal support just a day ahead of the Summit. E.U. leaders will discuss the European Commission proposal’s distribution pattern for a 750 billion euros recovery plan. This plan was introduced to help some of the economic bloc’s worst-hit members.

According to Christine Lagarde, European leaders must show quick agreement on an ambitious package. Member states disagree on how the recovery package should be funded, and to show an agreement on it, all 27 E.U. member states need to back this package.

However, Italy has backed the proposal before the E.U. Summit to guide other member states to follow its footsteps. However, the Netherland, Sweden, Denmark, and Austria, known as “Frugal Four,” insist that these funds should be released as loans rather than as grants. In its last videoconference meeting, the E.U. leaders failed to reach an agreement, and the decision was forwarded to the next meeting. On Friday, the leaders will again discuss the distribution of the recovery plan, but this time, a face-to-face meeting will occur for the first time since the outbreak of the pandemic.

Chances for securing a deal between 27 member states are low, and traders are cautious. The French Final CPI for June rose to 0.1% against the expected -0.1% and supported Euro on the data front. At 13:02 GMT, the Italian Trade Balance showed a surplus of 5.58 B in May compared to 1.13 B of deficit in April.

At 14:00 GMT, the Trade Balance was up by 8.0 B against the forecasted 5.0B and supported Euro. Despite better than expected economic data from Europe, the EUR/USD pair declined on Thursday amid a strong U.S. dollar. From the U.S. side, the Core Retail Sales and Retail Sales were increased to 7.3% and 7.5% respectively against the expected 5.0% in June and supported the U.S. dollar. The strong U.S. dollar weighed on EUR/USD pair, and the pair started to decline.

Furthermore, the risk-off market sentiment after President Trump announced that he had signed the Hong Kong Autonomy Act. Moreover, the Justice Secretary from the US, William Barr, urged American tech firms not to do business with the Chinese government to reduce competitiveness.

These reports raised fears for the potential cold war between U.S. & China and raised risk-off market sentiment that supported EUR/USD pair declines on Thursday.


Daily Technical Levels

Support Resistance

1.1357     1.1429

1.1328     1.1472

1.1285     1.1501

Pivot point: 1.1400

EUR/USD– Trading Tip

The EUR/USD is taking a bearish turn after placing a high around 1.1439 level. The closing of candles below 1.1439 level has extended selling until the 1.1370 level. Closing of candles above 1.1370 level can drive buying in the EUR/USD pair, but in case, the bearish breakout occurs, we may see EUR/USD prices dropping towards 1.1335 level. Let’s keep an eye on 1.1370 as below this; we can capture a quick sell position.


GBP/USD – Daily Analysis

The GBP/USD pair was closed at 1.25538 after placing a high of 1.26144 and a low of 1.25197. Overall the movement of GBP/USD pair remained bearish throughout the day. The pair extended its previous day’s retracement slide and remained depressed through the first half of the day amid modest U.S. dollar strength. On Thursday, the U.S. dollar was strong across the board due to its safe-haven status as the risk-appetite was fading away. The latest optimism about the potential coronavirus vaccine turned out to be short-lived, and concerns about US-China relations raised the safe-haven appeal.

The strong greenback due to safe-haven demand, the GBP/USD pair came under pressure and dropped in early sessions. However, it showed that the downside movement of the GBP/USD pair was limited after the U.S. Treasury bond yields started to decline. This, combined with the better than expected economic data, gave a push to GBP/USD pair.

At 11:00 GMT, the Claimant Count Change from June was released by the Office for National Statistics on Thursday, which showed that the number of people applied for jobless benefits fell by 28.1K against the expectations +250K. The Claimant count rates eased to 7.3% vs. the previous 7.8%.

The U.K.’s official Jobless rate was also decreased to 3.9% against the expected 4.2% and provided strength to the British Pound. The Average Earnings Index, excluding bonuses, arrived at -0.3% in May against the expected -0.4% and supported British Pound. The steady GBP helped the pair GBP/USD to limit its daily losses on Thursday.

On the U.S. front, the Core Retail Sales and Retail Sales were improved to 7.3% and 7.5% respectively against the projected 5.0% in June and supported the U.S. dollar. The strong U.S. dollar weighed on GBP/USD pair, and the pair extended its losses.

Meanwhile, the Bank of England data revealed that lending has dried up quickly in the second quarter of the year. The Bank’s credit conditions survey showed that mortgages, loans, and credit card lending all dropped in the second quarter, and the further decline was still expected.

On Brexit front, the politicians from across the U.K., including Northern Ireland’s first and deputy first ministers, will discuss Brexit via videoconference. Arlene Foster and Michelle O’Neill will join the video conference chaired by Cabinet Minister Michael Gove.

The representatives from Welsh and Scottish governments and NI Secretary Brandon Lewis will also be heard by the joint ministerial committee. The discussion will focus on NI protocol and the Brexit transition period. Meanwhile, the second meeting with a joint EU & UK committee focused on how to implement the Northern Ireland part of the Brexit deal is also due.

Furthermore, the Brexit talks between U.K.’s chief negotiator David Frost and Michel Barnier continued in Brussels on Thursday to secure a trade deal. Several outstanding issues like fishing, trade, and governance, remain undercard even after four fruitless talks. U.K. is set to leave the controversial Common Fisheries Policy (CFP) and take back control of its U.K. waters, and the E.U. has shown its willingness to compromise to gain access to the U.K. waters.


Daily Technical Levels

Support Resistance

1.2505     1.2610

1.2459     1.2671

1.2399     1.2716

Pivot Point: 1.2565

GBP/USD– Trading Tip

The GBP/USD is trading with a selling bias at 1.2550 level, holding right above the support level of 1.2548 level. Downward breakout of 1.2548 level can extend selling until 1.2506 and 1.2479 support. The MACD and RSI both are supporting a bearish bias. On the upper side, the GBP/USD can face resistance at 1.2575 and 1.2595. Let’s consider taking Sell trades below 1.2533 level today. 


USD/JPY – Daily Analysis

The USD/JPY pair was closed at 107.275 after placing a high of 107.398 and a low of 106.830. Overall the movement of the USD/JPY pair remained bullish throughout the day. The USD/JPY pair moved sideways in the first half of the trading session on Thursday; however, it started to gain traction in the early hours of American trading session, and after that, it advanced to a daily high of 107.398.

The optimism related to potential coronavirus vaccine was short-lived and faded away quickly and dragged risk sentiment. The decreased risk appetite in the market weighed on Japanese Yen and pushed the USD/JPY pair on the above track.

Earlier in the day, the U.S. Census Bureau’s data showed that Retail Sales in June increased by 7.5% and beat the market expectations of 5.0%. The Core Retail Sales data in June also surged to 7.3% from the expected 5.0% and supported the U.S. dollar. The Philly Fed Manufacturing Index rose to 24.1 against the expected 20.0 and supported the U.S. dollar. The strong U.S. dollar pushed the USD/JPY prices in the upward direction on Thursday.

However, the gains in currency pair were capped by the poor than expected jobless claims data from the U.S. Last week, the Unemployment claims made by the Americans rose to 1300K from the 1250K of expectations and weighed on the U.S. dollar.

1.3M jobless people filed for jobless benefits last week, and it showed that the U.S. economy still has a large portion to fill in the jobs department. At 19:00 GMT, the Business Inventories from the United States came in as expected -2.3%. The NAHB Housing Market Index from the United States rose to 72 from the expected 60 and supported the U.S. dollar and added further in USD/JPY pair gains.

Furthermore, the New York President of Federal Reserve said on Thursday that the Fed’s emergency lending facilities have helped to ease credit markets after the pandemic disrupted them. He said that relatively low usage of the program indicated that markets were functioning well.

The statement that low-take up of emergency lending facilities was a sign of success from John Williams gave additional strength to the already strong U.S. dollar, and hence, USD/JPY pair further increased.

On US-China front, the US Justice Secretary, William Barr blamed Hollywood and U.S. tech firms of cooperating with the Chinese government to work there. Barr said that such actions could damage the liberal world order.

Speaking at Gerald Ford Presidential Museum, he advised U.S. firms not to give up their secrets and values to China by coming under pressure because it will make the U.S. vulnerable and dependent on China for certain goods.

This was the latest criticism of China by the White House and other U.S. officials. He warned that the working of Disney & American corporations with Beijing would weaken competitiveness and prosperity. He urged U.S. firms to challenge Chinese demands and said that if an individual company cannot take a stand, then firms should combine.

Furthermore, the U.S. imposed visa restrictions on certain employees of Huawei Tech Company. In response to this, the Chinese technology giant Huawei on Thursday, stated regret over the U.S. move to restrict its employees from visiting the U.S. Huawei called the U.S.’s latest move as “an unfair and arbitrary action.”


Daily Technical Levels

Support Resistance

106.93     107.51

106.59     107.75

106.35     108.09

Pivot Point: 107

 USD/JPY – Trading Tips

The USD/JPY is consolidating in a wide trading range of 107.400 – 107, while the overall bias seems neutral at 107.191. Recently the USD/JPY pair has crossed over 50 EMA, which extended resistance at 107 level, including now the same level will work as a support. The bearish breakout of the 107 level can extend the selling trend until 106.580. At the same time, the bullish breakout of the 107.400 level can extend the buying trend until 107.600. The MACD and RSI support bearish bias, and we may take a selling trade below 107 and buying above the same level today. Good luck! 

Categories
Crypto Market Analysis

Daily Crypto Review, July 17 – People Call For a Bitcoin Ban After the Twitter Hack; What Will Actually Happen?

The cryptocurrency market spent most of its day recovering from the move that brought Bitcoin to $9,000. Bitcoin is currently trading for $9,119, which represents a decrease of 0.85% on the day. Meanwhile, Ethereum lost 1.88% on the day, while XRP lost 1.37%.

 Daily Crypto Sector Heat Map

When talking about top100 cryptocurrencies, Ampleforth gained 28.69% on the day, making it by far the most prominent daily gainer. Algorand (24.57%) and Aurora (16.45%) also did great. On the other hand, Divi has lost 8.28%, making it the most prominent daily loser. It is followed by Nexo’s loss of 7.12% and Elrond’s loss of 6.55%.


Top 10 24-hour Performers (Click to enlarge)

Bottom 10 24-hour Performers (Click to enlarge)

Bitcoin’s dominance level increased slightly since we last reported, with its value currently at 62.83%. This value represents a 0.11% difference to the upside when compared to yesterday’s value.

Daily Crypto Market Cap Chart

The cryptocurrency market capitalization decreased slightly when compared to when we last reported, with the market’s current value being $269.69 billion. This value represents a decrease of $2.84 billion when compared to the value it had yesterday.

_______________________________________________________________________

What happened in the past 24 hours?

_______________________________________________________________________

_______________________________________________________________________

Technical analysis

_______________________________________________________________________

Bitcoin

The largest cryptocurrency by market capitalization started the day quite rough, with its price dropping to $9,000 as bearish influence and volume increased. However, the price quickly retraced back above the $9,120 level, where it is currently consolidating. However, Bitcoin is approaching the descending trend line, which fell under during its drop to $9,000, which may cause the price to move once again.

BTC traders should look for a trade opportunity when Bitcoin reacts to the descending trend line.

BTC/USD 4-hour Chart

Technical factors:

  • Price is below its 50-period EMA and its 21-period EMA
  • Price right below the middle B.B. (20-period SMA)
  • RSI neutral/low (40.42)
  • Average volume (came back from increased)

Key levels to the upside          Key levels to the downside

1: $9,251                                 1: $9,120

2: $9,580                                 2: $8,980

3: $9,735                                  3: $8,820

Ethereum

Ethereum started the day by being rejected from the $240 level, therefore triggering a fall towards the $228 level. The second-largest cryptocurrency by market capitalization managed to stop its price drop at $229 and slowly start to recover and consolidate. While the price is on a slow path towards the upside, the ultimate short-term direction of Ethereum is unknown.

Ethereum traders should look for an opportunity when Ethereum approaches the $240 level.

ETH/USD 4-hour Chart

Technical Factors:

  • Price below the 50-period EMA and the 21-period EMA
  • Price below the middle B.B. (20-period SMA)
  • RSI neutral (40.36)
  • Average volume (back from greatly increased)

Key levels to the upside          Key levels to the downside

1: $240                                    1: $228

2: $251.4                                 2: $225.4

3: $260                                     3: $218

Ripple

The third-largest cryptocurrency by market cap was no exception to how the price action played out. The day started with a sharp price drop, which brought the price below $0.19. However, XRP quickly recovered and got on a slow upward trend, which may be stopped by the moving averages above it. If, however, XRP manages to pass them, the $0.2 resistance level will still pose a big problem.

XRP traders can look for an opportunity to trade when the volume increases, and the trend becomes clear enough, as the low volume and volatility are certainly not ideal for trading at the moment.

XRP/USD 4-hour Chart

Technical factors:

  • XRP in a mid-term descending trend (though it broke the trend in the short-term)
  • XRP lacks strong support levels below $0.178
  • Price below 21-period and the 50-period EMA
  • Price right under the middle B.B. (20-period SMA)
  • RSI is neutral (43.89)
  • Volume lower than average

Key levels to the upside          Key levels to the downside

1: $0.2                                      1: $0.19

2: $0.205                                  2: $0.178

3: $0.214


Categories
Forex Market Analysis

Silver: Sustained Bullish Pressure

Silver advances over 3.14% this week, increasing its gains by the sixth week in a row. The precious metal could visit the $20 per ounce, the highest level since September 2016.

The Market Sentiment

Silver, in its weekly chart, reveals that institutional participants hold a bullish sentiment. The speculative positioning identified in green, taken from the Commitment of Traders report (CoT) issued each Friday by the CFTC, confirms that institutional traders hold its long positions expecting new higher highs. At the same time, both the COT report as the price action doesn’t reveal signals of a reversal trend.

On the other hand, the strong upward momentum that can be seen on the precious metal is driving it near its 52-week high located at $19.65 per ounce. This market context leads us to expect an increment in volatility on the metal sector, which could hit new highs.

The following daily chart reveals that Silver volume remains above the 250 trading sessions average. The relatively high volume level along with its price advancement confirms that the current uptrend remains intact.

The Elliott Wave Outlook

The Elliott wave perspective sketched in the following 12-hour chart exposes an incomplete bullish five-wave sequence, which could drive prices to exceed the $20 per ounce.

The precious metal started an incomplete bullish sequence last March 18th when the price found fresh buyers at $11.64 per ounce. Once Silver started its recovery, the market participants sent it into an internal five-wave rally to $15.84 per ounce, where it completed wave ((a)) of Minute degree labeled in black.

In the previous chart, we observe a narrow-range corrective sequence developed into a three-wave structural series that failed to achieve a new lower low. This market context warns us about the potential strong upward momentum that could drive Silver toward new higher highs. In fact, the price action reveals an incomplete fifth wave of Minuette degree labeled in blue, which remains in progress.

The RSI oscillator reveals a bearish divergence, which leads us to confirm that Silver currently moves in its fifth wave, possibly belonging to a wave ((c)) of Minute degree. In an alternative count sequence, Silver could be advancing in a wave ((3)) of Minute degree.

Considering the Elliott Wave rule of extensions, the current fifth wave could be the extended wave of the entire upward sequence. On the other hand, the Fibonacci projection suggests that the precious metal could extend its gains in a range from $20.04 to $21.66 per ounce.

Finally, as long as the price action continues advancing above the $18.47, the short-term trend will continue being led by the bull traders.

Categories
Forex Market Analysis

Daily F.X. Analysis, July 16 – Top Trade Setups In Forex – ECB Policy Decision In Highlights! 

It’s going to be a busy day from a fundamental’s viewpoint, as the European Central Bank is due to release its rate decision. Furthermore, the U.S. will be releasing a series of high impact events like Retail Sales m/m, Philly Fed Manufacturing Index, and Unemployment Claims. Although ECB isn’t expected to hike the interest rate, the ECB press conference can drive movement in the EUR/USD pair today. Besides, U.S. events are expected to perform adversely for the U.S. dollar.

Economic Events to Watch Today 


EUR/USD – Daily Analysis

The EUR/USD pair was closed at 1.14114 after placing a high of 1.14473 and a low of 1.13900. Overall the tendency of the EUR/USD pair remained bullish throughout the day. The EUR/USD pair continued its bullish streak for the 4th consecutive day and reached a multi-month high level near 1.14500 level on Wednesday. The pair rose to the highest level since March 10 in the early Wednesday trading session. Nevertheless, it did not live there for long and was pulled back in the American session.

The upward movement of EUR/USD towards a multi-month high level was caused by the European Central Bank’s monetary policy meeting on Thursday. The lower move was triggered by a recovery of the U.S. dollar across the board. The U.S. Dollar Index (DXY) erased most of its losses and recovered from weekly lows, rose above 96.00 level, and gave strength to the U.S. dollar that eventually weighed on EUR/USD pair.

The risk sentiment was also up in the market by the optimism about the potential vaccine for COVID-19. As a result, the Dow Jones was up by 0.80%, and NASDAQ was up by 0.35%.

On the data front, the U.S. dollar was strong due to better than expected data released on Wednesday. The Empire State Manufacturing Index was published at 17:30 GMT, which showed that the index rose to 17.2 from the expectations of 10.0 in July and supported the U.S. dollar.

The Import Prices from the U.S. in June rose to 1.4% from the expected 1.0% and supported the U.S. dollar. The Industrial Production data was announced at 18:15 GMT, which showed an expansion in activity by 5.4% against the forecasted 4.5% and supported the U.S. dollar. The Capacity Utilization rate from the U.S. Roseto 68.6%from the predicted 67.9% and supported the U.S. dollar. It eventually weighed on EUR/USD pair in late trading session and forced it to lose its early daily gains.

In Europe, the key event ahead is the European Central Bank meeting on Thursday, in its last meeting, ECB made its biggest decision in June and left the rates unchanged and provided no stance to change further. The focus will be on the press conference, where traders will keep an eye on Lagarde’s speech to find fresh clues about the economic outlook. However, the tone is estimated to be positive, and Lagarde’s firm commitment to the full 1.35tn euros PEPP is also expected.


Daily Technical Levels

Support Resistance

1.1384    1.1445

1.1356    1.1480

1.1322    1.1507

Pivot point: 1.1418

EUR/USD– Trading Tip

The EUR/USD is taking a bearish turn after placing a high around 1.1446 level. The closing of candles below 1.1446 level can extend selling until the 1.1390 level. Closing of candles above 1.1390 level can drive buying in the EUR/USD pair, but in case, the bearish breakout occurs, we may see EUR/USD prices dropping towards 1.1365 level.


GBP/USD – Daily Analysis

The GBP/USD pair was closed at 1.25879 after placing a high of 1.26467 and a low of 1.25417. Overall the movement of GP/USD pair remained bullish throughout the day. The GBP/USD pair edged higher on Wednesday on the back of increased risk-appetite that made the U.S. dollar weak due to weakened appeal for the safe-haven currency. The risk sentiment was bolstered by many factors, including reports suggesting China’s economy was rebounding despite the COVID-19 pandemic.

As in result, Investors shifted towards riskier assets like GBP/USD currency pair as the world’s second-largest economy was continuously showing improvement while America was lagging. The latest US CPI data that edged higher by 0.6% was also not enough to boost the U.S. economy’s confidence.

The soft demand for the U.S. dollar due to an extended period of weak growth and the prevailing second wave of coronavirus induced economic downturn, helped the GBP/USD to move upward on Wednesday.

The Pound rose on Wednesday following the release of the latest U.K. Consumer Price Index for June that exceeded the forecasted 0.5% and came in as 0.6%. As in result, investors became more optimistic about Britain’s economic recovery.

The policymaker of Bank of England, Silvana Tenreyro, said on Wednesday that Britain’s economic recovery from the coronavirus lockdown would probably be delayed by the consumer’s caution towards viruses, decreased activity due to social distancing and rising unemployment. She added that behavioral responses mean that the U.K. economic outlook will continue to depend on the global and domestic spread of COVID-19.

She also said that she was prepared to push for fresh stimulus measures to aid the U.K.’s struggling economy. She said that a V-shaped economic recovery was unlikely.

On the data front, the Consumer Price Index for the year from the U.K. was released at 11:00 GMT, which showed an increase to 0.6% from the forecasted 0.4% and supported British Pound. The year’s Core CPI also increased to 1.4% from the expected 1.2% and supported GBP.

The PPI (Producer price index) Input for June from the U.K. decreased to 2.4% from the expected 3.0% and weighed on GBP. However, the PPI Output for June increased to .3% from the anticipated 0.2% and supported GBP. The RPI (Raw-material price index) for the year came in line with the 1.1% expectations. Most of the data came in better than expected and supported British Pound that gave strength to GBP/USD pair and made it move on the upside.

Besides, the Empire State Manufacturing Index rose from 10.0 of the forecast to 17.2 and supported the U.S. dollar. The Import Prices for June came in as 1.4% against the 1.0% of expectations and supported the U.S. dollar.

At 18:15 GMT, the closely watched Industrial Production for June rose to 5.4% against the expectations of 4.5% and supported the U.S. dollar. The Capacity Utilization Rate increased to 68.6% from the forecasted 67.9% and supported the U.S. dollar. The strong U.S. dollar failed to reverse the bullish momentum; however, it managed to limit the additional gains in GBP/USD pair on Wednesday.

Looking forward, GBP investors will be waiting for the release of the UK ILO Unemployment rate for May on Thursday. If unemployment rises, the U.K.’s GBP will show signs of losses. Meanwhile, U.S. traders will await the U.S. Retail Sales data. Any sign of fall in Retail Sales will undermine the U.S. dollar.


Daily Technical Levels

Support Resistance

1.2535   1.2638

1.2490   1.2696

1.2432   1.2742

Pivot point: 1.2593

GBP/USD– Trading Tip

The GBP/USD is trading with a selling bias at 1.2550 level, holding right above the support level of 1.2548 level. Downward breakout of 1.2548 level can extend selling until 1.2506 and 1.2479 support. The MACD and RSI both are supporting a bearish bias. On the higher side, the GBP/USD pair can face resistance at 1.2575 and 1.2595. Let’s consider taking Sell trades below 1.2533 level today. 


USD/JPY – Daily Analysis

The USD/JPY pair was closed at 107.233 after placing a high of 107.432 and a low of 107.116. Overall the movement of the USD/JPY pair remained bearish throughout the day. At 9:30 GMT, the Revised Industrial production for May from Japan came in as -8.9% against the expected -8.4% and weighed on Japanese Yen.

At 15:00 GMT, the NFIB Small Business Index for June raised to 100.6 from the expected 97.5 and supported the U.S. dollar. At 17:30 GMT, the Consumer Price Index for June increased to 0.6 % from the expected 0.5% and supported the U.S. dollar. For June, the Core CPI also rose to 0.2% against the expected 0.1% and supported the U.S. dollar.

On Tuesday, Federal Reserve Governor Lael Brainard offered a downbeat assessment of risk ahead. She said that the path ahead for the U.S. economy was under the clouds of high uncertainty, and the Federal Reserve should use forward guidance and large scale asset purchases for a sustained period to help the recovery.

In a virtual event hosted by the National Association for Business Economics, Brainard said that the pandemic was the key driver of the economy’s course. A thick fog of uncertainty still surrounded the U.S. and downside risks predominated.

The calls for further stimulus accommodation from the Federal Reserve by Brainard weighed on the U.S. dollar that dragged USD/JPY with it.

However, the uncontrolled rise in the numbers of coronavirus cases from the U.S. made investors cautious about holding the greenback, and hence, USD lost its traction and weighed on the USD/JPY pair.

The losses in the U.S. dollar were extended after many countries reported renewed lockdown measures to help control the virus’s spread. The California State, which is considered the most populous state of America, also imposed renewed restrictions and weighed on the U.S. dollar as its economic recovery would be difficult.

The cities and states imposed lockdown measures on the back of warning given by the World Health Organization that pandemic could only worsen if countries failed to follow strict precautions. In response to this, Hong Kong, Philippines, Hungary, Australia, and California announced lockdown measures. These restrictions imposed negative pressure on market sentiment as it will affect the global economic recovery.

Meanwhile, Beijing announced sanctions on Lockheed Martin for his involvement in the latest U.S. arms sale to Chinese-claimed Taiwan. This raised the ongoing tensions between the U.S. & China that were already heightened due to the South China Sea issue. The lockdown mentioned above restrictions and ongoing US-China tensions raised a safe-haven appeal that supported Japanese Yen and weighed on USD/JPY pair.


Daily Technical Levels

Support Resistance

107.10    107.43

106.94    107.60

106.77    107.75

Pivot point: 107.27

 USD/JPY – Trading Tips

The USD/JPY is trading with a bearish bias at 106.997 to consolidate within a wide trading range of 107.350 to 106.950. Recently the USD/JPY pair has crossed below 50 EMA, which extended support at 107.100 level, including now the same level is going to work as a resistance. The bearish breakout of the 106.900 level can extend the selling trend until 107.620 and 106.37 level. The MACD and RSI support bearish bias, and we may take a selling trade below 107.27 today. Good luck! 

Categories
Crypto Market Analysis

Daily Crypto Review, July 16 – Bitcoin Giveaway Scam Hits Twitter: Jeff Bezos, Barack Obama, Kanye West And More Targeted

The cryptocurrency market had quite a slow day with sideways movements. Bitcoin is currently trading for $9,206, which represents a decrease of 0.59% on the day. Meanwhile, Ethereum lost 0.53% on the day, while XRP lost 0.95%.

 Daily Crypto Sector Heat Map

When talking about top100 cryptocurrencies, Elrond gained 14.90% on the day, making it by far the most prominent daily gainer. Syntherix Network (12.31%) and iExec RLC (11.07%) also did great. On the other hand, Bytom has lost 8.57%, making it the most prominent daily loser. It is followed by Nervos Network’s loss of 8.39% and Divi’ loss of 8.38%.

Top 10 24-hour Performers (Click to enlarge)

Bottom 10 24-hour Performers (Click to enlarge)

Bitcoin’s dominance level decreased slightly since we last reported, with its value currently at 62.72%. This value represents a 0.28% difference to the downside when compared to yesterday’s value.

Daily Crypto Market Cap Chart

The cryptocurrency market capitalization didn’t change in valuation when compared to when we last reported, with the market’s current value being $272.53 billion. This value represents a decrease of $0.13 billion when compared to the value it had yesterday.

_______________________________________________________________________

What happened in the past 24 hours?

_______________________________________________________________________

_______________________________________________________________________

Technical analysis

_______________________________________________________________________

Bitcoin

The largest cryptocurrency by market capitalization had quite a slow day. Its price followed the descending resistance line throughout most of the day until it jumped slightly above it. However, the current move has insufficient strength to pass the $9,251 resistance level. On top of that, the upside is guarded by the 21 as well as 50-period moving averages.

BTC traders should look for a trade opportunity after the largest cryptocurrency passes $9,251, or fails to break it.

BTC/USD 4-hour Chart

Technical factors:

  • Price is below its 50-period EMA and its 21-period EMA
  • Price right below the middle B.B. (20-period SMA)
  • RSI neutral (47.59)
  • Average volume

Key levels to the upside          Key levels to the downside

1: $9,251                                 1: $9,120

2: $9,580                                 2: $8,980

3: $9,735                                  3: $8,820

Ethereum

Ethereum also had a slow day, with its price dancing between $237.5 (where ETH seems to have found some form of support) and a $240 resistance level. The second-largest cryptocurrency by market capitalization might attempt to break $240 very soon, but such a move would need strong confirmation afterward to be completely valid.

Ethereum traders should look for an opportunity after the fight for $240 ends.

ETH/USD 4-hour Chart

Technical Factors:

  • Price below the 50-period EMA and the 21-period EMA
  • Price below the middle B.B. (20-period SMA)
  • RSI neutral (47.81)
  • Average volume

Key levels to the upside          Key levels to the downside

1: $240                                    1: $228

2: $251.4                                 2: $225.4

3: $260                                     3: $218

Ripple

The third-largest cryptocurrency by market cap was trading sideways throughout the day, with its price being slightly below $0.2. The resistance level held up quite nicely, which brought XRP’s price down by a bit. However, even though it performed the worst out of the top3 cryptocurrencies in the past 24 hours, XRP’s price moved less than 1% in total.

XRP traders can look for an opportunity to trade when the volume increases, and the trend becomes clear enough, as the low volume and volatility are certainly not ideal for trading at the moment.

XRP/USD 4-hour Chart

Technical factors:

  • XRP in a mid-term descending trend (though it broke the trend in the short-term)
  • XRP lacks strong support levels below $0.178
  • Price above 21-period and below the 50-period EMA
  • Price right under the middle B.B. (20-period SMA)
  • RSI is neutral (47.11)
  • Volume lower than average

Key levels to the upside          Key levels to the downside

1: $0.205                                  1: $0.2

2: $0.214                                  2: $0.19

3: $0.227                                 3:$0.178


Categories
Forex Market Analysis

Daily F.X. Analysis, July 15 – Top Trade Setups In Forex – EU Industrial Production Ahead!

Today the major focus will remain on the UK CPI data, along with Canadian interest rate decision, which is due later today. The crude oil inventories will also remain in highlights to drive price action in CAD and WTI.

Economic Events to Watch Today 


EUR/USD – Daily Analysis

The EUR/USD pair was closed at 1.13999 after placing a high of 1.14085 and a low of 1.13250. Overall the movement of the EUR/USD pair remained bullish throughout the day. The EUR/USD rose above 1.1400 level for the first time in more than a month since June 10 on the back of heavy selling bias surrounding greenback. The pair EUR/USD rose for the 3rd consecutive day on Tuesday, in the wake of broad-based U.S. dollar weakness.

In the absence of significant fundamental drivers, the U.S. dollar index continued to react to Wall Street’s performance. The major equity indexes rose and made it difficult for the safe-haven U.S. dollar to find demand.

The U.S. Dollar Index (DXY) was down 0.3% on the day at 96.25, while the Dow Jones Industrial Average gained 1.2% and the S&P 500 gained 0.5%.

On the data front, the Industrial Production expanded in May by 12.4% against the expected 14.9% and weighed on single currency Euro that helped limit additional gains. The ZEW Economic Sentiment for July came in as 59.6 against the forecasted 55.8 and supported Euro.

For July, the German ZEW Economic Sentiment dropped to 59.3 from the expected 60.1 and weighed on Euro that additional caped gain in EUR/USD pair. On the other hand, the Consumer Price Index for May rose to 0.6% against the forecasted 0.5% and supported the U.S. dollar from the American side. The Core CPI for May came in as 0.2% against the expected 0.1% and supported the U.S. dollar. The strong U.S. dollar failed to turn EUR/USD’s gains into losses.

On Thursday, the European Central Bank will announce its interest rate decision and release its monetary policy statement. According to analysts, they expect major policy changes next week. The ECB awaits more data on the economic outlook, developments on the fiscal front, and the impact of its measures to decide on further policy changes.

Meanwhile, the rising numbers of coronavirus cases from the U.S. pushed California’s state government to impose renewed lockdown measures to contain the spread and avoid the second wave of coronavirus. The most populous state of the United States under lockdown weighed heavily on local currency. The weak U.S. dollar against its rival currency Euro as the renewed lockdown measures imposed economic recovery threats also weighed on EUR/USD pair on Tuesday.


Daily Technical Levels

Support Resistance

1.1345     1.1430

1.1292     1.1462

1.1260     1.1514

Pivot Point: 1.1377

EUR/USD– Trading Tip

The EURUSD is testing Triple Top resistance around 1.1415 level, but the recent daily candle is bullish engulfing, which may drive the bullish trend in the EUR/USD pair. On the higher side, a bullish breakout of the 1.1415 level can extend bullish bias until the 1.1490 level. On the lower side, support stays at 1.1380 and 1.1365 level.


GBP/USD – Daily Analysis

The GBP/USD pair was closed at 1.25545 after placing a high of 1.25634 and a low of 1.24798. Overall the movement of GBP/USD pair remained flat throughout the day. The pair GBP/USD during early trading session lost its ground and faced some heavy selling pressure on the back of poor than expected GDP data from the U.K.  

The pair dropped to a one-week low level near 1.24800 level and then reversed its direction in the late trading session and closed the day at the same level it started its day. The pair witnessed some heavy selling pressure on Tuesday for the second consecutive day, followed by the U.K. monthly GDP report’s disappointing release. The report suggested that the economy of the U.K. expanded n may by 1.8% while it was previously expected to expand by 5%, and hence, GBP suffered. The less than expected expansion in the U.K. economy could be associated with the lack of progress in the post-Brexit talks that ultimately affect the British Pound.

The pair started to decline and reached two weeks low level on Tuesday. Other than GDP, many economic reports were also released on Tuesday from the U.K. At 11:00 GMT, the Construction Output for May decreased to 8.2% against the forecasted 14.9% and weighed on GBP and dragged GBP/USD pair with it. The Goods Trade Balance showed a deficit of 2.8B against the deficit of 8.2B and supported GBP. However, the Index of Services 3m/3m came in as -18.9% against the expected -16.9% and weighed on GBP that caused a decline of GBP/USD pair.

The Industrial Production for May declined to 6.0% from the expected 6.2% and weighed on British Pound that added further in GBP/USD pair’s downward movement. For May, the Manufacturing Production increased 8.4% from the expected 7.5% and supported British Pound that kept a check on additional losses in GBP/USD pair.

On the other hand, from the American side, the Consumer Price Index for May increased to 0.6% against the expected 0.5% and supported the U.S. dollar. The Core CPI for May came in as 0.2% against the expected 0.1% and helped the U.S. dollar. The strong U.S. dollar added further in the losses of the GBP/USD pair.

Apart from weak GDP data, the pair declined to its one week lowest level on the back of the decreased risk-on market sentiment. The concerns about the deteriorating US-China relations and increased coronavirus cases worldwide kept the risk appetite under pressure that added further in GBP/USD pair’s daily losses.

The number of COVID-19 cases globally has reached 13 million marks, and Johns Hopkins University data has shown that the cases jumped by one million over the last five days. In response to this, the World Health organization said that if protocols were not followed, then pandemic would only worsen.

This resulted in demand for the U.S. dollar as hopes about quick economic recovery fall after many countries announced re-imposing restrictions to curb the virus’s spread. The demand for safe-haven U.S. dollar was also supported by the fresh tensions between the U.S. & China over the South China Sea. Strong USD weighed on GBP/USD pair on Tuesday. There were no latest updates on Tuesday, including traders continued following fundamentals & coronavirus updates on Brexit front.

Daily Technical Levels

Support Resistance

1.2499     1.2587

1.2445     1.2621

1.2410     1.2675

Pivot point: 1.2533

GBP/USD– Trading Tip

The GBP/USD is trading with a bullish bias as it has violated the strong resistance level of 1.2575 level. Above this, the next target is expected to be 1.2625 level. The 50 EMA is likely to extend support at 1.2570 level, and it can lead the GBP/USD prices further higher until 1.2660 levels. The RSI and MACD are both supporting bullish bias in the pair. Let’s consider taking buy trades above 1.2533 level today. 


USD/JPY – Daily Analysis

The USD/JPY pair was closed at 107.233 after placing a high of 107.432 and a low of 107.116. Overall the movement of the USD/JPY pair remained bearish throughout the day. At 9:30 GMT, the Revised Industrial production for May from Japan came in as -8.9% against the expected -8.4% and weighed on Japanese Yen.

At 15:00 GMT, the NFIB Small Business Index for June raised to 100.6 from the expected 97.5 and supported the U.S. dollar. At 17:30 GMT, the Consumer Price Index for June increased to 0.6 % from the expected 0.5% and supported the U.S. dollar. For June, the Core CPI also rose to 0.2% against the expected 0.1% and supported the U.S. dollar.

On Tuesday, Federal Reserve Governor Lael Brainard offered a downbeat assessment of risk ahead. She said that the path ahead for the U.S. economy was under the clouds of high uncertainty, and the Federal Reserve should use forward guidance and large scale asset purchases for a sustained period to help the recovery.

In a virtual event hosted by the National Association for Business Economics, Brainard said that the pandemic was the key driver of the economy’s course. A thick fog of uncertainty still surrounded the U.S. and downside risks predominated.

The calls for further stimulus accommodation from the Federal Reserve by Brainard weighed on the U.S. dollar that dragged USD/JPY with it.

However, the uncontrolled rise in the numbers of coronavirus cases from the U.S. made investors cautious about holding the greenback, and hence, USD lost its traction and weighed on the USD/JPY pair.

The losses in the U.S. dollar were extended after many countries reported renewed lockdown measures to help control the virus’s spread. The California State, which is considered the most populous state of America, also imposed renewed restrictions and weighed on the U.S. dollar as its economic recovery would be difficult.

The cities and states imposed lockdown measures on the back of warning given by the World Health Organization that pandemic could only worsen if countries failed to follow strict precautions. In response to this, Hong Kong, Philippines, Hungary, Australia, and California announced lockdown measures. These restrictions imposed negative pressure on market sentiment as it will affect the global economic recovery.

Meanwhile, Beijing announced sanctions on Lockheed Martin for his involvement in the latest U.S. arms sale to Chinese-claimed Taiwan. This raised the ongoing tensions between the U.S. & China that were already heightened due to the South China Sea issue. The lockdown mentioned above restrictions and ongoing US-China tensions raised a safe-haven appeal that supported Japanese Yen and weighed on USD/JPY pair.


Daily Technical Levels

Support Resistance

107.10     107.43

106.94     107.60

106.77     107.75

Pivot point: 107.27

 USD/JPY – Trading Tips

On Wednesday, the USD/JPY is trading with a bearish bias at 106.997 to consolidate within a wide trading range of 107.350 to 106.950. Recently the USD/JPY pair has crossed below 50 EMA, which extended support at 107.100 level, including now the same level is going to work as a resistance. The bearish breakout of the 106.900 level can extend the selling trend until 107.620 and 106.37 level. The MACD and RSI support bearish bias, and we may take a selling trade below 107.27 today. Good luck! 

Categories
Forex Daily Topic Forex Price Action

Reversal Breakouts Offer a Lot

The trend is traders’ friend. Breakout is traders’ best friend. In today’s lesson, we are going to demonstrate an example of an H1 breakout, which makes a reversal even in the daily chart. Thus, the price heads towards the breakout direction with good momentum ending up offering an excellent reward. Let us get started.

The chart shows that the price makes a strong bearish move and finds its support. Upon producing a bullish engulfing candle, the price heads towards the North at a moderate pace. The price does not make a breakout at the last swing high. Thus, the chart is still bearish biased. Please note, the H1 chart does not show, but the daily trend has been bearish in this chart.

The chart shows that one of the candles breaches through the last swing high, closing well above the level. The last candle comes out as a bullish candle as well. It confirms the breakout. The buyers may wait for the price to consolidate and get a bullish reversal candle to go long in the pair.

The last two candles come out as bearish candles. The spinning top closes within the level of support. If the level produces a bullish engulfing candle, the buyers may go long in the pair.

The last candle comes out as a bullish engulfing candle closing well above consolidation resistance. The buyers may trigger a long entry right after the candle closes by setting stop loss below the level of support and by setting take profit with 1R.

The price heads towards the North with extreme bullish momentum. The way the chart looks, it seems it may continue its journey for a while. The chart shows that the buyers achieve their target within the next two candles after triggering the entry. Let us proceed to the following chart to see what the price does.

The last candle comes out as a bearish engulfing candle. It is produced at the second rejection as well. This means the chart forms a double top here. A double top resistance forming a bearish engulfing candle suggests that the price may make a bearish move here. However, if we calculate the length of the bullish move, it ends up being a very good one. This is what usually happens when the price makes a breakout at the last daily candle’s highest high when the daily chart is bearish and if the breakout takes place at the lowest low when the daily trend is bullish. Make sure the price consolidates and produces a strong reversal candle at the breakout level. If that happens, it often ends up offering an excellent reward in the end.

Categories
Crypto Market Analysis

Daily Crypto Review, July 15 – Fidelity Goes All-In On Bitcoin; BTC Difficulty At Historic Heights

The cryptocurrency market had quite a slow day and closed to no movement in the past 24 hours. Bitcoin is currently trading for $9,243, which represents an increase of 0.59% on the day. Meanwhile, Ethereum gained 0.56% on the day, while XRP gained 0.74%.

 Daily Crypto Sector Heat Map

When talking about top100 cryptocurrencies, Kava gained 20.77% on the day, making it by far the most prominent daily gainer. Syntherix Network (16.17%) and Waves (15.28%) also did great. On the other hand, Nexo has lost 12.73%, making it the most prominent daily loser. It is followed by Ravencoin’s loss of 8.11% and The Midas Touch’ loss of 6.75%.

Top 10 24-hour Performers (Click to enlarge)

Bottom 10 24-hour Performers (Click to enlarge)

Bitcoin’s dominance level decreased slightly since we last reported, with its value currently at 63%. This value represents a 0.27% difference to the downside when compared to yesterday’s value.

Daily Crypto Market Cap Chart

The cryptocurrency market capitalization increased slightly when compared to when we last reported, with the market’s current value being $272.66 billion. This value represents an increase of $1.79 billion when compared to the value it had yesterday.

_______________________________________________________________________

What happened in the past 24 hours?

_______________________________________________________________________

_______________________________________________________________________

Technical analysis

_______________________________________________________________________

Bitcoin

The largest cryptocurrency by market capitalization had quite a slow day. While its price went above the descending resistance line, the price itself did not move that much. On top of that, the move seemingly got stopped by the $9,251 resistance level (at least for now). The decreasing volume while being stopped by both moving averages and the resistance level suggests that the move reached exhaustion and that $9,251 will not be tackled (in the very near future).

BTC traders should look for a trade opportunity after the largest cryptocurrency passes $9,251.

BTC/USD 4-hour Chart

Technical factors:

  • Price is below its 50-period EMA and its 21-period EMA
  • Price right below the middle B.B. (20-period SMA)
  • RSI neutral (48.17)
  • Increased volume (Coming back to normal)

Key levels to the upside          Key levels to the downside

1: $9,251                                 1: $9,120

2: $9,580                                 2: $8,980

3: $9,735                                  3: $8,820

Ethereum

Ethereum was even less volatile than Bitcoin, with its price hardly even moving throughout the day. The second-largest cryptocurrency by market capitalization spent the day sitting on the $240 level while the bears and bulls were fighting on whether the price will consolidate below or above it. The volume dwindled as time passed, and ETH seems like it has more chance of remaining under $240. However, there is still a chance for bulls to win.

Ethereum traders should look for an opportunity after the fight for $240 ends.

ETH/USD 4-hour Chart

Technical Factors:

  • Price above the 50-period EMA and below the 21-period EMA
  • Price below the middle B.B. (20-period SMA)
  • RSI neutral (48.14)
  • Increased volume (Coming back to normal)

Key levels to the upside          Key levels to the downside

1: $240                                    1: $228

2: $251.4                                 2: $225.4

3: $260                                     3: $218

Ripple

The third-largest cryptocurrency by market cap hardly moved at all after the price drop of July 13, which brought the price below the $0.2 threshold yet again. XRP is hovering below the $0.2 level for two days now, without any possibility of breaking it yet.

XRP traders can look for an opportunity to trade when the volume increases, and the trend becomes clear enough, as the low volume and volatility are certainly not ideal for trading at the moment.

XRP/USD 4-hour Chart

Technical factors:

  • XRP in a mid-term descending trend (though it broke the trend in the short-term)
  • XRP lacks strong support levels below $0.178
  • Price above 21-period and below the 50-period EMA
  • Price right under the middle B.B. (20-period SMA)
  • RSI is neutral (46.8)
  • Volume lower than average

Key levels to the upside          Key levels to the downside

1: $0.205                                  1: $0.2

2: $0.214                                  2: $0.19

3: $0.227                                 3:$0.178


Categories
Candlestick patterns

Trading with Confidence Using Candlestick Patterns

Introduction

Previously, we had discussed how a group of different candlestick formations provides the necessary information to comprehend the market sentiment and evaluate the probability of a trend reversal, which could help traders in joining the start of the new trend. 

In this educational article, we’ll review how candlestick formations can be used to establish a trading strategy and which patterns could bring more confidence in the trading setups.

The Candlestick Patterns’ Usefulness

Candlestick patterns arise as a result of the price action at a determined range of time. Independently of the timeframe under visualization, e.g., weekly, daily, hourly, or even minute timeframe, the price never is a lagging indicator.  Furthermore, candlestick patterns tend to appear in every market and timeframe.

Trading Signals with Candlesticks Patterns

There exist a set of candlestick patterns that frequently appears in the financial markets across time, although the technical trader must consider the market context before consider if the candlestick represents a continuation or a reversion of the trend.

Hammer and Hanging Man

The hammer characterizes itself by presenting a large shadow and a small body located near the high of the day. When this pattern appears at the end of a bearish trend, it tends to be a bullish reversal signal.

When a hammer pattern shows up after a substantial descent, the technical trader may place a buy position on the next trading bar above the high of that hammer, placing its stop-loss below the low of the last day.

On the opposite side, the hanging man pattern arises when an uptrend ends. The sell setup will take place in the next session candle using the low of the hanging man candle as entry level, with a stop-loss above its high.

Engulfing Candlestick Pattern

The engulfing pattern is a formation constituted by two candles. The bullish engulfing pattern will occur at the end of a downtrend. During the trading session, the action takes place in a wide range. The price opens near the low of the day and closes near the high of the day, erasing the losses of previous trading session or sessions.

A bullish position will take place at the high of the previous day, with a stop-loss located below the low of the last trading session. A bearish position will occur at the low of the previous trading session, with a stop-loss order placed above the highest level of the engulfing candle.

Harami Pattern

The harami pattern tends to indicate the change of the trend only when it appears at the end of a bull or bear leg. The Harami is the weakest form of a reversal pattern. 

A buy position will trigger if the price breaks and closes above the high of the day of the narrow range candle during the next trading session, the stop loss is to be placed below the low of the session in progress.

A sell position will occur if the price breaks and closes below the narrow range candle, and its stop-loss may be located above the highest level of the harami candle.

Morning Star and Evening Star Pattern

Both the morning star as the evening star pattern are formations that hold three candlesticks for its configuration.

The Morning star pattern is a bullish trend formation, which will activate a buy position above the high of the last trading session, with its stop-loss below the low of the previous day or candle.

The evening star pattern is a bearish formation, which will trigger a sell position below the third candle of the pattern, its stop-loss placed above the high of the last trading session.

Conclusions

In this educational article, we presented a group of candlestick patterns, which could increase the confidence in an entry setup. However, although the formation provides an entry-level and stop-loss, these formations don’t identify a profit target level. This context could not ensure the technical trader a risk to reward ratio at least one to one, reducing the profitability of any candlestick pattern.

To reduce this variability on the expected results, we remark the Fischer and Fischer conclusions; they unveil the advantage of the use of candlestick formations compared to bar charts, stating that candlesticks are easier to understand and most useful for short-term traders.

Finally, they conclude that the most reliable candlestick formations are the engulfing pattern, hammer, and hanging man. In this context, the technical trader should consider that before ramping up a trading strategy based on candlestick formations, it’s recommended to evaluate its performance, developing a statistical backtest before jumping in the real-market.

Suggested Readings

  • Fischer, R., Fischer J.; Candlesticks, Fibonacci, and Chart Patterns Trading Tools; John Wiley & Sons; 1st Edition (2003).
Categories
Forex Market Analysis

Daily F.X. Analysis, July 14 – Top Trade Setups In Forex – U.S. Inflation Report Ahead! 

On the news side, the economic calendar is fully loaded with a series of high impact economic events, especially the UK GDP, and the Inflation figures from Germany and the U.S. Most of the action will be seen during the U.S. session upon inflation figures.

Economic Events to Watch Today 


EUR/USD – Daily Analysis

The EUR/USD pair was closed at 1.13424 after placing a high of 1.13746 and a low of 1.12976. Overall the movement of the EUR/USD pair remained bullish throughout the day. The EUR/USD pair extended its previous day’s gains and jumped sharply on Monday against the U.S. dollar ahead of key developments in European Union later this week. Euro is likely to face a volatile week ahead as European Central Bank is set to retain its monetary policy conference on Thursday, and an E.U. Summit will also take place on Friday.

The ECB will likely hold its rates unchanged on Thursday that has drawn traders’ attention over the speech of ECB president Christine Lagarde, which could include some clues about future policy actions.

The ECB meeting could be shadowed by the E.U. Summit when all 27 member states of the European Union will meet, and bloc’s leaders will debate over the European Commission’s coronavirus recovery plan. The plan needs the backing of all 27 member states that made it difficult for compromise.

Germany and Italy have shown their consent and backed the E.U.’s 750 Billion euros recovery plan ahead of Friday’s meeting to appease other member states who have voiced concerns over the distribution of stimulus.

The Frugal Four, including Netherland, Sweden, Denmark, and Austria, have insisted that the funds be released as loans rather than grants or subsidies. The ongoing demand for the single currency can be seen by the week’s strong start for the Euro. On the flip side, the U.S. dollar was on the low track on Monday due to improved risk appetite after optimism raised in hopes of potential virus vaccine. The weaker U.S. dollar against its rival currency Euro gave a push to EUR/USD prices on Monday.

On the data front, at 11:00 GMT, the German WPI Wholesale Price Index for June came in as 0.6% compared to May’s -0.6%. From the American side, the Federal Budget Balance showed that in June, there was a deficit of 864.1 Billion against the expected 860 Billion and supported the U.S. dollar that kept a lid on additional gains in EUR/USD pair.

Daily Support and Resistance

  • R3 1.1459
  • R2 1.1406
  • R1 1.1368

Pivot Point 1.1315

  • S1 1.1278
  • S2 1.1224
  • S3 1.1187

EUR/USD– Trading Tip

On the 4 hour timeframe, the EUR/USD pair has violated an upward trendline, which was extending support at 1.1341 level, and now, this level will work as a resistance for the EUR/USD. On the lower side, the EUR/USD pair may find the next support at 1.1304 and 1.1265 level. The EUR/USD’s selling bias seems dominant since the violation of an upward trendline. We should consider taking selling trades below the 1.1345 level today. 


GBP/USD – Daily Analysis

The GBP/USD pair was closed at 1.25531 after placing a high of 1.26661 and a low of 1.25500. Overall the movement of GBP/USD pair remained bearish throughout the day. On Monday, the pair GBP/USD failed to extend its previous day’s bullish trend and started to decline because of downbeat comments from BOE’s Governor Bailey and persistent Brexit uncertainty ahead of the U.K.’s deadline’s official departure from E.U.

Bank of England Governor Andrew Bailey said on Monday that he thought that Britain’s economy was recovering, but it had a long way to go with the outlooks for jobs. He said that with the economies re-opened, the economy seems like it has come back, but there was a long way to go because a lot of people were still jobless.

Bailey’s downbeat comments weighed on Cable and dragged the Cable pair GBP/USD on the downside on Monday. Bailey also said that the Bank of England was looking at whether it should create a digital currency as it has huge implications on the nature of payments and society. He also acknowledged that since the coronavirus pandemic has escalated, there had been calls to step back from the shift away from Libor, which is used to price trillions of dollars of financial contracts.

However, he said that coronavirus’s shock has only reinforced the importance of removing the dependency of financial systems on Libor in a timely way. He warned lenders and borrowers to place their transition plans because if they think that the deadline to shift away from Libor of 2021 will be extended, then they were wrong.

On Brexit front, the U.K. government set to build 10-12 new Brexit border customs and control sites across the country to strengthen the mission to take back control from the E.U. The Cabinet Minister Michael Gove defended his plans for new post-Brexit border infrastructure after the opposition party said that the government was unprepared.

 Daily Support and Resistance

  • R3 1.277
  • R2 1.2697
  • R1 1.2654

Pivot Point 1.2581

  • S1 1.2538
  • S2 1.2465
  • S3 1.2421

GBP/USD– Trading Tip

The GBP/USD is trading with a bearish bias, especially after crossing below 50 EMA support level of 1.2570. This level is now working as resistance, and the Cable can show further bearish bias below 1.2570 level. Closing below this level can lead the GBP/USD pair towards 1.25200 level. The MACD and RSI are holding in a selling zone, and the 50 EMA, which is providing resistance at 1.2570, is also demonstrating the strong sell signal. Let’s consider taking sell trades below 1.2570 level. At the same time, second selling can be placed below the 1.2515 level today. 


USD/JPY – Daily Analysis

The USD/JPY was closed at 107.287 after placing a high of 107.316 and a low of 106.785. Overall the movement of the USD/JPY pair remained bullish throughout the day. The USD/JPY pair after falling for three consecutive days rose on Monday amid improving risk sentiment in the market that undermined the Japanese Yen and contributed to pair gains.

A report suggesting an effective coronavirus vaccine gave hopes and recovered optimism in the market. It also helped equity indexes start the new week on firm foot. The S&P 500, Dow Jones and NASDAQ were up from 1%-1.2% on the day and weighed on safe-haven Japanese Yen. The weaker Yen against the U.S. dollar gave a push to USD/JPY prices on Monday.

As for the vaccine new, on Sunday, several media reports suggested that Russia has become the first nation to complete the clinical trials of a COVID-19 vaccine on humans. The trials have reported that in initial results, the vaccine was safe and effective to an extent. Russia celebrated the supposed “world’s first COVID-19 vaccine”; however, it seemed premature as more research was still needed.

However, this news raised optimism and risk sentiment around the market and decreased the safe-haven appeal. The risk weighed on safe-haven Japanese yen and dragged the pair USD/JPY with itself. On the data front, at 9:30 GMT, the Tertiary Industry Activity from Japan came in as -2.1% against the expectations of -3.7% for May. It supported Japanese Yen and additional capped gains in currency pair.

From the American side, the Federal Budget Balance for June showed a deficit of 864.1 Billion against the forecasted 860 Billion. It supported the U.S. dollar, which added further in the currency pair daily gains.

On the other hand, The Director-General of WHO, Tedros Adhanom Ghebreysus, warned that too many countries were moving towards their destruction as the virus was the number one public enemy. If basic protocols were not followed, the pandemic might get worse and worse and worse.

Tedros said that on Sunday, from across the globe, 230,000 new cases appeared, out of which 80% were from 10 nations and 20% from just two countries. Tedros also said that the WHO had still not received formal notifications of the U.S. pullout that Trump announced. This downbeat statement by WHO raised concerns about global economic recovery and weighed on risk sentiment that kept a check on additional currency pair gains.

Support and Resistance    

  • R3 108.1
  • R2 107.91
  • R1 107.59

Pivot Point 107.39

  • S1 107.07
  • S2 106.87
  • S3 106.55

 USD/JPY – Trading Tips

On Tuesday, the USD/JPY continues to consolidate in a wide trading range of 107.350 to 106.950. Recently the USD/JPY pair has violated a downward channel, which extended resistance at 107.100 level. Simultaneously, the USDJPY pair has also crossed over 50 periods exponential moving average, which also supports the bullish bias in the USD/JPY pair. For now, the bullish breakout of the 107.340 level can extend the buying trend until 107.620 and 107.900 level. The MACD and RSI support bullish bias, and we may take a buying trade over 107.350 today. Good luck! 

Categories
Crypto Market Analysis

Daily Crypto Review, July 14 – IRS Violated Taxpayers’ “Bill of Rights”; The UK Wants a Digital Currency

The cryptocurrency market shad a green day, mostly caused by Bitcoin dropping under its immediate support level. Bitcoin is currently trading for $9,199, which represents a decrease of 0.82% on the day. Meanwhile, Ethereum lost 1.6% on the day, while XRP lost 1.42%.

 Daily Crypto Sector Heat Map

When talking about top100 cryptocurrencies, Aurora gained 245.87% on the day, making it by far the most prominent daily gainer. Divi (24.12%) and Ravencoin (17.39%) also did great. On the other hand, Ampleforth has lost 36.61%, making it the most prominent daily loser. It is followed by Nexo’s loss of 13.30% and Quant’ loss of 11.55%.

Top 10 24-hour Performers (Click to enlarge)

Bottom 10 24-hour Performers (Click to enlarge)

Bitcoin’s dominance level increased slightly since we last reported, with its value currently at 63.27%. This value represents a 0.33% difference to the upside when compared to yesterday’s value.

Daily Crypto Market Cap Chart

The cryptocurrency market capitalization decreased slightly when compared to when we last reported, with the market’s current value being $270.87 billion. This value represents a decrease of $3 billion when compared to the value it had yesterday.

_______________________________________________________________________

What happened in the past 24 hours?

_______________________________________________________________________

_______________________________________________________________________

Technical analysis

_______________________________________________________________________

Bitcoin

The largest cryptocurrency by market capitalization had a red day as bears broke its immediate support level. BTC dropped below the descending trend line as well as the $9,251 level in a short bear run. The price went all the way down to the $9,120 support level, but stopped and reversed its path there.

Once again, BTC traders had a great opportunity to trade the pullback after the bearish move. Trading Bitcoin’s reversals and confirmations are the safest way to trade at the moment.

BTC/USD 4-hour Chart

Technical factors:

  • Price is below its 50-period EMA and its 21-period EMA
  • Price at the lower B.B.
  • RSI at below the middle point and heading down (42.17)
  • Increased volume

Key levels to the upside          Key levels to the downside

1: $9,251                                 1: $9,120

2: $9,580                                 2: $8,980

3: $9,735                                  3: $8,820

Ethereum

Ethereum had a slightly red day as well, but with a much tamer move towards the downside. While bears did manage to push Ethereum below the $240 level, they faced a good amount of resistance at the 4-hour 50-period moving average. However, the price went under it as well, but stopped near the $237 level, where some form of support is created.

Ethereum traders should look for an opportunity to trade the next bounce off of $240 or break to the downside from the $240.

ETH/USD 4-hour Chart

Technical Factors:

  • Price below the 50-period EMA and the 21-period EMA
  • Price at the lower B.B.
  • RSI near the middle (45.68)
  • Increased volume

Key levels to the upside          Key levels to the downside

1: $240                                    1: $228

2: $251.4                                 2: $225.4

3: $260                                     3: $218

Ripple

The third-largest cryptocurrency by market cap fell below the $0.2 support level after a failed attempt of breaking $0.205 to the upside. The price dropped all the way to $0.192 before bouncing back. XRP is now consolidating above the 4-hour 50-period moving average, which it uses as a temporary support. The “battle” for $0.2 is, however, not yet finished.

XRP traders can look for an opportunity to trade after XRP establishes whether it will end up above or below $0.2.

XRP/USD 4-hour Chart

Technical factors:

  • XRP in a mid-term descending trend (though it broke the trend in the short-term)
  • XRP lacks strong support levels below $0.178
  • Price below 21-period and the 50-period EMA
  • Price at the lower B.B.
  • RSI is neutral (45.92)
  • Average volume

Key levels to the upside          Key levels to the downside

1: $0.205                                  1: $0.2

2: $0.214                                  2: $0.19

3: $0.227                                 3:$0.178


Categories
Forex Daily Topic Forex Fibonacci Forex Price-Action Strategies

Generating Trading Signals Using Fibonacci Tools

Introduction

In our previous educational article, we reviewed how the identification of double top and double bottom formations could provide a trading setup, which, according to its technical configuration, returns a risk to reward ratio equivalent to 1:1.

In this educational article, we’ll review the use of Fibonacci retracements and extensions to generate trading signals.

Trading the Market Corrections

Trading based on corrective movements has its origin in the idea that when the price action makes an impulsive move, the market develops a corrective movement before continuing to develop a new motive move.

This method’s risk derives from the possibility of false breakouts, which, depending on the primary trend, could be a “bearish trap” or “bullish trap.”

Considering that there is a broad range of Fibonacci ratios, Fischer & Fischer propose filtering the trading volume using the 61.8% level as a conservative level. The use of 61.8% provides the technical trader the possibility to invest risking a reduced part of its capital.

As a second entry filter criteria, traders could use the swing size average of the asset under analysis. Considering that every financial asset holds a different personality and volatility, this filter demands the technical trader to develop statistical backtesting to understand the asset’s inherent volatility under study.

Trade Setup

Entry Setup: Considering that the entry rule requires a unique Fibonacci level, the entry will occur once the price touches and closes above (or below) the level 61.8%. This criterion could help shield the technical investor against a potential false breakout.

Stop-Loss: The trade invalidation level will be set above/below the last peak/valley preceding the entry-level. The benefit of trading using the 61.8% level as the point of market entry is the reduced risk compared with other typical Fibonacci levels, such as 38.2% or 50%.

Trailing Stop as Profit Protector: This method by itself doesn’t make the use of a profit target level. As an alternative, the use of a trailing stop could help protect profits with a trailing criterion of the last peak or valley. The disadvantage of this method is that, constrained by the volatility observed in the real market, it is unlikely that the resulting risk to reward ratio goes beyond a mere 1:1.

Trading the Market Progress

As the Elliott Wave Theory states, the price tends to advance in three or five waves. This method uses Fibonacci extensions to define target levels.

In general, when the price action develops a price movement on strong momentum and, then, its correction doesn’t violate the starting level of the initial move, it means the market is not building a bullish or bearish trap; thus, it is likely the action will continue progressing in the direction of the first move.

Entry Rule:  In the same way as in the case of a price correction setup, the entry should be set when the price retraces and closes, starting a new impulsive move. This condition doesn’t require that the price retraces to the 61.8% level of the initial movement.

Stop-Loss: The invalidation level of the trade setup should be located below the last peak or valley preceding the entry-level.

Profit Target (Three Movements Case): When the price evolves following a three-move sequence, the profit target should be set at 161.8% of the projection of the first sequence, as illustrated in the next figure.

Profit Target (Five Movements Case): This scenario considers two options. The first one is when the progress happens in the third segment and the second one when the price action has completed the third move and could be initiating its fifth movement. These scenarios are illustrated in the following figure.

Conclusions

In this educational article, we reviewed two cases in which to use as Fibonacci retracements as the extensions tool. Both methods presented in this article offer specific risks. The use of the corrections method provides a reduced risk to the technical trader, due to the trailing stop use criterion, this doesn’t mean that it could deliver a risk to reward ratio of over 1:1.

On the other hand, the use of the Fibonacci extensions, according to Fischer & Fischer, always means to invest against the trend. However, a combination of both methods could provide an opportunity to enter in favor of the market direction.

To reduce the noise and risk in the investment process, the technical trader must evaluate the performance strategy developing statistical backtesting with historical data before risking real money.

Suggested Readings

  • Fischer, R., Fischer J.; Candlesticks, Fibonacci, and Chart Patterns Trading Tools; John Wiley & Sons; 1st Edition (2003).


Categories
Forex Market Analysis

Daily F.X. Analysis, July 13 – Top Trade Setups In Forex – U.S. Federal Budget Balance In Focus 

On the news front, eyes will be European German WPI data, Canadian BOE Gov Bailey Speaks, and Federal Budget Balance. But none of them is highly impacted and may not drive major movements in the market. Let’s focus on the technical side of the market.

Economic Events to Watch Today 


EUR/USD – Daily Analysis

The EUR/USD pair was closed at 1.12984 after placing a high of 1.13245 and a low of 1.12545. Overall the movement of EUR/USD remained bullish throughout the day. The EUR/USD pair left behind its bearish stance and started posting gains on Friday due to better than expected macroeconomic data from the European side and weak data from the U.S. side. The downside pressure on greenback supported the upside movement of the EUR/USD pair.

The tone around the U.S. dollar remained negative due to the increased number of coronavirus cases from many states that reached more than 60,000 per day. Moreover, the number of deaths was also increasing that raised bars for renewed restrictions. The potential lockdown measures weighed on the U.S. dollar as it would affect the U.S. economy. The downbeat U.S. dollar added strength to EUR/USD pair on Friday.

On the other hand, ECB said that Bulgaria and Croatia were accepted to be a part of the ERM-2 mechanism, a mandatory stage for joining the euro, and beginning the currency bloc’s first expansion in half a decade. After the approval from the eurozone finance minister and ECB officials, the two eastern European nations will also join the bloc’s banking union from October 1.

Following the procedure, both nations must spend at least two years in ERM-2 before starting the practical preparations to join the euro that will roughly take another year. So, the estimated earliest year for their membership will be 2023. This positive news added further in the EUR/USD gains.

On the data front, at 11:45 GMT, the French Industrial Production for May increased to 19.6% from the forecasted 15.2% and supported euro. At 13:00 GMT, the Italian Industrial Production for May was also raised to 42.1% from the forecasted 23.5 % and supported euro that ultimately helped the EUR/USD currency pair to post gains.

From the American side, the Core PPI for June declined to -0.3% from the forecasted 0.1% and weighed on the U.S. dollar. At 17:30 GMT, the PPI for June also declined to -0.2% from the expected 0.4% and weighed on the U.S. dollar that added further in the upward trend of EUR/USD pair.

Next week, the key data would be about the ECB’s next policy meeting on the coming Thursday, and from the U.S. side, eyes will be on Core Retail Sales & Retail Sales data on Thursday. A repetition of recent comments is expected in ECB’s next policy meeting that means ECB will reiterate its stance towards supporting a recovery.

Daily Support and Resistance

  • R3 1.1459
  • R2 1.1406
  • R1 1.1368

Pivot Point 1.1315

  • S1 1.1278
  • S2 1.1224
  • S3 1.1187

EUR/USD– Trading Tip

The EUR/USD pair has violated a downward trendline, which extended resistance at 1.1291 level, and now this level is going to work as a support for the EUR/USD. On the higher side, the EUR/USD may find resistance at 1.1350 level. Above this, the next target can be seen around the 1.1390 level. Bullish bias seems dominant today.


GBP/USD – Daily Analysis

The GBP/USD pair was closed at 1.26217 after placing a high of 1.26640 and a low of 1.25666. Overall the movement of GBP/USD pair remained bullish throughout the day. The fresh supply in the U.S. dollar gave strength to GBP/USD pair on the last day of the week, and the pair rallied around 90 pips. Greenback struggled to gain attraction on Friday despite the increasing number of coronavirus cases. The fresh leg down in the U.S. Treasury bond yields dragged the U.S. dollar and made it weaker.

The traders ignored the persistent Brexit uncertainties on Friday as the main driver of the GBP/USD was the U.S. dollar. The European Union’s top negotiator Michel Barnier said that talks on the post-Brexit relationship had made a little progress. However, there were still significant differences in several important issues. This also added some positive momentum to Cable pairs.

On the data front, the U.S. dollar was weak due to poor than expected PPI reports. At 17:30 GMT, the Core PPI for June dropped to -0.3% from the expected 0.1%, and PPI was declined to -0.2% from the forecasted 0.4% and pushed the GBP/USD pair higher. While from Great Britain, the C.B. Leading Index for May came in as -1.4% compared to April’s -3.7%.

For the next week, coronavirus cases will remain dominant. Still, the calendar will also be under observation as U.K.’s GDP and claims will be announced, while from the U.S., the Consumer figures will remain under watch.

GDP for May will be released from the U.K. next Tuesday that could show some stability after a collapse of 20.4% in April. The most important data will release on Thursday about the jobs report. The Unemployment Rate is expected to increase to 4.7% in May after the remaining 3.9% in April. The government’s furlough scheme that was extended through October has helped keep unemployment low. Wages are expected to jump from 1% to 1.4% in the gauge, including bonuses.

From the U.S. side, the increasing number of coronavirus cases from Florida, California, Arizona, and Texas will remain under watch. However, on the data front, the key release will Retail Sales that are projected to rebound in June to 4.6%. The Core Consumer Price Index is expected to surge to 0.1% from the previous -0.1%.

 Daily Support and Resistance

  • R3 1.277
  • R2 1.2697
  • R1 1.2654

Pivot Point 1.2581

  • S1 1.2538
  • S2 1.2465
  • S3 1.2421

GBP/USD– Trading Tip

The GBP/USD is trading with a bearish bias, especially after crossing below 50 EMA support level of 1.2570. This level is now working as resistance, and the Cable can show further bearish bias below 1.2570 level. Closing below this level can lead the GBP/USD pair towards 1.25200 level. The MACD and RSI are holding in a selling zone, and the 50 EMA, which is providing resistance at 1.2570, is also demonstrating the strong sell signal. Let’s consider taking sell trades below 1.2570 level today. 


USD/JPY – Daily Analysis

The USD/JPY pair was closed at 106.911 after placing a high of 107.262 and a low of 106.635. Overall the movement of USD/JPY remained bearish throughout the day. The pair USD/JPY extended its previous day losses and dropped for the 3rd consecutive day on the back of broad-based selling bias around the U.S. dollar. The pair dropped to over two weeks the lowest level in the wake of risk-off market sentiment that gave strength to safe-haven Japanese Yen.

The recent optimism regarding the sharp V-shaped economic recovery faded away quickly after the record increase in the number of daily reported COVID-19 cases in the U.S. on Thursday. The continuous surge in the number of appearing cases and deaths also pushed the risk-off market sentiment that weighed on the equity market.

The global fight to safety weighed on U.S. Treasury bond yields that prompted selling bias in the U.S. dollar. The weak U.S. dollar failed to lend any support to the USD/JPY pair. On the data front, the PPI from Japan was released at 04:50 GMT, dropped by 1.6% against the forecasted drop of 2.0%, and supported Japanese Yen. The strong Japanese yen added in the losses of the USD/JPY pair.

At 17:30 GMT, the Core PPI for June was dropped to -0.3% from the expected 0.1% and weighed on the U.S. dollar. For June, the PPI also dropped to -0.2% against the forecasted 0.4% and weighed on the U.S. dollar that also dragged USD/JPY Pair.

On the other hand, the largest one-day increase in any country since the pandemic started was reported in the U.S. as 65,000 cases alone on Thursday. This raised the market’s safe-haven appeal that gave a push to Japanese Yen and ultimately weighed on USD/JPY pair. Moreover, the Federal Reserve said that in June, it purchased $1.8 Billion in corporate bonds to keep U.S. interest rates lower and ensure that large companies could borrow by selling bonds. 

The bonds were purchased to keep interest rates on corporate bonds lower, making it harder for companies to borrow by selling debts. A Fed official announced this week that recently Fed has slowed down its bond-buying and if the market remained relatively healthy, then the central bank will continue to do so.

Support and Resistance    

  • R3 108.1
  • R2 107.91
  • R1 107.59

Pivot Point 107.39

  • S1 107.07
  • S2 106.87
  • S3 106.55

 USD/JPY – Trading Tips

The USD/JPY is holding at 106.850, and this is going to provide solid support to the USD/JPY pair for now. However, this level’s bearish breakout has a huge odds of driving more selling until 106.450 level today. At the moment, the pair is trading with a selling bias of above 106.850 support. The USD/JPY is dropping below 50 periods EMA on the hourly charts, which supports the Japanese pair’s selling bias. Let’s look for selling trades below 107.250 today. Good luck! 

Categories
Forex Daily Topic Forex Price Action

If Double Bottom/Top Does Not Offer Entry, Wait for Triple Bottom/Top

In today’s lesson, we are going to demonstrate an example of double bottom support, which does not end up producing entry. However, the price comes back to the level of support again, and upon producing a triple bottom, support offers a beautiful trade setup. Let us get started.

This is the daily chart. The price makes a strong bearish move and bounces off at a level of support. It produces a bullish inside bar and heads towards the North. The price comes back to the level of support again upon producing a bullish engulfing candle. The buyers may flip over to the H4 chart for the price to consolidate and produce a bullish engulfing candle to trigger a long entry.

We are still on the daily chart. The H4 chart does not consolidate or produce a bullish reversal candle. On the daily chart, the price comes down again and consolidates around the level of support. Both the buyers and the sellers are to wait for the price to see what it does. Does it produce a bullish reversal candle, or does it make a bearish breakout?

The chart produces a bullish engulfing candle at the level of support again. It has become a level of triple support. Thus, the buyers may be more interested in going long in the pair. The buyers may flip over to the H4 chart now.

This is how the H4 chart looks. The last candle comes out as a hammer. The buyers are to wait for a bullish engulfing candle to trigger a long entry. Let us proceed to the next chart to find out what the price does.

The price consolidates for four more H4 candles. At last, it produces a bullish engulfing candle closing well above consolidation resistance. It takes a long time to produce the signal candle, but it does just before the day ends. It is a valid signal. The buyers may trigger a long entry right after the last candle closes by setting take profit with 1R.

The price heads towards the North with good momentum and hits the target. The extreme bullishness of the signal candle makes the price hit the target in a hurry.

If we look back, when the chart produces the first bullish engulfing candle at the level of double bottom support, it does not end up offering an entry. When it bounces again at the same level of support, it ends up offering an entry. This is what may happen more often than traders think. If a buyer leaves the chart when it does not offer entry, he will lose the chance to make a profit from the trade setup that we have demonstrated here.

Categories
Crypto Market Analysis

Daily Crypto Review, July 13 – Coinbase Working With the US Secret Service; ETH 2.0 Facing Delays

The cryptocurrency market spent the weekend mostly rising in price after a semi-severe drop in price. Bitcoin is currently trading for $9,289, which represents an increase of 0.03% on the day. Meanwhile, Ethereum gained 0.59% on the day, while XRP lost 1.03%.

 Daily Crypto Sector Heat Map

When talking about top100 cryptocurrencies, iExec RLC gained 17.91% on the day, making it by far the most prominent daily gainer. Chainlink (17.25%) and Elrond (12.52%) also did great. On the other hand, Flexacoin has lost 21.07%, making it the most prominent daily loser. It is followed by UNUS SED LEO’s loss of 6.27% and Celsius’ loss of 6.03%.

Top 10 24-hour Performers (Click to enlarge)

Bottom 10 24-hour Performers (Click to enlarge)

Bitcoin’s dominance level decreased slightly since we last reported, with its value currently at 62.95%. This value represents a 0.34% difference to the downside when compared to Friday’s value.


Daily Crypto Market Cap Chart

The cryptocurrency market capitalization increased slightly when compared to when we last reported, with the market’s current value being $273.87 billion. This value represents an increase of $0.74 billion when compared to the value it had on Friday.

_______________________________________________________________________

What happened in the past 24 hours?

_______________________________________________________________________

_______________________________________________________________________

Technical analysis

_______________________________________________________________________

Bitcoin

The largest cryptocurrency by market capitalization had an average weekend in terms of volatility. Its price went down from $9,200 levels to $9,000 first, but bounced back quickly and started regaining its previous levels. BTC faced resistance in the form of the descending trend line for a short while but overcame it eventually. The price went up and then down to confirm the position above the level above which it is currently trading.

BTC trades should wait for the next increase in volume before trading BTC.

BTC/USD 4-hour Chart

Technical factors:

  • Price is above its 50-period EMA and its 21-period EMA
  • Price between the upper B.B. and the middle B.B (20-period SMA)
  • RSI at the mid-levels (52.35)
  • Decreased volume

Key levels to the upside          Key levels to the downside

1: $9,580                                 1: $9,251

2: $9,735                                 2: $9,120

3: $9,870                                  3: $8,980

Ethereum

Ethereum had had a slow weekend, with mostly sideways movement. However, the second-largest cryptocurrency by market cap managed to establish its position above the $240 during it. While the move to the upside seems to be done, Ethereum fulfilled its short-term goal and can trade, knowing it has strong support at $240.

Ethereum traders should look for an opportunity to trade the next bounce off of $240 or break to the downside from the $240.

ETH/USD 4-hour Chart

Technical Factors:

  • Price above the 50-period EMA and the 21-period EMA
  • Price slightly below the upper B.B.
  • RSI near the middle (55.41)
  • Decreased volume

Key levels to the upside          Key levels to the downside

1: $251.4                                 1: $240

2: $260                                    2: $228

3: $278.8                                  3: $225.4

Ripple

The third-largest cryptocurrency by market cap kept making higher lows and lower highs throughout the weekend. Ultimately, the price broke $0.2 to the downside and came back above it many times, with it currently being below $0.2. It is still uncertain where the price will end up.

XRP traders can look for an opportunity to trade after XRP establishes whether it will end up above or below $0.2.

XRP/USD 4-hour Chart

Technical factors:

  • XRP in a mid-term descending trend (though it broke the trend in the short-term)
  • XRP lacks strong support levels below $0.178
  • Price is at the 21 and above the 50-period EMA
  • Price slightly above the middle B.B. (20-period SMA)
  • RSI is neutral (52.65)
  • Average volume

Key levels to the upside          Key levels to the downside

1: $0.205                                  1: $0.2

2: $0.214                                  2: $0.19

3: $0.227                                 3:$0.178


Categories
Forex Market Analysis

US Dollar Index Analysis – Is Preparing for a New Decline?

The US Dollar index (DXY) seems to be turning its market sentiment from bullish to bearish. The currency basket index against the US Dollar exposes bearish signals that lead us to anticipate a bearish outlook for the mid-term.

The Big Picture and Market Sentiment

The big picture of DXY in its weekly chart unveils that the price action continues moving by the sixth consecutive week below 50% of the 52-week high and low range, which carries us to suspect that big market participants could keep pushing lower the Greenback. During this year, the US Dollar index reports an advance of 0.16% (YTD),  dropping from 6.72% reached on March 19th when DXY reached its yearly high at 102.99.

In the previous chart, we distinguish the net positions between institutional traders (or speculative positions) in green, versus the net positions of commercial traders in red. The net positioning reveals that speculative traders are turning their bias to the bearish side; however, this doesn’t imply that DXY will plunge in the short-term.

Elliott Wave Outlook

The mid-term Elliott wave perspective for the US Dollar Index exposed in its 8-hour chart illustrates an incomplete bearish cycle that began on March 19th once the index found fresh sellers at 102.99.

In the above chart, we observe the first bearish movement identified as wave ((a)) or ((i)) of Minor degree labeled in black reveals a strong bearish momentum, which leads us to suspect that it could correspond to the first movement of a zigzag pattern or an impulsive sequence.

Once DXY had completed its first downward movement, it started a corrective sequence that at a first stage looked like a triangle formation (subdivided into 3-3-3-3-3 internal segments); however, the corrective structure corresponds to a regular flat pattern (divided into 3-3-5). This correction ended on April 24th when the price topped at 100.87 pts and give way to a new downward move corresponding to wave ((c)) or ((iii)), which remains in progress.

The third bearish structural series, which remains in progress, reveals that the price action currently develops an expanding triangle pattern. This formation follows an internal sequence subdivided into 3-3-3-3-3.

On the other hand, in the last chart, we observe the RSI oscillator moving below the 60-level, which confirms the bearish bias that the US Dollar index maintains and, in consequence, doesn’t exists any trend reversal signal so far.

Our outlook for the coming weeks for the US Dollar index foresees a limited upward movement, which could surpass the end of wave c slightly, labeled in green, at 97.80. The end of the wave e could coincide with the descending trendline. Considering the expanding triangle nature, we could expect a volatile movement in the current upside, which could imply the development of a bullish trap. Once completed this upside, the Greenback should resume its downtrend falling into a five-wave sequence.

Categories
Forex Chart Basics Forex Daily Topic

Trading the Double Top and Double Bottom Pattern

Introduction

In our previous articles, we had reviewed several technical formations that render signals for potential market-entry setups in a trend reversal context or trend continuation.

In this educational article, we will review the characteristics of the double top and double bottom pattern.

The Nature of Double Top and Bottom

The double top and double top formations are the most popular trend reversal technical patterns in financial markets. These patterns characterize themselves by developing an internal “M” and “W” structures on double tops and double bottoms respectively.

Considering the fractal nature of financial markets, the technical trader can detect these formations in any timeframe, from intraday chart to monthly range. 

The double top formation tends to be tough to identify, especially if the second peak is higher than the first one. This situation occurs because the technical trader could be waiting for the uptrend continuation or a bullish trap.

The Setup Rules

The price action will generate an entry signal if the price breaks and closes below (or above) the swing between both peaks (or valleys), as shown in the following figure.

The stop-loss order will take place above the last high (or low); this distance between the entry-level and the previous top (or bottom) is known as the swing size, as illustrated in the last figure. 

The double top/bottom pattern holds an easy way to identify the profit target level. The technical rule says that if the swing size is 50 pips, the profit target will locate at 50 pips from the entry-level.

The Behavior of the Double Top and Bottom Formation

Thomas Bulkowski, in his “Encyclopedia of Chart Patterns,” described the performance of double top and bottom considering some shape variations as a rounded peak or a spike. 

In general, Bulkowski reveals that on average, the break-even and failure rate of the double top pattern is 11.5%, while the percentage of break-even and failure of double bottom is 6.5%. However, the double top formation tends to reach its price target 71.5%, while the double bottom tends to strike its target 51.25% of times.

Bulkowski summarizes its finds stating that some variations of double top and bottom patterns with a narrow range perform better than those that show a wide one.

Conclusions

In this educational article, we reviewed the essential reversal formation known as the double top and double bottom pattern. The setup studied provides the technical trader a one to tone risk to reward ratio, which could be increased as the trade advances in favor of the trend.

In the next article, we’ll review the use of Fibonacci tools as retracements and extensions to identify trade opportunities.

Suggested Readings

  • Fischer, R., Fischer J.; Candlesticks, Fibonacci, and Chart Patterns Trading Tools; John Wiley & Sons; 1st Edition (2003).
  • Bulkowski, T.; Encyclopedia of Chart Patterns; John Wiley & Sons; 2nd Edition (2005).
Categories
Crypto Market Analysis

Daily Crypto Review, July 10 – Tether and Bitfinex on Trial for $850 million? Tether Holders: Watch Out!

The cryptocurrency market was mostly in the red in the past 24 hours, with Bitcoin currently trading for $9,169, which represents a decrease of 2.62% on the day. Meanwhile, Ethereum lost 3.73% on the day, while XRP lost 4.45%.

 Daily Crypto Sector Heat Map

When talking about top100 cryptocurrencies, Holo gained 25.95% on the day, making it by far the most prominent daily gainer. Nervos Network (13.81%) and The Midas Touch (13.38%) also did great. On the other hand, Flexacoin has lost 13.72%, making it the most prominent daily loser. It is followed by Quant’s loss of 11.26% and Siacoin’s loss of 9.81%.

Top 10 24-hour Performers (Click to enlarge)

Bottom 10 24-hour Performers (Click to enlarge)

Bitcoin’s dominance level decreased slightly since we last reported, with its value currently at 63.29%. This value represents a 0.1% difference to the downside when compared to yesterday’s value.

Daily Crypto Market Cap Chart

The cryptocurrency market capitalization decreased when compared to when we last reported, with the market’s current value being $273.13 billion. This value represents a decrease of $2.57 billion when compared to the value it had yesterday.

_______________________________________________________________________

What happened in the past 24 hours?

_______________________________________________________________________

_______________________________________________________________________

Technical analysis

_______________________________________________________________________

Bitcoin

The largest cryptocurrency by market capitalization had a red day, as bears pushed the price back down towards the $9,000. The descending line Bitcoin broke previously fell under the bearish pressure, and Bitcoin started rushing towards the downside. The bearish move got stopped by the $9,120 level, which held up quite nicely. However, bears have not reached exhaustion, which means that the $9,120 level is not safe yet.

BTC trades should look for the retracement move for a safe trade.

BTC/USD 4-hour Chart

Technical factors:

  • Price is below its 50-period EMA and its 21-period EMA
  • Price at the lower B.B.
  • RSI at the lower levels (37.8)
  • Increased volume

Key levels to the upside          Key levels to the downside

1: $9,580                                 1: $9,251

2: $9,735                                 2: $9,120

3: $9,870                                  3: $8,980

Ethereum

Ethereum made a move towards the downside as well, falling below the ascending line it previously broke, as well as below the $240 level. The move was (for now) stopped by the 4-hour 50-period moving average, and ETH seems to be starting a consolidation phase near the $240 level.

Ethereum traders should look for an opportunity in trading pullbacks from the moving averages or horizontal levels. They should also pay close attention to Bitcoin’s movement, as BTC is mostly the main factor that causes ETH’s volatility.

ETH/USD 4-hour Chart

Technical Factors:

  • Price above the 50-period EMA and below the 21-period EMA
  • Price slightly below the middle B.B. (20-period SMA)
  • RSI near the middle (45.8)
  • Increased volume

Key levels to the upside          Key levels to the downside

1: $240                                    1: $228

2: $251.4                                 2: $225.4

3: $260                                     3: $217.7

Ripple

The third-largest cryptocurrency by market cap ended up in the red as well. After bulls reaching exhaustion at $0.212, bears took over and caused the price to reach the lows of $0.192, therefore breaking $0.205 and $0.2 support levels. XRP has strong support at the $0.19 line (both the horizontal support line and the 50-period moving average are there), so there is almost no chance XRP will move down (unless BTC makes a sharp move down).

XRP traders can look for an opportunity to trade in a range, as XRP is pretty much bound within $0.19 to $0.20 range unless BTC makes a move.

XRP/USD 4-hour Chart

Technical factors:

  • XRP in a mid-term descending trend (though it broke the trend in the short-term)
  • XRP lacks strong support levels below $0.178
  • Price is below the 21 and above the 50-period EMA
  • Price slightly below the middle B.B. (20-period SMA)
  • RSI is neutral (50.6)
  • Increased volume

Key levels to the upside          Key levels to the downside

1: $0.205                                  1: $0.2

2: $0.214                                  2: $0.19

3: $0.227                                 3:$0.178


Categories
Forex Market Analysis

Daily F.X. Analysis, July 10 – Top Trade Setups In Forex – US PPI Figures Ahead! 

On the news front, the eyes will remain on the Canadian labor market figures, and US PPI figures, which are expected to perform better than previous figures as the COVID19 driven lockdown is over, and people are back to jobs. We can expect CAD and USD to stay stronger today.

Economic Events to Watch Today 


EUR/USD – Daily Analysis

The EUR/USD pair was closed at 1.12846 after placing a high of 1.13704 and a low of 1.12800. Overall the movement of the EUR/USD pair remained bearish throughout the day. The EUR/USD has hit its highest in four weeks on Wednesday amid market optimism but retreated from that on Thursday on the back of concerns like E.U. recovery package, U.S. jobless claims, and coronavirus cases from the U.S. & all over the world.

The Eurogroup held its meeting on Thursday to elect the new president, and Paschal Donohoe, Minister for Finance and Public Expenditure & Reform of Ireland was selected as the Eurogroup’s new president.

 The New president will take office from July 13, 2020, and serve for two and a half years. The first Eurogroup meeting under Paschal Donohoe has been planned for September 11, 2020.

Eurogroup is an informal body where ministers of euro area member states discuss common concerns as they share the Euro as a single currency. The focus of the discussion remains particularly on the coordination of economic policies. Eurogroup usually meets once in a month, on the eve of Economic & Financial Affairs Council meeting.

The risk tone around the market was faded away after the U.S. Trump Administration announced that it has planned to finalize the regulations this week that will bar the U.S. government from buying goods & services from any company that uses products from five Chinese companies including Huawei, Hikvision, and Dahua. This indicated a surge to the ongoing tensions between U.S. & China and raised safe-haven appeal that weighed on riskier EUR/USD currency pair, and hence, the pair started to fell on Thursday.

On the data front, the German Trade Balance was released at 11:00 GMT that showed a surplus of 7.6B against the expected 6.6B in May and supported the single currency Euro that capped on additional losses in EUR/USD pair.

From the U.S. side, the Unemployment Claims for last week were reported at 17:30 GMT, as 1.314M against the expected 1.375M, and supported the U.S. dollar that added in the losses of EUR/USD pair. Though the numbers came in less than expectations, they were still very big, and hence, investors gave a little attention to this data on Thursday.

Daily Support and Resistance

  • R3 1.1459
  • R2 1.1406
  • R1 1.1368

Pivot Point 1.1315

  • S1 1.1278
  • S2 1.1224
  • S3 1.1187

EUR/USD– Trading Tip

The EUR/USD pair has violated an upward trendline, which extended support at 1.1291 level, and now, this level will work as a resistance for the EUR/USD. On the lower side, the double bottom may extend support at 1.1262 level. Below this, the next support can be seen around the 1.1240 level. Bearish bias seems dominant today.


GBP/USD – Daily Analysis

The GBP/USD pair was closed at 1.26060 after placing a high of 1.26639 and a low of 1.25952. Overall the movement of GBP/USD pair remained bearish throughout the day. The GBP/USD pair climbed to its highest level in three weeks in the earlier session on Thursday but failed to remain there and turned to the downside on the back of a strong U.S. dollar.

The greenback rose across the board as equity prices in the Wall Street Journal turned negative sharply right after the U.S. Supreme Court ruled that President Trump cannot block his financial records to prosecutors.

Donald Trump has come under fire for not making his tax returns public as his predecessors. His lawyers have argued that he enjoyed total immunity while in the White House office and that Congress had no valid justification for examining the records. The U.S. stocks turned lower, and U.S. yields also moved to the downside. The U.S. dollar rose, and the DXY bounced back from 4 weeks lowest level to 96.70 level.

On the data front, at 04:50 GMT, the RICS House Price Balance from Great Britain came in as -15% against the expected -25% in June and supported single currency Cable that limited the additional losses in the pair.

However, on the U.S. side, the Unemployment Claims were released at 17:30 GMT. In last week 1.314M Americans applied for jobless benefits against the expected 1.375M and supported the U.S. dollar added further in the losses of GBP/USD pair on Thursday.

On Brexit front, the top E.U. negotiator, Michel Barnier, said on Thursday that talks between E.U. & U.K. would continue later this month. The Brexit trade talks broke up early for the week as Barnier warned that “significant divergences” remain between them.

He also urged E.U. national governments at the same time to be prepared for disruption at the end of the year as chances for no-deal were still high. He said that to overcome the significant divergences between both parties, his team would continue to work with patience, respect, and determination.

 Daily Support and Resistance

  • R3 1.277
  • R2 1.2697
  • R1 1.2654

Pivot Point 1.2581

  • S1 1.2538
  • S2 1.2465
  • S3 1.2421

GBP/USD– Trading Tip

The GBP/USD is trading with a bearish bias, especially after crossing below 50 EMA support level of 1.2570. This level is now working as resistance, and the Cable can show further bearish bias below 1.2570 level. Closing below this level can lead the GBP/USD pair towards 1.25200 level. The MACD and RSI are holding in a selling zone, and the 50 EMA, which is providing resistance at 1.2570, is also demonstrating the strong sell signal. Let’s consider taking sell trades below 1.2570 level today. 


USD/JPY – Daily Analysis

The USD/JPY pair was closed at 107.199 after placing a high of 107.395 and 107.095. Overall the movement of USD/JPY remained bearish throughout the day. The USD/JPY pair rose in the earlier session on the back of U.S. dollar strength but couldn’t stay there due to strong Japanese Yen amid increased safe-haven demand and dropped to post losses.

On the data front, at 04:50 GMT, the Core Machinery Orders from Japan rose by 1.7% against the expected decline by 5.2% in May and supported Japanese Yen that weighed on USD/JPY pair. TheM2 Money Supply from Japan came in as 7.2% against the forecasted 5.6% and supported the Japanese Yen that added further in USD/JPY pair losses. At 10:59 GMT, the Prelim Machine Tool Orders came in line with the expectations of -32.0%.

From the U.S., at 00:00 GMT, the Consumer Credit for May showed a decline of 18.3B from the expected decline of 15.2B and weighed on the U.S. dollar that dragged the USD/JPY pair with itself. However, at 17:30 GMT, the U.S. Unemployment Claims for last week came in as 1.314M against the expected 1.375M and supported the U.S. dollar that helped limit losses in USD/JPY pair.

The U.S. dollar was strong across the board after the equities, and U.S. stocks in WSJ dropped to their lower levels due to the U.S. Supreme Court ruled that the New York prosecutors can examine Trump’s financial records.

Donald Trump was criticized for not making hid financial records, including tax returns public like his predecessors. At the same time, his lawyers argued that he was immune to publish those records while he was in office and that Congress had no justification for seeking those records.

But on Thursday, U.S. Supreme Court ruled that President Trump cannot block the release of his tax returns and financial records to prosecutors.

On the other hand, data revealed that coronavirus had affected more than 3 million Americans so far, with a daily record of more than 60,000 cases and death tolls around 134,000.

Meanwhile, the U.S. & China relations also remained under highlights as the US Trump administration announced that this week the regulations would be finalized to block the U.S. government. The U.S. seems to restrict buying goods & services from any company that uses products from five Chinese companies, including Huawei, Hikvision, and Dahua. This also weighed on market tone and added in USD/JPY pair’s losses.

Support and Resistance    

  • R3 108.1
  • R2 107.91
  • R1 107.59

Pivot Point 107.39

  • S1 107.07
  • S2 106.87
  • S3 106.55

 USD/JPY – Trading Tips

The USD/JPY was consolidating in a broad trading range of 107.800 to 107.250, which was finally violated. The pair is now holding at 106.850, and this is going to provide solid support to the USD/JPY pair for now. However, this level’s bearish breakout has a huge odds of driving more selling until 106.450 level today. At the moment, the pair is trading with a selling bias of above 106.850 support. The USD/JPY is dropping below 50 periods EMA on the hourly charts, which supports the Japanese pair’s selling bias. Let’s look for selling trades below 107.250 today. Good luck! 

Categories
Forex Market Analysis

Daily F.X. Analysis, July 09 – Top Trade Setups In Forex – Trade Plans to Follow! 

On the news front, traders will keep their focus on the German trade balance, and U.S. Jobless Claims data in order to predict further price action in the market. Both events are expected to perform better than before and may help positive moves in the U.S. dollar.

Economic Events to Watch Today 


EUR/USD – Daily Analysis

A day before, the EUR/USD pair was closed at 1.13294 after placing a high of 1.13516 and a low of 1.12621. Overall the movement of the EUR/USD pair remained bullish throughout the day. The EUR/USD pair rose on Wednesday due to the U.S. economy’s gloomy look after a rising number of infection cases from the U.S. Despite growing fears over a possible second wave of coronavirus in the U.S., the market’s risk sentiment improved. Investors have weighed hopes in favor of a swift economic recovery despite signs of a pandemic resurgence.

The Greenback has been increasingly compromised by the growing doubts over its safe-haven status, as the Chinese economy was improving quickly while the U.S. was still facing the prospect of the second wave. The EUR/USD pair edged higher on Wednesday against the U.S. dollar despite concerns that Eurozone’s economy could be headed for an additional recession than previously forecasted.

According to E.U. Commission Vice President Valdis Dombrovski, the European economy was facing many risks, including the second wave of coronavirus. The report of the E.U. Commission indicated that the rising number of infection cases in the U.S. and other markets had deteriorated the global outlook, and it could drag the European economy with itself.

However, in the absence of Eurozone economic data on Wednesday and the presence of safe-haven demand, the investors lost confidence in the U.S. dollar because of America’s struggling economy. And with the Euro being a direct competitor of the U.S. dollar, investors turned towards it and benefited single currency Euro, which ultimately pushed the EUR/USD pair.

On Wednesday, Spain and Italy’s leaders called for a strong response from the European Union to the economic crisis triggered by COVID-19. Ten days ahead of the E.U. Summit, where leaders of member countries will try to reach a deal on 750 B euros COVID-19 recovery package and the long-term E.U. budget, Italian PM met its Spain counterpart on Wednesday. 

On the other hand, German Chancellor Angela Merkel on Wednesday urged E.U. countries to show unity and overcome differences to approve a massive coronavirus recovery plan in E.U. Summit. However, the gains were limited due to recent forecasts of and 8.7% contraction in the Eurozone economy this year. This weighed on the single currency and limited the daily gains in EUR/USD pair.

On Thursday, Euro traders will look forward to the release of German Trade data. Any improvement in the Eurozone powerhouse economy export will push the pair EUR/USD higher further. Meanwhile, the U.S. employment data will be under close observation by the traders to take fresh impetus. The EUR/USD pair will be driven by Eurozone economic data for the rest of the week. Any signs of economic recovery in the Eurozone area will provide support to the persisting gains.

Daily Support and Resistance

  • R3 1.1459
  • R2 1.1406
  • R1 1.1368

Pivot Point 1.1315

  • S1 1.1278
  • S2 1.1224
  • S3 1.1187

EUR/USD– Trading Tip

The EUR/USD pair has violated the triple top resistance level of 1.1340 level, and above this, the pair has the potential to go after the 1.1405 resistance area. A bullish breakout of 1.1405 level can extend buying until 1.1489. Stay tuned to our forex signals; we will share more signals as soon as the market shows some movement. 


GBP/USD – Daily Analysis

The GBP/USD pair was closed at 1.26092 after placing a high of 1.26229 and a low of 1.25085. Overall the movement of GBP/USD pair remained bullish throughout the day. The GBP/USD exchange rate rose for the 4th consecutive day on Wednesday and reached 1.26229 level on the back of decreased demand for the U.S. dollar and a new stimulus package from the U.K. government.

The UK Chancellor Rishi Sunak said on Wednesday that U.K. would cut VAT on hospitality as part of a 3 Billion British Pound plan to prevent mass unemployment that was caused by the coronavirus pandemic.

He also announced that the U.K. government would pay firms a 1000 pounds bonus for every staff member they kept for three months when the furlough scheme will end in October. He also announced a scheme which will give 50% off to the people dining out in August. He added that he would cut VAT on food, accommodation, and attractions from 20% to 5% from next Wednesday. Mr. Sunak warned that hardships were ahead but also vowed that no-one would be left without hope.

The Chancellor refused to extend the furlough scheme beyond October as it would provide false hope to people that they will return to their jobs. Longer, the people remain on furlough; the more likely their sill could fade.

Mr. Sunak said that the U.K. would cut stamp duty on house purchases of up to 500,000 British pounds. The government will also invest an extra 1B pound in the work & pension department to support unemployed people.

After the 30 B pound stimulus package announcement, the GBP currency got some support and lifted GBP/USD pair a little.

On Brexit front, the U.K. government was seeking to agree “special provisions” with the European Union over food supply to Northern Ireland from the U.K. This provided some optimism over the Brexit and compromised deal. However, prospects of no-deal were also there in the market as the U.K. has said that it would go for Australian-style agreement if the end of the transition period secured no deal.

Meanwhile, the U.S. dollar was under pressure as its safe-haven status was compromised due to the pandemic’s struggling American economy. The U.S. Dollar Index was slipped 0.5% at 96.40 on Wednesday and weighed on the U.S. dollar. The weak U.S. dollar in the wake of an increased number of coronavirus cases from the U.S. gave a push to the already increasing GBP/USD pair on Wednesday.

 Daily Support and Resistance

  • R3 1.277
  • R2 1.2697
  • R1 1.2654

Pivot Point 1.2581

  • S1 1.2538
  • S2 1.2465
  • S3 1.2421

GBP/USD– Trading Tip

The GBP/USD is trading with a bullish bias, especially after violating the resistance level of 1.2570 level. For now, this level is working as support, and the Cable can show further bullish bias above 1.2570 level to lead the GBP/USD pair towards 1.2680 level. The MACD and RSI are holding in a buying zone and the 50 EMA, which also supports the pair’s buying trend. The recent candles are also bullish, as it seems like the traders are looking to enter fresh long entries over 1.2630 level. Let’s consider taking buying trades today. 


USD/JPY – Daily Analysis

The USD/JPY pair was closed at 107.257 after placing a high of 107.709 and 107.200. Overall the movement of the USD/JPY pair remained bearish throughout the day. On Wednesday, at the Department of Education, U.S. Vice President Mike Pence claimed progress against COVID-19 even the infections topped 3 Million in numbers. In reply to the hiked number of cases from Florida, Arizona, and Texas, Mike Pence said that these were the early indications of a percent positive testing.

Pence joined President Trump in his push for reopening schools as it was needed not just for educating kids but also for the workforce and providing essential services. He also announced plans for new CDC guidelines after President Trump criticized public health agency for its impractical instructions to reopen schools. Donald Trump warned schools on Wednesday that if they do not open in fall 2020 due to coronavirus pandemic, he may cut off government funding.

Pence said that the national death rate from coronavirus was lowered compared to before and said that early indications for positive testing from three major states were flattening. Pence and Trump’s statement pushed he equities back into upward trend and decreased the demand for safe-haven U.S. dollar, downed the U.S. Dollar Index to 96.47 level, and added in the downward trend of USD/JPY.

The U.S. dollar was already under pressure due to the rising number of coronavirus cases, which affected the U.S. economic outlook as it was struggling heavily to fight the pandemic. This compromised the safe-haven U.S. dollar status, and hence U.S. dollar lost its demand in the market, which dragged the USD/JPY pair with itself.

However, the safe-haven Japanese Yen was stronger against the U.S. dollar on the back of increased demand for safe-haven during uncertainty related to coronavirus and positive macroeconomic data from Japan on Wednesday, which helped to add losses in USD/JPY pair. On the data front, at 4:50 GMT, the Bank Lending for the year from Japan surged to 6.2%from the forecasted5.0% and supported the Japanese Yen, which ultimately pushed the already rising USD/JPY pair prices further.

The Current Account Balance from Japan showed a surplus of 0.82T against the forecasted 0.71T and supported the Japanese Yen. At 10:00 GMT, the Economy Watchers Sentiment for June from Japan also increased to 38.8 from the forecasted 24.7 and supported Japanese Yen that added in the bearish trend of USD/JPY pair.

Support and Resistance    

  • R3 108.1
  • R2 107.91
  • R1 107.59

Pivot Point 107.39

  • S1 107.07
  • S2 106.87
  • S3 106.55


USD/JPY – Trading Tips

The USD/JPY is consolidating in a wide trading range of 107.800 to 107.250. At the moment, the pair is trading with a selling bias of below 107.80 resistance. On the hourly charts, the USD/JPY is dropping below 50 periods EMA, which supports the Japanese pair’s selling bias. It seems like we have a margin to capture quick 25 pips in USD/JPY as the pair moves within a sideways range and has odds of the testing support level of 107.250. Good luck! 

Categories
Crypto Market Analysis

Daily Crypto Review, July 9 – TikTokers Causing Dogecoin’s Surge; Cryptos Make Another Move Up

The cryptocurrency market made another slight move towards the upside in the past 24 hours. Bitcoin is currently trading for $9,414, which represents an increase of 1.39% on the day. Meanwhile, Ethereum gained 2.91% on the day, while XRP gained 3.34%.

 Daily Crypto Sector Heat Map

When talking about top100 cryptocurrencies, Holo gained 40.15% on the day, making it by far the most prominent daily gainer. Stellar (20.70%) and Nervos Network (16.73%) also did great. On the other hand, Quant has lost 11.42%, making it the most prominent daily loser. It is followed by SwissBorg’s loss of 6.36% and Cardano’s loss of 6.16%.


Top 10 24-hour Performers (Click to enlarge)

Bottom 10 24-hour Performers (Click to enlarge)

Bitcoin’s dominance level increased since we last reported, with its value currently at 63.39%. This value represents a 0.14% difference to the upside when compared to yesterday’s value.

Daily Crypto Market Cap Chart

The cryptocurrency market capitalization increased slightly when compared to when we last reported, with the market’s current value being $275.70 billion. This value represents an increase of $3.55 billion when compared to the value it had yesterday.

_______________________________________________________________________

What happened in the past 24 hours?

_______________________________________________________________________

_______________________________________________________________________

Technical analysis

_______________________________________________________________________

Bitcoin

The largest cryptocurrency by market capitalization has made another move towards the upside as bulls gathered up. The price managed to push above the descending trend line and reach just shy of $9,500 before returning down to test the newly conquered line as a support level. The line was tested successfully, and Bitcoin seems like it’s consolidating at the $9,400 level.

As mentioned yesterday, the descending line forced a move on Bitcoin, which ended up in BTC crossing to the upside. As with most BTC trades, trading confirmations and pullbacks are the safest way to profit.

BTC/USD 4-hour Chart

Technical factors:

  • Price is above its 50-period EMA and its 21-period EMA
  • Price is between the upper B.B. and middle line (20-period SMA)
  • RSI at the upper levels (65.5)
  • Increased volume (returning to average)

Key levels to the upside          Key levels to the downside

1: $9,580                                 1: $9,251

2: $9,735                                 2: $9,120

3: $9,870                                  3: $8,980

Ethereum

Ethereum made a move towards the upside as well. In fact, it broke a much stronger resistance level than Bitcoin. The ascending resistance level was broken as volume skyrocketed, but the price fell back under it during the confirmation period. However, Ethereum passed to the upside again, where it is now. It is important to note that this price level is unstable because it has not been properly confirmed, as well as because the line is moving sharply towards the upside, which Ethereum might not be able to follow for a long period of time.

Ethereum traders should look for an opportunity to trade around the ascending line (possibly when ETH falls back under it again).

ETH/USD 4-hour Chart

Technical Factors:

  • Price above the 50-period EMA and the 21-period EMA
  • Price slightly below the upper B.B.
  • RSI almost in the overbought territory (68)
  • Increased volume

Key levels to the upside          Key levels to the downside

1: $240                                    1: $228

2: $251.4                                 2: $225.4

3: $260                                     3: $217.7

Ripple

The third-largest cryptocurrency by market cap had much more uniformed moves. After days of almost no volume and volatility, the past couple of days have been extremely interesting for XRP’s price. XRP managed to break the $0.19 resistance (now support) yesterday, while its most recent spike brought its price above $0.2. However, the move got stopped at the $0.205 resistance level a couple of times, so XRP is now trading within a small range.

XRP traders can look for an opportunity to trade now since XRP is trading within a range bound by $0.2 and $0.205.

XRP/USD 4-hour Chart

Technical factors:

  • XRP in a mid-term descending trend (though it broke the trend in the short-term)
  • XRP lacks strong support levels below $0.178
  • Price is above the 21 and 50-period EMA
  • Price slightly below the upper B.B.
  • RSI is in the overbought territory (71)
  • Increased volume

Key levels to the upside          Key levels to the downside

1: $0.205                                  1: $0.2

2: $0.214                                  2: $0.19

3: $0.227                                 3:$0.178


Categories
Forex Chart Basics Forex Daily Topic Forex Price-Action Strategies

Spotting Out Support/Resistance is an Art

Support/Resistance levels are one of the most important factors in trading. In today’s lesson, we are going to demonstrate an example of adjustment in determining the support/resistance level.

Forex market gets volatile from time to time. It often produces spikes. Sometimes traders have to count those spikes to determine support/resistance level, and sometimes they do not have to do that. We try to learn when we have to count, and when we do not have to count those.

This is an H1 chart. However, any chart may look like this. If we are to draw support/resistance levels here, we may find out the two most significant points where the price bounces and where it gets a rejection from. Let us proceed to the next chart with those two lines.

Look at the level of drawn support. The price bounces at the level and produces a bullish inside bar. It comes back at the level and bounces twice. At the second bounce, it produces a long lower shadow and heads towards the North. We may skip counting the spike here and draw the level of support at where the price produces a bullish inside bar and bounces twice later.

Look at the level of resistance. This is where we have counted spikes since the price reacts at the level earlier. However, we may have to adjust it later. We will be able to find this out later as far as price action is concerned.

When the price comes back down, it breaches the level of support and produces a good bullish candle. However, there is a gap, and the price goes back within the previous level of support. Thus, we may still consider the drawn level as a significant level of support.

The price heads towards the North and breaches the level of drawn resistance. The price comes back within the drawn level again. The drawn level is still a significant level of resistance since the price reacts to it. However, we have a new highest high, which must be counted.

The price heads towards the South and reacts to the level of drawn support again. Upon producing a bullish inside bar, it heads towards the North again. Here are two questions.

  1. Where would you set your take profit level as a buyer?
  2. Do you have anything else to do here?

As a buyer, you may consider taking your profit at the previously drawn level. Here we have drawn the level of resistance with a little adjustment. Have you noticed it? Yes, this is what you have to do. Spotting out significant points and monitoring price action around them are two most important things to be able to make adjustments with the support/resistance level. To be able to trade accordingly, we often need to do this. Thus, we must learn the art of adjusting the support/resistance level.

Categories
Forex Basic Strategies

How To Trade The ‘Higher High Failure’ Countertrend Strategy?

Introduction

There are millions of strategies out there in the market. Some work exceptionally well, while some fail miserably. Trading successfully is not about knowing several strategies, but about one strategy that works consistently. All professional traders are never in the hunt for trying out different strategies. They have expertise in a single strategy and know when to apply it and when not to.

Here, in this article, we shall be walking you through a simple yet extremely strategy that both day and positional traders can apply. Besides, we will enlighten you on the dos and don’ts of the strategy.

Understanding a Trend

The most evident state of the market is a trend. It is indeed the best state to trade as one can easily bet on the market’s direction. In technical terms, the trend is the state of the market, where the price makes higher-highs/higher-lows or lower-lows/lower-highs.

A trend alone can be of different types – based on the pattern. The above image of a trend is how an ideal trend looks like. However, the number of occurrences of this type of trend is very less. Apart from the ideal trending market, we can have other types of the same state.

Figure 1: In this type, the market breaks about the Support and Resistance (purple line), retraces through the line, and then makes another higher high.

Figure 2: Here, the market makes a HH by breaking about the S&R (purple line), pulls back insignificantly, away from the S&R, and makes a higher high.

Figure 3: The market made HH passing through the S&R, retraced a little, tried to make a higher high, and failed. Later, it retraced more than the previous time, and then successfully made a HH.

What is the ‘Higher High Failure’ Countertrend Strategy?

The “Higher High Failure” countertrend strategy is based on the third figure of the above image. It is named countertrend because the overall trend of the market is up, but the strategy is to take a short position.

According to the strategy, in an uptrend, if the market fails to make a higher high on the very first attempt, then one can prepare to go short on the security.

Logic

In a sequence of higher highs and higher lows, if the market fails to break above the recent HH, it is an indication that the trend is preparing for another push down before heading up. The failure also indicates that the buyers are not strong enough to push the market higher with one retracement. Since the buyers are slowing down, one can swing down from the seller before the market resumes its trend. Note that the length of this south wing depends on the strength difference of the buyers are sellers.

Trading the Higher High Failure Strategy

Consider the below chart of Euro / US Dollar on the 1H time frame. We can see that the market is in an uptrend making higher highs and higher lows.

The most recent higher high made by the market was 1.11834. The market then retraced to 1.1098, tried to make a new high from the previous one, but failed by leaving a wick on the top.

The failure to make a higher high indicates that the buyers are losing momentum, and as a result, the sellers could temporarily take over the market. In addition, the wick on the top at the resistance area signifies the strength of the sellers. Thus, right after the price shoots down at holds below the S&R (grey ray), one can go short on the pair.

Take Profit Placement

Since the buyers shot up from 1.10988 the previous, we can expect a reaction from the same level. Hence, 1.10988 would be the safest level to place the take profit level. If the sellers are strong in momentum, one can ride down until the S&R.

Stop Loss Placement

Stop-loss few pips above the wick can keep you away from getting stopped out. But it is risky to keep the stop loss right above the resistance level.

On the flip side, this strategy will work like a charm on a downtrend as well. For a downtrend, the strategy could be termed as a “Lower Low Failure” countertrend strategy. Let’s take an example of the same and understand how to trade a down-trending market.

In the below chart of GBP/CAD, we can see that the market is in a downtrend, making lower lows and lower highs. Level 1.70006 was the most recent LL. The market retraced to the S&R and tried to make a new LL but failed. During the failure to make a LL, a spinning top candle appeared, which was then followed by a bullish candle to close above the LL level. This confirms that the sellers are have temporarily faded out, and the buyers are going take over the market.

Take Profit Placement

Take profit can be placed at the price where the market tried to make a lower low previously. In this example, the TP would be at the S&R.

Stop Loss Placement

The safest stop loss for this strategy would be right below the price where it failed to make a LL.

Important Points to Note

  • The price should attempt to make a higher high and fail. The strategy cannot be considered for an equal high.
  • After the failure to make HH, the price should hold below the S&R level.
  • The strategy will not work if the price makes HH, holds, and then drops below the S&R.
  • Since it is countertrend trade, make sure to take profits at every hurdle.
  • The stop loss must be above the high of the higher high failure, NOT right at the resistance.

We hope you found the strategy interesting and useful. Do test it out in the live market and let us know the results in the comment section below. Cheers!

Categories
Crypto Market Analysis

Daily Crypto Review, July 8 – BTC Will Never Be Private; XRP Skyrocketing

The cryptocurrency market has had more of a steady day as cryptos were trying to find a level to consolidate at. Bitcoin is currently trading for $9,300, which represents an increase of 0.37% on the day. Meanwhile, Ethereum gained 1.61% on the day, while XRP gained 2.43%.

 Daily Crypto Sector Heat Map

When talking about top100 cryptocurrencies, Dogecoin gained 54.43% on the day, making it by far the most prominent daily gainer. Cardano (27.36%) and VeChain (18.52%) also did great. On the other hand, SwissBorg has lost 6.68%, making it the most prominent daily loser. It is followed by KuCoin Shares’s loss of 5.48% and Verge’s loss of 4.84%.

Top 10 24-hour Performers (Click to enlarge)

Bottom 10 24-hour Performers (Click to enlarge)

Bitcoin’s dominance level decreased since we last reported, with its value currently at 63.25%. This value represents a 0.88% difference to the downside when compared to yesterday’s value.

Daily Crypto Market Cap Chart

The cryptocurrency market capitalization increased slightly when compared to when we last reported, with the market’s current value being $272.15 68.74 billion. This value represents an increase of $3.41 billion when compared to the value it had yesterday.

_______________________________________________________________________

What happened in the past 24 hours?

_______________________________________________________________________

_______________________________________________________________________

Technical analysis

_______________________________________________________________________

Bitcoin

The largest cryptocurrency by market capitalization has spent the day trying to find a place to consolidate at, as it seems like the move towards the upside ended as soon as BTC approached the descending line). While Bitcoin found support at $9,251, its support level and resistance level will soon clash, and Bitcoin will have to make a move.

Traders should look for what happens with Bitcoin’s price when the descending line forces a move on BTC.

BTC/USD 4-hour Chart

Technical factors:

  • Price is above its 50-period EMA and its 21-period EMA
  • Price is between the upper B.B. and middle line (20-period SMA)
  • RSI at the upper levels (61)
  • Average Volume

Key levels to the upside          Key levels to the downside

1: $9,251                                 1: $9,120

2: $9,580                                 2: $8,980

3: $9,735                                  3: $8,820

Ethereum

Ethereum’s is in a slightly different spot when compared to Bitcoin. While its price advances have been stopped by the non-horizontal resistance level, Ethereum’s resistance line is going towards the upside. That opens up a lot of possibilities as ETH isn’t forced to make a move, but might rather choose to follow the line up.

Ethereum traders should look for an opportunity in range trading between the immediate support and resistance levels.

ETH/USD 4-hour Chart

Technical Factors:

  • Price above the 50-period EMA and the 21-period EMA
  • Price slightly below the upper B.B.
  • RSI almost in the overbought territory (67)
  • Increased volume

Key levels to the upside          Key levels to the downside

1: $240                                    1: $228

2: $251.4                                 2: $225.4

3: $260                                     3: $217.7

Ripple

The third-largest cryptocurrency by market cap had an extremely volatile day. XRP managed to skyrocket from $0.183 all the way to $0.2 in one 4-hour candle. The move got stopped by the $0.2 resistance, under which XRP is currently consolidating. While it is highly likely that the move will end here, we might see an attempt of breaking $0.2 yet again.

XRP traders should wait and see what XRP does and look for retracements.

XRP/USD 4-hour Chart

Technical factors:

  • XRP in a mid-term descending trend (though it broke the trend in the short-term)
  • XRP lacks strong support levels below $0.178
  • Price is above the 21 and 50-period EMA
  • Price at the upper B.B.
  • RSI is in the overbought territory (79)
  • Increased volume

Key levels to the upside          Key levels to the downside

1: $0.19                                    1: $0.178

2: $0.2                                      2: $0.147

3: $0.205


Categories
Forex Market Analysis

Daily F.X. Analysis, July 08 – Top Trade Setups In Forex – Trade Plans to Follow! 

On the news side, we don’t have much to focus on due to a lack of economic events. However, the trading levels and technical outlook will be worth watching today. Crude oil inventories can drive price action in crude oil prices.

Economic Events to Watch Today 


EUR/USD – Daily Analysis

The EUR/USD pair was closed at 1.12741 after placing a high of1.13323 and a low of 1.12585. Overall the movement of the EUR/USD pair remained bearish throughout the day. The EUR/USD pair started to fall on Tuesday on the back of many factors, including negative macroeconomic data from Europe, downbeat comments from E.U. Commission, Chinese stock surge, and an increasing number of coronavirus cases across the world.

On the data front, at 11:00 GMT, the German Industrial Production for May dropped to 7.8% from the expected 11.0% and weighed on Euro. At 11:45 GMT, the French Trade Balance for May showed a deficit of 7.1B against the expected 4.5B deficit and weighed on single currency Euro and dragged the pair EUR/USD on the downside. At 13:02 GMT, the Italian Retail Sales for May surged by 24.3% from the expected 15.0% and supported single currency Euro.

On the U.S. side, at 18:59 GMT, the IBD/TIPP Economic Optimism for July dropped to 44.0 from the forecasted 48.2 and weighed on the U.S. dollar. At 19:00 GMT, the JOLTS Job Openings in May were reported as 5.40M against the expected 4.70M and supported the U.S. dollar and added further in the downward trend of EUR/USD pair.

The European Commission said on Tuesday that the E.U. would likely suffer a deeper contraction in 2020 than previously expected, while 2021 recovery will also be weaker than forecast. The E.U. Commission expected EU GDP to contract by 8.3% in 2020, and in 2021 an expansion by 5.8% was expected. However, previously the contraction was forecasted to be 7.75 in 2020, and the growth in 2021 was predicted as 6% by the commission. 

The change in the forecast was made due to the government’s slow efforts to lift lockdown measures than expected. An executive vice president of the Commission, Valdis Dombrovskis said that the lockdown’s economic impact was more severe than it was initially expected. He said that many risks were still present in the economy, including another major wave of infection. Italy, Spain, and France’s economies were expected to get the worst-hit by the pandemic this year as the GDP contraction for these were expected as 11.2%, 10.9%, and 10.6%, respectively. However, Germany’s economy was expected to contract by 6.3% this year as per the E.U. Commission’s latest forecast.

According to the commission, the worst may have passed as of May, and June’s economic data came in mostly positive. The recovery will likely gain traction in the second half of this year, while inflation was expected to average 0.3% this year and 1.1% in 2021, said by E.U. Commission on Tuesday. The downbeat forecast and comments from E.U. Commission on Tuesday weighed heavily on single currency Euro and caused the pair EUR/USD to lose almost all of its gains from yesterday.

Daily Support and Resistance

  • R3 1.1463
  • R2 1.1405
  • R1 1.1356

Pivot Point 1.1298

  • S1 1.125
  • S2 1.1191
  • S3 1.1143

EUR/USD– Trading Tip

The EUR/USD is trading above a strong support level of 1.1265 level, and closing the Doji and bullish engulfing candle above this level may drive the buying trend in the EUR/USD pair. On the higher side, the next resistance is likely to be found around the 1.1303 level. But in case, the pair violates 1.1265 support, the next support is likely to stay around 1.1225 level.


GBP/USD – Daily Analysis

The GBP/USD pair was closed at 1.25432 after placing a high of 1.25920 and a low of 1.24624. The GBP/USD pair rose for 3rd consecutive day on Tuesday and reached near 1.2600 level, highest since June 16, 2020, on the back of fresh hopes that the E.U. might compromise on fisheries policy to reach the Brexit trade deal.

British Pound rose to 3 weeks highest level on the back of news that chief Brexit negotiator of U.K. would meet the Michel Barnier ahead of the next round of talks. To discuss some of the trickier parts of negotiations, David Frost will have dinner on Tuesday night with Barnier.

The dinner between both Brexit negotiators will be seen as an opportunity for both sides to clear issues in an informal setting. As they will be informal talks, the agenda will include the range of the problems that need to reach an agreement from the level playing field, fishing waters, to governance structures.

Some other reports came in the market related to fresh hopes for the Brexit deal as the E.U. showed a willingness to compromise on fisheries policy. Michel Barnier said that Brussels would support a U.K. proposal to divide fishing quotas according to data that reflects the number of fish in Britain waters.

After the failure of last week’s round of Brexit talks, this news raised new hopes that a deal could be reached before transition periods end. This gave strength to British Pound, which ultimately pushed GBP/USD pair higher on Tuesday.

Fisheries have long been a point of argument for both sides as Britain has been asking for a system based on yearly quotas, while Brussels has said that any deal had to be part of a larger comprehensive trade agreement.

On the data front, at 12:30 GMT, the Halifax HPI for June from the U.K. came in as -0.1% against the forecasted -0.8% and supported British Pound. It ultimately raised the GBP/USD pair on Tuesday.

On the U.S. side, at 18:59 GMT, the IBD/TIPP Economic Optimism declined to 44.0 from the forecasted 48.2 in June and weighed on the U.S. dollar and supported the GBP/USD pair’s bullish trend.

At 19:00 GMT, the JOLTS Job Openings increased to 5.40M against the expected 4.70M in May and supported the U.S. dollar, which kept the gains in GBP/USD pair limited.

 Daily Support and Resistance

  • R3 1.2584
  • R2 1.2553
  • R1 1.2523

Pivot Point 1.2491

  • S1 1.2461
  • S2 1.2429
  • S3 1.24

GBP/USD– Trading Tip

The GBP/USD is trading with a bullish bias, especially after violating the double top resistance level of 1.2530 level. The same level is working as support, and the Cable can show bullish bias above this level today to lead the pair towards 1.2580 level. The MACD and RSI are holding in a buying zone and the 50 EMA, which also supports the buying trend in the pair. The recent candles are neutral, as it seems like the traders are looking to stay bullish over 1.2530 level. Let’s consider taking buying trades today. 


USD/JPY – Daily Analysis

The USD/JPY pair was closed at 107.524 after placing a high of 107.789 and 107.244. Overall the movement of the USD/JPY pair remained bullish throughout the day. The dollar edged higher against Japanese Yen on Tuesday amid negative macroeconomic data from Japan and a combination of some other factors supporting the U.S. dollar.

The rising number of COVID-19 cases in the U.S. kept the market sentiment on the upside as Florida reported 7,347 new cases, and Arizona reported 3,653 new cases on Tuesday. The second wave of coronavirus was causing a surge in the hopes for renewed lockdown restrictions in the U.S. as well. However, Australia, Spain, and Serbia imposed renewed lockdown in their areas where the spread of COVID-19 was needed to control.

The second round of lockdown restrictions from countries across the globe raised hopes that further stimulus measures will be needed from central banks to support the economy. This gave a push to U.S. Dollar prices on Tuesday, and the pair USD/JPY started posting gains.

On the data front, at 4:30 GMT, the Average Cash Earnings from Japan for the year decreased to -2.1%from the expected -0.9% and weighed on Japanese Yen. The Household Spending from Japan also decreased to -16.2% from the forecasted -11.8% and weighed on Japanese Yen and added further strength in the rising USD/JPY prices. At 10:00 GMT, the Leading Indicators from Japan remained flat with the expectations of 79.3%.

On the U.S. side, at 18:59 GMT, the IBD/TIPP Economic Optimism for July declined to 44.0 from the anticipated 48.2 and weighed on the U.S. dollar. At 19:00 GMT, the JOLTS Job Openings in May were recorded as 5.40M against the forecasted 4.70M and supported the U.S. dollar and ultimately raised USD/JPY pair further.

Meanwhile, on Tuesday, China’s foreign ministry announced that China had joined a global arms trade treaty at the U.N. that was rejected by the United States. The foreign ministry spokesman, Zhao Lijian, said that all the legal procedures to join the treaty were completed, and it will be effective after 90 days.

As per the treaty, it requires the member countries to keep records of international transfer of weapons and to prohibit cross-border shipments that could be used in human rights violations or attacks on civilians. Beijing committed to the treaty efforts on Tuesday to improve peace and stability in the world. Apart from this, reports suggested on Tuesday that scientists were calling for the WHO to acknowledge that coronavirus could spread in the air. This would change the current measures being taken to stop the virus spread.

Support and Resistance    

  • R3 108.21
  • R2 108
  • R1 107.69

Pivot Point 107.47

  • S1 107.16
  • S2 106.94
  • S3 106.63


USD/JPY – Trading Tips

The USD/JPY is consolidating in a wide trading range of 107.800 to 107.250. At the moment, the pair is trading with a selling bias of below 107.80 resistance. On the hourly charts, the USD/JPY is dropping below 50 periods EMA, which supports the selling bias in the Japanese pair. It seems like we have a margin to capture quick 25 pips in USD/JPY as the pair moves within a sideways range and has odds of the testing support level of 107.250. Good luck!