
The cryptocurrency market spent the weekend recovering from the descending trend that brought Bitcoin to $9,000. Bitcoin is currently trading for $9,200, which represents an increase of 0.15% on the day. Meanwhile, Ethereum gained 1.51% on the day, while XRP lost 0.49%.

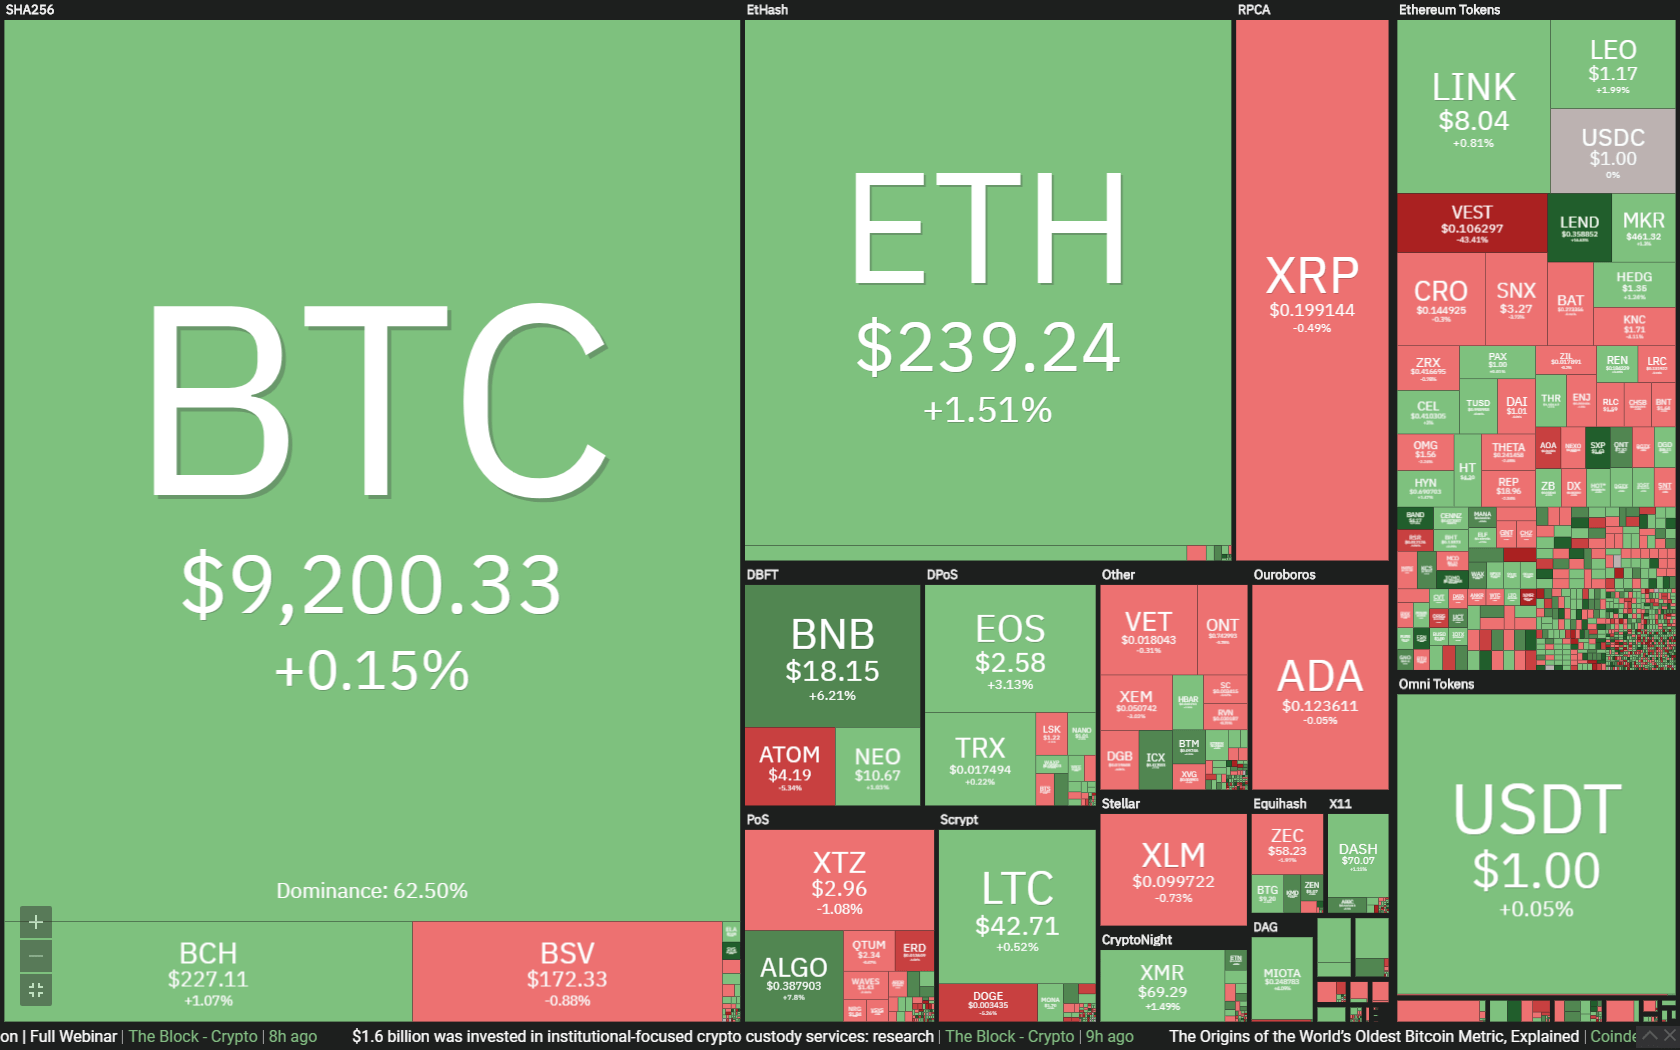
Daily Crypto Sector Heat Map
When talking about top100 cryptocurrencies, Band Protocol gained 39.23% on the day, making it by far the most prominent daily gainer. Terra (30.63%) and Swipe (28.00%) also did great. On the other hand, Flexacoin has lost 31.16%, making it the most prominent daily loser. It is followed by iExec RLC’s loss of 11.66% and Reserve Rights’ loss of 10.95%.
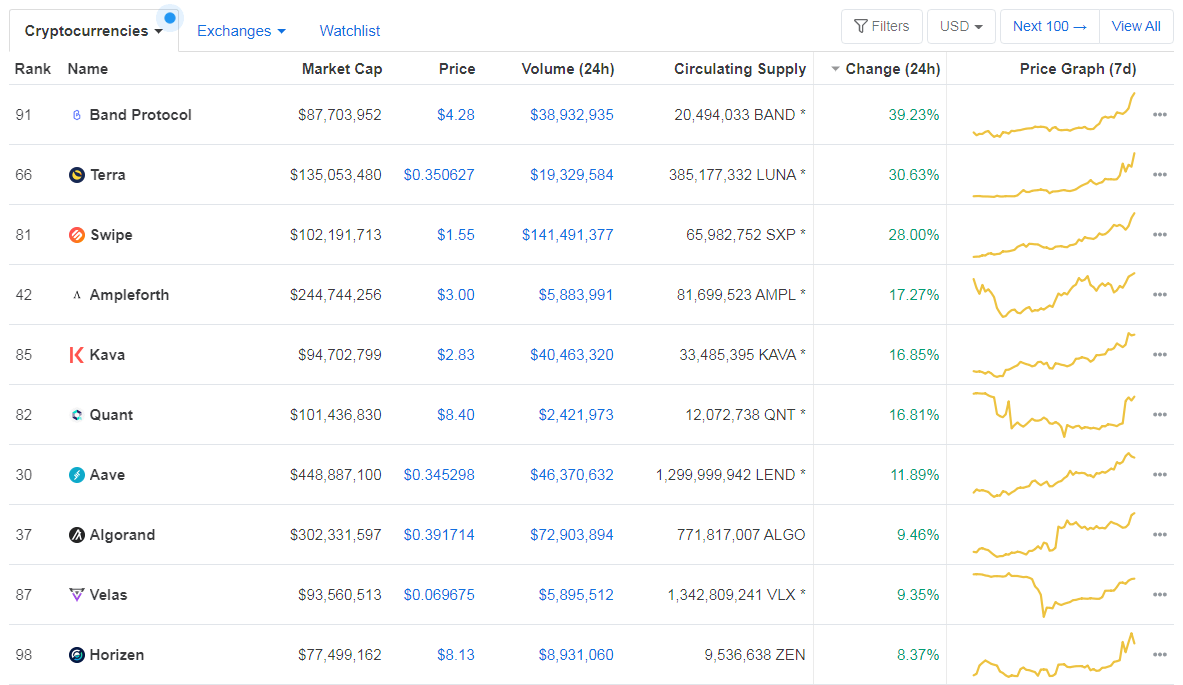
Top 10 24-hour Performers (Click to enlarge)
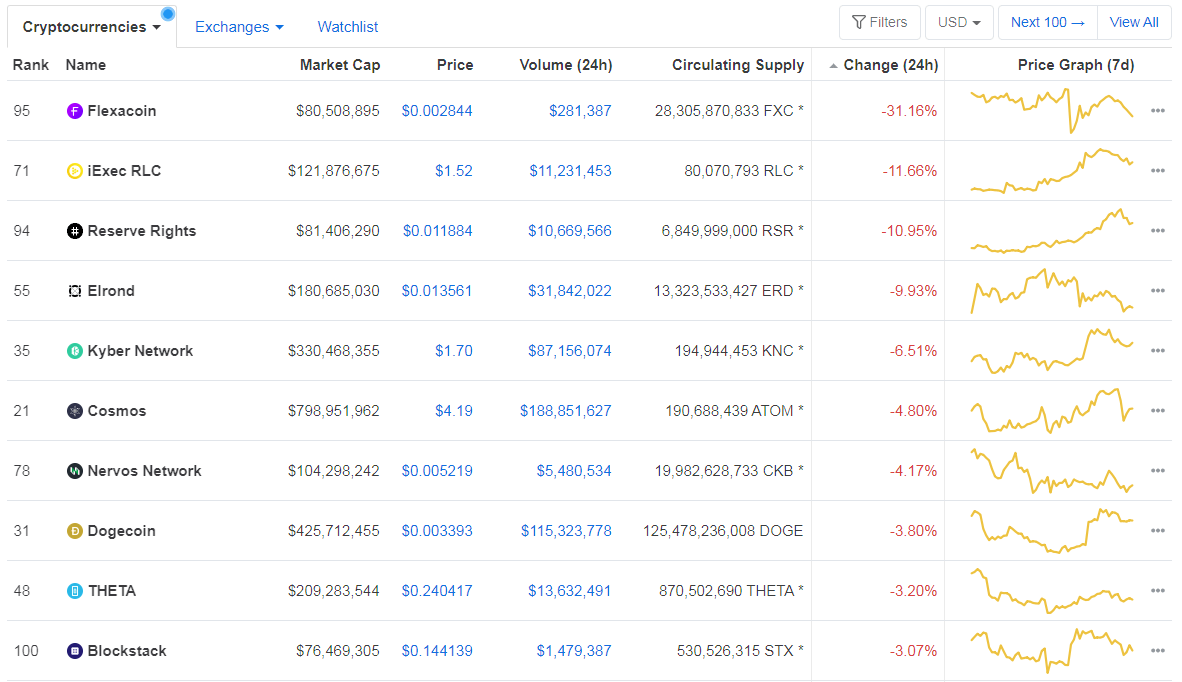
Bottom 10 24-hour Performers (Click to enlarge)
Bitcoin’s dominance level increased slightly since we last reported, with its value currently at 62.5%. This value represents a 0.33% difference to the downside when compared to Friday’s value.
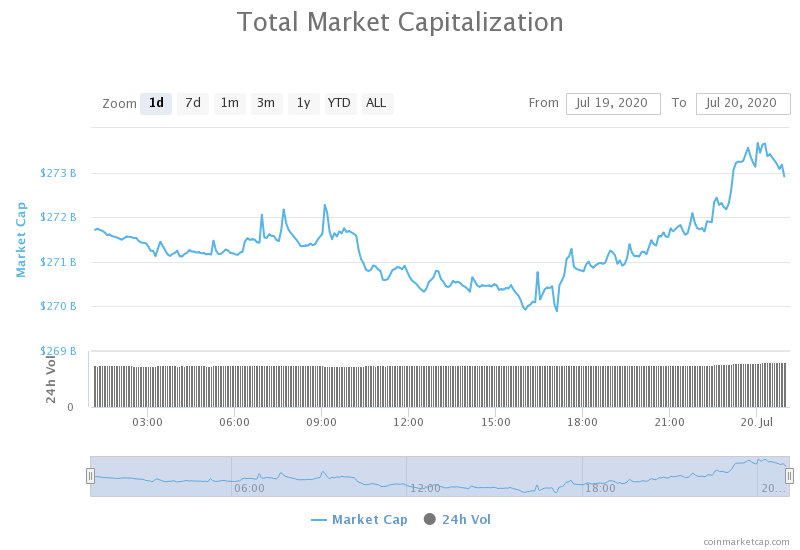
Daily Crypto Market Cap Chart
The cryptocurrency market capitalization increased slightly when compared to when we last reported, with the market’s current value being $272.69 billion. This value represents an increase of $3 billion when compared to the value it had on Friday.
_______________________________________________________________________
What happened in the past 24 hours?
_______________________________________________________________________
- Crypto Long & Short: Why the Twitter Hack Was Good for Bitcoin (and It’s Not the Media Attention) (Coindesk)
- New Standard to Avoid Ethreum Contract Size Limitation Developed (Cointelegraph)
- ‘Worthless Coin’ — McAfee Says He Never Believed Bitcoin Would Hit $1M (Cointelegraph)
- Twitter Hacker Is a BitMEX Trader, On-Chain Data Suggests (Coindesk)
- These 3 signals show crypto could see a major reflation “on par” with 2017 (Cryptoslate)
- FTX Exchange, Not Coinbase, Has Been DeFi’s Greatest Proponent (Cryptobriefing)
- Why Is XRP Crashing? Data Shows Ripple Is Flooding the Market (Cryptobriefing)
- $1.6 billion was invested in institutional-focused crypto custody services: research (The Block)
- A closer look at Binance’s Q2 performance: spot volume is flat while futures are seeing growth (The Block)
- Elliptic says 22% of bitcoins from Twitter hack were likely sent to a Wasabi Wallet address for mixing (The Block)
_______________________________________________________________________
Technical analysis
_______________________________________________________________________
Bitcoin
The largest cryptocurrency by market capitalization spent the weekend slowly regaining its value after the drop to $9,000. The slow rise in price was stopped by an influx of buyers, which tried to bring the price above the $9,251 resistance level but failed to do so as the sheer volume was too low. Bitcoin is now consolidating at around the $9,200 level.
BTC traders should look for a trade opportunity in the range that is bound by the nearest support and resistance levels.
BTC/USD 4-hour Chart
Technical factors:
- Price is above its 50-period EMA and its 21-period EMA
- Price right below the top B.B.
- RSI is neutral (53.87)
- Lower than average volume
Key levels to the upside Key levels to the downside
1: $9,251 1: $9,120
2: $9,580 2: $8,980
3: $9,735 3: $8,820
Ethereum
While Ethereum accompanied Bitcoin on its slow path towards the upside, it did so with much lower volume and volatility. The most recent hours brought a sharp increase in price, which attempted to bring the price above $240, but the push was unsuccessful. Ethereum is now consolidating right below the $240 level.
Ethereum traders should look for an opportunity when Ethereum starts moving down, or when it reacts to the next support/resistance level.
ETH/USD 4-hour Chart
Technical Factors:
- Price is above the 50-period EMA and the 21-period EMA
- Price above the top B.B.
- RSI elevated (63.03)
- Average/slightly increased volume
Key levels to the upside Key levels to the downside
1: $240 1: $228
2: $251.4 2: $225.4
3: $260 3: $218
Ripple
The third-largest cryptocurrency by market cap moved along its range-bound upwards path towards $0.2. While the move got stopped at $0.2, XRP managed to gain some value over the course of the weekend. Volume remained stable throughout this slow increase, which is a great indicator.
XRP traders can look for an opportunity to trade when the currency breaks $0.2 with increased volume, or falls down towards $0.19 towards increased volume.
XRP/USD 4-hour Chart
Technical factors:
- XRP in a mid-term descending trend (though it broke the trend in the short-term)
- XRP lacks strong support levels below $0.178
- Price above 21-period and the 50-period EMA
- Price between the middle B.B. (20-period SMA) and the top B.B.
- RSI is neutral (55.26)
- Volume average
Key levels to the upside Key levels to the downside
1: $0.2 1: $0.19
2: $0.205 2: $0.178
3: $0.214
Related posts
 Daily Crypto Review, Feb 6 – Is this the Start of the Altcoin Season?
 Daily Crypto Review, Feb 7 – Bitcoin Futures over 10,000; US crypto regulators stalling
 Daily Crypto Review, Nov 2 – Ethereum’s Price Explodes; Bitcoin’s Whitepaper Celebrates its 12th Birthday
 Daily Crypto Review, Nov 6 – Bitcoin Zooming Past $15,000: How Far Can it Go Before Pulling Back?